Abstract
The motorcycle market has experienced an upward trend. That growth brings along mobility, accidents, and environment-related issues; nevertheless, there is a scarcity of literature on evaluating the impact of motorcycle market policies. Consequently, it has been challenging for researchers and policymakers to develop evidence-based strategies to promote or control the growth of this market. This paper aims to review and analyze the scientific literature about motorcycle market policies, using tech-mining techniques and a cluster analysis of keywords, to provide insights about the most relevant world trends in this research area. For this purpose, the bibliographic information of publications in the field was retrieved from the Scopus database. As a result, three thematic clusters (sustainability, mobility, and electric motorcycles) were identified and explained. According to our findings, greenhouse gas emissions, sustainability, environmental impact, and developing countries are the hot research topics. The research leader countries on said topics are the United States, Germany, and the United Kingdom. This study can, therefore, be used as a reference to define a future research agenda in the area. Consequently, it permits researchers and policymakers to identify trending topics and gaps in knowledge, as a baseline to include motorcycles in sustainable and affordable transport systems design.
1. Introduction
This paper describes the results of organizing, analyzing, hierarchizing, and categorizing 103 scientific research articles on policies for the motorcycle market using a methodology based on tech mining, analysis of keyword co-occurrences, and clustering. Our results provide a broad picture of this research area, which serves to determine its most relevant journals, countries, authors, and keywords, as well as their interactions. An analysis of keyword co-occurrences and the implementation of clustering techniques allowed us to identify three major emerging research themes based on the data we collected, as well as the topics of current interest in the field.
In many cities, urbanization has led to a rapid increase in the demand for mobility. Most of this new demand has been satisfied by the individual private transport industry, within which motorcycles have an important share: around 30% of the vehicles in the world are motorcycles [1].
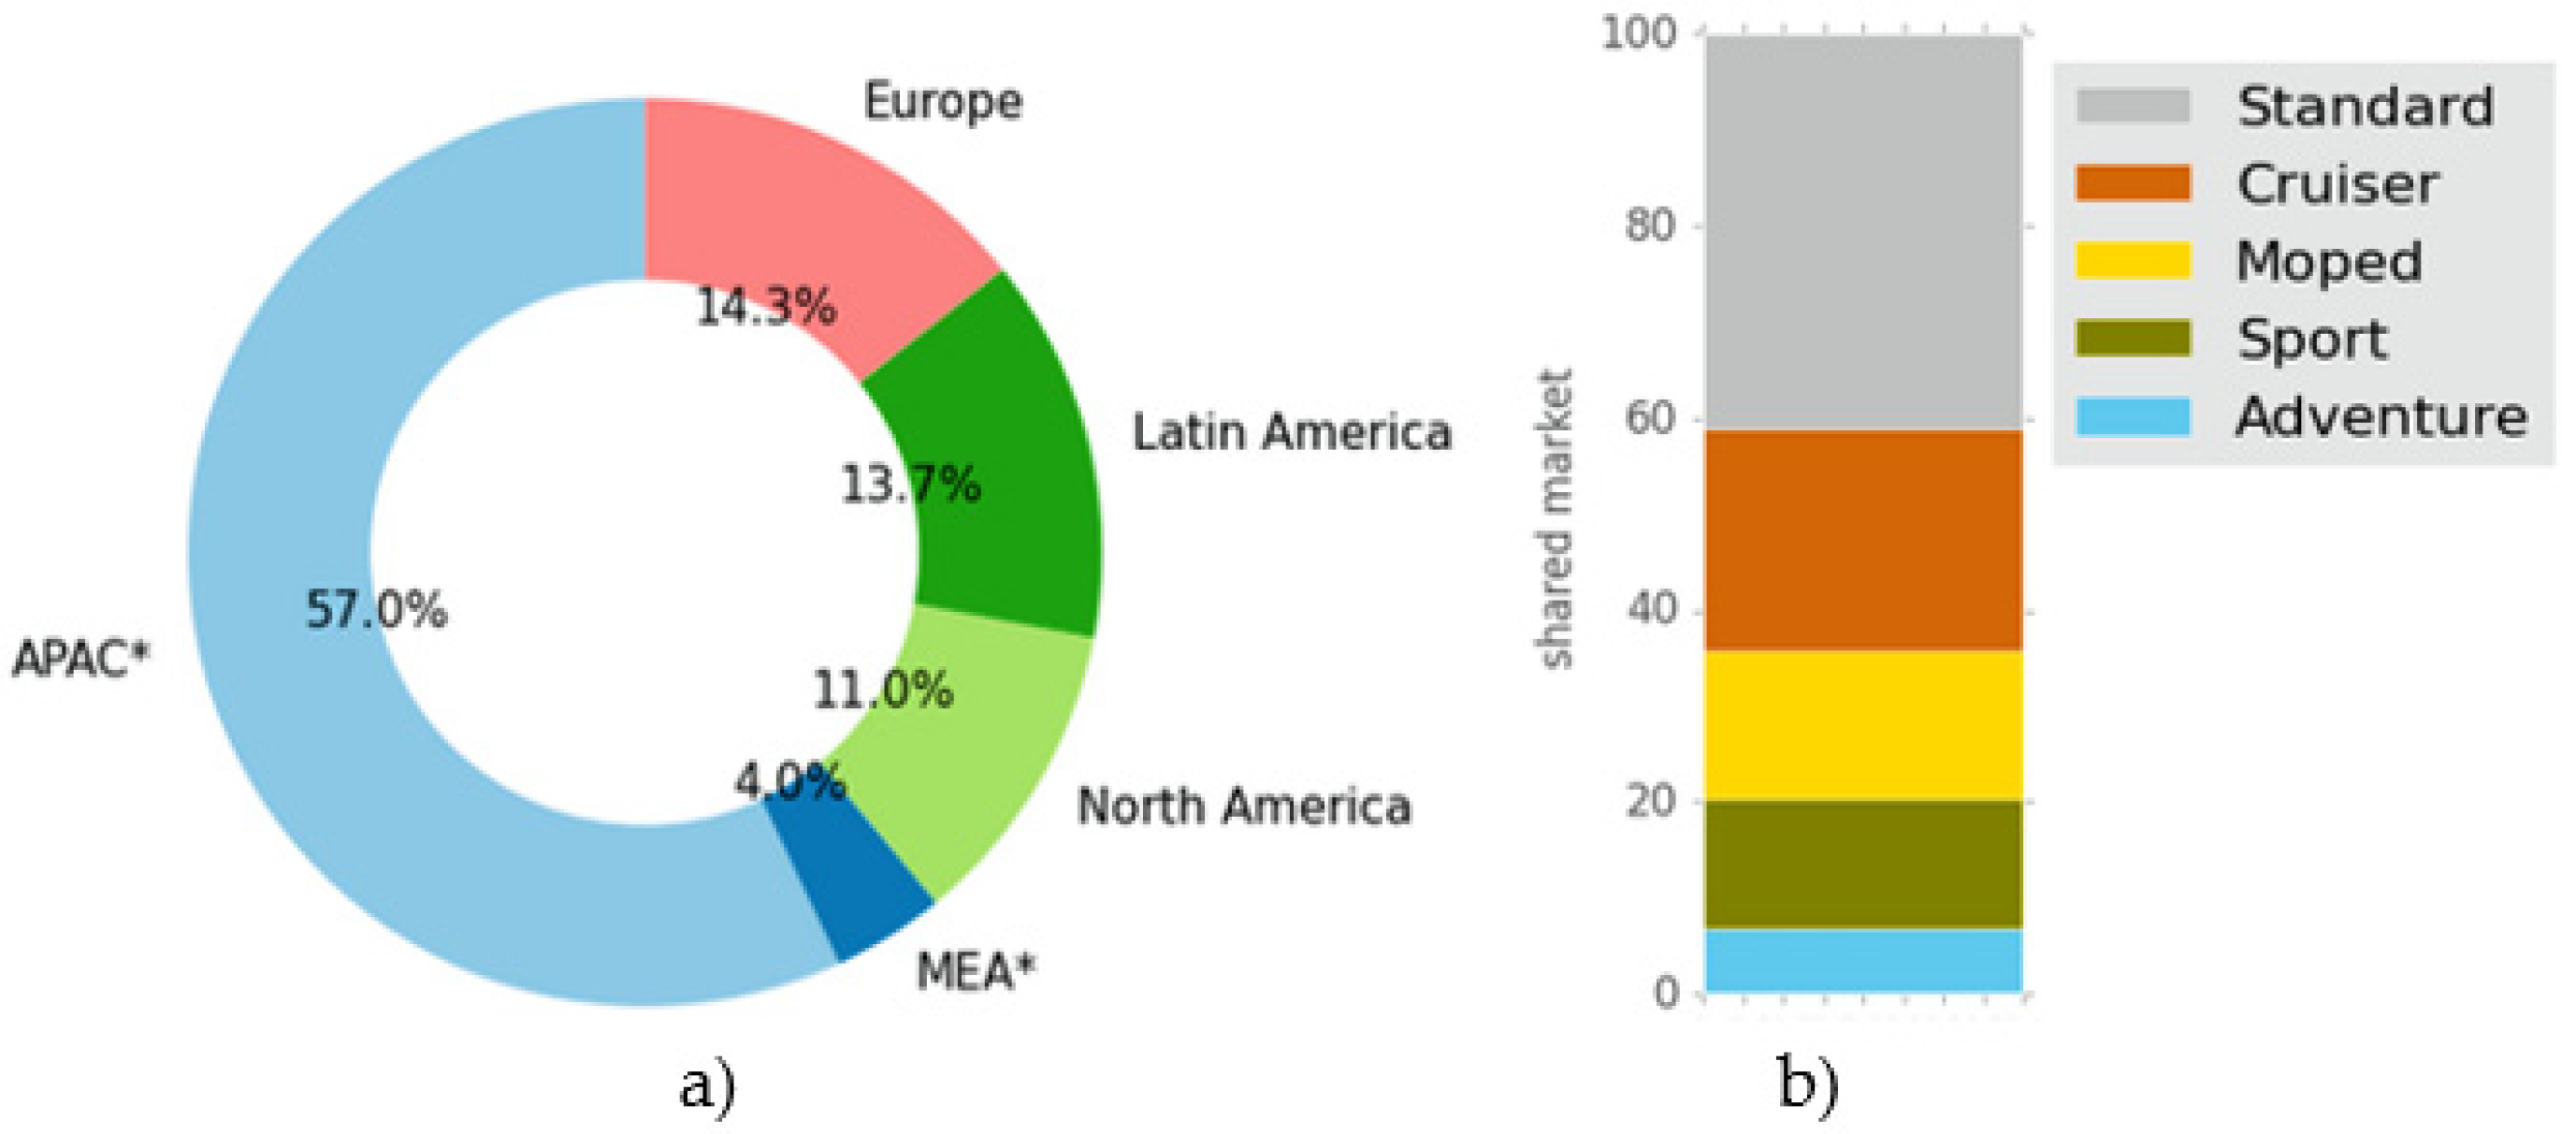
Motorcycles, also known as motorbikes or bikes, are two-wheelers primarily driven by an internal combustion engine. Nevertheless, nowadays, consumers are also opting for electric motorcycles. The global sales of motorcycles have been similar to those of cars since 2007, reaching 70 million units sold per year [2]. The global motorcycle market was estimated to be worth USD 115,720 Mn in 2018 [3]. Figure 1 presents the global motorcycle market share by region (left) and by motorcycle type (right) in 2020.
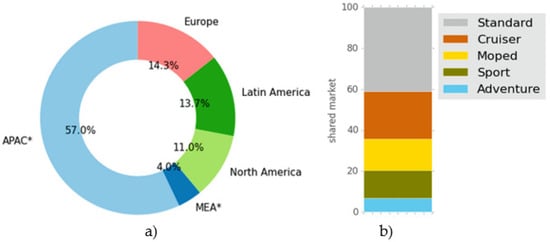
Figure 1.
(a) Global motorcycle market share by region. (b) Global motorcycle market share by type. * APAC: Asia-Pacific. MEA: Middle East and Africa. Data taken and adapted from [4].
Asia-Pacific is the region with the largest number of motorcycles in the world, accounting for a market share of 57%. In this region, 60% of the vehicles are motorcycles, and it reports the highest rate of motorcycles per inhabitant (with Taiwan as the leader: one motorcycle per every 1.6 people) [5]. Europe has the second largest market share: 14.3%.
The motorcycle market can also be segmented by motorcycle type. Standard motorcycles represent 40.1% of the value of the market; cruiser, moped, and sport are 23.3%, 15.3%, and 13.6%, respectively; and adventure is 6.8%.
Although the coronavirus disease of 2019 (COVID-19) pandemic had a negative impact on the global motorcycle industry (revenue in the motorcycle market is projected to reach USD 108,833 Mn in 2020), the motorcycle market is anticipated to expand 1.1 times in terms of value during the 2020–2030 period after the resumption of operations. This means that this market is poised to grow at a Compound Annual Growth Rate (CAGR) of 3.6% [4].
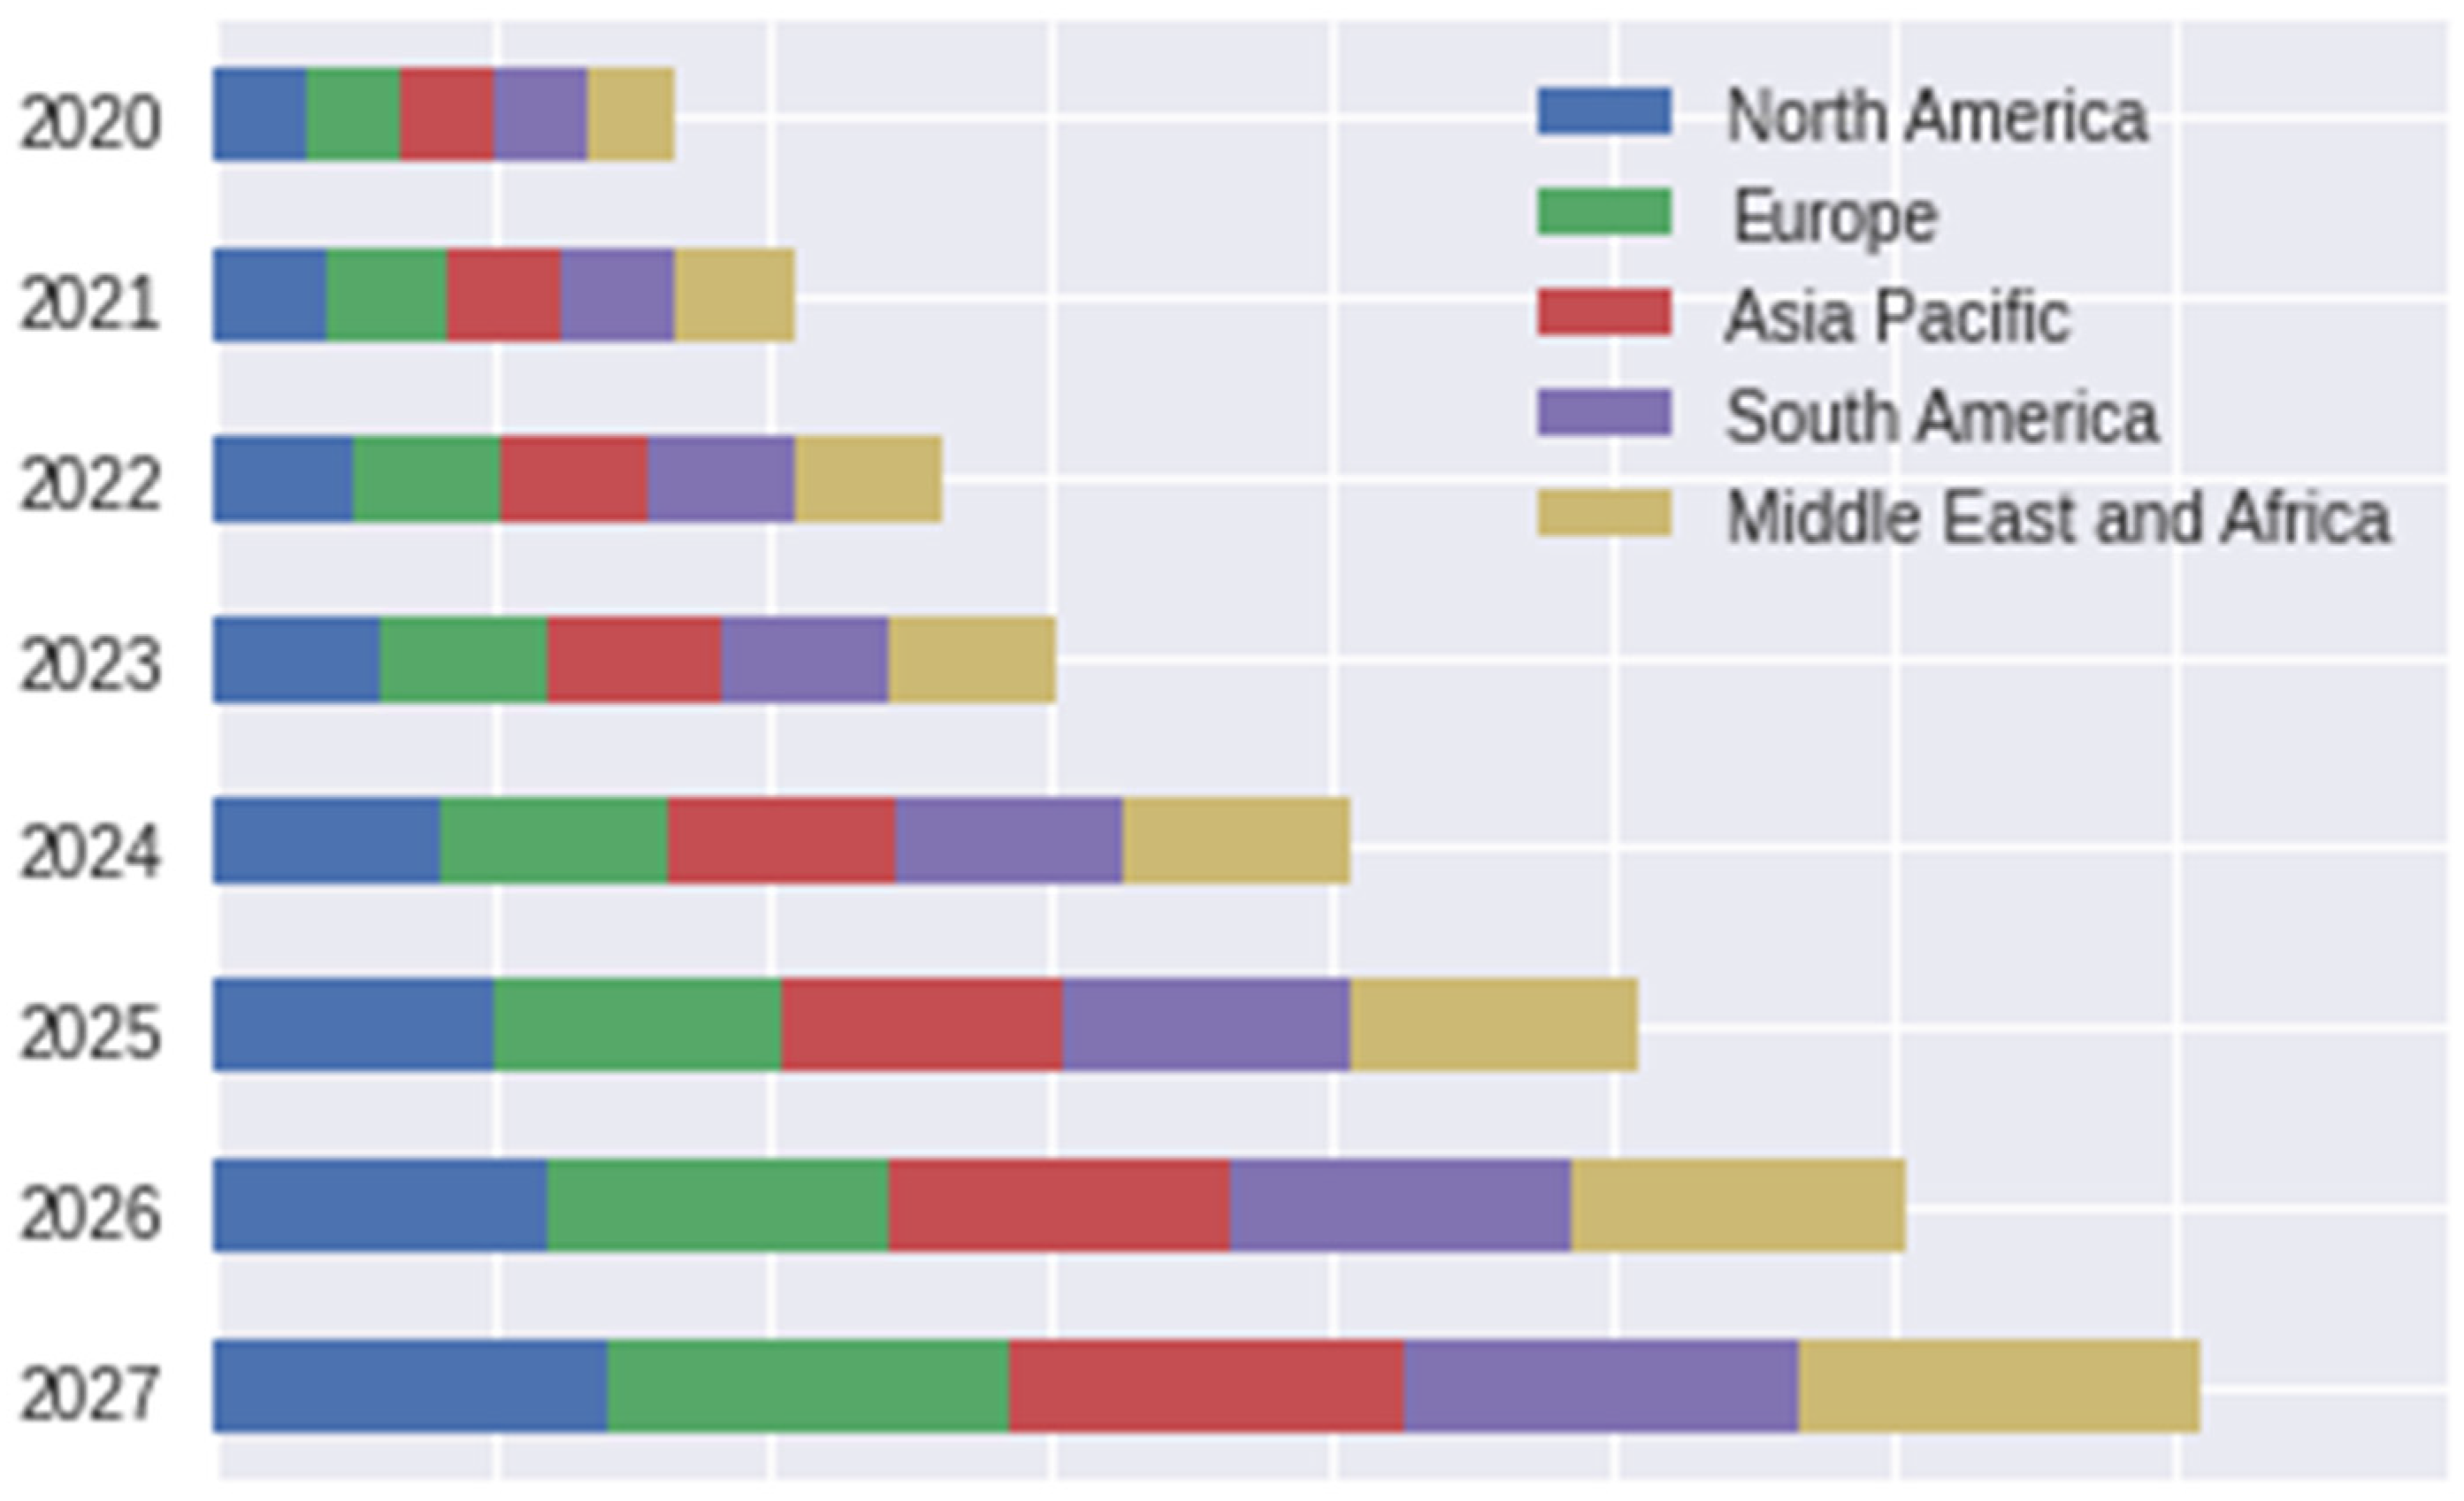
The current global market is dominated by internal combustion engine motorcycles. However, growing consumer awareness of climate change, a rising population (resulting in traffic congestion in several countries), the low maintenance cost of electric mobility technology, and tax incentives for environmentally friendly vehicles are boosting the sales of electric motorcycles. In 2020, 861 thousand electric units were sold worldwide [6]. Although it can be considered a low number (because it represents less than 1.5% of the sales of all kinds of motorcycles during the same year [7]), the electric motorcycle market is expected to grow at a CAGR between 7.4% [8] and 31.8% [6] from 2020 to 2027. Figure 2 presents a forecast of the global electric motorcycle market by region for the 2020–2027 period. The market size is similar in all the regions, which can be due to the small size of the current market and makes granular forecasting a hard task.
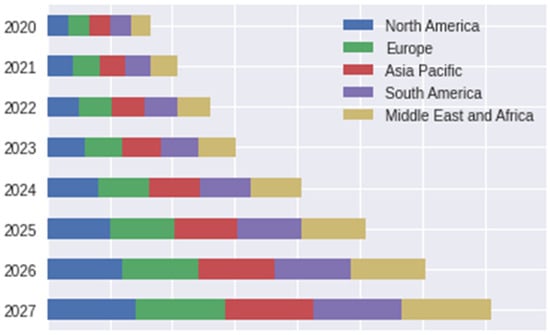
Figure 2.
Forecast for global electric motorcycle market. Data taken from [8].
The growth of the motorcycle industry has been driven by the increasing middle-class population worldwide, which, in turn, has led to a higher demand for affordable means of transport [5,9]. These two-wheelers are a low-cost and versatile mobility alternative when compared to the costs and deficiencies of the public transport systems in terms of coverage, frequency, and comfort [3].
Motorcycles have been studied from different perspectives. For instance, some authors have investigated the factors that influence the purchase of these two-wheelers in recent years [5,10,11,12,13,14,15,16,17,18,19,20]. Likewise, the literature in this field has reported some environmental concerns regarding their use. From certain points of view, motorcycles are more sustainable than cars mainly because they require less parking space and fewer financial resources and pollute less than conventional cars with low occupancy [21].
Motorcycle-dominated cities are reported to have a more stable traffic flow and higher road capacity utilization compared to those with an equal number of four- and two-wheelers [5]. However, motorized personal mobility vehicles produce several harmful effects on the environment due to the predominant use of fossil fuels and the dependence on oil [22]. The transport sector is estimated to account for 24% of direct CO2 emissions from fuel combustion [23]. Motorcycles are thus often ignored in the new discourses on sustainable mobility, as they are regarded as undesirable for reasons of pollution, noise, road safety, and driving behavior [24]. Motorcycle drivers and riders have more accidents than car passengers. According to Cordellieri et al. [25], this is because motorcyclists are more prone to violate traffic rules than car drivers. Furthermore, they are less concerned about the risk of a road crash. As a result of their riskier riding behavior, the probability of accidents increases [26,27,28]. In other studies [29], it has been concluded that there is a strong relationship between driving violation behaviors and risk perception as predictors of motorbike crashes. Risk factors such as age and gender are also of interest for researchers. Several pieces of research [30,31,32] have concluded that the crashes and fatalities suffered by male motorcyclists are higher and more severe than those of women, with the young drivers prone to have more accidents. Overall, research on causality and the severity of traffic accidents holds a dominant position in research trends about motorcycle accidents [33].
Some studies have included the motorcycle industry in the analysis of other related problems (mainly environmental ones). For example, Hsieh et al. [34] explored the changes in air pollution in Taiwan similarly to how Trappey et al. did [35]. Peraphan et al. [21] found that the use of motorcycles can affect the sustainable development of territories unless parking policies are implemented, which is in line with the results of Cheng et al. [36]. In many countries, sidewalks are used as parking lots by motorcyclists, violating parking controls and affecting pedestrian flows [37]. According to Thanh et al. [38], this occurs mainly in business districts due to the size of motorcycles, parking prices, and walking distance from public transportation.
From a decision-making perspective, Yang and Chen [39] modeled users’ choice of a means of transport taking into account its cost, travel time, and comfort. A new type of transport is ridesharing. Motorcycle ridesharing has emerged in recent years as a way to contribute to more sustainability mobility, especially using electric vehicles. Boken et al. [40] concluded that, as a sustainable solution, ridesharing is a complement rather than a replacement for existing private car use. This is consistent with the results of Ampudia-Renuncio et al. [41] regarding electric free-floating car sharing, who found that most trips occur in high-income and low-population density areas, where there is enough on-street parking available and connectivity to public transport. Other studies [42,43] also emphasize the role of millennials in ridesharing growth, identifying young men with high education levels, high income, and access to smartphones as the target market.
Despite the research described above, it is rare to find papers that evaluate policies specifically designed for the motorcycle market in order to either promote or halt its development. Thus, since the advances reported in the literature in this regard are unknown, policymakers and researchers have found it difficult to propose strategies to guide this market. As several authors [24,44,45] have pointed out, motorcycles are often ignored in discussions because of their undesirable negative impacts on pollution, road security, and driving behavior. To cover this research gap and taking into account that previous literature reviews in this regard were not found, the current study has been conducted. The purpose of this paper is to organize, hierarchize, analyze, and categorize the scientific production on policies designed for the motorcycle market. In this manner, it allows one to obtain a broader picture of this research field. In particular, this new systematic review aims to answer the following research questions:
- What has been the evolution over time of the number of publications in this field?
- What are the most important publication sources in this field?
- Who are the main authors in the area, and how are they connected to each other?
- What countries have published most studies in this field?
- What are the main topics addressed in this area?
We used an empirical research methodology to answer these questions, based on evidence from the peer-reviewed scientific literature and following the Preferred Reporting Items for Systematic Reviews and Meta-Analysis (PRISMA) guidelines [46]. Additionally, we propose a classification of publications in this field into thematic clusters and identify consolidated, emerging, and declining topics in the area, according to the results from out statistical cluster analysis.
By answering the research questions mentioned above, this study seeks to contribute to a better understanding of individual transport and the motorcycle market using techniques of technology watch, bibliometrics, and analysis of keyword co-occurrences as mechanisms to identify their underlying topics.
The rest of this paper is organized as follows: Section 2 describes the methodology we employed, which consists of three stages (information retrieval, data cleaning, and analysis); Section 3 presents the results in such an order that helps us address the research questions posed in this study; and finally, Section 4 draws the conclusions.
2. Materials and Methods
We used primary data gathered from databases of the peer-reviewed scientific literature to answer the questions pointed out in the Introduction section, contributing to filling the research gap about the analysis of policies for motorcycle markets. Such a primary data type turns our investigation into a bibliometric study, which is an empirical research method by nature [47,48,49]. In this sense, our research starts with five research questions, and it is divided into three stages: data collection, data preprocessing (automatic and manual), and data analysis [50], as it is presented in Figure 3.

Figure 3.
Methodology adopted in this study.
During the data collection stage, we designed the search for the systematic literature review. The search string was specified for the scientific database selected, the fields the search were restricted to, and other parameters that can facilitate the reproducibility of this document collection process. In this stage, we also gathered information about the selected documents.
The goal of the data processing stage was to extract and clean the text strings (which, for instance, could be different in the use of accents). Finally, during the analysis stage, we used figures and tables to explore the data and highlight current trends and future research directions. The analysis was performed through a conceptual framework with logically grouped factors [51] and the application of the most common bibliometric indicators for the selected publications.
Information was processed, cleaned, and graphed using Techminer [52]. It is an open source to perform bibliometric analyses (distributed under the MIT license) and friendly-user package developed and tested in Python version 3.6, which is available on repository from Github, Inc. Techminer runs on top of Jupyter Lab and Google Colaboratory with its own graphical user interfase. Both authors participated in the three stages of the systematic review. Stages are detailed in the following subsections.
2.1. Data Collection
To find articles focused on policies designed for the motorcycle market, we carried out search of the literature in Scopus database. This is one of the largest databases of peer-reviewed scientific information [53], which is highly valued and widely used in other bibliometric studies [54,55,56,57,58,59,60,61], because it covers a comprehensive range of fields, such as science, technology, medicine, social science, and arts and humanities. Furthermore, several operating functions in Scopus facilitate bibliometric analyses [56]. The data collection for the systematic review of the published literature was conducted by taking into consideration (i) articles written in English; (ii) specific search terms coverage (according to Equation (1)); and (iii) document type (research articles, conference proceedings, and reviews).
The following is the search equation we used in this study:
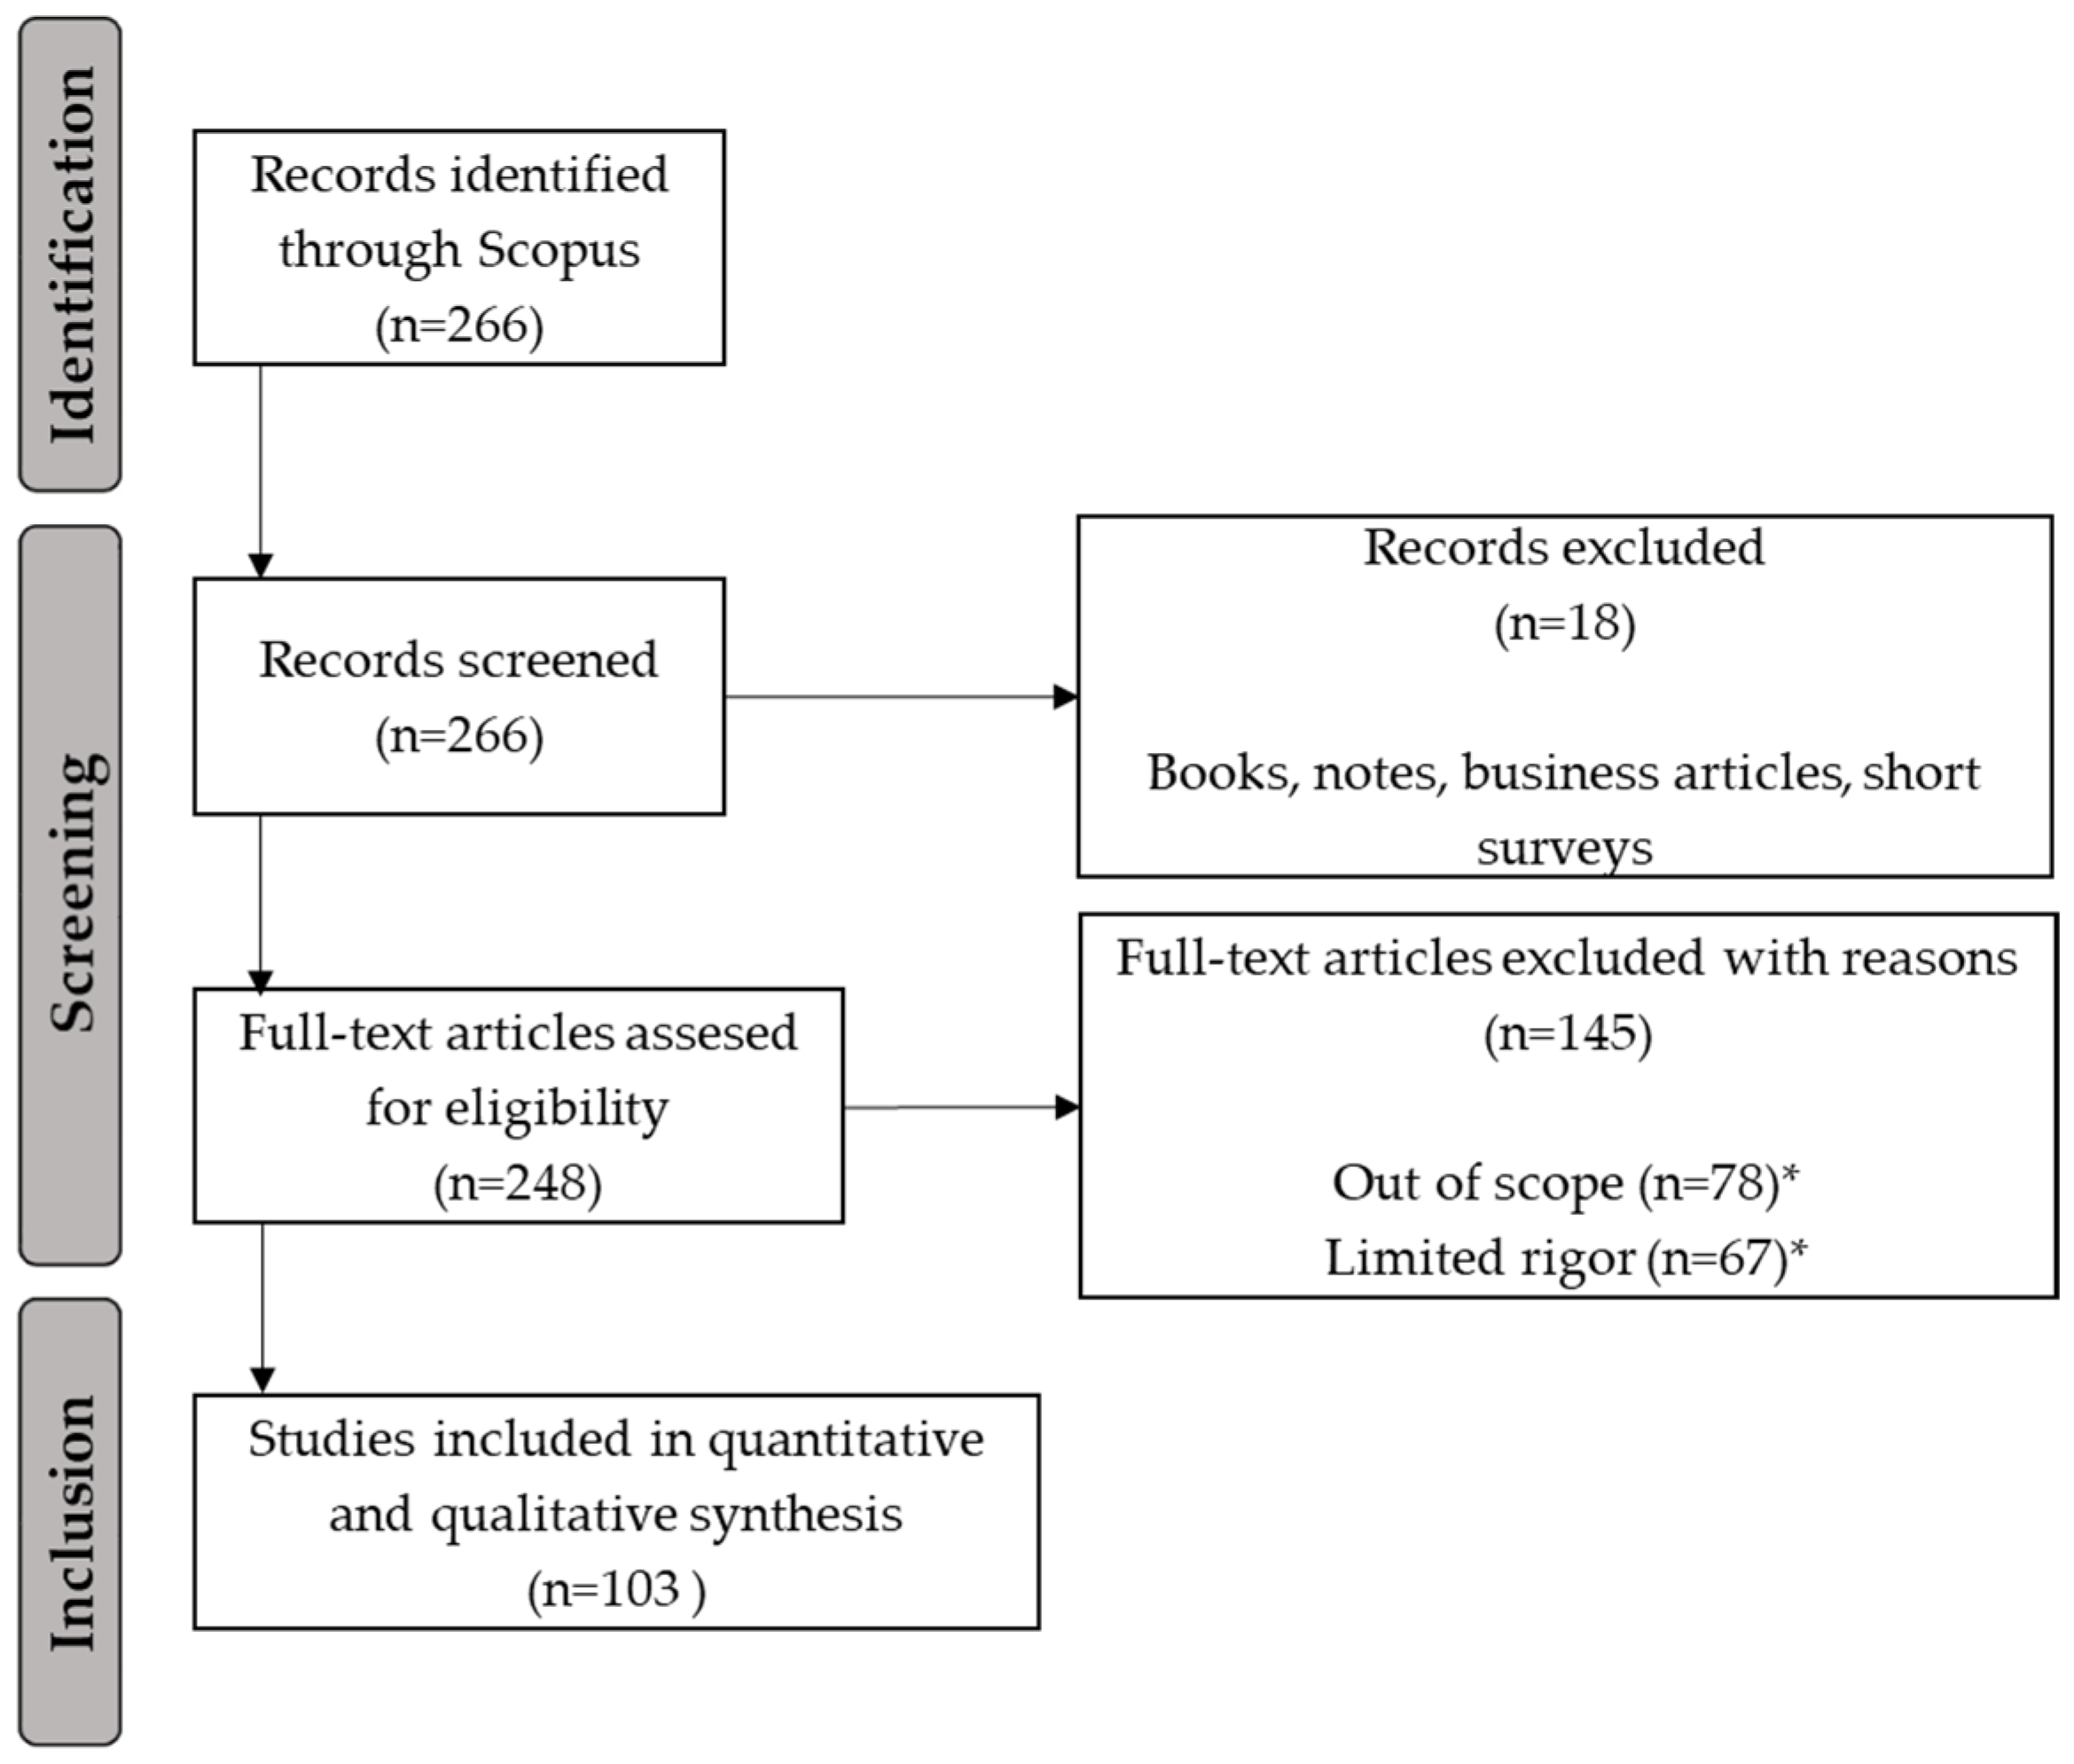
We obtained this string through an iterative process by narrowing down the keywords and analyzing the retrieved documents. We included articles published up to the year 2020 and did not restrict the search by area of knowledge. This equation retrieved a total of 266 documents. After the screening process by reading the title and abstract, we excluded 18 documents coming from books, notes, business articles, and shorts surveys. From the 248 remaining documents, we excluded 78 documents for being out of scope (not related to cities (n = 47), not related to transport or mobility (n = 31)), and 67 for not providing enough details or having a limited rigor (missing key sections or key elements in methodology or results sections). At the end, a set of 103 full-text articles remained, based on the selection criteria. Figure 4 describes the search and screening results according to the PRISMA statement.
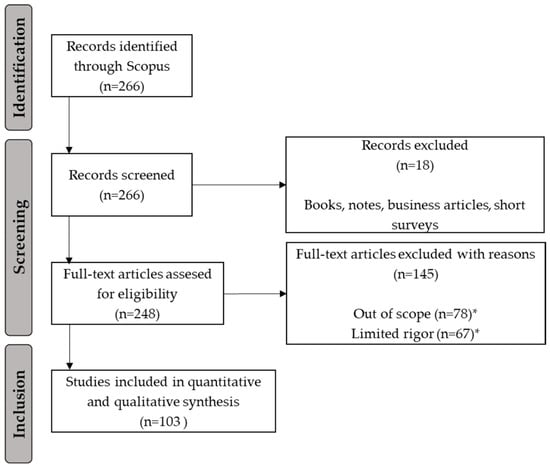
Figure 4.
PRISMA flow diagram with results of studies selection. * Out of the scope: not related to cities (n = 47), not related to transport or mobility (n = 31). Limited rigor: missing key sections or key elements in methodology or results sections.
Finally, as a starting point for the analysis, we retrieved the following information from the 103 articles:
- Authors
- Author affiliations
- Name of journal or conference proceedings
- Document title
- Author keywords and index keywords
- Abstract
- Times cited
2.2. Data Processing
The information we collected about those 103 documents was processed following the steps below.
- Removing accents: in order to prevent the loss of information, it was necessary to remove accents in the key fields of the collected documents. For example, this paper title: “Confronting congestion in urban areas: Developing Sustainable Mobility Plans for public and private organizations in Bogotá” was transformed into “Confronting congestion in urban areas: Developing Sustainable Mobility Plans for public and private organizations in Bogota”, to prevent that the word “Bogotá” from being understood by the algorithm as a different word than “Bogota”.
- Disambiguating author names based on Scopus Author ID: since some authors have similar names or their names can appear differently in various publications, the algorithm could understand that they are the same author. To prevent this, it is necessary to label each author according the unique Scopus Author ID, which distinguishes among similar names by assigning each author in Scopus a unique number and grouping all of the documents written by that author [62]. For example, authors “Lorena Cadavid” and “Laura Cadavid” are labeled as “Cadavid, L.” by Scopus, but they are actually two separate authors with different Author IDs.
- Extracting countries and institutions from the affiliation field: countries and institutions are imbibed into the full affiliation field, which includes other information not relevant for this research (such as department of the university and address). Thus, it is necessary to identify and extract the countries and institutions’ information from the full affiliation field.
- Changing all the text to lowercase: this prevents the algorithm from labeling two identical words as different because of the capital letters. For example, “Motorcycle” word is not different from “motorcycle” for the purpose of this research; changing the former to “motorcycle” solves the problem.
- Removing (and substituting where convenient) the <NA> chain: the <NA> chain is present, for example, in the title: “Transport policy evaluation based on elasticity analysis with social interactions”. However, the <NA> chain is also used to detect missing values in Python [63], the programming language used for the bibliometric algorithm. Thus, it is necessary to remove and substitute, wherever convenient, the <NA> chain from the key field of the recovered documents.
- Automatically cleaning and homogenizing author keywords and index keywords: the cleaning and homogenization process includes removing apostrophes, colon, parentheses, dashes and hyphens (such as in “Micro-mobility” and “Micro mobility”), slashes and backslashes, and other special characters in the author keywords and index keywords, in order to prevent the algorithm from labeling them as single words and from labeling identical words as different (and vice versa).
Moreover, we performed a manual cleaning of keywords to exclude expressions used in the search equation and include nonobvious groups of terms in the field. For example, since “electric scooter” expression is grammatically different from “e-scooter”, but they are the same concept for the purposes of this research, and it is necessary to perform a manual grouping of these two terms. In addition, we excluded expressions such as “market share” or “market forecast”, since they are included in the search equation; therefore, they not only provided not relevant information for the bibliometric analysis but could even distort some results (as grouping and trends).
2.3. Data Analysis
For the bibliometric analysis, we calculated productivity and impact measures for authors, journals, and countries. The bibliometric indicators used in this study include:
- -
- h-index [64] measures productivity and impact of authors and journals (which allows one to also rank them). It is defined as the maximum value of h such that the given author/journal/country has published at least h papers that have each been cited at least h times.
- -
- The g-index is another measure of productivity and impact of authors and journals, which allows citations from higher-cited papers to be used to bolster lower-cited papers in meeting the “quality” citations threshold [65]. The g-index is the unique largest number such that the top g articles received together at least g2 citations, given a set of articles ranked in decreasing order of the number of citations that they received.
- -
- m-quotient is another measure of productivity and impact of authors and journals to facilitate comparisons between academics with different lengths of academic careers [64]. It is calculated as the division of the h-index by the number of years the academic has been active (measured as the number of years since the first published paper).
- -
- Bradford’s law [66] (or Pareto distribution) classifies the importance of a source into a research field. This law proposes to divide the information sources into three groups that cover a third of the articles published in a research field. According to it, the number of sources in each group follows a proportion of 1:n:n2. The sources in the first group are considered central for an area.
- -
- Lotka’s productivity [67] is one of the special applications of Zipf’s law [68]. It describes the frequency of publication by authors in any given field and states that as the number of articles published increases, authors producing that many publications do so less frequently. Thus, it is useful to measure the concentration of the author’s productivity.
- -
- Average Growth Rate (AGR) [69] is used to identify the trending and declining topics in the field of the main keywords. It is calculated as the average difference between the number of documents published in one year and the number of documents published in the previous year during a given period of analysis. It can take positive values (indicating that the number of publications on the topic has grown in recent years) or negative ones (indicating that the number of publications on the topic has declined in recent years).
- -
- We also used Louvain’s algorithm [70] to extract communities from the network of authors. This algorithm detects small communities at the beginning of the heuristic, and then each small community is grouped into one node before it repeats the first step.
In order to identify the consolidated, emerging, or declining topics in the area, we carried out a statistical cluster analysis. To encourage replicability of our results, we provide some details: clusters of keywords were selected by application of a Multidimensional Scaling Method (MDS) [71], using normalization by the association of the Euclidian distance between paired words. We applied K-means reduction technique [72,73] to identify those clusters and Ward’s minimum variance method [74] for the hierarchical analysis.
3. Results
After the data analysis stage, we found that is possible to contribute to the few existing studies about motorcycle market policies and insights to stablish a baseline for future research, and policymakers’ orientation are presented in the following five subsections.
3.1. Evolution of the Number of Publications over Time
The data collection stage resulted in a total of 103 documents published in 79 different sources between 1996 and 2020, which have been written by 273 authors affiliated with 147 institutions in 40 countries. There were 14 (13.6%) single-authored articles, while the remaining papers were written by an average of 2.7 authors per document. This means that, on average, there were 0.38 manuscripts per author. A total of 73 documents included author keywords; and 78, index keywords.
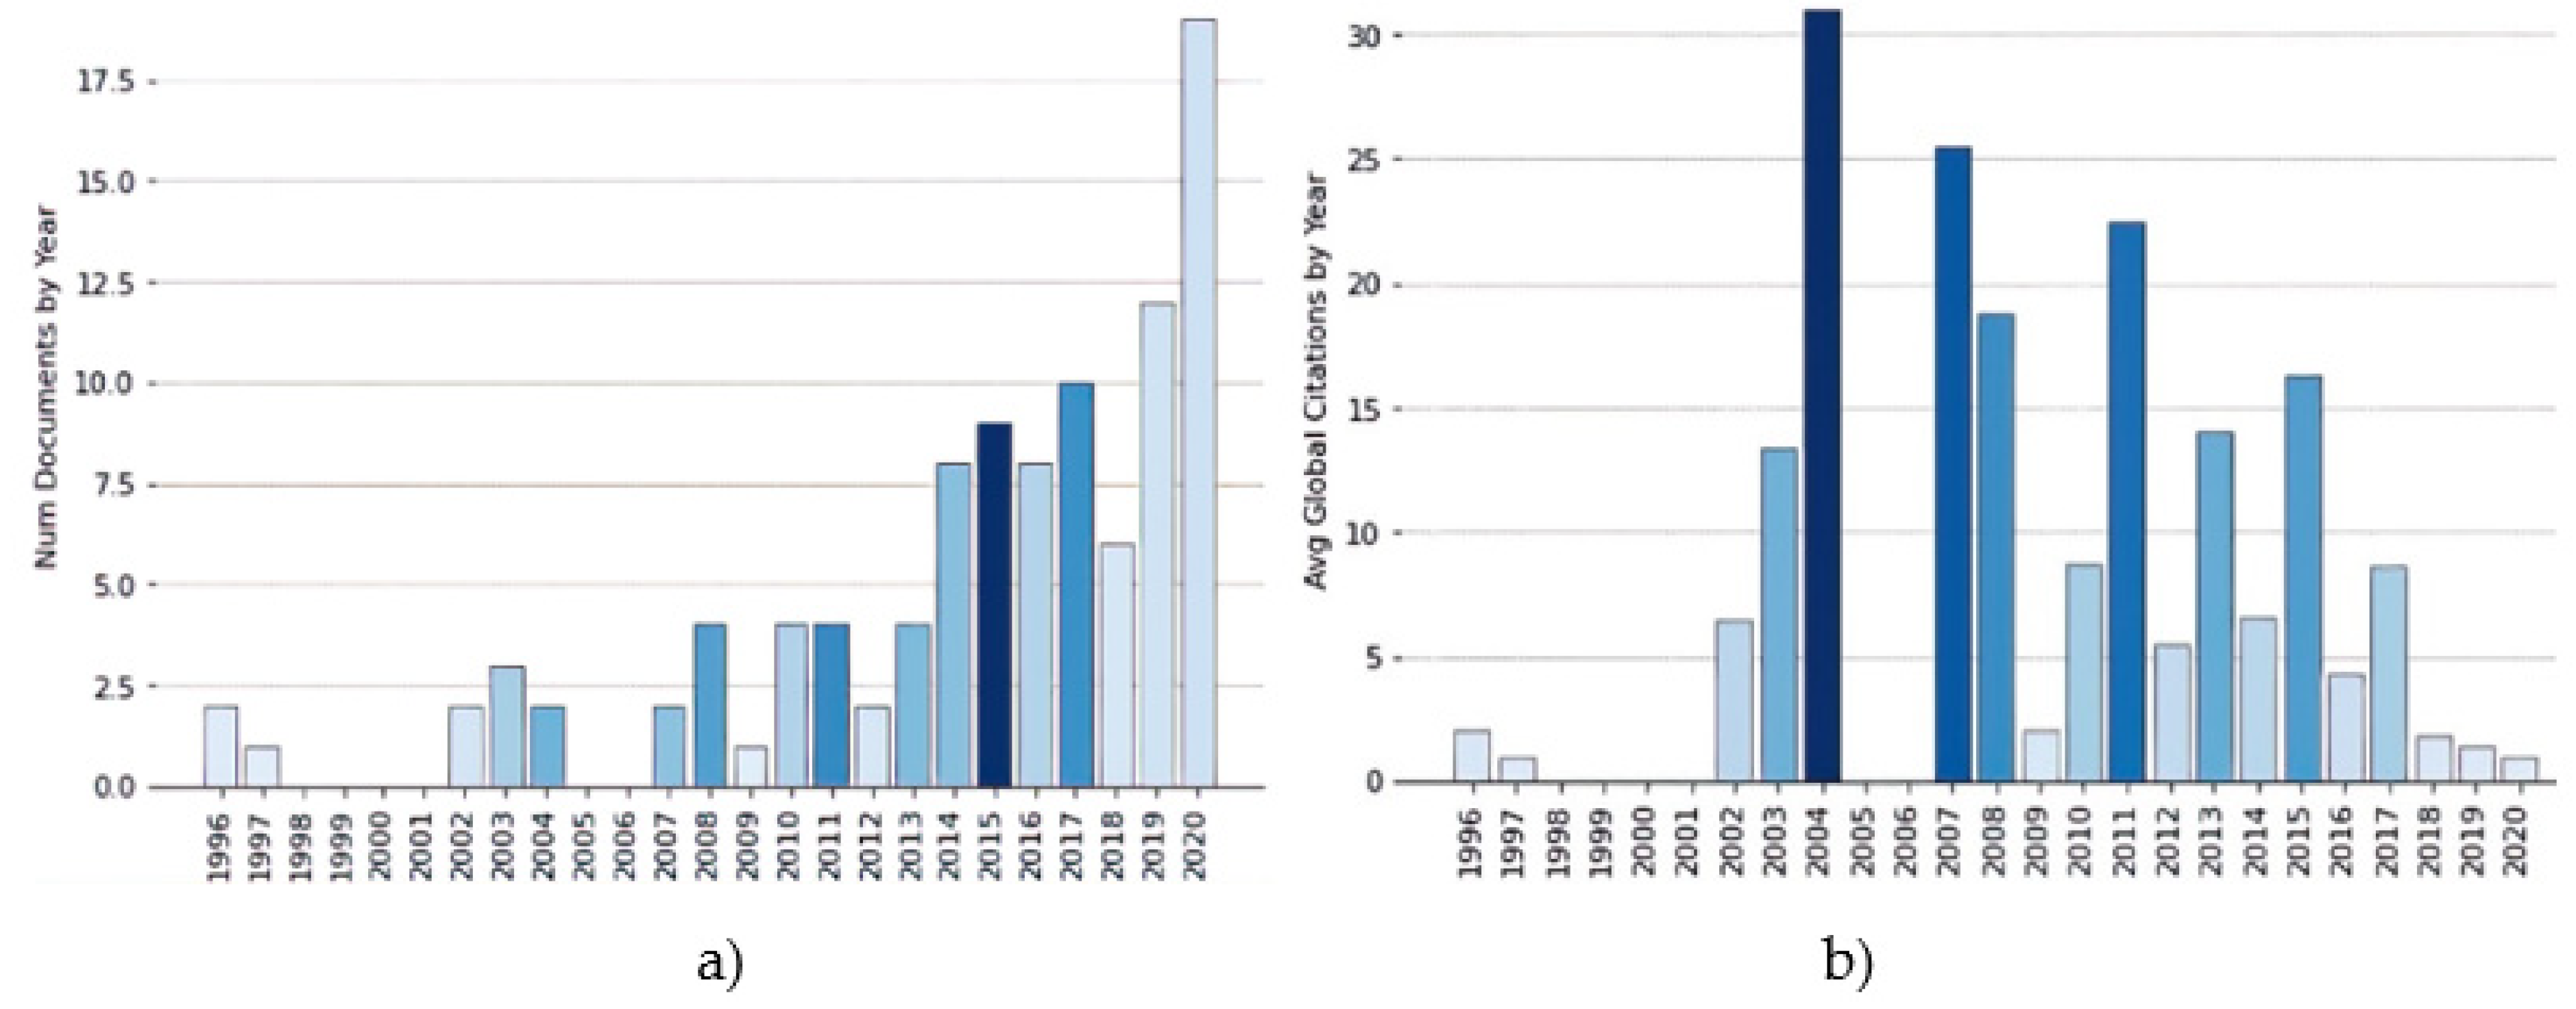
Figure 5 shows the number of articles published each year (left) and the average number of citations of the documents published every year (right).
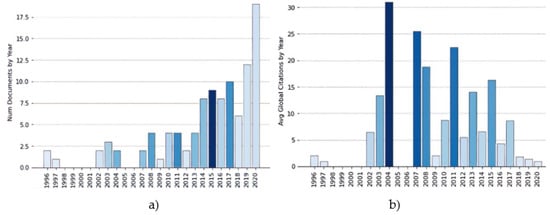
Figure 5.
(a) Number of articles published each year and (b) average number of citations per year. The darker the color, the higher the total number of citations of the papers published in those years.
As observed in the figure, there has been a rapid growth of publications, which indicates an increasing interest in this topic. The growth rate of the publications was 120% in the last five years (on average, 17.1% per year). The years 2004, 2007, and 2011 present the highest average number of citations, which suggests that articles of relevance to this research field were published in those years. Table 1 lists the ten most cited documents, which account for the years with the highest number of citations according to Figure 5.

Table 1.
Most cited publications.
3.2. Top Sources
The selected documents were published in 79 outlets (journals and conference proceedings). The productivity index of the journals is 16, which means that 20.3% of the sources published 38.8% of the scholarly production, which evidences a low concentration of knowledge in the sources. Likewise, the journal transience index is 63, which means that 79.8% of the sources published a single paper.
We also found that 12 sources (16.2% of the total) are in the first Bradford group and published 34 (33%) of the items.
Table 2 lists the journals with two or more published papers and their impact indicators. Transportation Research Record, Transportation Research Part D: Transport and Environment, MATEC Web of Conferences, and Transportation Research Part A: Policy and Practice are the journals with the highest number of publications (15.5% of the total articles). The Transportation Research Record journal presents the highest h-index (3), while the other sources have an h-index between 1 and 2. Atmospheric Environment, Accident Analysis and Prevention, and Renewable and Sustainable Energy Reviews are also relevant in the field given the number of total citations per year and document, which are even higher than those of some journals with a higher number of documents published in the field.

Table 2.
Main sources and their impact indicators.
The relevance of the sources varies depends on the indicator used to measure it. The h- of the journals is between 1 and 2, and its behavior is similar to that of the g-index for source ranking. However, when considering the m-quotient (i.e., the age of the journal) [83], Transportation Research Procedia, Transportation Research Part D: Transport and Environment, and Case Studies on Transport Policy become the most relevant in the field, as they are young journals with a high h-index.
3.3. Top Authors and Interactions between Them
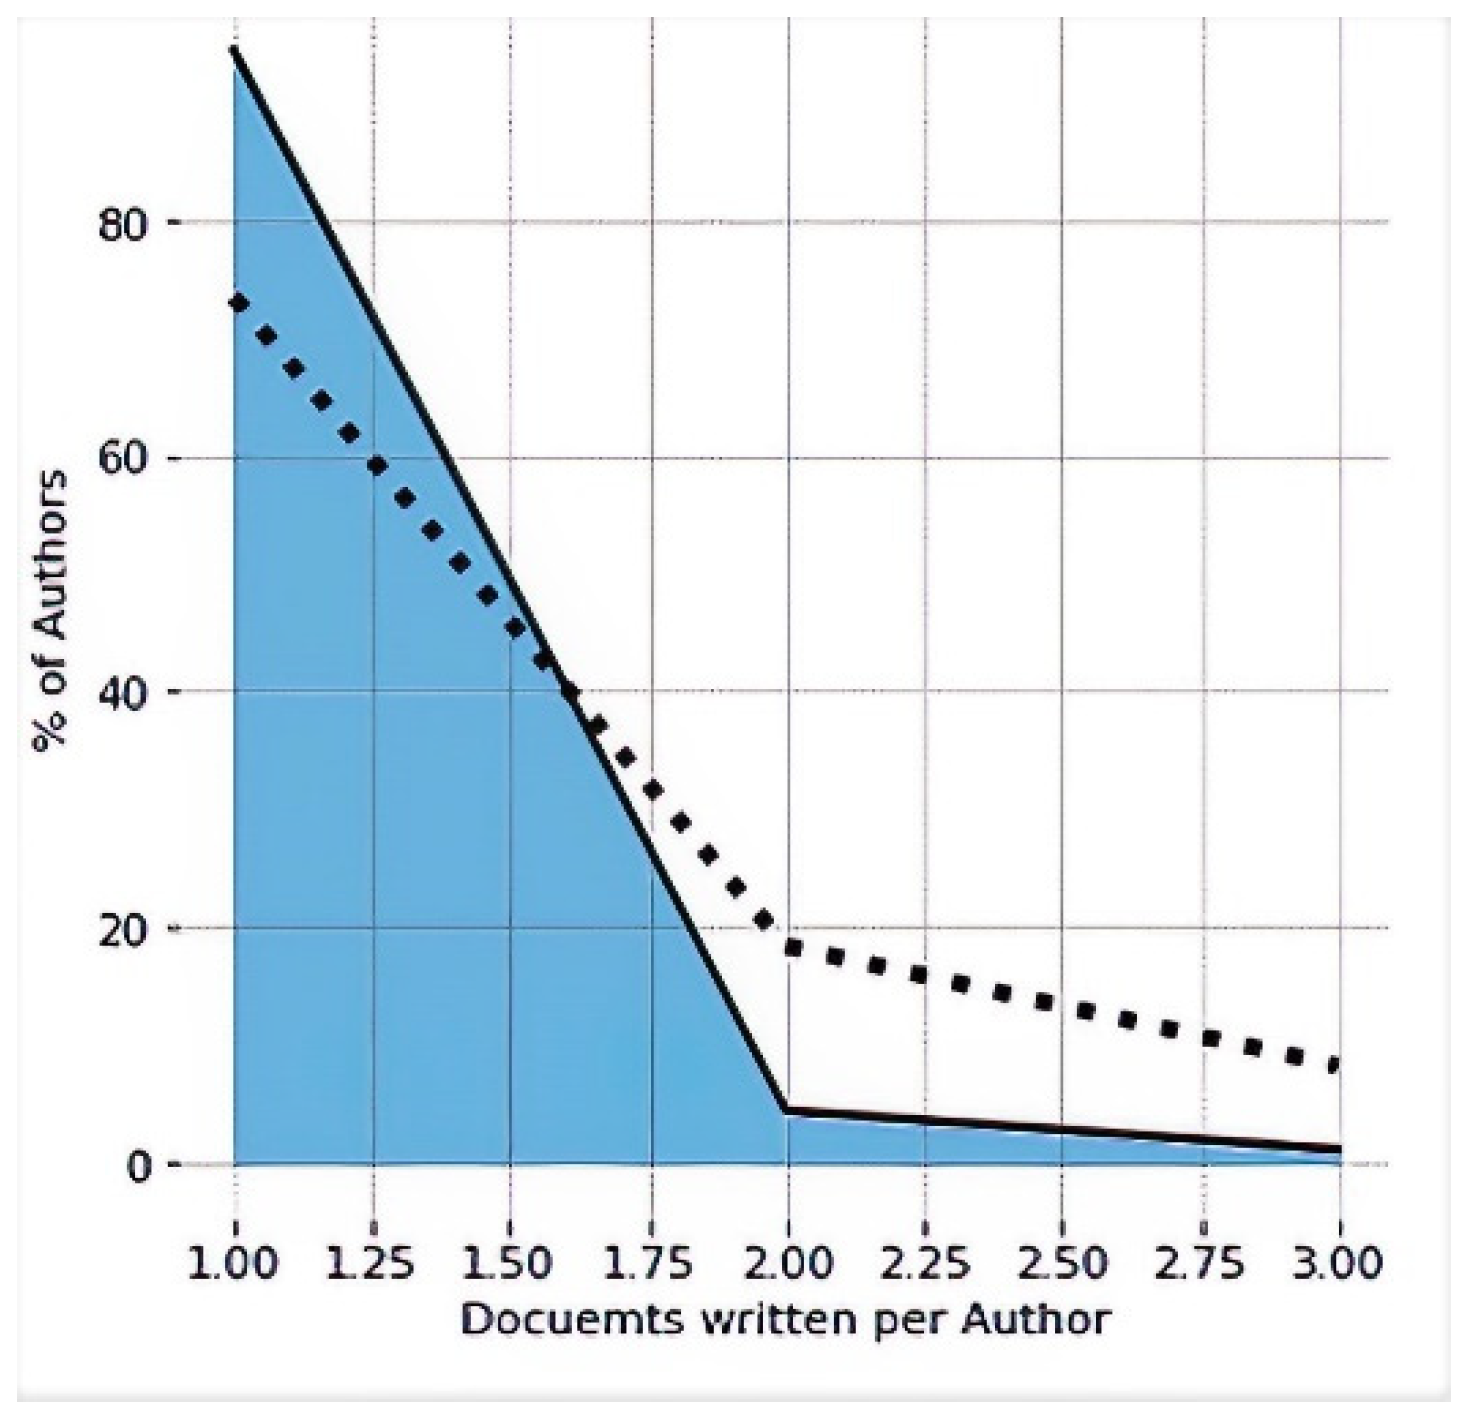
In total, 273 authors have participated in articles in the field. The author productivity index is 15, which means that 5.5% of the authors have published 14.9% of the scholarly production. Likewise, the author transience index is 258, which means that 94.5% of the authors have published a single paper. This concentration indicates that the distribution of publications among authors follows Lotka’s law [67] (as shown in Figure 6); according to which, few authors have contributed with a high number of publications; and many, with a few.
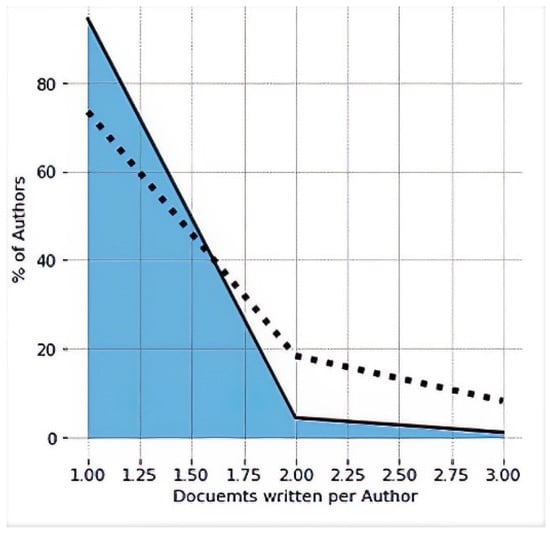
Figure 6.
Percentage of authors with respect to the number of papers they have published.
Table 3 lists the main authors in the field in terms of the total number of times cited (61 citations or more), as well as their impact indicators.

Table 3.
Top authors in the field.
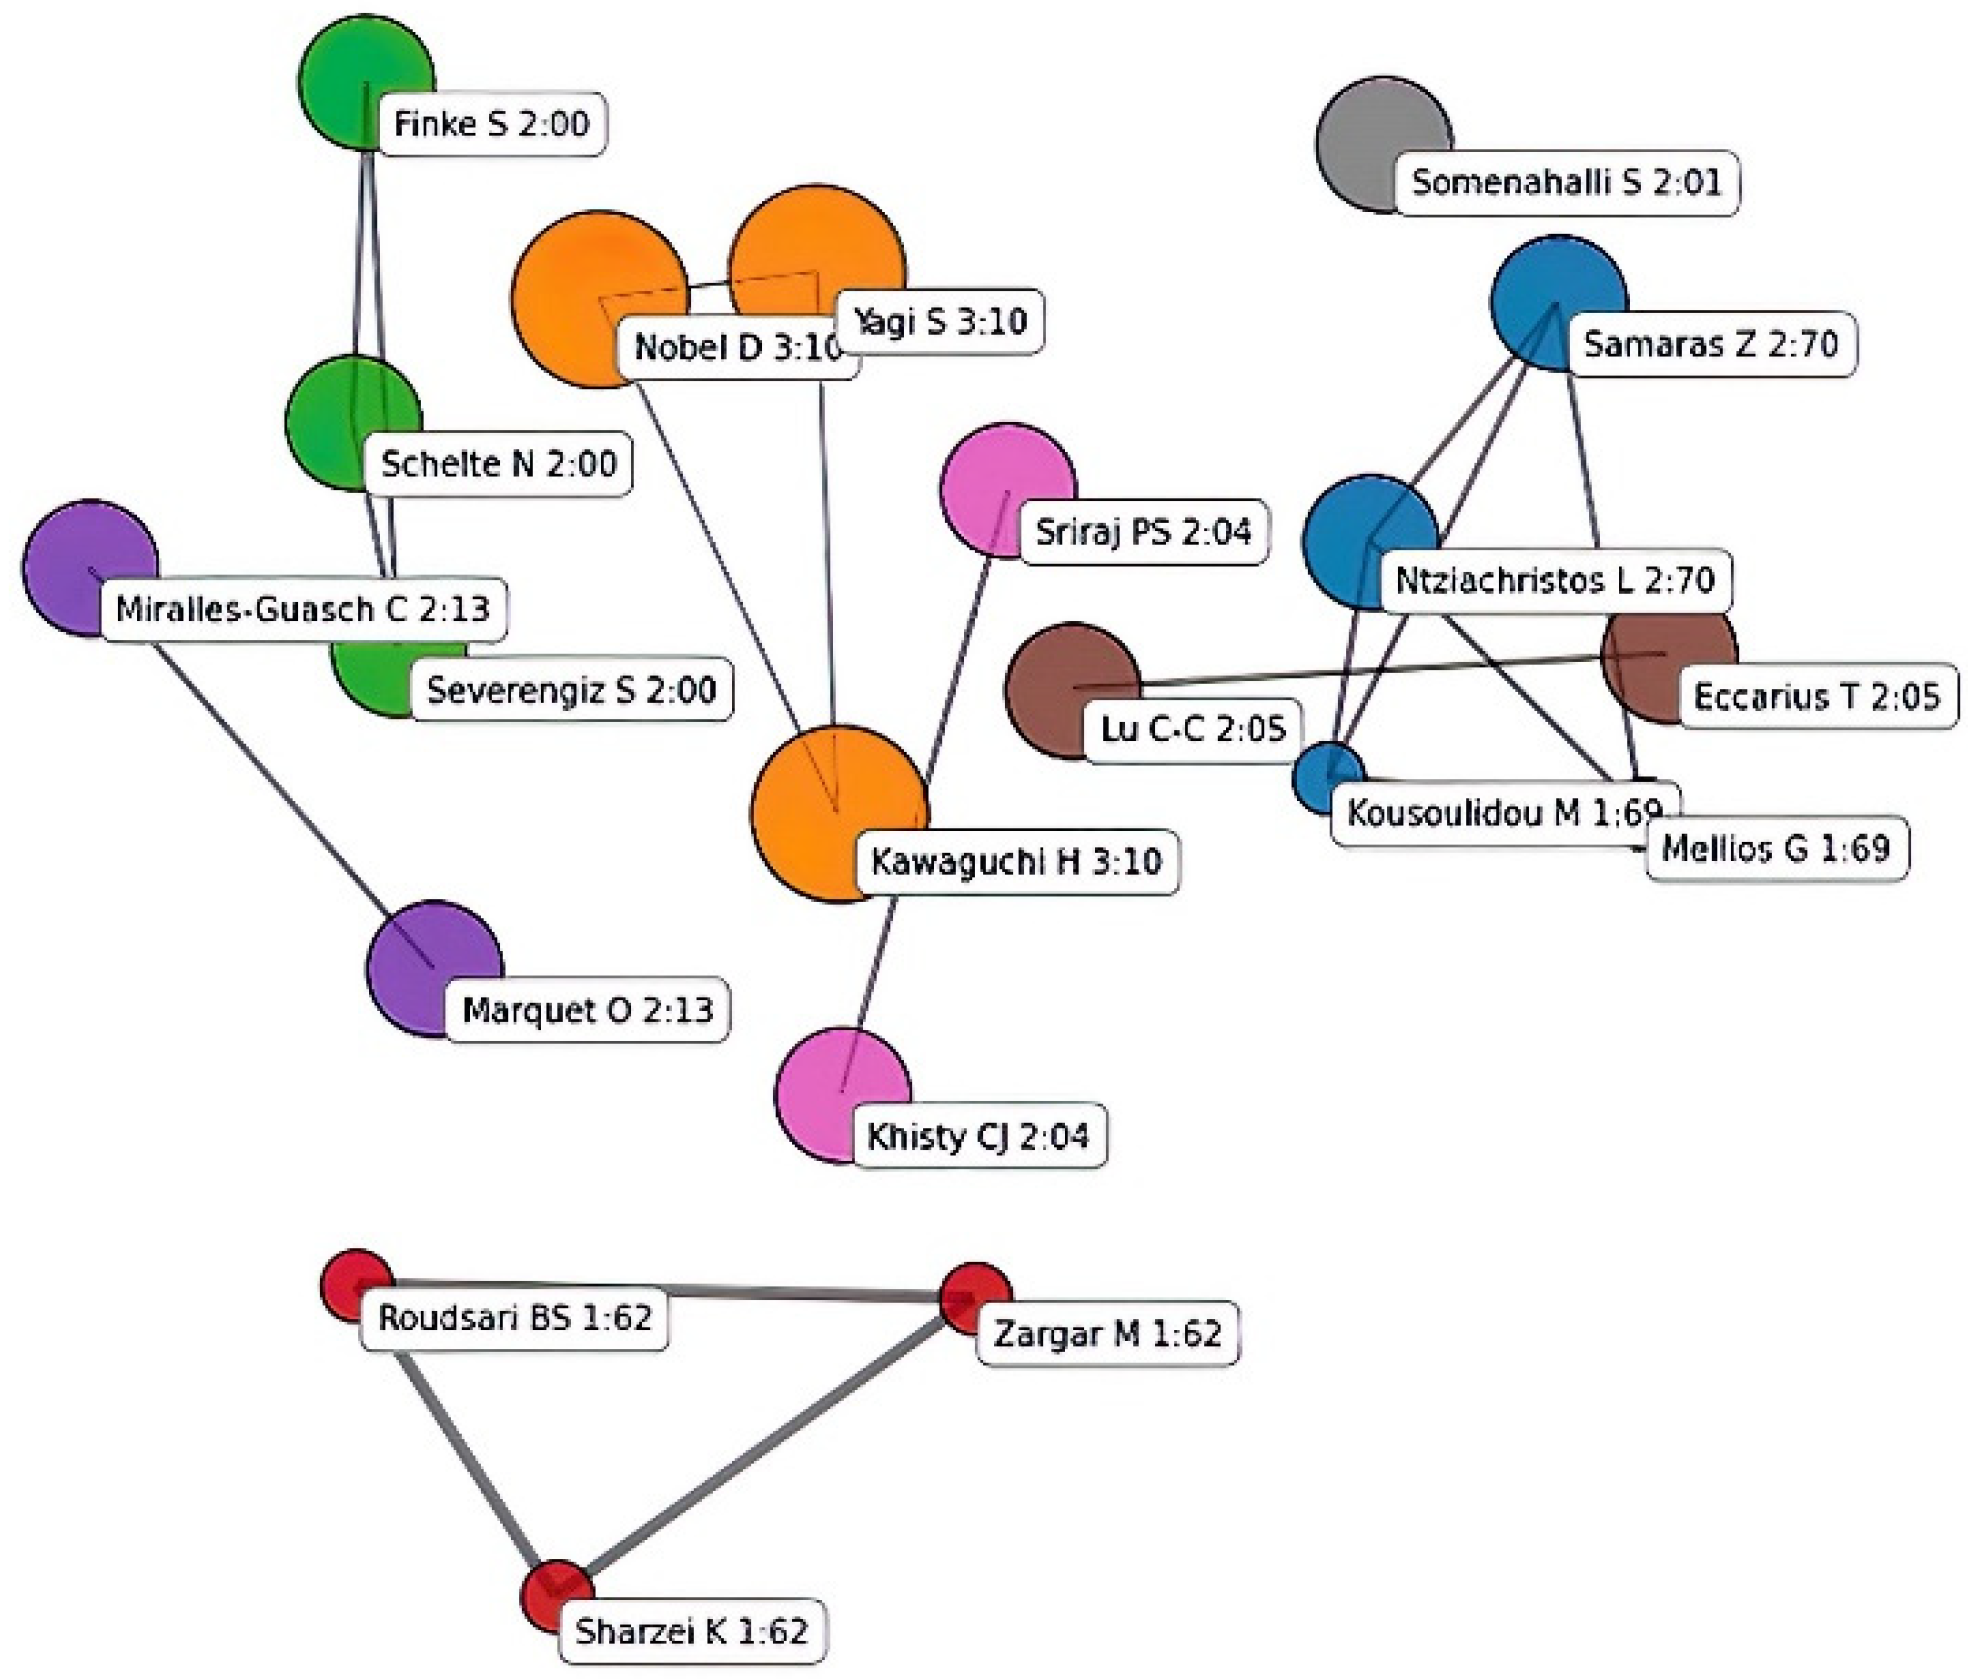
The two most cited authors, Ntziachristos, L. and Samaras, Z., have 2 publications and 70 citations each. Their contributions with other authors are related to the calculation of urban transport emissions [75,84]. Kousoulidou, M. and Mellios, G. also participated in one of these publications. Roudsari, B.S., in collaboration with Sharzei, K. and Zargar, M., analyzed age and sex distribution in transport-related injuries in Tehran [76]. The study by Chang, Y.-H., Cheng, Y.-H., and Lu, I.J. addressed some strategies to reduce carbon dioxide emissions and energy consumption in urban transport [36]. It should be noted that although Yagi, S., Nobel, D., and Kawaguchi, H. are coauthors in three publications, these were only cited 10 times.
Figure 7 presents the interactions between the 20 most cited authors. The size of the nodes denotes the number of papers published by each author. The figures after the author names are the number of articles and the number of citations. The colors of the nodes and the respective links indicate the collaboration subnetworks between the authors, which were determined based on the association index computed on the co-occurrence matrix and the corresponding network segmentation using Louvain’s algorithm [70]. In the cooperation network, eight author clusters are distinguished.
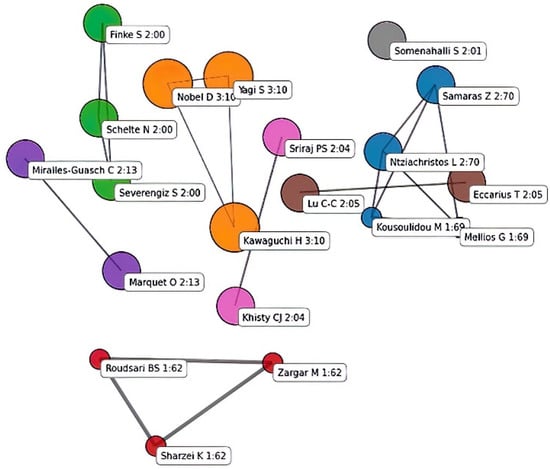
Figure 7.
Coauthorship network in motorcycle markets policies research. The diameter of the nodes is proportional to the number of articles published by each author. The colors of the nodes denote the collaboration subnetworks between the authors.
In general, the coauthorship network consists of several isolated components or subnetworks. For instance, the authors with the highest number of publications, Yagi, S., Nobel, D., and Kawaguchi, H., are in the same subnetwork because they published the same number of articles together and have no other coauthorships. In the case of the two most cited authors (Ntziachristos, L. and Samaras, Z.), they are coauthors of a publication along with two other researchers, which makes this subnetwork the one with the highest number of interactions. Some coauthorships include two authors, and there is only one author who published individually.
3.4. Leading Countries in Scientific Publications
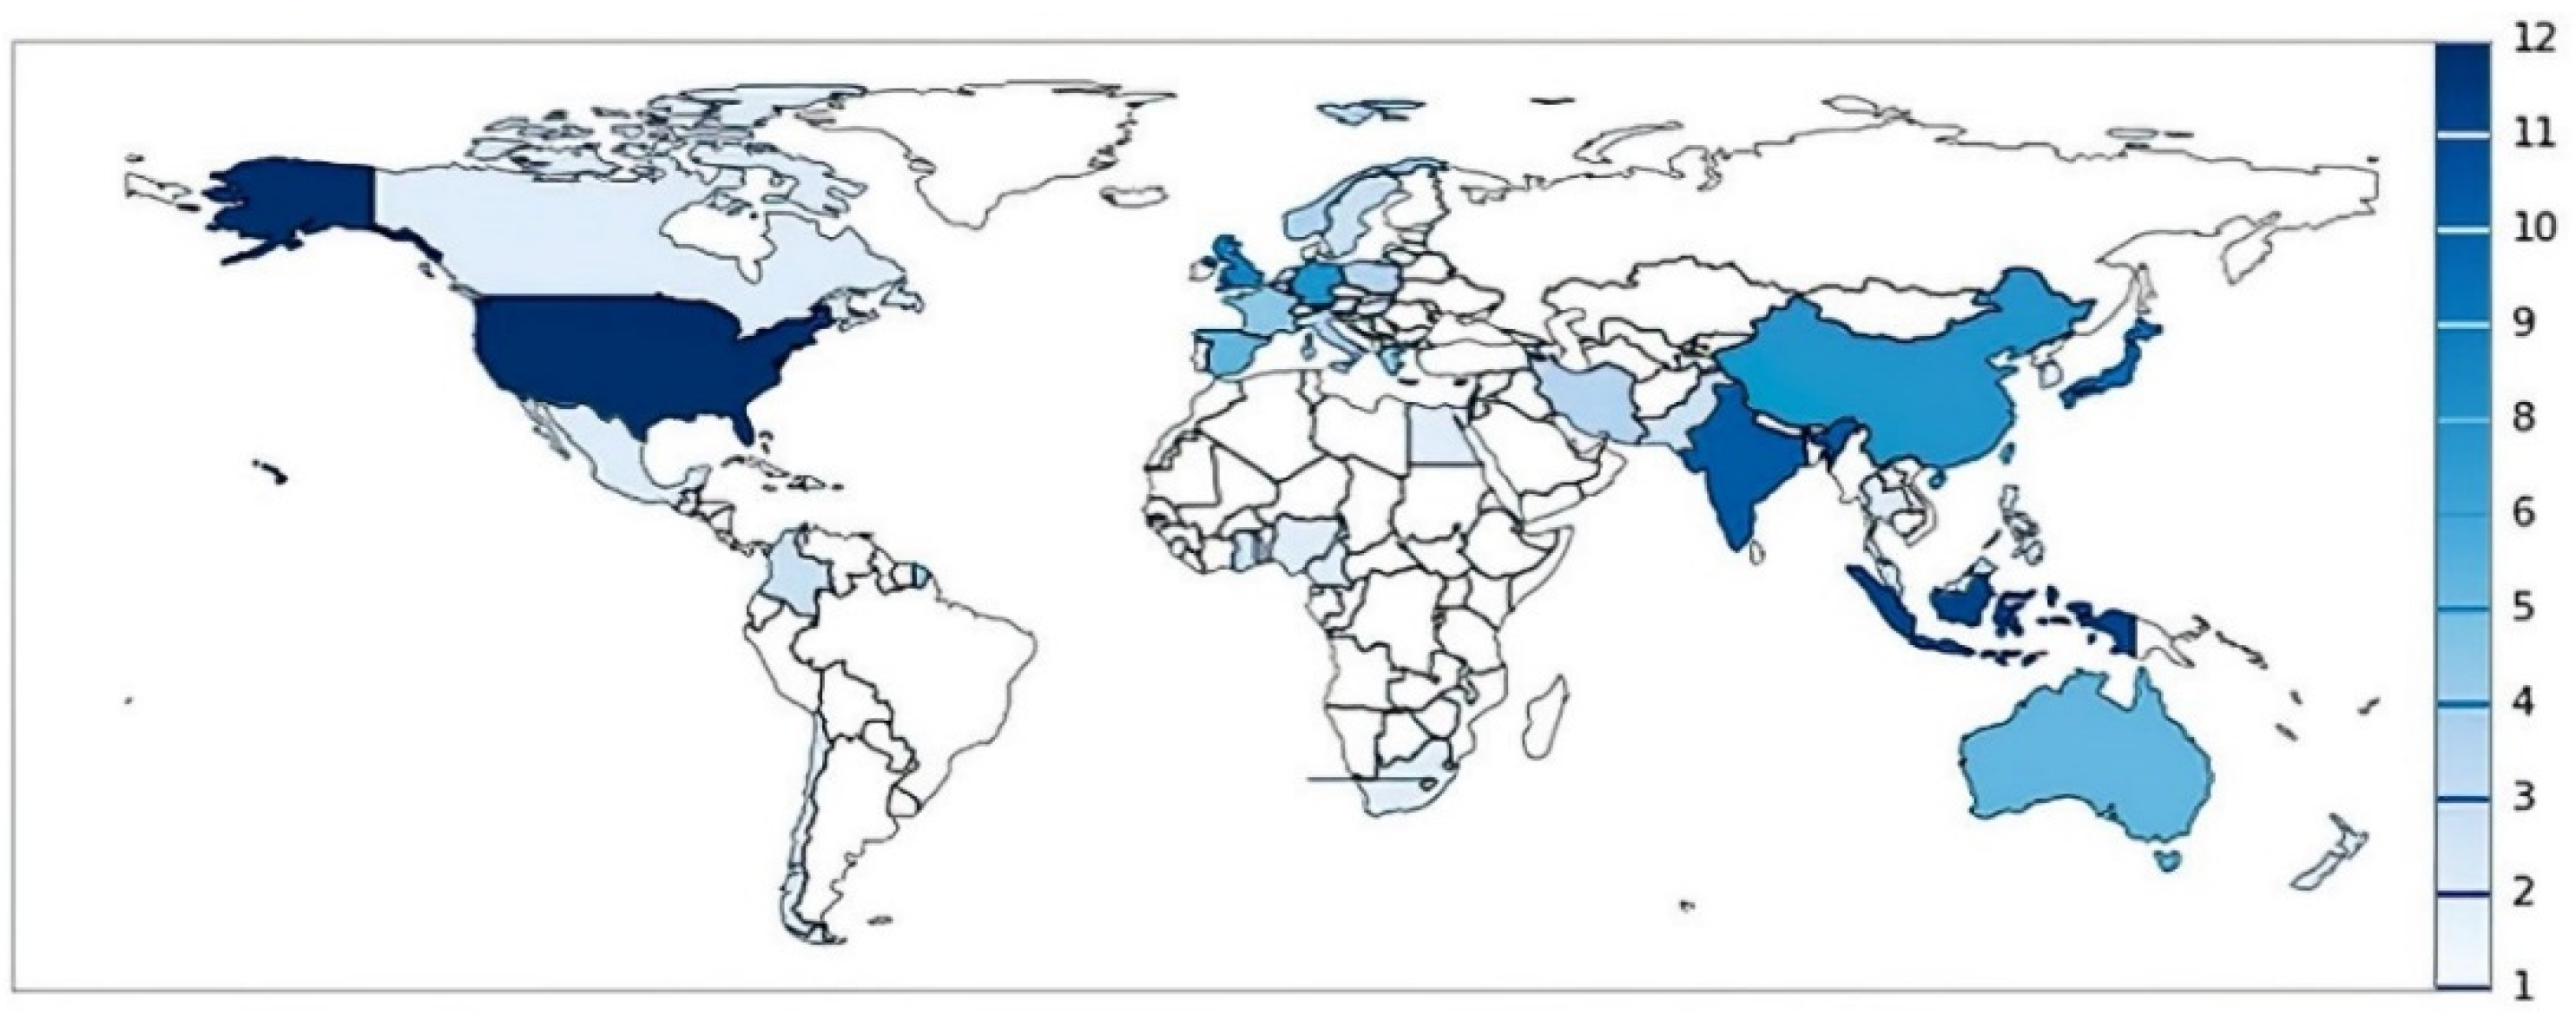
All the publications come from 40 different countries. The countries’ production index is 8, which means that eight countries (20%) published 51.5% of the scholarly production. Likewise, the countries’ transiency index is 15, which means that 15 countries (37.5%) published a single paper. Figure 8 shows the top countries in terms of number of publications. The United States has the highest concentration of articles, 12 (11.7%), followed by Indonesia (11), India (10), and Japan (9).
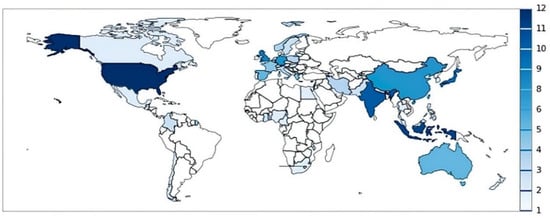
Figure 8.
Map with number of publications per country in motorcycle market policies.
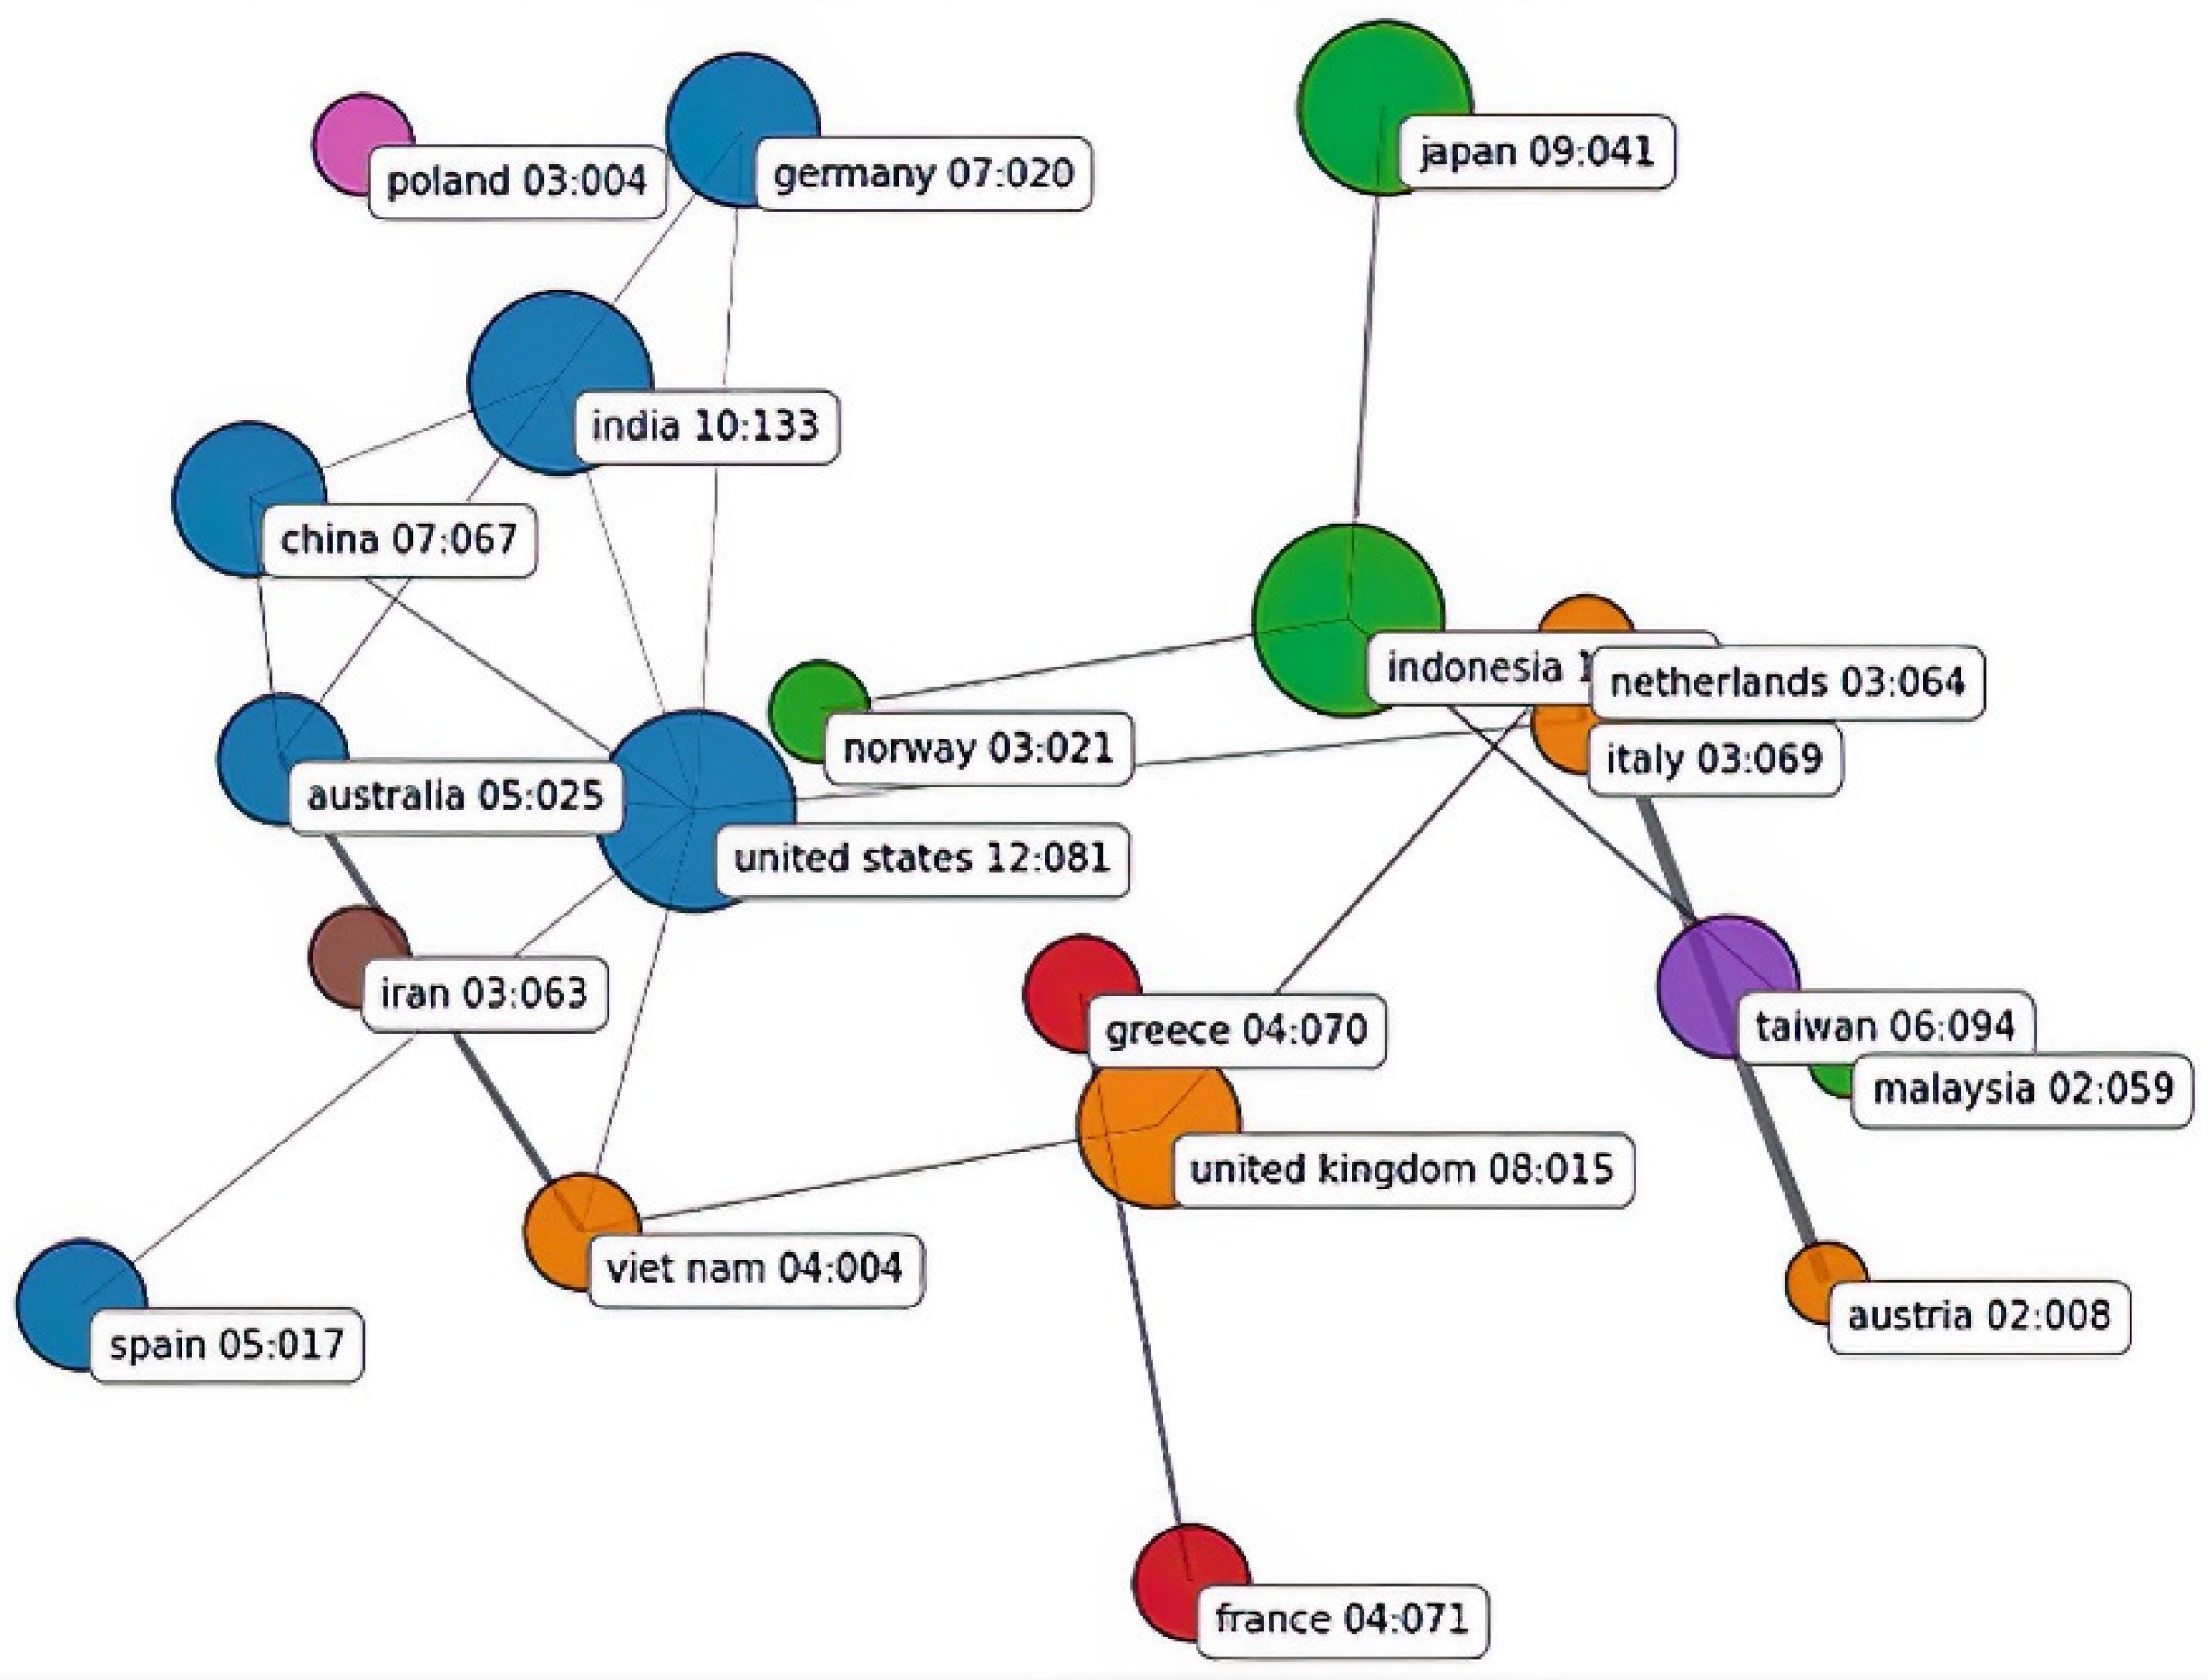
Figure 9 illustrates the collaboration network between the countries with the highest number of publications. There are three subnetworks with the highest number of countries. In the first subnetwork, we observe strong collaborations between the United States, India, Germany, and China and some minor collaborations with Australia and Spain. The second subnetwork consists of Asian countries and Norway. The third subnetwork, led by the United Kingdom, has other minor collaborations with countries such as Greece and France, among which there are, in turn, coauthorships. Of the countries under analysis, only Poland reports publications with no collaboration with other countries. Taiwan and Iran have published articles with at least one interaction with authors from other countries. In these subnetworks, there are no collaborations with African or Latin American countries.
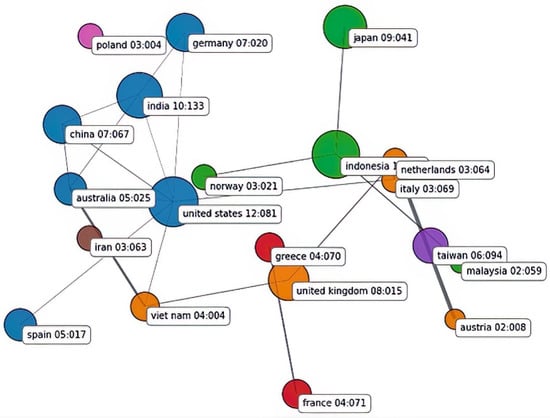
Figure 9.
Collaboration network between the top 20 most productive countries publishing in motorcycle market policies. The size of the nodes is proportional to the number of documents published by each country. The figures after the country names are the number of articles and the number of citations. The colors of the nodes denote the collaboration subnetworks between the countries.
3.5. Most Common Topics
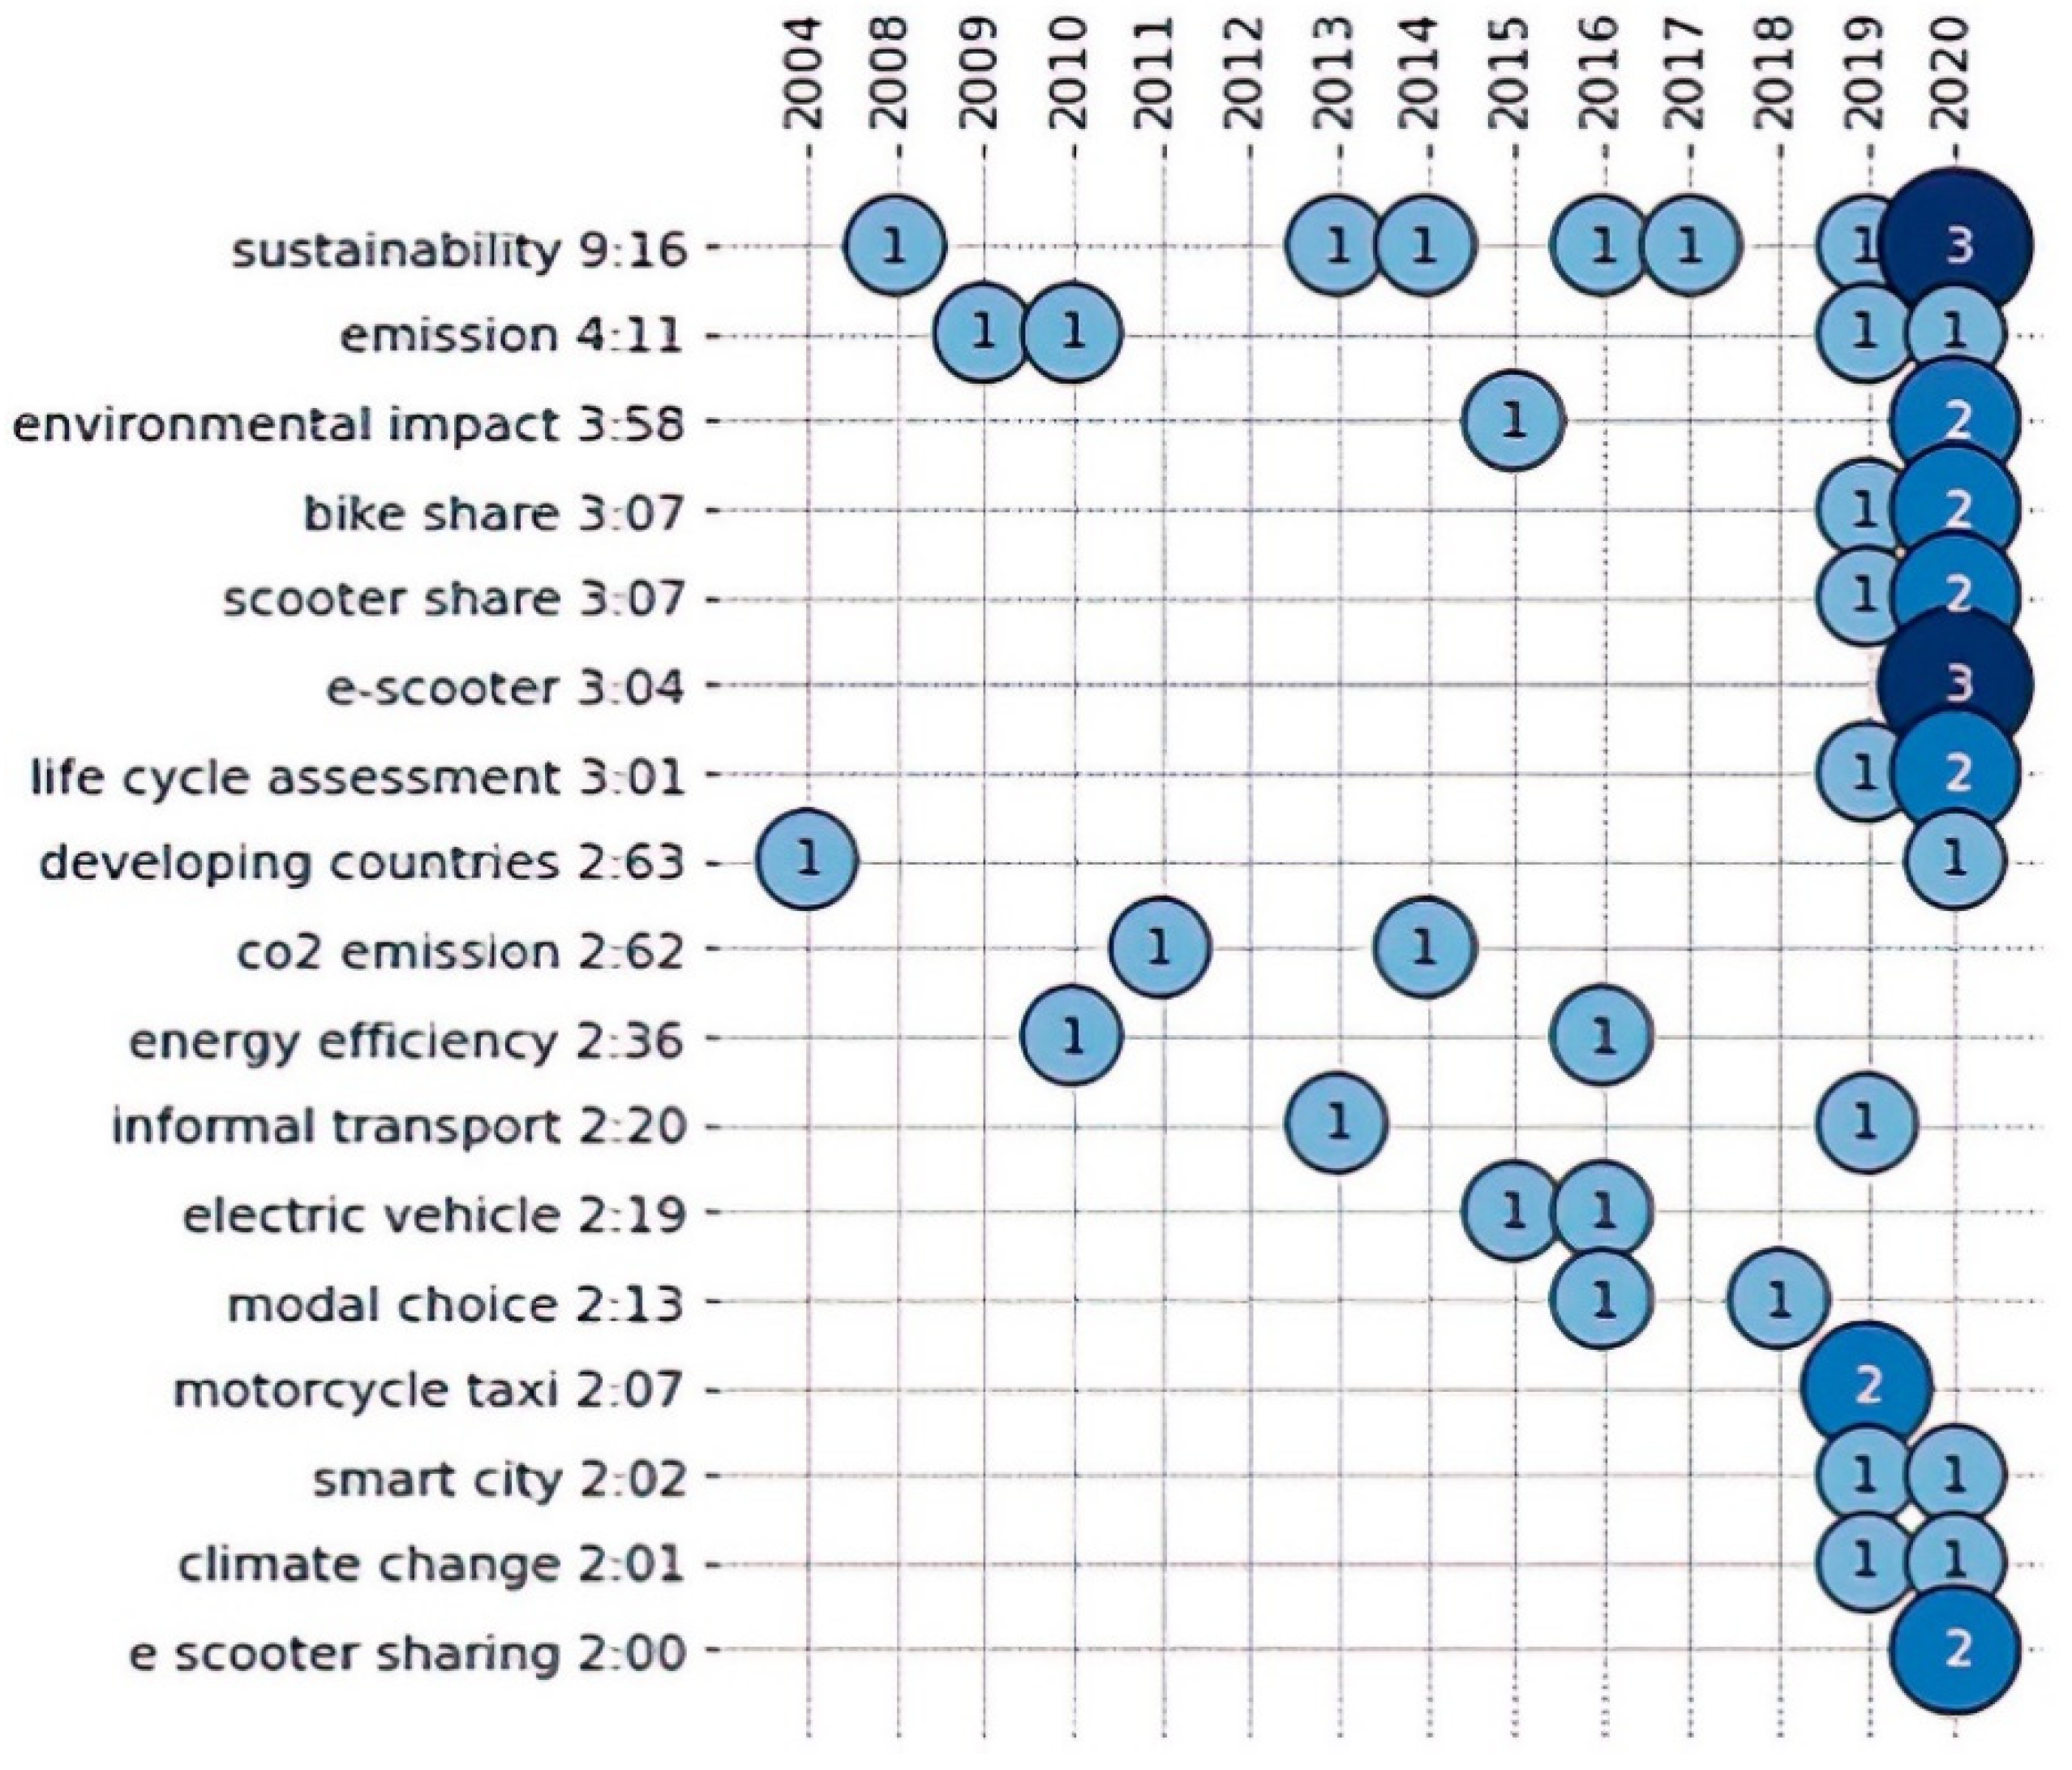
The keywords were subjected to a cleaning process that automatically homogenized uppercase letters, orthographic signs, and synonyms to create a thesaurus. Afterward, we performed a manual cleaning process to exclude words related to the search equation and include nonobvious terms in the field. Figure 10 lists the main keywords (based on the number of articles in which they are used) that appeared at least two times and the number of documents in which each keyword was found every year. Sustainability was found in nine documents, followed by emissions (four).
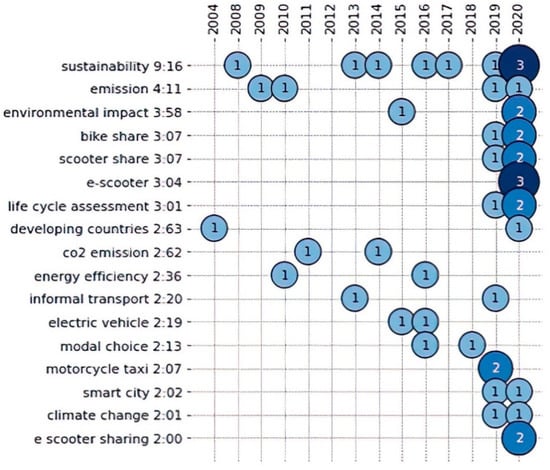
Figure 10.
Evolution of keywords over time (keywords after cleaning process).
Some of the keywords were recently used for the first time. For example, e-scooter and e-scooter sharing were introduced in the field in 2020 in three studies into (i) the life cycle assessment of this technology [85], (ii) the intention to adopt this means of transport [86], and (iii) its implications for the urban transport system [87]. Likewise, the terms climate change and smart city are also new in the field (2019). The first one assesses the impacts of modes of transport on climate change and human health [88], and the second one proposes a method to predict congestion on roads using sensors [89].
Other keywords, however, appeared a while ago. For instance, there are publications from 2008 to the present that have linked motorcycles to sustainability and emissions. In addition, there are works that have analyzed the relationship between developing countries and motorcycles, such as a study into the sociodemographic categorization of users of means of transport in Iran [76] conducted in 2004 and a study into the role of motorcycles in women’s urban mobility in Pakistan [90] conducted in 2020.
Moreover, the use of certain keywords (e.g., energy efficiency and electric vehicle) has declined in recent years. This may be explained by the fact that these terms (generic in the field) may have been specialized to introduce more specific concepts, such as e-scooter.
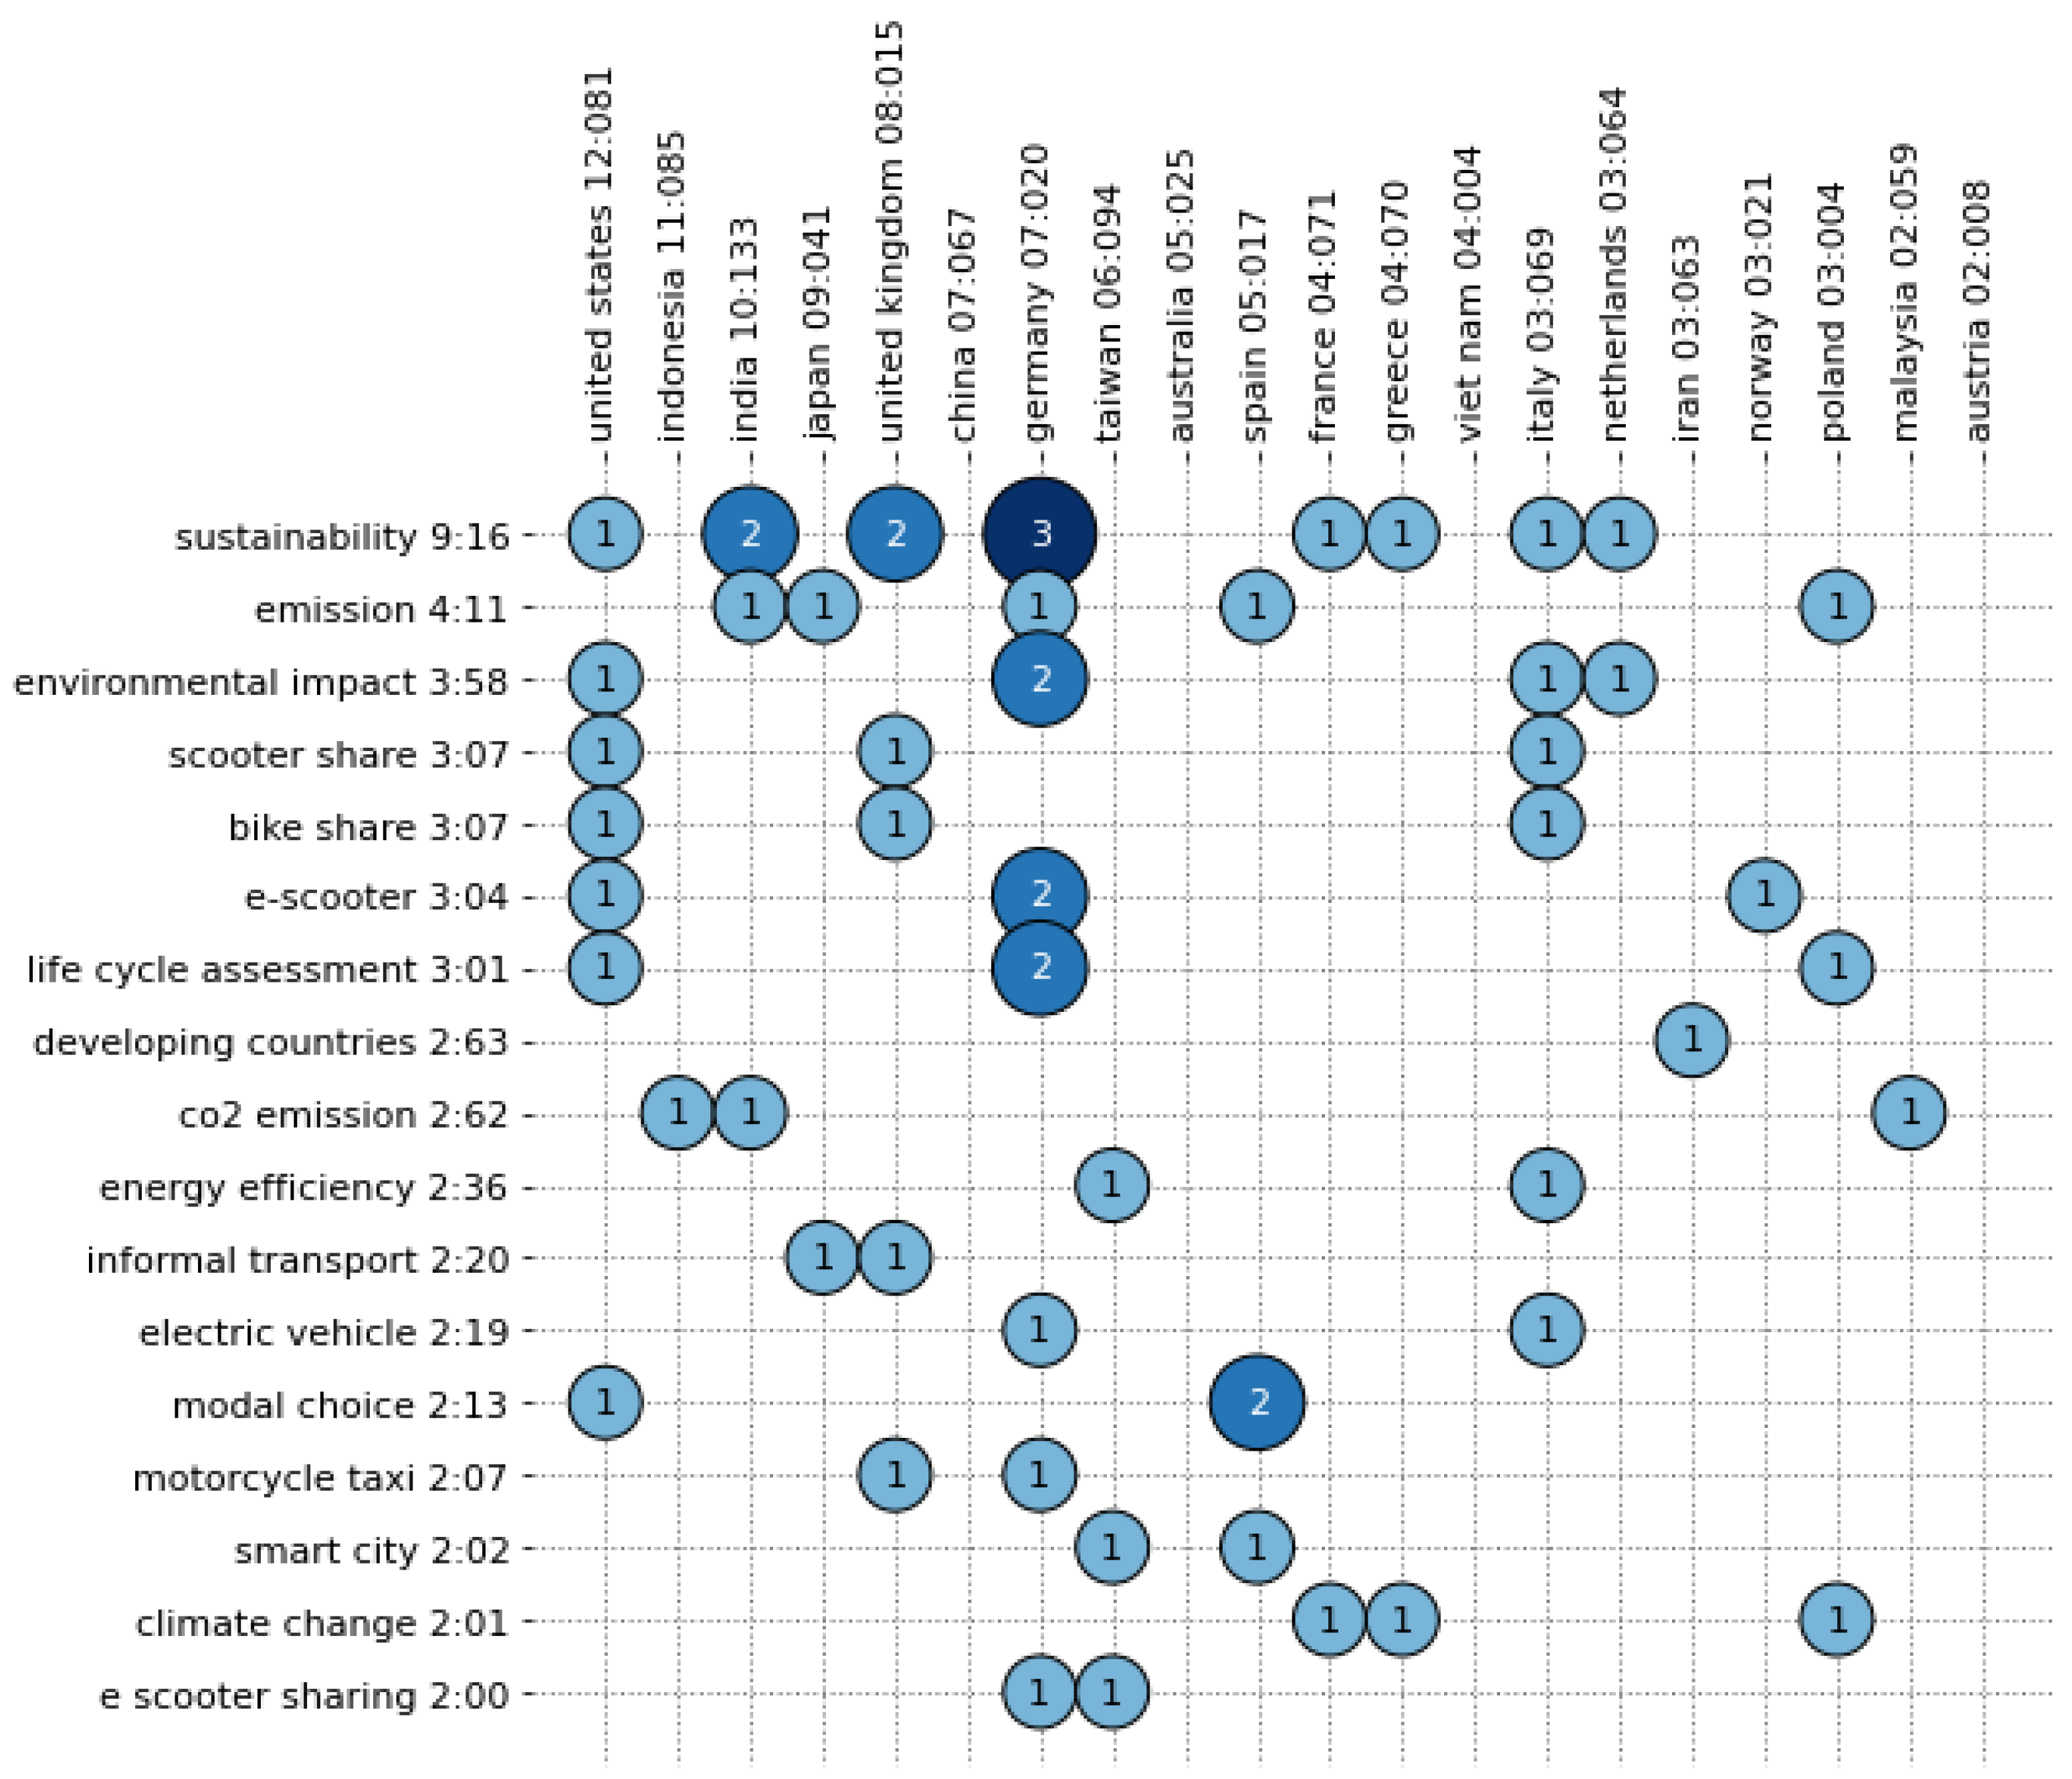
Figure 11 illustrates the co-occurrence of keywords by country.
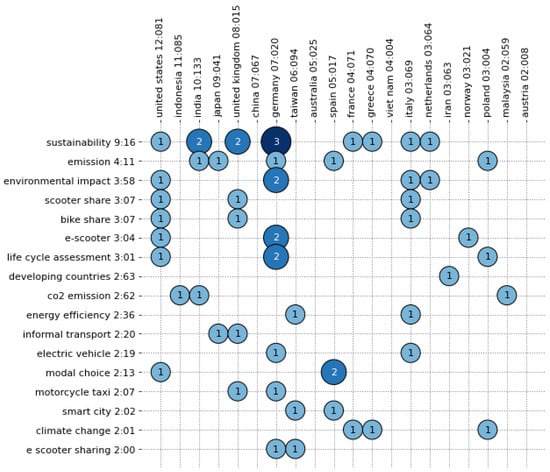
Figure 11.
Keywords by country (keywords after cleaning process).
Some countries have specialized in certain topics. For instance, sustainability has been widely analyzed in countries such as Germany, India, and the United Kingdom. After sustainability, emissions and environmental impact are the topics mainly addressed by a high number of countries, including Japan, Italy, Spain, the United States, Poland, and the Netherlands.
Bike sharing as a means of transport has been explored by the United States, the United Kingdom, and Italy, while Germany and Taiwan have specifically focused on e-scooter sharing.
The publications of most countries are related to one, two, or three of the main keywords, while the United States and Germany cover a wider variety (with the latter being the country with the greatest variety of topics). A country’s specialization in one topic depends on the number of related publications. For example, Norway has published a single article into e-scooters; however, we could not say that, in this country, there is a concentration of knowledge on such topic. The same happens with most countries, which confirms the dispersion of publications among territories.
The results are presented above.
4. Discussion
With the purpose of contributing to reducing the gap in knowledge about specific policies applied to motorcycles, we implemented a useful practice to categorize the publications in a field into thematic clusters. It allows one to generate maps of knowledge, assess the progress and frontiers of the field, and identify the hotspots and trends of research [91,92,93,94]. We performed a co-word or conceptual framework analysis to categorize publications. Furthermore, we identified clusters of keywords in the bibliographic sample by implementing a Multidimensional Scaling method (MDS) [71], which uses a normalization by association of the Euclidian distance between paired words. To identify clusters of keywords, we used a K-means reduction technique [72,73], which partitions n observations into k clusters in which each observation belongs to the cluster with the nearest mean. We also used Ward’s minimum variance method [74] for the hierarchical cluster analysis, which merges the pairs of clusters iteratively trying to minimize the total within-cluster variance.
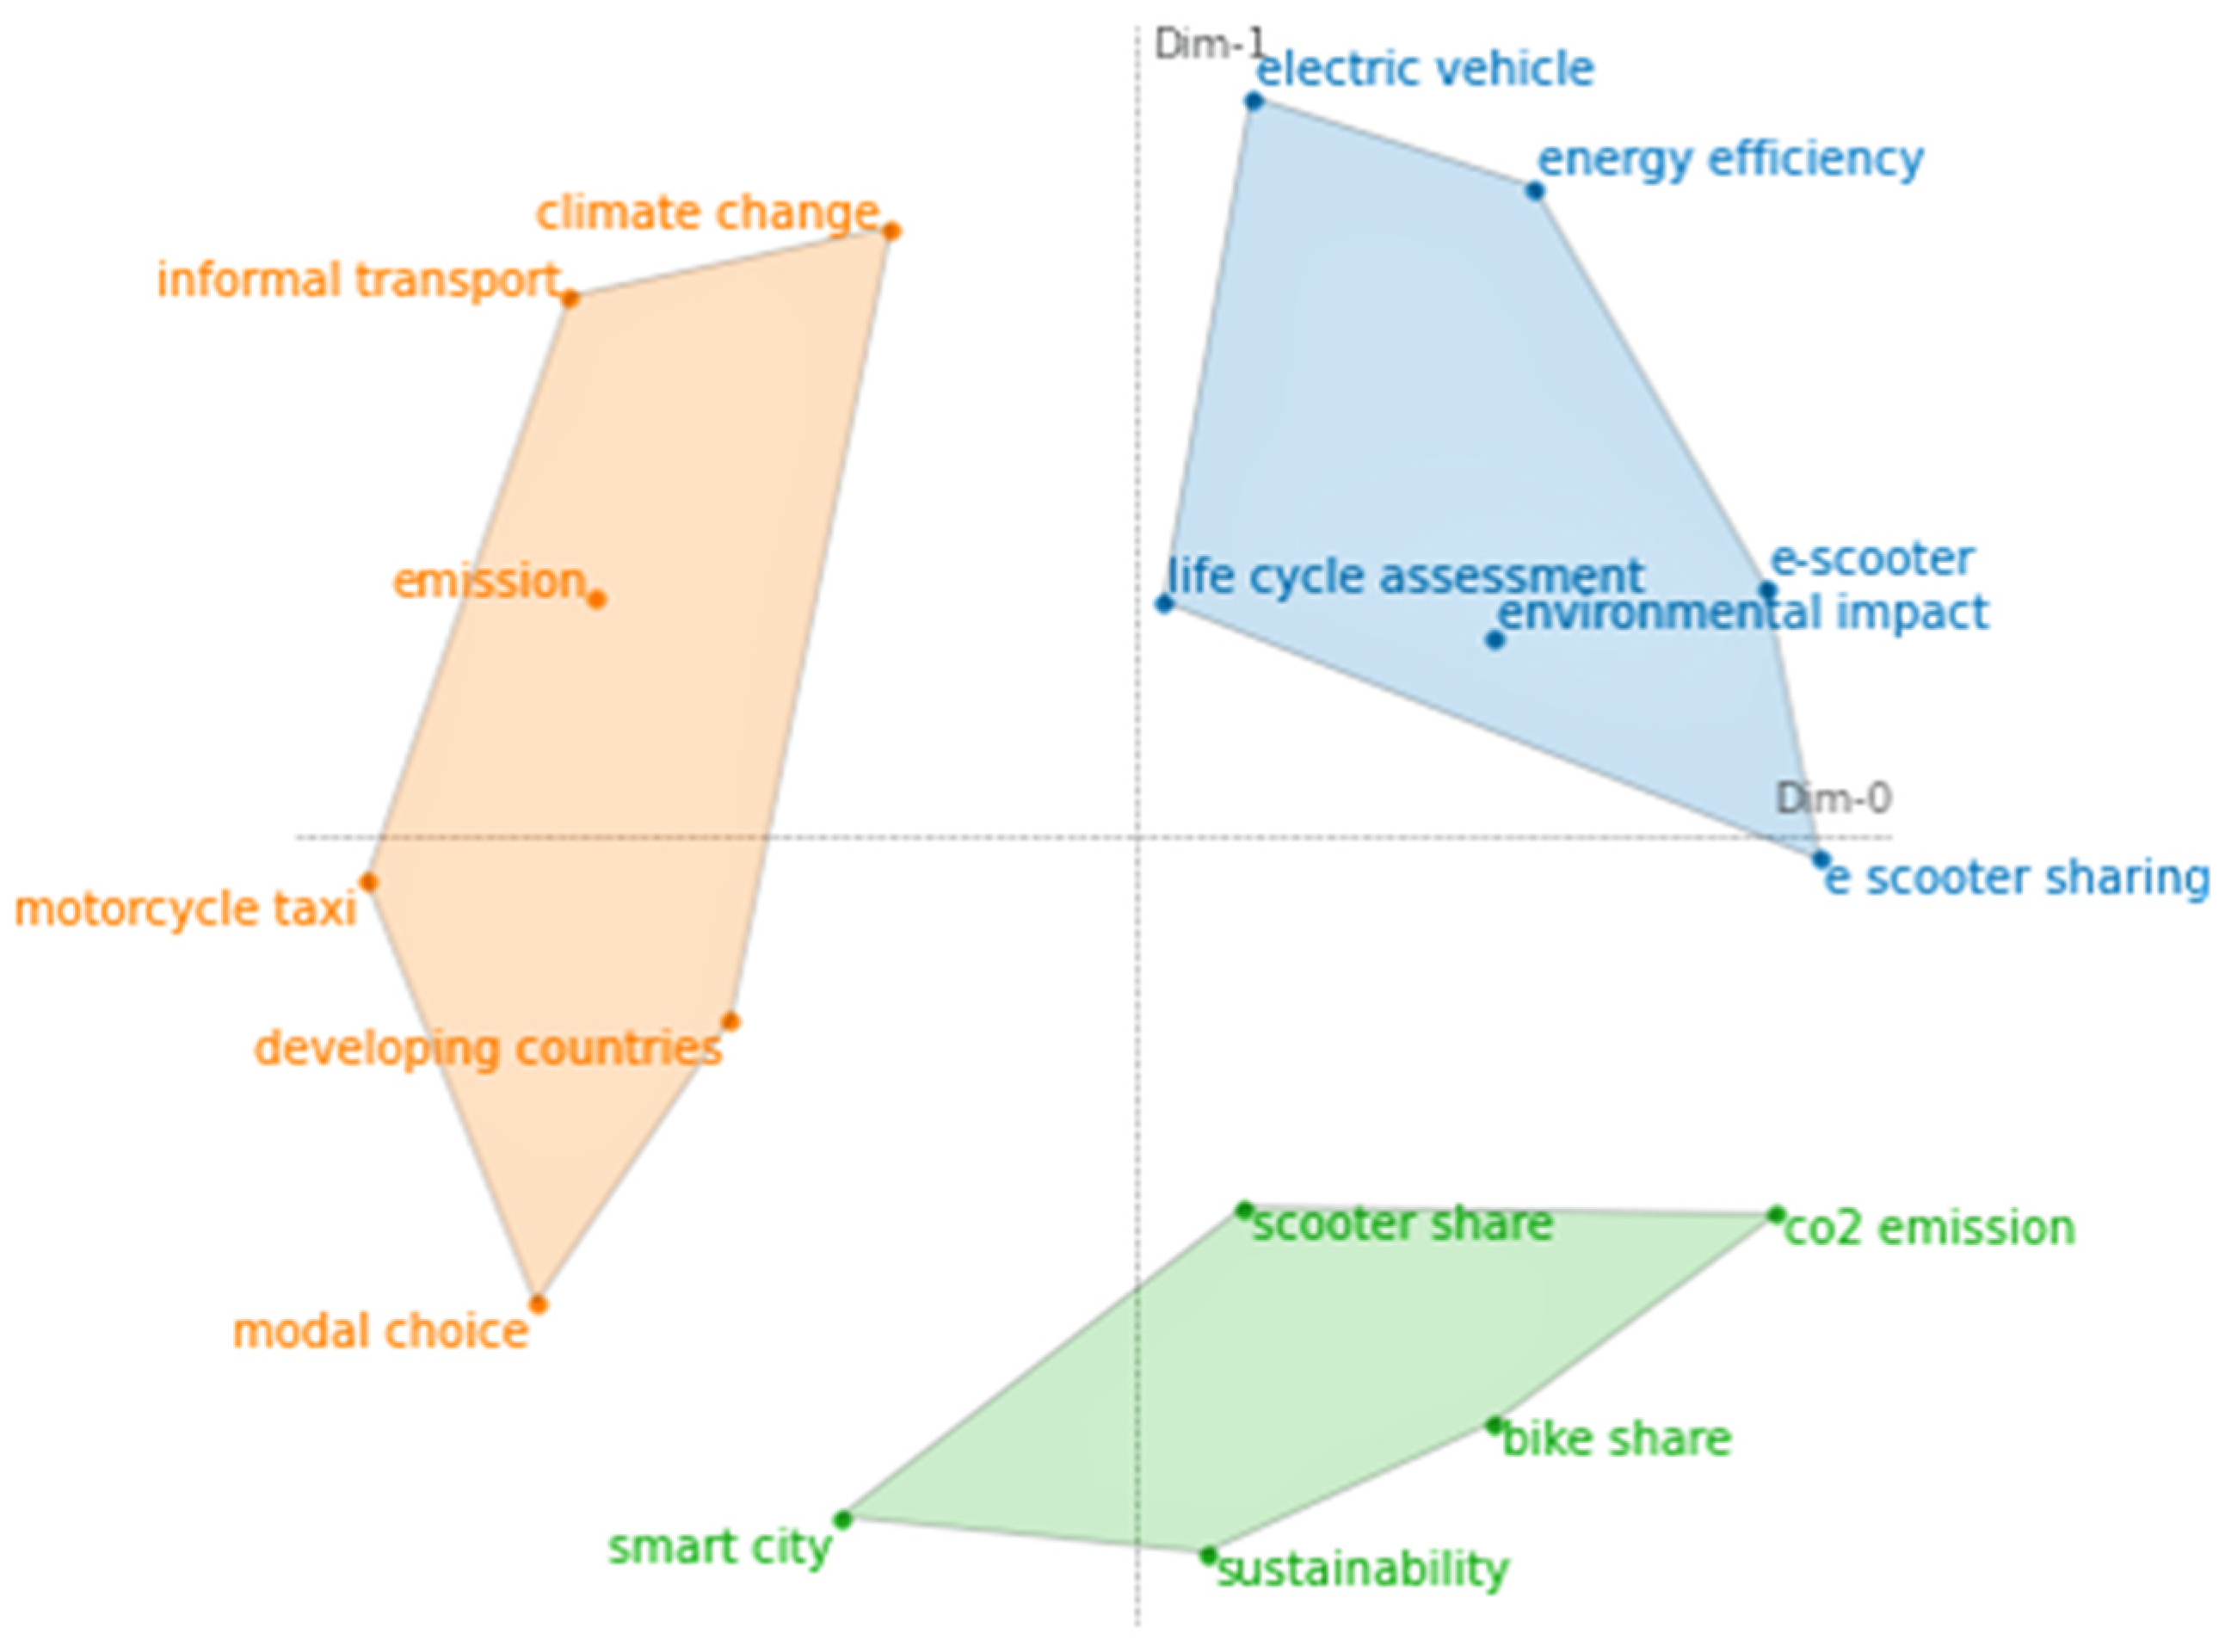
Figure 12 presents the clusters we identified.
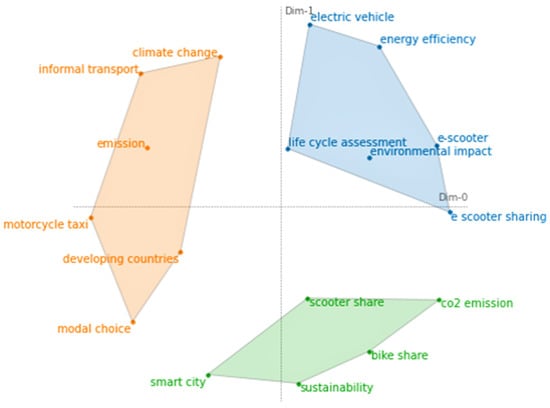
Figure 12.
Research themes (keywords after cleaning process).
As observed in the figure, the main keywords can be grouped into three major research themes: mobility, electric motorcycles, and sustainability.
The mobility cluster includes research into urban passenger transport, where motorcycles are recognized as one of the several current modes of transport in large cities. Studies in this cluster have attempted to establish groups of travelers based on their routine choice of means of transport [95], as well as to identify the sociodemographic characteristics of motorcycle users [96]. Likewise, other publications have analyzed the role of motorbikes in Mobility as a Service (MaaS) as an informal means of passenger transport (motorcycle taxis) [90,97] and established that their use contributes to the mobility of the territories but not to their sustainable development [98]. Motorcycle taxis remain common in developing countries [99], and their incidence in traffic accidents is widely recognized [76].
Additionally, in this cluster, some environmental concerns regarding road transport have encouraged the development of some studies. For instance, motorcycles are one of the vehicles considered in the quantification of urban transport emissions [88,100]. They, along with buses and cars, are regarded as one of the most polluting modes of transport in cities [101]. Recent articles have suggested the construction of highways for these two-wheelers to reduce their impact on the environment [102] because even the introduction of electric motorcycles could increase total road transport emissions by attracting users of other less polluting means of transport, such as the metro or active modes [103].
The studies in this cluster have mainly been conducted in developing territories, such as the Philippines [99], Jakarta [98], Ghana [97], Kenya [104], India [101,102], and Pakistan [90].
The electric motorcycles cluster encompasses research into this new technology. Broadly speaking, electric motorcycles fall into the category of electric mobility. The publications in this cluster have analyzed the most important factors to foster their use as a mode of passenger transport [105,106], as well as a possible means of freight transport over short distances [27]. In particular, the work by [106], published in 2010, is related to the design of strategies to promote the use of electric motorcycles to reduce air pollution in Taiwan.
Some other papers have attempted to forecast the possible changes that the introduction of these motorcycles may cause in transportation systems [87]. In this regard, electric motorcycle sharing has been of special interest, and studies into this topic have assessed both their life cycle [85] and the intention to adopt this means of transport [86].
As in the mobility cluster, an environmental concern is also observed in the publications of the electric motorcycles cluster. Some works have evaluated the environmental, economic, and social impacts of these motorcycles [2]; nevertheless, the environmental one has received a special attention, and life cycle assessments are common in the field [85,107].
Unlike in the mobility cluster, studies in the electric motorcycles cluster have been developed in territories such as Germany [85,107], Norway [27], Poland [88], the European Union [80,90,108], and Taiwan [86,106].
The sustainability cluster groups together papers whose main focus is to evaluate the sustainable development of the territories and for which motorcycles are a means of transport that, like others, contributes to air pollution given the CO2 emissions they generate. Several publications in this cluster have quantified the market share of these two-wheelers in the passenger transport industry and their impact on the emissions in the territories [77,108,109,110,111,112].
Moreover, some studies have evaluated the impact of different policies, such as the use of geographic information systems in planning the expansion of the system [113] and the design of parking spaces exclusively for motorcycles in the city center [114], on urban transport systems. Other isolated works have included two-wheelers in the prediction of road congestion using sensors [89] and are linked to the sustainability cluster through the smart city category.
Electric motorcycles are also part of this cluster, and different publications have evaluated their current and future impact on air pollution in the territories [85,115]. The most recent analyses provide an understanding of detailed market segments, such as shared bikes for passenger transport [116,117,118]. Likewise, certain papers have suggested measures such as the construction of highways for motorcycles to reduce their impact on the environment [102].
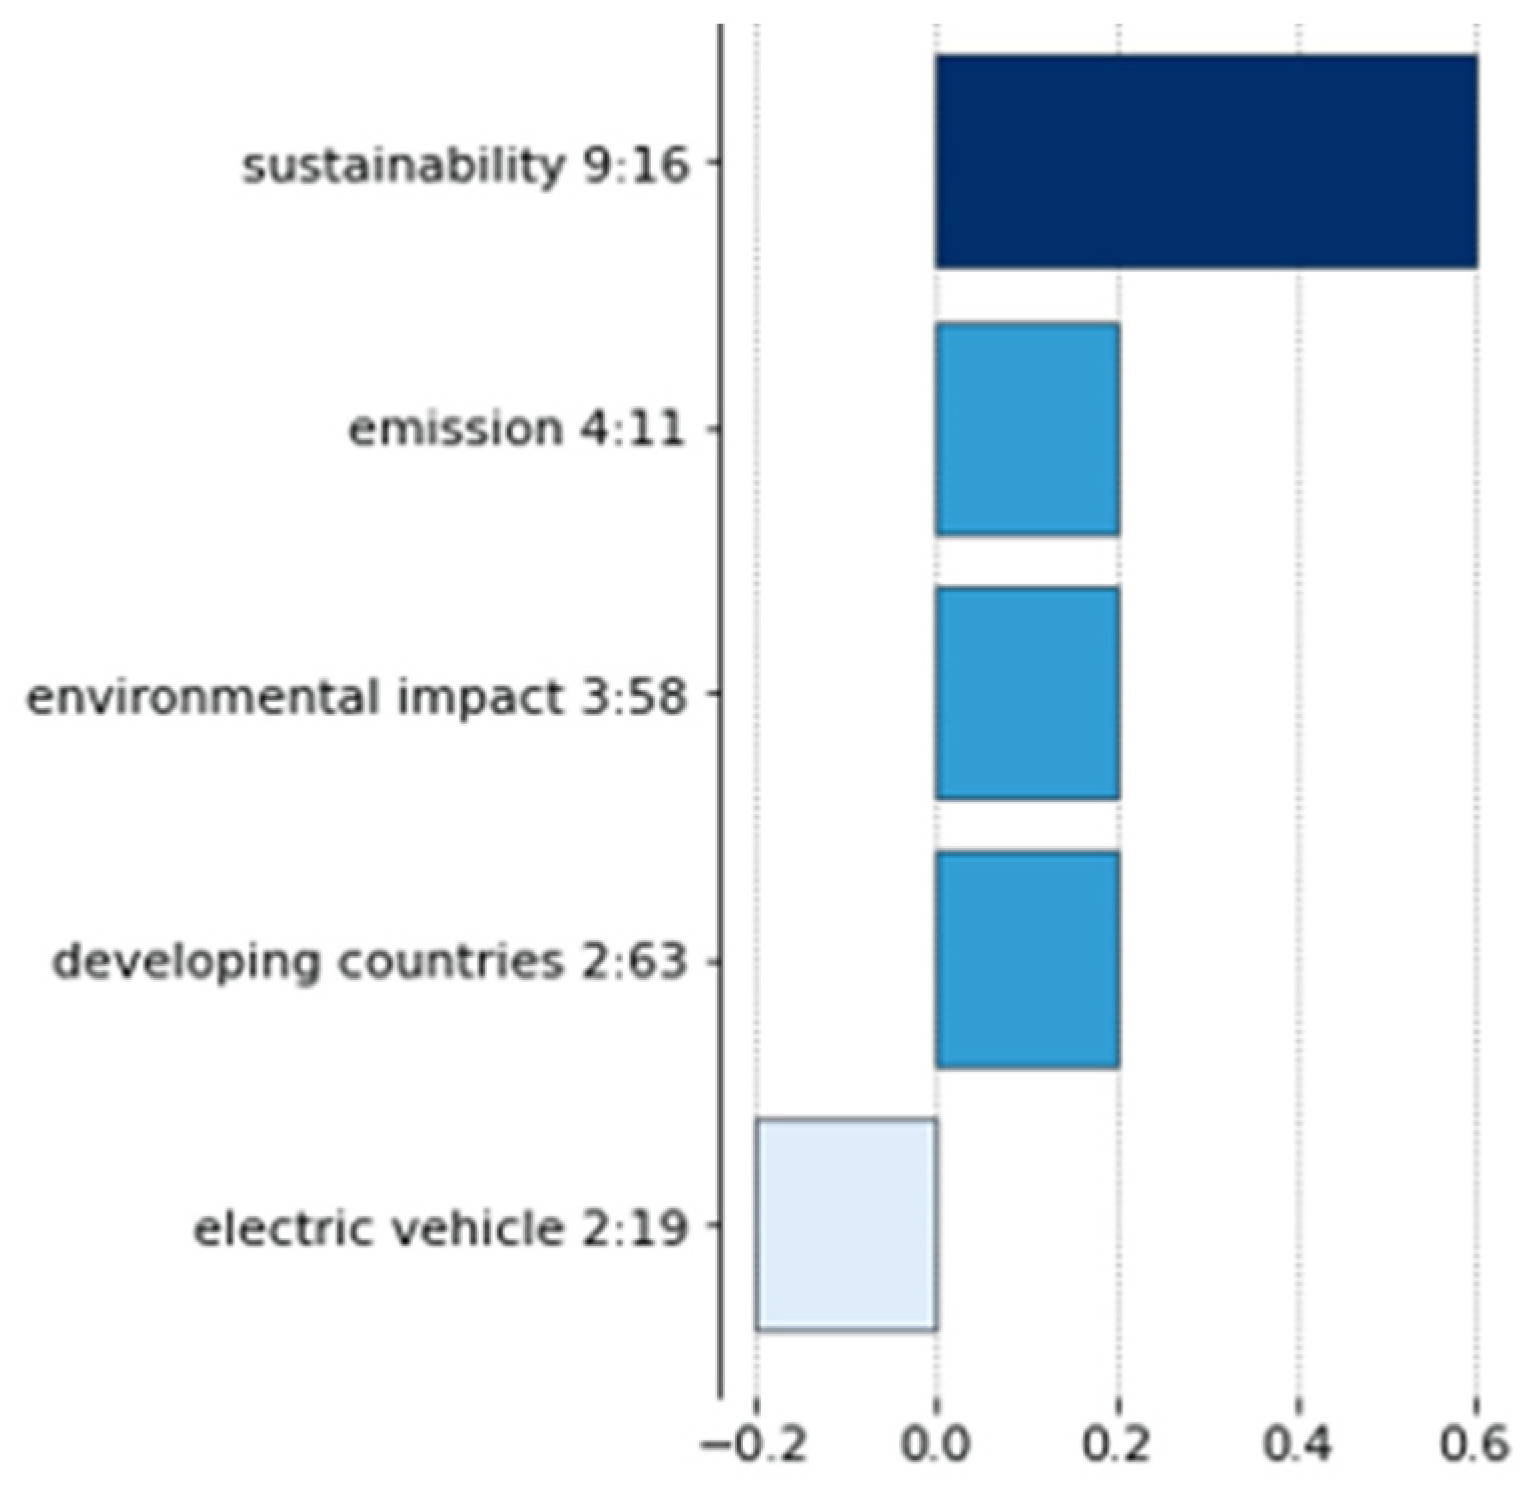
To identify the trending and declining topics in the field, we computed the Average Growth Rate (AGR) [69] of the main keywords, which is calculated as the average difference between the number of documents published in one year and the number of documents published in the previous year during a given period of analysis. It can take positive values (indicating that the number of publications on the topic has grown in recent years) or negative ones (indicating that the number of publications on the topic has declined in recent years). Figure 13 shows the AGR of the main keywords used between 2016 and 2020.
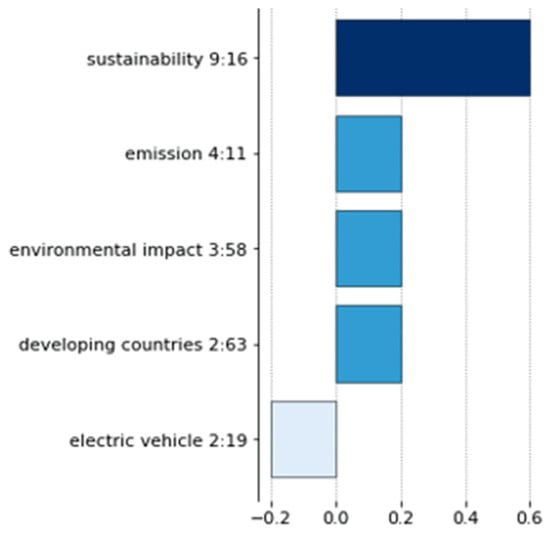
Figure 13.
Average Growth Rate of the keywords used between 2016 and 2020.
The keyword that has grown the most in terms of number of publications during the last four years is sustainability. It may be due to the influence of the increasing interest from governments and multilateral organizations such as the United Nations. Since 2015, the Sustainable Development Goals (SDG) established in the 2030 Agenda for Sustainable Development [119] have been promoted, permeating different fields from finance to the construction industry and transportation. The appearance of social media of climate activists [120], new vehicle technologies, and growing consumer awareness of climate change may have also influenced this boom from an environmental perspective. Aspects such as a rising population, the low maintenance cost of electric mobility, and tax incentives for environmentally friendly vehicles are raising the demand for electric motorcycles [6]. Since the Greenhouse Gas (GHG) emissions from transportation accounts for about 24% from global fuel combustion [121] and personal mobility contribute to it, alternative sustainable technologies to transport are being studied to a greater extent.
The most recent publications on the topic offer a broad picture of sustainability regarding motorcycles and discuss issues such as electric and shared mobility, financial aspects, and technological developments. Moreover, talking about sustainability inevitably implies also mentioning other related terms such as environmental impacts, CO2 emissions, ridesharing, and smart cities. For instance, the electrification of the conventional bicycle was recently studied in China as a better sustainable mobility alternative compared to motorcycles [115]. Likewise, individuals’ choice of motorcycles as a means of transport was recently examined in a city of Colombia [109]. In India, some authors analyzed the efficient allocation of the financial resources of a municipality to favor sustainable transport [110], as well as the possibility of building highways exclusively for bicycles (both motorized and nonmotorized) to promote their use and achieve greater sustainability in the transport system [102]. Other recent studies have assessed the life cycle of electric motorcycles given their rapid growth in some cities around the world [85], as well as the spatial and temporal behavior patterns of users of bike sharing services in order to design better policies that include these new modes of transport [116].
Furthermore, the terms emissions, environmental impact, and developing countries exhibited a positive AGR during the 2016–2020 period. Research in these topics has focused on the impact of motorcycles and other modes of transport on climate change [88] and on the environmental impact of electric motorcycles sharing [107]. In addition, life cycle assessments of this new technology (in terms of shared use), which involve calculating and monetizing the emissions generated, have also been conducted [85].
For its part, electric vehicle showed a negative AGR despite being a relevant topic in the field. This could mean that research on this topic is declining. However, since the studies into the other topics with a positive AGR include elements of electric mobility, we may say that the use of this keyword is what is declining, as it is being replaced by more specific terms such as e-scooter, e-bike, and electric two-wheelers.
Overall, a recent short period (2014–2020) has the highest number of publications compared with the two previous decades, as mentioned above, due to the emergence of new technologies and increased concerns about motorcycles. Moreover, there is a low level of collaboration among authors, and some territories such as Latin America are excluded from the country networks, which differs from other studies where a recognized group of authors contribute to a great extent to the topic [33].
These results suggest that research in motorcycle market policies is a field still in process of consolidation and maturing. Nevertheless, it is worth mentioning that the rising researchers’ interest in sustainable motorcycle transport is aligned with the governments and institutions’ concerns [122,123,124,125] and the advancements of technologies for cleaner transportation systems [126]. The publication sources are related to transportation, environment, accidents prevention, energy, engineering, health, and psychology. This wide variety of topics indicates a multidisciplinary approach to motorcycle market policies.
5. Conclusions
This paper studies representative research that includes different perspectives from motorcycles policies, makes its contribution to filling the research gap about it, and creates a framework for future analyses. Through a systematic literature review, we analyzed 103 scientific research articles about policies for the motorcycle market using a methodology based on tech mining, analysis of keyword co-occurrences, and clustering. The bibliographic information retrieved was subjected to a cleaning and homogenization process to remove accents and differences between uppercase and lowercase letters and to disambiguate author names. In particular, author keywords underwent a detailed cleaning process to remove differences related to the use of plural and singular forms, abbreviations, and homonyms.
The results obtained allowed us to examine collaborations between authors and countries, associations between keywords, and the specialization of certain countries in specific topics in the field. For instance, countries such Germany and the United Kingdom, were found to be among the most important reference points on sustainability. Regarding cooperation networks, the bibliometric analysis shows no evidence of collaboration with countries in Africa or Latin America, despite developing countries being one of the topics of interest for researchers. Furthermore, there is evidence of a low level of collaboration between authors and a medium level among the countries. An extensive variety of sources was published on the topic, related to different research fields, which indicates interdisciplinary studies. This opens opportunities and challenges to develop possible synergies between researchers, institutions, and governments.
The implemented methodology enabled us to identify three major research themes: sustainability as the most growing trend, mobility, and electric motorcycles. Additionally, we observed an increased number of publications on sustainability, emissions, environmental impact, and developing countries, while research reporting electric vehicles as a keyword has been declining. Two main approaches were identified in this research. The first group studies the market share of two-wheelers transport and its impact on the emissions in territories. The second group evaluates electric motorcycles’ impact on reducing pollution. This prove the growing researchers’ interest in motorcycles sustainability and the need for enhanced efforts by policymakers to include regulation policies for the motorcycle market in their agenda.
Despite the contributions of this study, future research should take into account its limitations as well. First, this analysis considered publications in one database only; thus, important discussions published in other journals could have been omitted. Second, this paper can be used for technological observation, which needs to be frequently updated. Third, the grey literature (e.g., working papers, government documents, and white papers) was not included in the scope. Finally, future studies should examine the presence of homonyms, typos in names or bibliographic references, and abbreviations related to the same topic and classified into different categories.
Author Contributions
The authors confirm contribution to the paper as follows: conceptualization, L.C.; methodology, L.C. and K.S.-S.; validation, L.C. and K.S.-S.; formal analysis, L.C. and K.S.-S. investigation L.C. and K.S.-S.; data curation, L.C. and K.S.-S.; writing—original draft preparation, L.C. and K.S.-S.; writing—review and editing, L.C. and K.S.-S.; visualization, L.C. and K.S.-S.; supervision, L.C. All authors have read and agreed to the published version of the manuscript.
Funding
This research received no external funding.
Data Availability Statement
The datasets used and/or analyzed during the current study are available from the corresponding author upon reasonable request.
Acknowledgments
We would like to thank ITM Translation Agency, who translated and edited the original manuscript. We are also grateful to The Research and Development Office (OID) at Pontificia Universidad Javeriana Cali and Instituto Tecnológico Metropolitano. Financial support from these two sources is gratefully acknowledged.
Conflicts of Interest
The authors declare no conflict of interest.
References
- WHO. WHO|Global Status Report on Road Safety 2013; World Health Organization: Geneva, Switzerland, 2014. [Google Scholar]
- Weiss, M.; Dekker, P.; Moro, A.; Scholz, H.; Patel, M.K. On the electrification of road transportation—A review of the environmental, economic, and social performance of electric two-wheelers. Transp. Res. Part D Transp. Environ. 2015, 41, 348–366. [Google Scholar] [CrossRef]
- Persistence Market Research. Global Market Study on Motorcycles: Standard Scooters to Remain Largest Product Type through 2026; Persistence Market Research: New York, NY, USA, 2018. [Google Scholar]
- FactMR. Motorcycle Market Forecast. Trend Analysis & Competition Tracking—Global Market Insights 2020 to 2030; FactMR: Dublin, Ireland, 2020. [Google Scholar]
- Eccarius, T.; Lu, C.-C. Powered two-wheelers for sustainable mobility: A review of consumer adoption of electric motorcycles. Int. J. Sustain. Transp. 2020, 14, 215–231. [Google Scholar] [CrossRef]
- Markets and Markets. Electric Scooter and Motorcycle Market; Markets and Markets: Pune, India, 2021. [Google Scholar]
- McD Team. Global Motorcycles Market Grew up in Double Digit in October 2020; McD Team: Luxembourg, 2020. [Google Scholar]
- Data Bridge Market Research. Electric Motorcycles Market—Global Industry Trends and Forecast to 2027. Available online: https://www.databridgemarketresearch.com/reports/global-electric-motorcycles-market (accessed on 1 March 2021).
- Chang, H.-L.; Wu, S.-C. Exploring the vehicle dependence behind mode choice: Evidence of motorcycle dependence in Taipei. Transp. Res. Part A Policy Pract. 2008, 42, 307–320. [Google Scholar] [CrossRef]
- Axsen, J.; Sovacool, B.K. The roles of users in electric, shared and automated mobility transitions. Transp. Res. Part D Transp. Environ. 2019, 71, 1–21. [Google Scholar] [CrossRef]
- Jones, L.R.; Cherry, C.R.; Vu, T.A.; Nguyen, Q.N. The effect of incentives and technology on the adoption of electric motorcycles: A stated choice experiment in Vietnam. Transp. Res. Part A Policy Pract. 2013, 57, 1–11. [Google Scholar] [CrossRef]
- Xavier, J. The Rise of Electric Two-Wheelers in China: Factors for their Success and Implications for the Future. Ph.D. Thesis, University of Califronia, Davis, CA, USA, 2007. [Google Scholar]
- Sovacool, B.K.; Abrahamse, W.; Zhang, L.; Ren, J. Pleasure or profit? Surveying the purchasing intentions of potential electric vehicle adopters in China. Transp. Res. Part A Policy Pract. 2019, 124, 69–81. [Google Scholar] [CrossRef]
- Chen, H.-S.; Tsai, B.; Hsieh, C. The effects of perceived barriers on innovation resistance of hydrogen-electric motorcycles. Sustainability 2018, 10, 1933. [Google Scholar] [CrossRef]
- Rahmanullah, E.S.; Nurjanah, S. Influence of Product Quality, Price and Supporting Infrasturcture to Perceived Value and Interest in Buying of Electric Motorcycle. MATEC Web Conf. 2018, 215, 02006. [Google Scholar] [CrossRef][Green Version]
- Huang, S.K.; Kuo, L.; Chou, K.L. The impacts of government policies on green utilization diffusion and social benefits—A case study of electric motorcycles in Taiwan. Energy Policy 2018, 119, 473–486. [Google Scholar] [CrossRef]
- Chen, H.-S.; Tsai, B.-K.; Hsieh, C.-M. Determinants of Consumers’ Purchasing Intentions for the Hydrogen-Electric Motorcycle. Sustainability 2017, 9, 1447. [Google Scholar] [CrossRef]
- Wu, J.H.; Wu, C.W.; Lee, C.T.; Lee, H.J. Green purchase intentions: An exploratory study of the Taiwanese electric motorcycle market. J. Bus. Res. 2015, 68, 829–833. [Google Scholar] [CrossRef]
- Seebauer, S. Why early adopters engage in interpersonal diffusion of technological innovations: An empirical study on electric bicycles and electric scooters. Transp. Res. Part A Policy Pract. 2015, 78, 146–160. [Google Scholar] [CrossRef]
- Chen, H.S. Applying Technology Acceptance Model to Explore the Adoption of Hydrogen-Electric Motorcycle in Taiwan. Appl. Mech. Mater. 2013, 459, 494–498. [Google Scholar] [CrossRef]
- Peraphan, J.; Hermann, K.; Markus, M. The conundrum of the motorcycle in the mix of sustainable urban transport. Transp. Res. Procedia 2017, 25, 4869–4890. [Google Scholar] [CrossRef]
- Leung, A.; Burke, M.; Perl, A.; Cui, J. The peak oil and oil vulnerability discourse in urban transport policy: A comparative discourse analysis of Hong Kong and Brisbane. Transp. Policy 2018, 65, 5–18. [Google Scholar] [CrossRef]
- International Energy Agency—IEA Tracking Transport 2020. Available online: https://www.iea.org/reports/tracking-transport-2020 (accessed on 1 July 2021).
- Bakker, S. Electric Two-Wheelers, Sustainable Mobility and the City. In Sustainable Cities: Authenticity, Ambition and Dream; IntechOpen: London, UK, 2019. [Google Scholar] [CrossRef]
- Cordellieri, P.; Sdoia, S.; Ferlazzo, F.; Sgalla, R.; Giannini, A.M. Driving attitudes, behaviours, risk perception and risk concern among young student car-drivers, motorcyclists and pedestrians in various EU countries. Transp. Res. Part F Traffic Psychol. Behav. 2019, 65, 56–67. [Google Scholar] [CrossRef]
- Silla, A.; Leden, L.; Rämä, P.; Scholliers, J.; van Noort, M.; Morris, A.; Hancox, G.; Bell, D. A headway to improve PTW rider safety within the EU through three types of ITS. Eur. Transp. Res. Rev. 2018, 10, 18. [Google Scholar] [CrossRef]
- Taefi, T.T.; Kreutzfeldt, J.; Held, T.; Fink, A. Strategies to increase the profitability of electric vehicles in urban freight transport. Green Energy Technol. 2015, 203, 367–388. [Google Scholar] [CrossRef]
- Biral, F.; Bosetti, P.; Lot, R. Experimental evaluation of a system for assisting motorcyclists to safely ride road bends. Eur. Transp. Res. Rev. 2014, 6, 411–423. [Google Scholar] [CrossRef]
- Cheng, A.S.K.; Liu, K.P.Y.; Tulliani, N. Relationship Between Driving-violation Behaviours and Risk Perception in Motorcycle Accidents. Hong Kong J. Occup. Ther. 2015, 25, 32–38. [Google Scholar] [CrossRef]
- Hidalgo-Fuentes, S.; Sospedra-Baeza, M.J. Gender and age distribution of motorcycle crashes in Spain. Int. J. Inj. Contr. Saf. Promot. 2019, 26, 108–114. [Google Scholar] [CrossRef]
- Jou, R.C.; Yeh, T.H.; Chen, R.S. Risk factors in motorcyclist fatalities in Taiwan. Traffic Inj. Prev. 2012, 13, 155–162. [Google Scholar] [CrossRef]
- Manan, M.; Varhelyi, A. Motorcycle fatalities in Malaysia. IATSS Res. 2012, 36, 30–39. [Google Scholar] [CrossRef]
- Ospina-Mateus, H.; Quintana Jiménez, L.A.; Lopez-Valdes, F.J.; Salas-Navarro, K. Bibliometric analysis in motorcycle accident research: A global overview. Scientometrics 2019, 121, 793–815. [Google Scholar] [CrossRef]
- Hsieh, P.Y.; Chang, L.F.W.; Yu, T.Y.; Wu, K.C. Evaluation of mitigation effects on air pollutants for electric scooters in Taiwan with the energy flow analysis and system dynamics approach. IOP Conf. Ser. Earth Environ. Sci. 2018, 191, 012136. [Google Scholar] [CrossRef]
- Trappey, A.J.C.; Trappey, C.; Hsiao, C.T.; Ou, J.J.R.; Li, S.J.; Chen, K.W.P. An evaluation model for low carbon island policy: The case of Taiwan’s green transportation policy. Energy Policy 2012, 45, 510–515. [Google Scholar] [CrossRef]
- Cheng, Y.-H.; Chang, Y.-H.; Lu, I.J. Urban transportation energy and carbon dioxide emission reduction strategies. Appl. Energy 2015, 157, 953–973. [Google Scholar] [CrossRef] [PubMed]
- Routledge. Mapping Urbanities: Morphologies, Flows, Possibilities; Dovey, K., Pafka, E., Mirjana, R., Eds.; Taylor & Francis: New York, NY, USA, 2018; ISBN 978-1-138-23360-7. [Google Scholar]
- Thanh Truong, T.M.; Ngoc, A.M. Parking behavior and the possible impacts on travel alternatives in motorcycle-dominated cities. Transp. Res. Procedia 2020, 48, 3469–3485. [Google Scholar] [CrossRef]
- Yang, W.-L.; Chen, L. A System Dynamics Approach To Evaluate The Impact Of Traffic Management Policy To Urban Air Quality. WIT Trans. Ecol. Environ. 2000, 42, 341–351. [Google Scholar] [CrossRef]
- Bocken, N.; Jonca, A.; Södergren, K.; Palm, J. Emergence of Carsharing Business Models and Sustainability Impacts in Swedish Cities. Sustainability 2020, 12, 1594. [Google Scholar] [CrossRef]
- Ampudia-Renuncio, M.; Guirao, B.; Molina-Sanchez, R.; Bragança, L. Electric Free-Floating Carsharing for Sustainable Cities: Characterization of Frequent Trip Profiles Using Acquired Rental Data. Sustainability 2020, 12, 1248. [Google Scholar] [CrossRef]
- Ampudia-Renuncio, M.; Guirao, B.; Molina-Sanchez, R. The impact of free-floating carsharing on sustainable cities: Analysis of first experiences in Madrid with the university campus. Sustain. Cities Soc. 2018, 43, 462–475. [Google Scholar] [CrossRef]
- Wielinski, G.; Trépanier, M.; Morency, C. Carsharing Versus Bikesharing: Comparing Mobility Behaviors. Transp. Res. Rec. 2017, 2650, 112–122. [Google Scholar] [CrossRef]
- Hernández Pulgarín, G.; Correa-Gómez, K. Incidencia de la movilidad en motocicleta en la producción de ciudad. El caso de Manizales (Colombia). Espacios 2019, 40, 29–38. [Google Scholar]
- Wigan, M. Motorcycles as a Full Mode of Transportation. Transp. Res. Rec. 2002, 1818, 39–46. [Google Scholar] [CrossRef]
- Page, M.J.; McKenzie, J.E.; Bossuyt, P.M.; Boutron, I.; Hoffmann, T.C.; Mulrow, C.D.; Shamseer, L.; Tetzlaff, J.M.; Akl, E.A.; Brennan, S.E.; et al. The PRISMA 2020 statement: An updated guideline for reporting systematic reviews. BMJ 2021, 372, n71. [Google Scholar] [CrossRef]
- Borgman, C.L. Bibliometrics and Scholarly Communication. Communic. Res. 1989, 16, 583–599. [Google Scholar] [CrossRef]
- Pritchard, A. Statistical Bibliography or Bibliometrics. J. Doc. 1969, 25, 348–349. [Google Scholar]
- Jiao, Q.G.; Onwuegbuzie, A.J. Dimensions of library anxiety and social interdependence: Implications for library services. Libr. Rev. 2002, 51, 71–78. [Google Scholar] [CrossRef]
- Emerald Group. How to Conduct Empirical Research. Available online: https://www.emeraldgrouppublishing.com/how-to/research-methods/conduct-empirical-research (accessed on 17 March 2021).
- Maditati, D.R.; Munim, Z.H.; Schramm, H.-J.; Kummer, S. A review of green supply chain management: From bibliometric analysis to a conceptual framework and future research directions. Resour. Conserv. Recycl. 2018, 139, 150–162. [Google Scholar] [CrossRef]
- Velasquez, J.D. Github Repository Jdvelasq repositories Techminer. Available online: https://github.com/jdvelasq/techminer (accessed on 20 May 2021).
- Elsevier. Why Choose Scopus—Scopus Benefits. Available online: https://www.elsevier.com/solutions/scopus/why-choose-scopus (accessed on 20 July 2021).
- Moed, H.F.; De Moya-Anegon, F.; Guerrero-Bote, V.; Lopez-Illescas, C. Are nationally oriented journals indexed in Scopus becoming more international? The effect of publication language and access modality. J. Informetr. 2020, 14, 101011. [Google Scholar] [CrossRef]
- Martín-Martín, A.; Orduna-Malea, E.; Thelwall, M.; Delgado López-Cózar, E. Google Scholar, Web of Science, and Scopus: A systematic comparison of citations in 252 subject categories. J. Informetr. 2018, 12, 1160–1177. [Google Scholar] [CrossRef]
- Sweileh, W.M. Research trends on human trafficking: A bibliometric analysis using Scopus database. Global. Health 2018, 14, 106. [Google Scholar] [CrossRef] [PubMed]
- Khudzari, J.M.; Kurian, J.; Tartakovsky, B.; Raghavan, G.S.V. Bibliometric analysis of global research trends on microbial fuel cells using Scopus database. Biochem. Eng. J. 2018, 136, 51–60. [Google Scholar] [CrossRef]
- Sánchez, A.D.; Del Río, M.D.L.C.; García, J.Á. Bibliometric analysis of publications on wine tourism in the databases Scopus and WoS. Eur. Res. Manag. Bus. Econ. 2017, 23, 8–15. [Google Scholar] [CrossRef]
- Kiani Mavi, R.; Gengatharen, D.; Kiani Mavi, N.; Hughes, R.; Campbell, A.; Yates, R. Sustainability in Construction Projects: A Systematic Literature Review. Sustainability 2021, 13, 1932. [Google Scholar] [CrossRef]
- Gonzalez-Brambila, C. Quantitative and qualitative studies of science and technology in Latin America. Scientometrics 2021, 126, 2411–2412. [Google Scholar] [CrossRef]
- Marques, I.C.P.; Franco, M. Cooperation networks in the area of health: Systematic literature review. Scientometrics 2020, 122, 1727–1750. [Google Scholar] [CrossRef]
- Scopus. What is the Scopus Author Identifier—Scopus: Access and use Support Center. Available online: https://service-elsevier-com.ezproxy.unal.edu.co/app/answers/detail/a_id/11212/supporthub/scopus/ (accessed on 3 September 2021).
- Pandas Working with Missing Data—Pandas 1.3.2 Documentation. Available online: https://pandas.pydata.org/pandas-docs/stable/user_guide/missing_data.html (accessed on 3 September 2021).
- Hirsch, J.E. An index to quantify an individual’s scientific research output. Proc. Natl. Acad. Sci. USA 2005, 102, 16569–16572. [Google Scholar] [CrossRef]
- Egghe, L. Theory and practise of the g-index. Scientometrics 2006, 69, 131–152. [Google Scholar] [CrossRef]
- Bradford, S.C. Sources of information on specific subjects 1934. J. Inf. Sci. 1985, 10, 176–180. [Google Scholar]
- Lotka, A.J. The frequency distribution of scientific productivity. J. Washingt. Acad. Sci. 1926, 16, 317–323. [Google Scholar]
- Powers, D.M.W. Applications and Explanations of Zip’s Law. In Proceedings of the New Methods in Language Processing and Computational Natural Language Learning, Sydney, Australia, 11–17 January 1998. [Google Scholar]
- Ruiz-Rosero, J.; Ramirez-Gonzalez, G.; Viveros-Delgado, J. Software survey: ScientoPy, a scientometric tool for topics trend analysis in scientific publications. Scientometrics 2019, 121, 1165–1188. [Google Scholar] [CrossRef]
- Blondel, V.D.; Guillaume, J.-L.; Lambiotte, R.; Lefebvre, E. Fast unfolding of communities in large networks. J. Stat. Mech. Theory Exp. 2008, 2008, P10008. [Google Scholar] [CrossRef]
- Ramsay, J.O. Some Statistical Approaches to Multidimensional Scaling Data. J. R. Stat. Soc. Ser. A 1982, 145, 285. [Google Scholar] [CrossRef]
- Ekundayo, T.C.; Okoh, A.I. A global bibliometric analysis of Plesiomonas-related research (1990–2017). PLoS ONE 2018, 13, e0207655. [Google Scholar] [CrossRef] [PubMed]
- Zhang, Y.; Lu, J.; Liu, F.; Liu, Q.; Porter, A.; Chen, H.; Zhang, G. Does deep learning help topic extraction? A kernel k-means clustering method with word embedding. J. Informetr. 2018, 12, 1099–1117. [Google Scholar] [CrossRef]
- Ward, J.H. Hierarchical Grouping to Optimize an Objective Function. J. Am. Stat. Assoc. 1963, 58, 236–244. [Google Scholar] [CrossRef]
- Kousoulidou, M.; Ntziachristos, L.; Mellios, G.; Samaras, Z. Road-transport emission projections to 2020 in European urban environments. Atmos. Environ. 2008, 42, 7465–7475. [Google Scholar] [CrossRef]
- Roudsari, B.S.; Sharzei, K.; Zargar, M. Sex and age distribution in transport-related injuries in Tehran. Accid. Anal. Prev. 2004, 36, 391–398. [Google Scholar] [CrossRef]
- Ong, H.C.; Mahlia, T.M.I.; Masjuki, H.H. A review on emissions and mitigation strategies for road transport in Malaysia. Renew. Sustain. Energy Rev. 2011, 15, 3516–3522. [Google Scholar] [CrossRef]
- Tiwari, G. Transport and land-use policies in Delhi. Bull. World Health Organ. 2003, 81, 444–450. [Google Scholar]
- Blaizot, S.; Papon, F.; Haddak, M.M.; Amoros, E. Injury incidence rates of cyclists compared to pedestrians, car occupants and powered two-wheeler riders, using a medical registry and mobility data, Rhône County, France. Accid. Anal. Prev. 2013, 58, 35–45. [Google Scholar] [CrossRef]
- Pandey, A.; Venkataraman, C. Estimating emissions from the Indian transport sector with on-road fleet composition and traffic volume. Atmos. Environ. 2014, 98, 123–133. [Google Scholar] [CrossRef]
- Jiang, B.; Liang, S.; Peng, Z.-R.; Cong, H.; Levy, M.; Cheng, Q.; Wang, T.; Remais, J.V. Transport and public health in China: The road to a healthy future. Lancet 2017, 390, 1781–1791. [Google Scholar] [CrossRef]
- Srinivasan, K.K.; Lakshmi Bhargavi, P.V.; Ramadurai, G.; Muthuram, V.; Srinivasan, S. Determinants of changes in mobility and travel patterns in developing countries: Case study of Chennai, India. Transp. Res. Rec. 2007, 42–52. [Google Scholar] [CrossRef]
- Harzing, A.-W. The Publish or Perish Book. 1.4.3 M-Quotient; Tarma Software Research Pty Ltd.: Melbourne, Australia, 2016; ISBN 978-0-9808485-1-9. [Google Scholar]
- Samaras, C.; Stamos, I.; Ntziachristos, L.; Mitsakis, E.; Samaras, Z.; Ayfantopoulou, G. Road transport induced GHG emissions calculation for urban transportation networks: The case of Athens and Thessaloniki in Greece. In Energy, Transportation and Global Warming. Green Energy and Technology, PartF2; Springer: Cham, Switzerland, 2016; pp. 783–794. [Google Scholar] [CrossRef]
- Severengiz, S.; Finke, S.; Schelte, N.; Wendt, N. Life Cycle Assessment on the Mobility Service E-Scooter Sharing. In Proceedings of the 2020 IEEE European Technology and Engineering Management Summit, E-TEMS, Dortmund, Germany, 5–7 March 2020. [Google Scholar]
- Eccarius, T.; Lu, C.-C. Adoption intentions for micro-mobility—Insights from electric scooter sharing in Taiwan. Transp. Res. Part D Transp. Environ. 2020, 84, 102327. [Google Scholar] [CrossRef]
- Gössling, S. Integrating e-scooters in urban transportation: Problems, policies, and the prospect of system change. Transp. Res. Part D Transp. Environ. 2020, 79, 102230. [Google Scholar] [CrossRef]
- Burchart-Korol, D.; Folęga, P. Impact of road transport means on climate change and human health in poland [Wpływ transportu drogowego na zmiany klimatu i zdrowie ludzkie w polsce]. Promet Traffic Transp. 2019, 31, 195–204. [Google Scholar] [CrossRef]
- Tampubolon, H.; Yang, C.-L.; Chan, A.S.; Sutrisno, H.; Hua, K.-L. Optimized capsnet for traffic jam speed prediction using mobile sensor data under urban swarming transportation. Sensors 2019, 19, 5277. [Google Scholar] [CrossRef] [PubMed]
- Malik, B.Z.; Rehman, Z.U.; Khan, A.H.; Akram, W. Women’s mobility via bus rapid transit: Experiential patterns and challenges in Lahore. J. Transp. Health 2020, 17, 100834. [Google Scholar] [CrossRef]
- Mourao, P.R.; Retamiro, W. Community development banks (CDB): A bibliometric analysis of the first 2 decades of scientific production. Environ. Dev. Sustain. 2021, 23, 477–493. [Google Scholar] [CrossRef]
- Zyoud, S.H.; Zyoud, A.H. Coronavirus disease-19 in environmental fields: A bibliometric and visualization mapping analysis. Environ. Dev. Sustain. 2020, 23, 8895–8923. [Google Scholar] [CrossRef]
- Marcis, J.; Bortoluzzi, S.C.; de Lima, E.P.; da Costa, S.E.G. Sustainability performance evaluation of agricultural cooperatives’ operations: A systemic review of the literature. Environ. Dev. Sustain. 2019, 21, 1111–1126. [Google Scholar] [CrossRef]
- Orimoloye, I.R.; Ololade, O.O. Global trends assessment of environmental health degradation studies from 1990 to 2018. Environ. Dev. Sustain. 2021, 23, 3251–3264. [Google Scholar] [CrossRef]
- Garcia-Sierra, M.; Miralles-Guasch, C.; Martínez-Melo, M.; Marquet, O. Empirical analysis of travellers’ routine choice of means of transport in Barcelona, Spain. Transp. Res. Part F Traffic Psychol. Behav. 2018, 55, 365–379. [Google Scholar] [CrossRef]
- Marquet, O.; Miralles-Guasch, C. City of Motorcycles. On how objective and subjective factors are behind the rise of two-wheeled mobility in Barcelona. Transp. Policy 2016, 52, 37–45. [Google Scholar] [CrossRef]
- Afukaar, F.; Damsere-Derry, J.; Peters, K.; Starkey, P. Rural Transport Services Indicators: Using a new mixed-methods methodology to inform policy in Ghana. Transp. Res. Interdiscip. Perspect. 2019, 3, 100074. [Google Scholar] [CrossRef]
- Suatmadi, A.Y.; Creutzig, F.; Otto, I.M. On-demand motorcycle taxis improve mobility, not sustainability. Case Stud. Transp. Policy 2019, 7, 218–229. [Google Scholar] [CrossRef]
- Guillen, M.D.; Ishida, H.; Okamoto, N. Is the use of informal public transport modes in developing countries habitual? An empirical study in Davao City, Philippines. Transp. Policy 2013, 26, 31–42. [Google Scholar] [CrossRef]
- Lumbreras, J.; Guijarro, A.; López, J.M.; Rodríguez, E. Methodology to quantify the effect of policies and measures in emission reductions from road transport. WIT Trans. Built Environ. Urban Transp. XV 2009, 107, 565–574. [Google Scholar] [CrossRef]
- Han, J.; Bhandari, K.; Hayashi, Y. Assessment of policies toward an environmentally friendly urban transport system: Case study of Delhi, India. J. Urban Plan. Dev. 2010, 136, 86–93. [Google Scholar] [CrossRef]
- Agarwal, A.; Ziemke, D.; Nagel, K. Bicycle superhighway: An environmentally sustainable policy for urban transport. Transp. Res. Part A Policy Pract. 2020, 137, 519–540. [Google Scholar] [CrossRef]
- De Bortoli, A.; Christoforou, Z. Consequential LCA for territorial and multimodal transportation policies: Method and application to the free-floating e-scooter disruption in Paris. J. Clean. Prod. 2020, 273, 122898. [Google Scholar] [CrossRef]
- Mbandi, A.M.; Böhnke, J.R.; Schwela, D.; Vallack, H.; Ashmore, M.R.; Emberson, L. Estimating on-road vehicle fuel economy in Africa: A case study based on an urban transport survey in Nairobi, Kenya. Energies 2019, 12, 1177. [Google Scholar] [CrossRef]
- Santucci, M.; Pieve, M.; Pierini, M. Electric L-category Vehicles for Smart Urban Mobility. Transortation Res. Procedia 2016, 14, 3651–3660. [Google Scholar] [CrossRef]
- Hwang, J.J. Sustainable transport strategy for promoting zero-emission electric scooters in Taiwan. Renew. Sustain. Energy Rev. 2010, 14, 1390–1399. [Google Scholar] [CrossRef]
- Severengiz, S.; Finke, S.; Schelte, N.; Forrister, H. Assessing the Environmental Impact of Novel Mobility Services using Shared Electric Scooters as an Example. Procedia Manuf. 2020, 43, 80–87. [Google Scholar] [CrossRef]
- Aguiléra, A.; Grébert, J. Passenger transport mode share in cities: Exploration of actual and future trends with a worldwide survey. Int. J. Automot. Technol. Manag. 2014, 14, 203–216. [Google Scholar] [CrossRef]
- Romero, A.; Tasciotti, L.; Acosta, F. Means of transportation choice for the residents of Villavicencio, Colombia: A quantitative analysis. Transp. Res. Part F Traffic Psychol. Behav. 2017, 44, 134–144. [Google Scholar] [CrossRef]
- Airy, A.; Patil, G. Is India financing urban transport in the right direction. Int. J. Innov. Technol. Explor. Eng. 2019, 8, 142–147. [Google Scholar] [CrossRef]
- Franco, S.; Mandla, V.R. Analysis of road transport energy consumption and emissions: A case study. Int. J. Energy Sect. Manag. 2014, 8, 341–355. [Google Scholar] [CrossRef]
- Recasens-Alsina, M. Challenges for sustainable urban mobility in Barcelona [Desafíos para una movilidad sostenible: Barcelona]. Ciudad. Territ. Estud. Territ. 2020, 52, 263–276. [Google Scholar] [CrossRef]
- Ruhé, M.; Thamm, H.-P.; Fornauf, L.; Lorbacher, M.R. GIS based urban design for sustainable transport and sustainable growth for two-wheeler related mega cities like HANOI. In Proceedings of the 13th International Conference, ICCSA 2013, Ho Chi Minh City, Vietnam, 24–27 June 2013; Springer: Berlin/Heidelberg, Germany, 2013; pp. 452–465. [Google Scholar] [CrossRef]
- Basbas, S.; Oikonomou, A.; Politis, I. The role of on-street urban parking schemes for power two wheels in sustainable mobility. WIT Trans. Ecol. Environ. 2008, 117, 435–444. [Google Scholar] [CrossRef]
- Simha, P. Disruptive innovation on two wheels: Chinese urban transportation and electrification of the humble bike. Period. Polytech. Transp. Eng. 2016, 44, 222–227. [Google Scholar] [CrossRef]
- Zhu, R.; Zhang, X.; Kondor, D.; Santi, P.; Ratti, C. Understanding spatio-temporal heterogeneity of bike-sharing and scooter-sharing mobility. Comput. Environ. Urban Syst. 2020, 81, 101483. [Google Scholar] [CrossRef]
- McKenzie, G. Urban mobility in the sharing economy: A spatiotemporal comparison of shared mobility services. Comput. Environ. Urban Syst. 2020, 79, 101418. [Google Scholar] [CrossRef]
- Schnieder, M.; West, A. Evaluation of alternative battery charging schemes for one-way electric vehicle smart mobility sharing systems based on real urban trip data. In Proceedings of the 5th International Forum on Research and Technologies for Society and Industry: Innovation to Shape the Future, Florence, Italy, 9–12 September 2019; pp. 296–301. [Google Scholar]
- United Nations Transforming Our World: The 2030 Agenda for Sustainable Development. Available online: https://www.un.org/ga/search/view_doc.asp?symbol=A/RES/70/1&Lang=E (accessed on 5 June 2021).
- Jung, J.; Petkanic, P.; Nan, D.; Kim, J.H. When a Girl Awakened the World: A User and Social Message Analysis of Greta Thunberg. Sustainability 2020, 12, 2707. [Google Scholar] [CrossRef]
- International Energy Agency Transport: Improving the Sustainability of Passenger and Freight Transport. Available online: https://www.iea.org/topics/transport (accessed on 1 September 2021).
- UN ONU Propone Sistemas de Transporte Sostenibles 2016. Available online: https://news.un.org/es/story/2016/10/1367681 (accessed on 12 January 2021).
- CEPAL Conectividad de Transporte e Implementación de ODS Relacionados con el Transporte en Países sin Litoral y de Tránsito. Available online: https://www.cepal.org/es/proyectos/conectividad-transporte-implementacion-ods-relacionados-transporte-paises-sin-litoral (accessed on 5 June 2021).
- World Bank Sustainable Mobility for the 21st Century. Available online: https://www.worldbank.org/en/news/feature/2017/07/10/sustainable-mobility-for-the-21st-century (accessed on 12 June 2021).
- European Comission Sustainable Transport. What do We Want to Achieve? Available online: https://ec.europa.eu/transport/themes/sustainable_en (accessed on 9 June 2021).
- Park, C.K.; Park, J.Y.; Choi, S. Emerging clean transportation technologies and distribution of reduced greenhouse gas emissions in Southern California. J. Open Innov. Technol. Mark. Complex. 2017, 3, 8. [Google Scholar] [CrossRef]
Publisher’s Note: MDPI stays neutral with regard to jurisdictional claims in published maps and institutional affiliations. |
© 2021 by the authors. Licensee MDPI, Basel, Switzerland. This article is an open access article distributed under the terms and conditions of the Creative Commons Attribution (CC BY) license (https://creativecommons.org/licenses/by/4.0/).

