Article

Impact of Oil Palm Empty Fruit Bunch Biochar Enriched with Chicken Manure Extract on Phosphorus Retention in Sandy Soil

Department of Land Management, Faculty of Agriculture, Universiti Putra Malaysia (UPM), Serdang 43400, Selangor, Malaysia
*
Author to whom correspondence should be addressed.
Sustainability 2021, 13(19), 10851; https://doi.org/10.3390/su131910851
Submission received: 23 September 2020 / Revised: 13 October 2020 / Accepted: 13 October 2020 / Published: 29 September 2021

Abstract

:
A 45-day incubation and leaching experiments was conducted to determine the effect of different rates (0, 1, 2, 3, and 5 t ha−1) of enriched empty fruit bunches biochar (EEFB) and inorganic fertilizer (91 kg ha−1 triple superphosphate—TSP) on the availability and leaching losses of phosphorus from sandy soil (tin tailing soil). The treatments rates for the study were designated as T1—without fertilizer (control), T2—inorganic fertilizer treatment using TSP and T3, T4, T5, and T6, which refers to EEFB rate of 1, 2, 3, and 5 t ha−1, respectively. The enriched biochar was prepared by shaking biochar with chicken manure extract for 24 h. The addition of EEFB to the soils was found to increase pH of the soil compared to control and inorganic fertilizer treatment. After 45 days of incubation, the percentage increase in available P recorded in EEFB treatments were 1.6, 2.9, 2.8, and 4.1%, whereas for control treatment and inorganic fertilizer treatment, the available phosphorus was found to reduce by 10% and 83%, respectively. Loss of phosphorus via leaching in the soil was higher in EEFB treatments compared to control. However, the highest phosphorus leaching among all treatments in this study was recorded in inorganic fertilizer treatments. From the study, it was observed that biochar can be used to recapture phosphorus from chicken manure extract for transport to the soil, thereby reducing problems associated with chicken manure application.

1. Introduction

Phosphorus (P) is a limiting nutrient in the productivity of many agricultural crops. The function of P is associated with the metabolism of the plant, cellular energy transfer, respiration, photosynthesis, and growth and development of roots [1]. The excessive use of phosphate fertilizers either in mineral or organic forms such as (chicken manure) leads to the loss of phosphorus by runoff and leaching from the soil [2], which in turn, can cause the eutrophication of water bodies [3] and elevated bacterial or pathogen levels in nearby lakes and rivers [4]. Most soils of the humid tropics especially sandy soils are low in organic matter [5]. This results in low cation exchange capacity (CEC) and nutrient reserves, coupled with the problems of leaching and runoff [3,6]. Low nutrient availability and low productivity of this soil is further worsened by immobilization of phosphorus via specific adsorption by Fe and Al oxides, to form Fe-P or Al-P compound [7].
Biochar has long been used as a soil amendment—the Terra Preta de Indio soils of Brazil are an example of the use of charcoal to increase soil fertility [8]—and limit nutrients losses via leaching. Studies have shown that biochar addition is a direct source of soluble P, as it is capable of modifying soil pH, thus amending P complexing metals (Al3+, Fe3+, Fe2+, Ca2+) [9,10] and increasing the release of P from soil organic matter and organic residues by inducing an increase in phosphatase enzyme activity [11,12,13]. Conversely, it was observed that yield decreases after the addition of biochar to the soil [14]. Lentz and Ippolito [15] reported that biochar reduced nutrient (N, S, Mn, and Cu) availability or uptake. In addition, it was found that biochar does not contain sufficient amount of nutrients for plant growth [16]. Biochar can absorb many inorganic nutrients, e.g., NH4+, HPO42–, and H2PO4 as well as nutrients in organic fractions such as dissolved organic carbon [17]. Thus, possible modification of biochar for soil applications to adsorb essential nutrients from manures or any wastes can be a means of increasing the economic value of biochar, thereby creating a greater margin of return on the cost of production. Chicken manure is rich in essential plant nutrients such as N, P, K, Ca, Mg, and S [18]. However, the limitations associated with the use of raw chicken manure prompts the need to opt for other alternative means that offer better utilization efficiency to crops in the field.
The extraction of phosphorus from chicken manure may potentially address the above-mentioned constraints while improving the cation exchange capacity (CEC) in soil and phosphorus utilization by reducing their loss via leaching. Guohua et al. [19] reported that deionized water, NaHCO3, NaOH, and HCl, respectively, extracted 49%, 19%, 5%, and 25% of the total P in the poultry manure sample. Many studies attest that biochar can adsorb phosphate from solution and function in the gradual release of the adsorbed P, thus reducing the loss of phosphate [20,21,22]. Therefore, the use of enriched biochar is aimed at creating a new strategy that can provide phosphorus in forms available for plant uptake, which can supplement or supersede mineral phosphorus fertilizers, thereby reducing the loss of plant-available phosphorus from the soil.
This study hypothesizes that biochar can be used to capture excess P (phosphorus) from chicken manure extract and, transport the captured phosphorus to low fertility soils, thus, reducing phosphorus loss from chicken manure. This study was conducted to assess the effect of empty fruit bunch biochar (EFB) enriched with phosphorus from chicken manure extract on P availability and leaching losses.

2. Materials and Methods

2.1. Biochar and Manure Source

The experiments in this study were conducted from February to April 2018 under aerobic leaching and incubation condition at the Department of Land Management, Faculty of Agriculture, Universiti Putra Malaysia (UPM). Oil palm empty fruit bunches (EFB) were produced by the Department of Bioprocess Technology, Faculty of Biotechnology and Biomolecular Sciences, University Putra Malaysia (UPM), through the carbonization of biomass under self-sustained temperature and exhaust gas flow in a pilot-scale brick reactor at an average carbonization temperature between 300 and 590 °C. The pH and EC of the EFB was measured at a ratio of 1:5 (volume: volume basis), according to the method of Singh et al. [23]. The CEC and exchangeable cations of the biochar was extracted using the shaking method (NH4OAc, pH 7) according to the method of Song and Guo [24]. The anion exchange capacity of biochar was measured according to the method of Mukherjee et al. [25]. The total carbon, total nitrogen, and ash content of the biochar was determined using the dry combustion method [24]. Dry matter and moisture content were measured according to the methods of John et al. [26]. Total nutrients were determined by wet digestion [27], using an atomic absorption spectrophotometer to measure the amount of K, Ca, and Mg in samples and an autoanalyzer (QuikChem® 8000 Series FIA+ System; Lachat Instruments, USA) for P. Chicken manure was collected from layers at the UPM poultry farm. The collected manure was air-dried and ground to pass through 2 mm mesh, after which they were kept in plastic bags and stored in a freezer at 4 °C.

2.2. Preparation of Chicken Manure Extract

Chicken manure extract was prepared by extracting manure with deionized water in triplicate, at the ratios (chicken litter dry weight equivalent to deionized water) of 1:200. The mixture was shaken at 150 rpm/min in a reciprocating shaker for 2 h at room temperature, followed by centrifugation at 2900 rpm for 20 min and filtration through a 0.45 µm membrane filter paper. The pH and EC of chicken manure were determined at a ratio of 1:2, while dry matter and moisture content were measured following the method of John et al. [26]. Total carbon and nitrogen were determined by a dry combustion technique using a LECO CR-412 carbon analyzer (LECO, Corporation, St. Joseph, MI, USA). Total P, K, Ca, Mg, and trace elements content of the chicken manure samples were extracted following the methods of John et al. [26]. Total P and water-extractable P were measured using the UV-visible spectrophotometer (Varian CARY 50 Probe, East Lyme, USA) operating at a wavelength of 882 nm while, K, Ca, Mg, and trace elements were measured using the Perkin Elmer A Analyst 400 Atomic Absorption Spectrometer.

2.3. Preparation of Enriched Biochar

In preparing enriched biochar, 0.25 g of biochar was added to 100 mL of chicken manure extract in the tubes, and the tubes were tightly closed. The tube containing the mixture was agitated for 24 h at room temperature (25 °C) on a rotary shaker at 150 revolutions per minute (rpm). The suspension was centrifuged at 4500 rpm for 30 min to separate the solid and liquid phases. This was followed by filtration through a 0.45 µm membrane filter paper. The enriched EFB biochar (EEFB) was dried at 40 °C.

2.4. Soil Sampling and Soil Physico-Chemical Analysis

The soil samples were collected at a depth of 0–30 cm through a systematic sampling method using shovel and auger. Soil samples were transported to the laboratory, where they were air-dried and sieved through a 2 mm pore size sieve and stored before use. The global positioning systems (GPS) points for the sampling locations are as follows: sandy tin-tailing soil (an ex-mining land with about 90% sand) collected from Dengkil, Selangor Darul Ehsan, Malaysia (2°52′53.54″ N 101°41′21.30″ E) located on the east coast of Peninsula Malaysia. The pH of the soil was measured using a digital pH meter (HI 2211 pH/ORP Meter HANNA, Woonsocket, RI, USA) at the ratio of 1:2.5 while, EC was determined at the ratio of 1:5 using a CON 700 EC meter (Eutech Instruments, USA). The CEC and exchangeable cations were determined using the shaking method (NH4OAc, pH 7.0) [24]. Total carbon and nitrogen in the soil were determined by dry combustion techniques, using LECO CR-412 Carbon Analyzer. The aqua regia method [28] was used to extract the total amount of nutrients (P, Fe, Na, As, Cu, Zn, Mn, and Pd) in the soil samples. The extracted solutions were afterwards analyzed for P using the UV-visible spectrophotometer (CARY 50 Probe, USA) at a wavelength of 882 nm. As, Cu, Zn, Mn, and Pb were measured using the inductively coupled plasma-optical emission spectrometry (Optima 8300, Norwalk, CT, USA, ICP-OES Spectrometer by Perkin Elmer, Waltham, MA, USA), while other nutrients such as the Fe and Na were determined using the atomic absorption spectrometer (Perkin Elmer; PE 500, USA). Available phosphorus was analyzed using Bray and Kurtz II method [29] followed by the colorimetric measurement (molybdenum blue assay) using UV-visible spectrophotometer (CARY 50 Probe, USA) at a wavelength of 882 nm. Soil particle size distribution was determined using the pipette method [30], while the soil bulk density was determined using the Core method [30].

2.5. Incubation Experiment

The incubation study involves a comparison between six treatments, which includes: control without fertilizer (T1); inorganic fertilizer of 91 kg ha−1 triple superphosphate (T2), and four rates of EEFB (1, 2, 3, and 5 t ha−1), designated as T3, T4, T5, and T6, respectively (Table 1). The experiment was designed as a completely randomized design (CRD). The EEFB treatments were thoroughly mixed with 20 g of soil in a plastic container and incubated at room temperature for 45 days. All the treatments were adjusted to 70% water holding capacity with deionized water. Sample weight was recorded on a weekly basis and when weight loss is observed, deionized water was added in drops, and the sample is gently agitated to maintain moisture content. The day the soil was mixed with EEFB or chemical fertilizer as respective treatments were considered Day 0 (2 days after field sampling); thereafter, soil samples were collected on Day 1, 5, 10, 15, 25, 35, and 45 of incubation for chemical analyses.

2.6. Leaching Experiment

For the leaching experiment, glass leaching tubes were used with a Whatman cotton filter Aid Ashless Floc, which was placed at the bottom of the tubes and the double ring filter paper was placed on top of the soil. Different rates of EEFB and inorganic fertilizer corresponding to each treatment were mixed thoroughly with 20 g of soils and added into respective leaching tubes. On the first day, 50 mL of deionized water was added to the treatments using a 25 mL dispenser (vitlab genius) (10 mL water at 10 min intervals). Water was added daily at soil field capacity, and the soil was allowed to drain completely. The same treatment and sampling time as mentioned above in the previous experiment was used. The day the soil was mixed with EEFB and chemical fertilizer for respective treatments was considered Day 0 (2 days after field sampling). Leachates were collected in plastic bottles placed at the bottom of the leaching tubes filtered through Whatman no. 42 paper. The leachates were filtered again and analyzed for soluble phosphorus. Available phosphorus was analyzed using the colorimetric method [31]. For color formation, 10 mL of the filtered leachate was pipetted into a 50 mL volumetric flask, then 8 mL of reagent B was added, and the solution was made up to volume (50 mL) with deionized water. The solution was agitated and left standing for 15 min for the blue color to form before the reading was measured using the UV-visible spectrophotometer (CARY 50 Probe, USA) at a wavelength of 882 nm. Standard solution of 0 to 1.0 ppm was used to prepare the P calibration curve.

2.7. Statistical Analyses

Data obtained from soil chemical analysis in the incubation and leaching study were analyzed using analysis of variance (ANOVA), while the significant means was separated using the Tukey’s honestly significant difference (HSD) test at the 5% probability level using the statistical analysis system (SAS) software version 9.3 (SAS Institute, Inc., Cary, NC, USA).

3. Results and Discussion

3.1. Chemical Characterization of Chicken Manure Solid and Liquid

The nutrient composition in chicken manure and chicken manure extract are shown in Table 2. The chicken manure (solid) has moderately alkaline pH (7.9–8.4), while the chicken manure extract (ratio 1:200) has slightly acidic pHs (6.1–6.5). The chicken manure (solid) has extremely high EC value of 14.7 dS m−1 compared to the chicken manure extract with EC value of 1.4 dS m−1. The change in pH and EC was as a result of dilution and hydrolysis. According to Aini et al. [32], the nutrients in the chicken manure were in the range of 1.33–3.76% N, 1.27–2.95% P, 1.08–3.14% K, 5.38–16.20% Ca, 0.53–1.32% Mg, 41–2165 ppm Cu, and Zn 28–670 ppm. From our analysis, N, P, K, and Mg were within the range reported in other literature [32]. The Ca content (3.0–9.8%) in the manure collected at the UPM Poultry Farm was higher than the values cited in other studies [32]. This was probably due to the high Ca content in feed material of chicken, which is usually required in high amount to help in the production of eggs. Rodriguez [33] reported that calcium is an important nutrient for laying chicken. It is necessary for the proper eggshell formation and also needed to maintain skeletal integrity. For these reasons’ calcium is usually added to the feeds of laying chicken.

3.2. Chemical Characterization of Biochar and Enriched Biochar

The elemental composition for EFB and EEFB biochar is listed in Table 3. Both EFB and EEFB biochars have strongly alkaline pH (8.5–9) with pH value of enriched EFB biochar slightly lower than EFB biochar. The EFB biochar has extremely high EC value of 2.98 dS m−1 compared to enriched EFB biochar with EC value of 0.49 dS m−1. The biochar has a high cation exchange capacity of 73.7 (cmol (+) kg−1) as well as a high anion exchange capacity (AEC) 40.24 of (cmol (−) kg−1). All the nutrients concentration increased after the enrichment process except for potassium. Decreased K in the enriched biochar may be due to the replacement of K with other cations (Ca, Mg, Cu and Zn) in the chicken manure extract during the enrichment process.

3.3. Soil Physico-Chemical Characterization

The physico-chemical characteristic of the soils used in the experiment is presented in Table 4. The soil pH was very acidic with pHw value of 4.31 [32]. According to Hazelton and Murphy [34], electrical conductivity (EC) of the soil can be described as non-saline with values less 2 dS m−1. The CEC of the sandy soil is very low with value of 0.66 (cmol (+) kg−1), while the total N was low with value of N 0.07%. Similarly, the value of total C, exchangeable K, Ca, and Mg recorded in both soils can be described as very low [34]. According to Hazelton and Murphy [34], the total and available P can be described as high. The amount of Cu in the soil was within the range of 2–100 mg.kg−1, while Zn was low (<20 mg.kg−1). Low levels of aluminum and iron were detected in the soil.

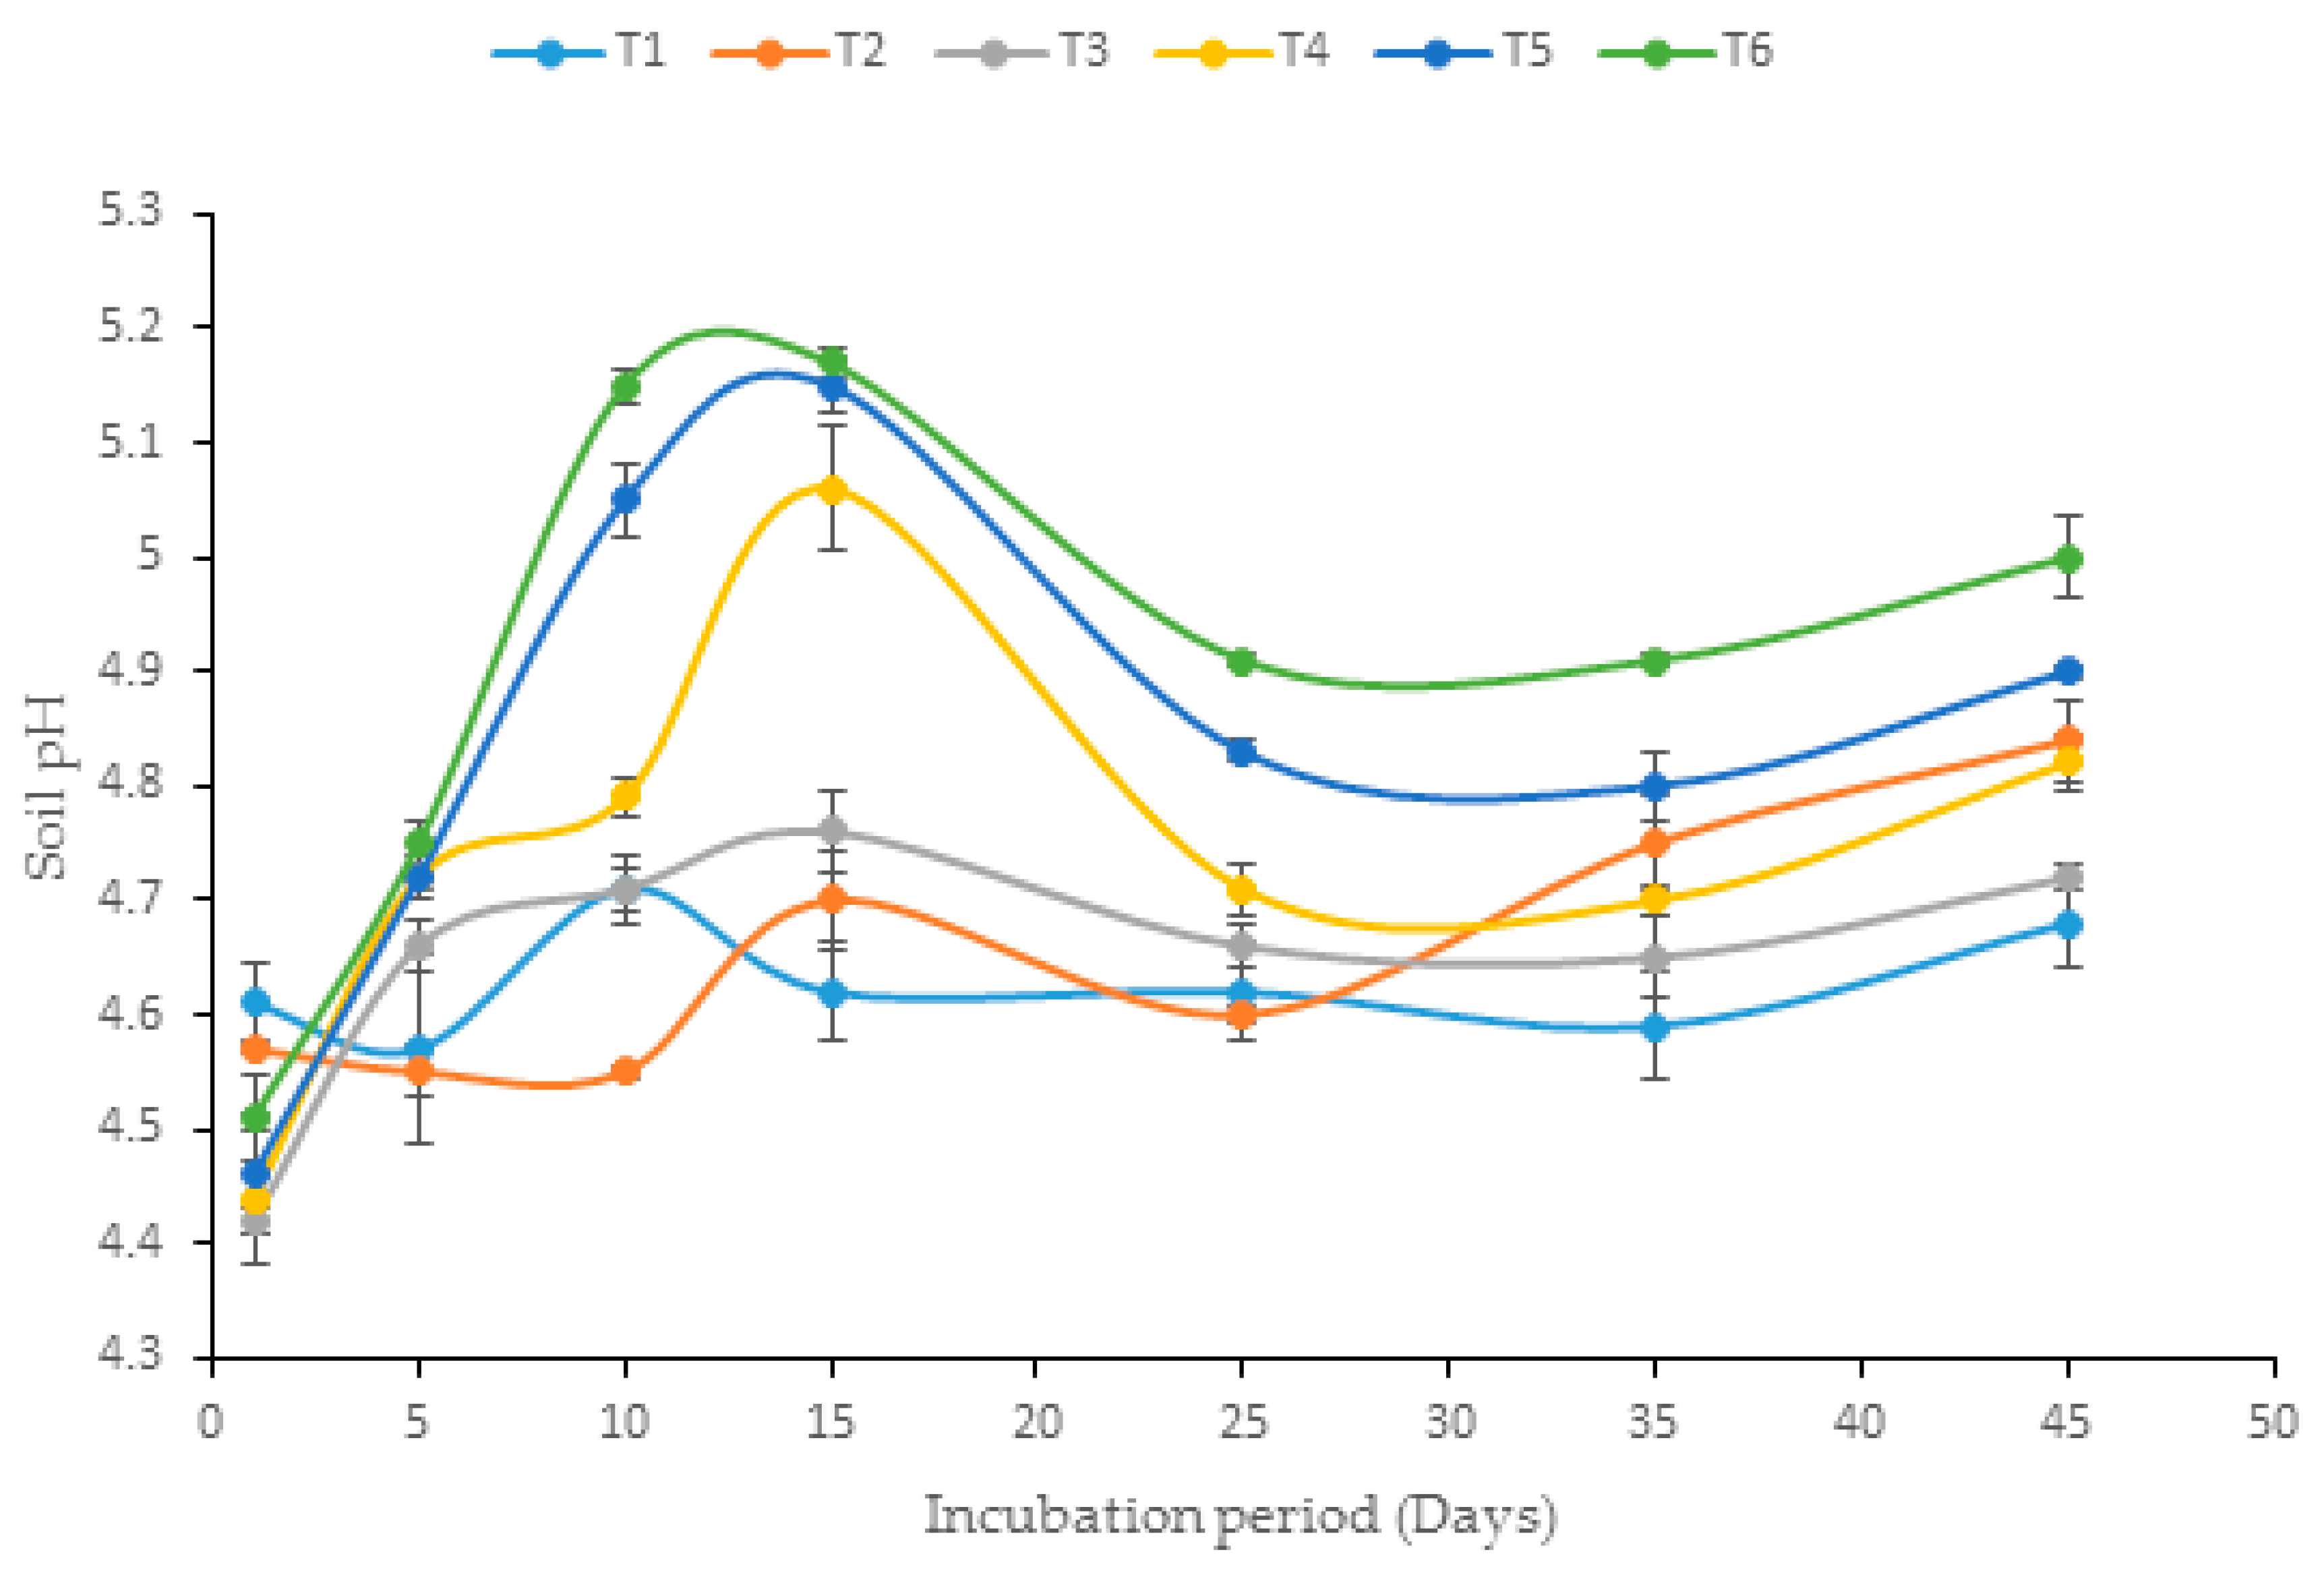
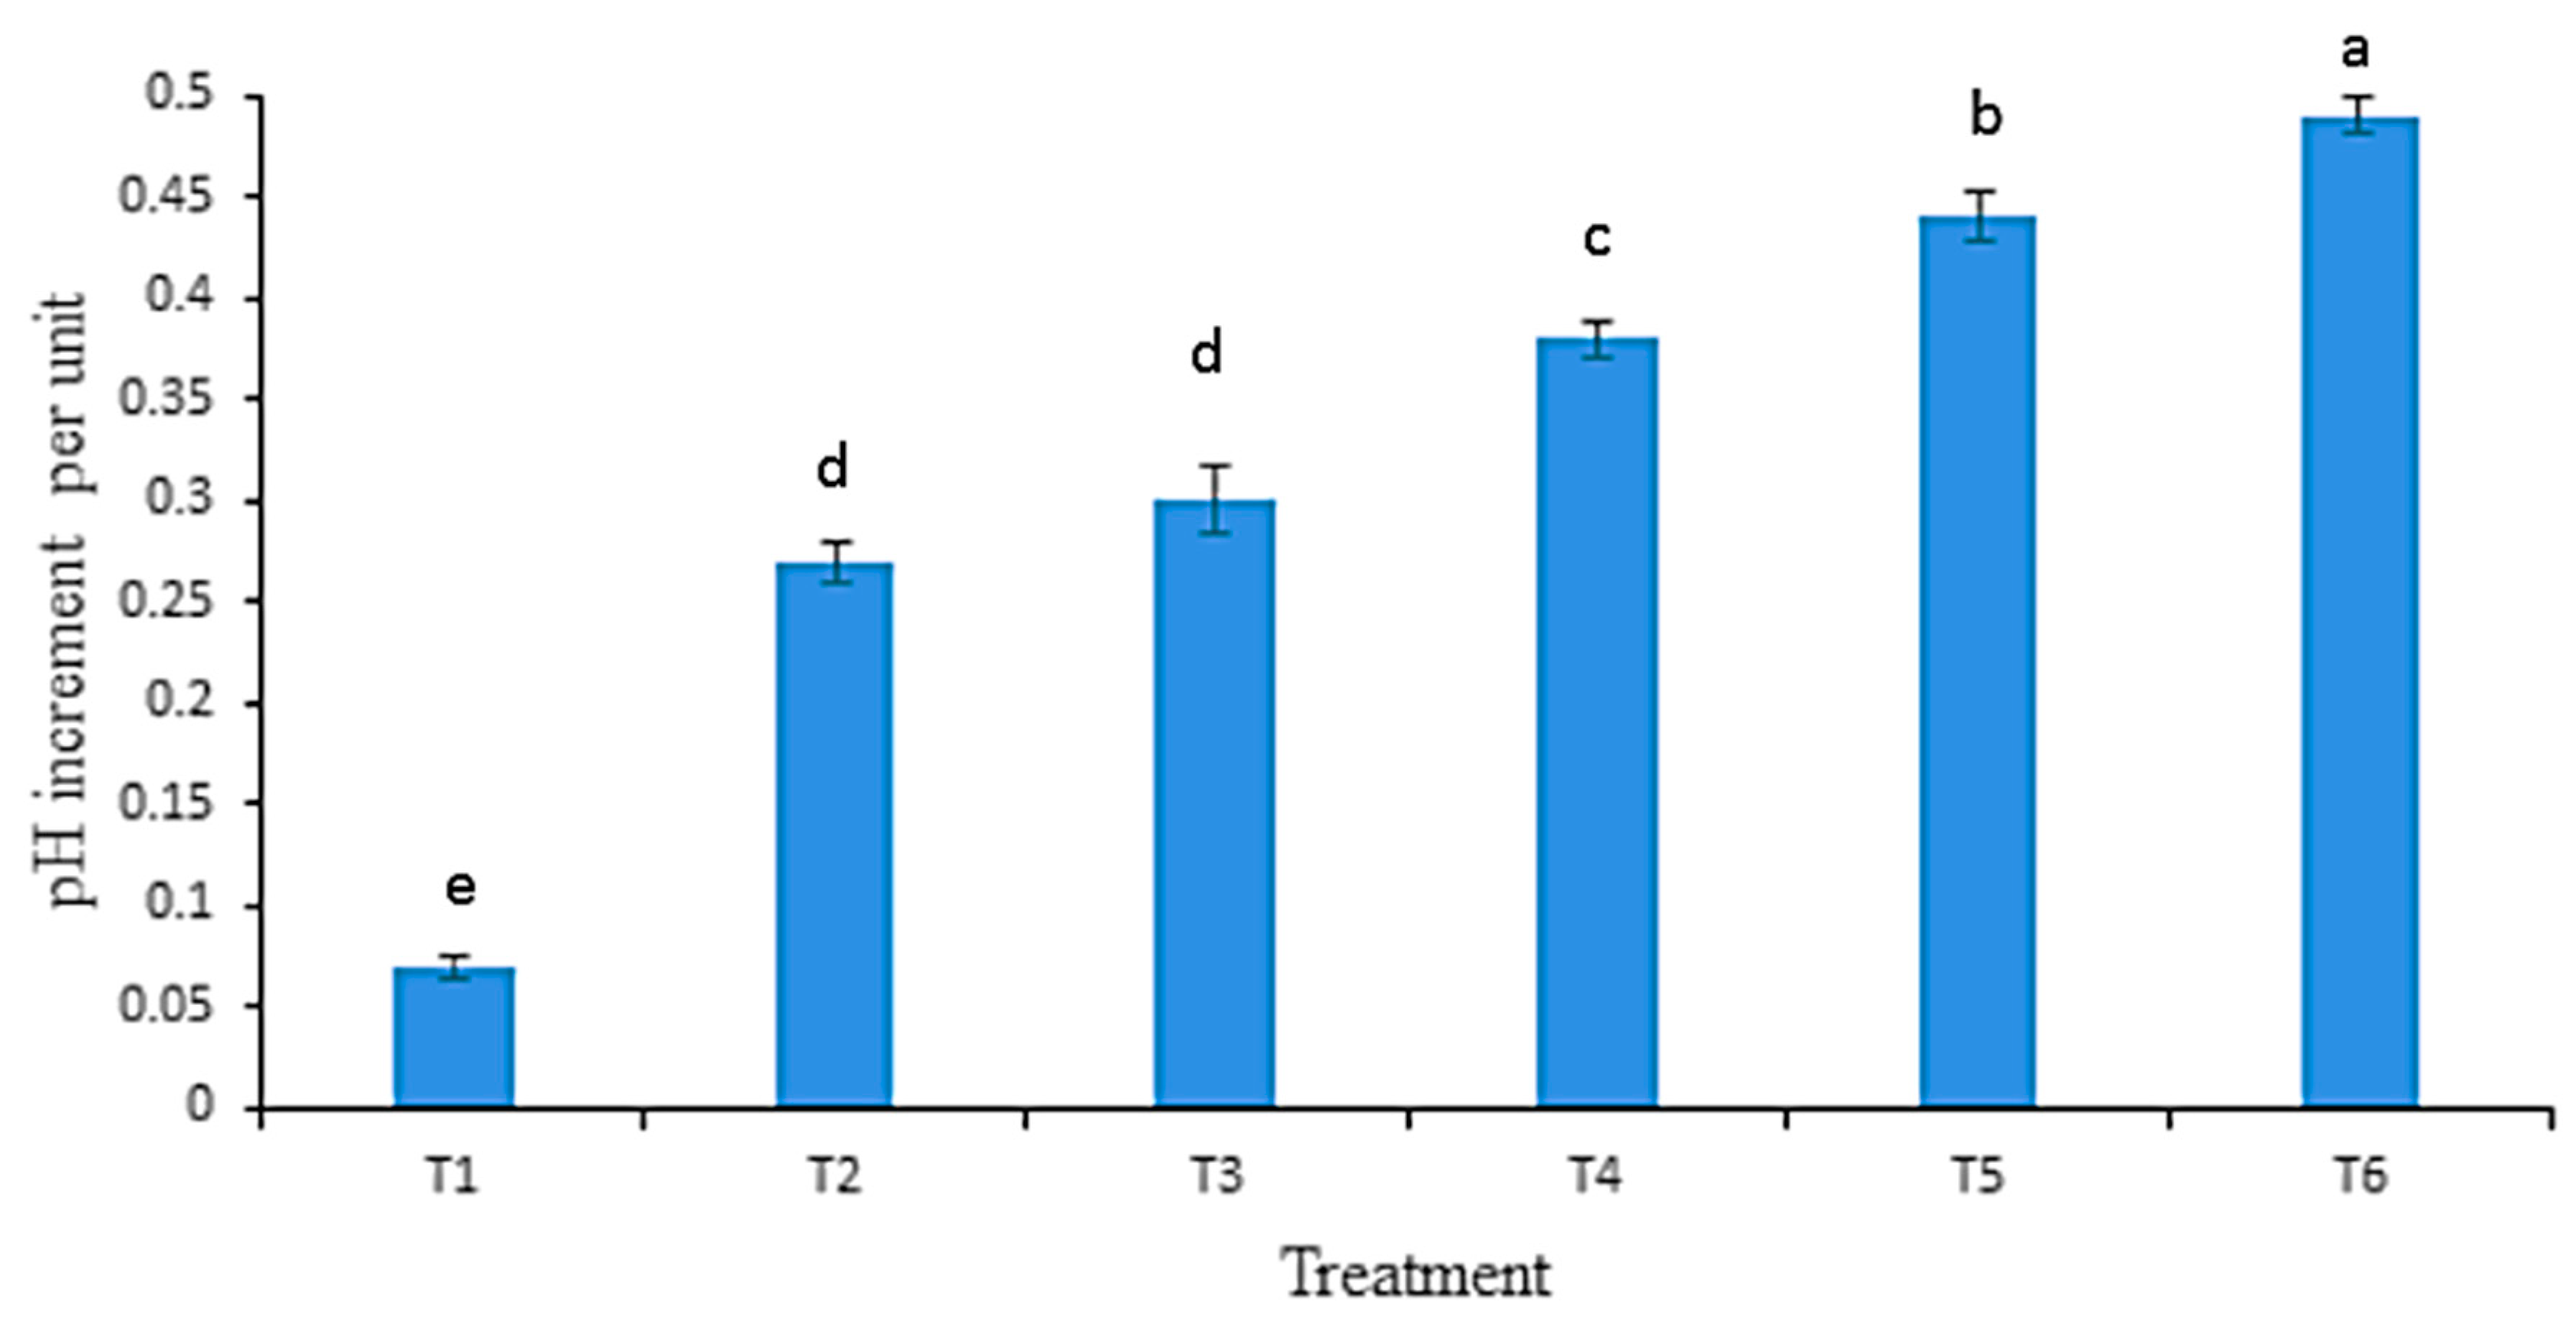
3.4. Influence of Biochar Enrichment on Soil pH

The pH of soil was increased with increasing EEFB rates, the results shows that there were significant differences between the pH values of EEFB treatments (T3, T4, T5, and T6), T1 (control) and T2 (inorganic fertilizer), as shown in Table 3. The highest pH was recorded between Day 10–15 of the incubation experiment, and this decreased gradually until Day 35 when an upward trend in pH was recorded until the end of the experiment (Figure 1). The increment in soil pH between the initial day and the end incubation experiment (Day 45) for T1, T2, T3, T4, T5, and T6 were 0.07, 0.27, 0.3, 0.38, 0.44, and 0.49 unit, respectively (Figure 2). Generally, it was observed that the percentage increment in soil pH was higher in EEFB treatments compared to other treatments. The increase in soil pH observed in this study can be attributed to the liming property of biochar, which results from its alkalinity and presence of oxygen-containing functional groups in the material [35]. The lime (present in the form of carbonate) usually reacts with toxic aluminum available in soil solution by converting them into more inert form (hydroxyl-aluminum polymerization) through a hydrolysis reaction thereby increasing the pH of the soil [36]. This observation was also reported by Berek and Hue [37] and Xu et al. [38] in their respective study, where the observed increase in soil pH and reduction in soil was attributed to the alkaline nature of biochar. The observed increase in soil pH in the soil may also result from increased ash accretion and the accompanying dissolution of hydroxides and carbonates [39,40]. The carbonate-carbon (C) is an integral part of biochar-C, contributing to the liming properties of the material. Biochar contains alkaline substances (carbonates and organic anions from acidic functional groups) and has high pH [41,42], therefore the addition of biochar has a neutralization effect on soil acidity thereby increasing soil pH [37].
The decrease in soil pH observed in EFFB treatments from 15 days up to 35 days when an upward trend was later recorded is indicative of the effect of biochar on soil microbial biomass. Biochar has the ability to make pH favorable for indigenous microorganism proliferation and this result in enhanced degradation of organic matter to release acids [43]. These acids may lower the pH of the soil. Furthermore, the addition of biochar improves aeration in the soil, which causes enhanced activities of nitrifying bacteria that converts ammonia to nitrate. This is associated with the release of two hydrogen molecules and a reduction in pH of the soil [44].

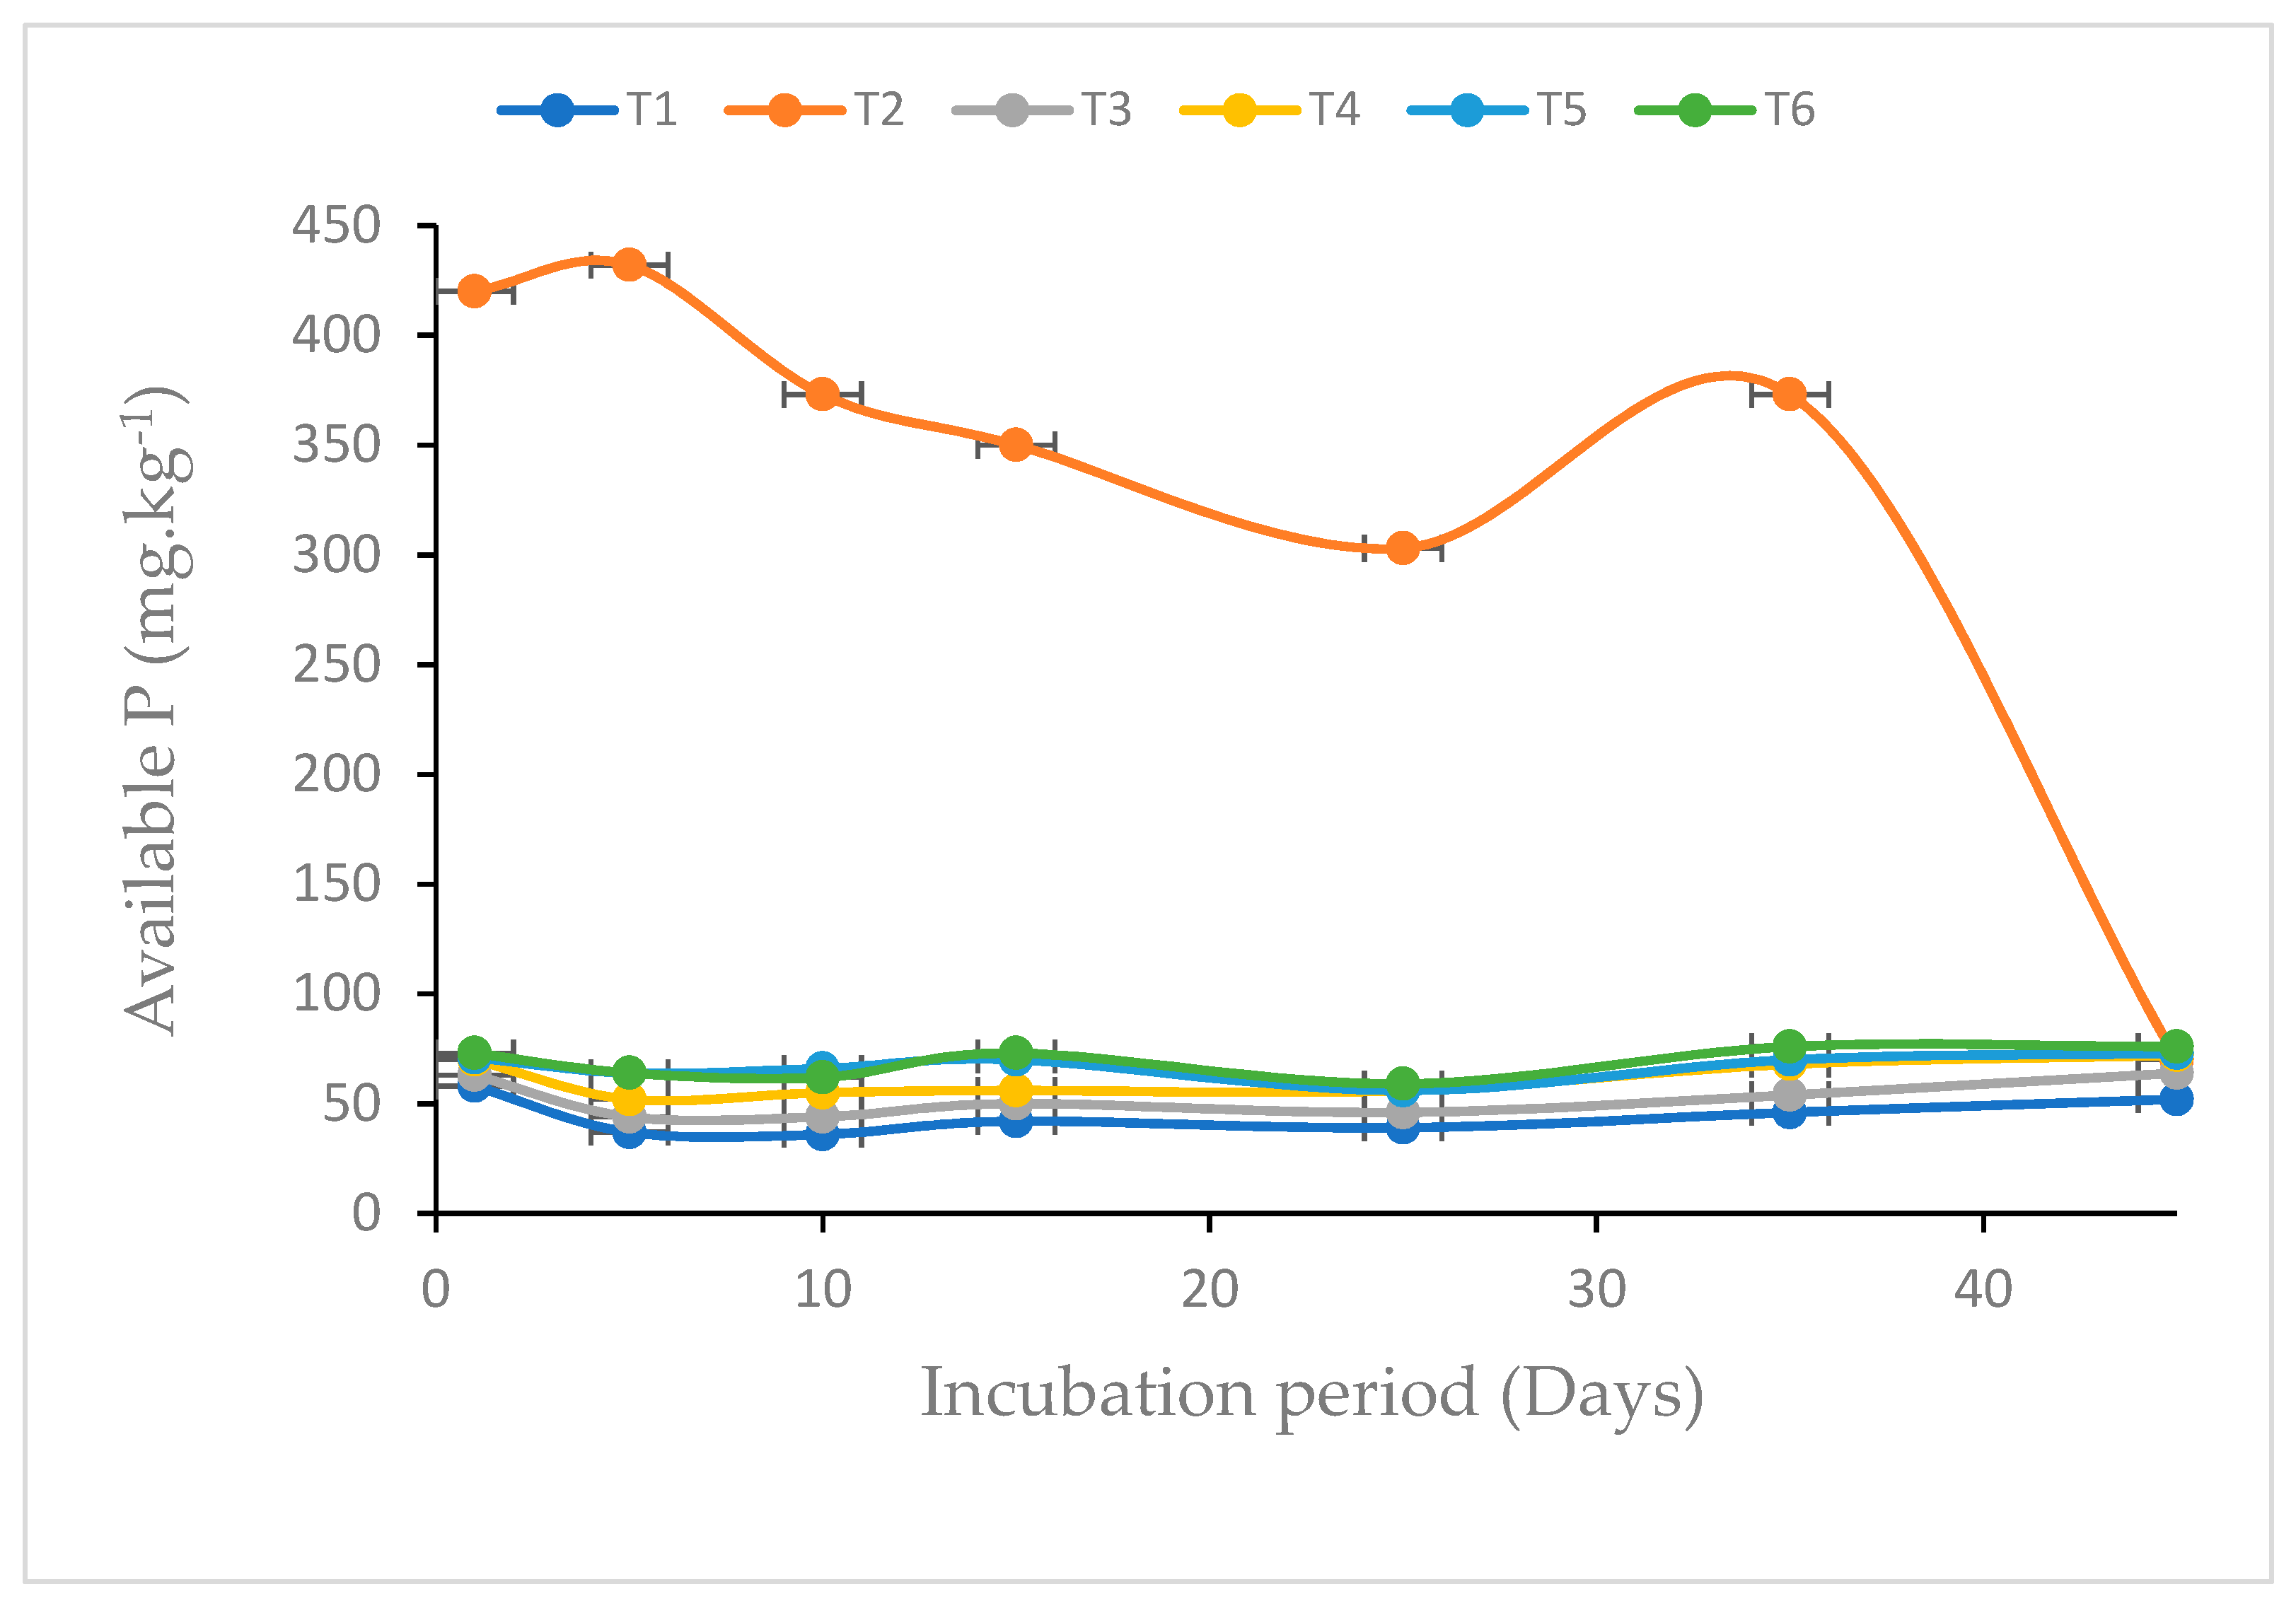
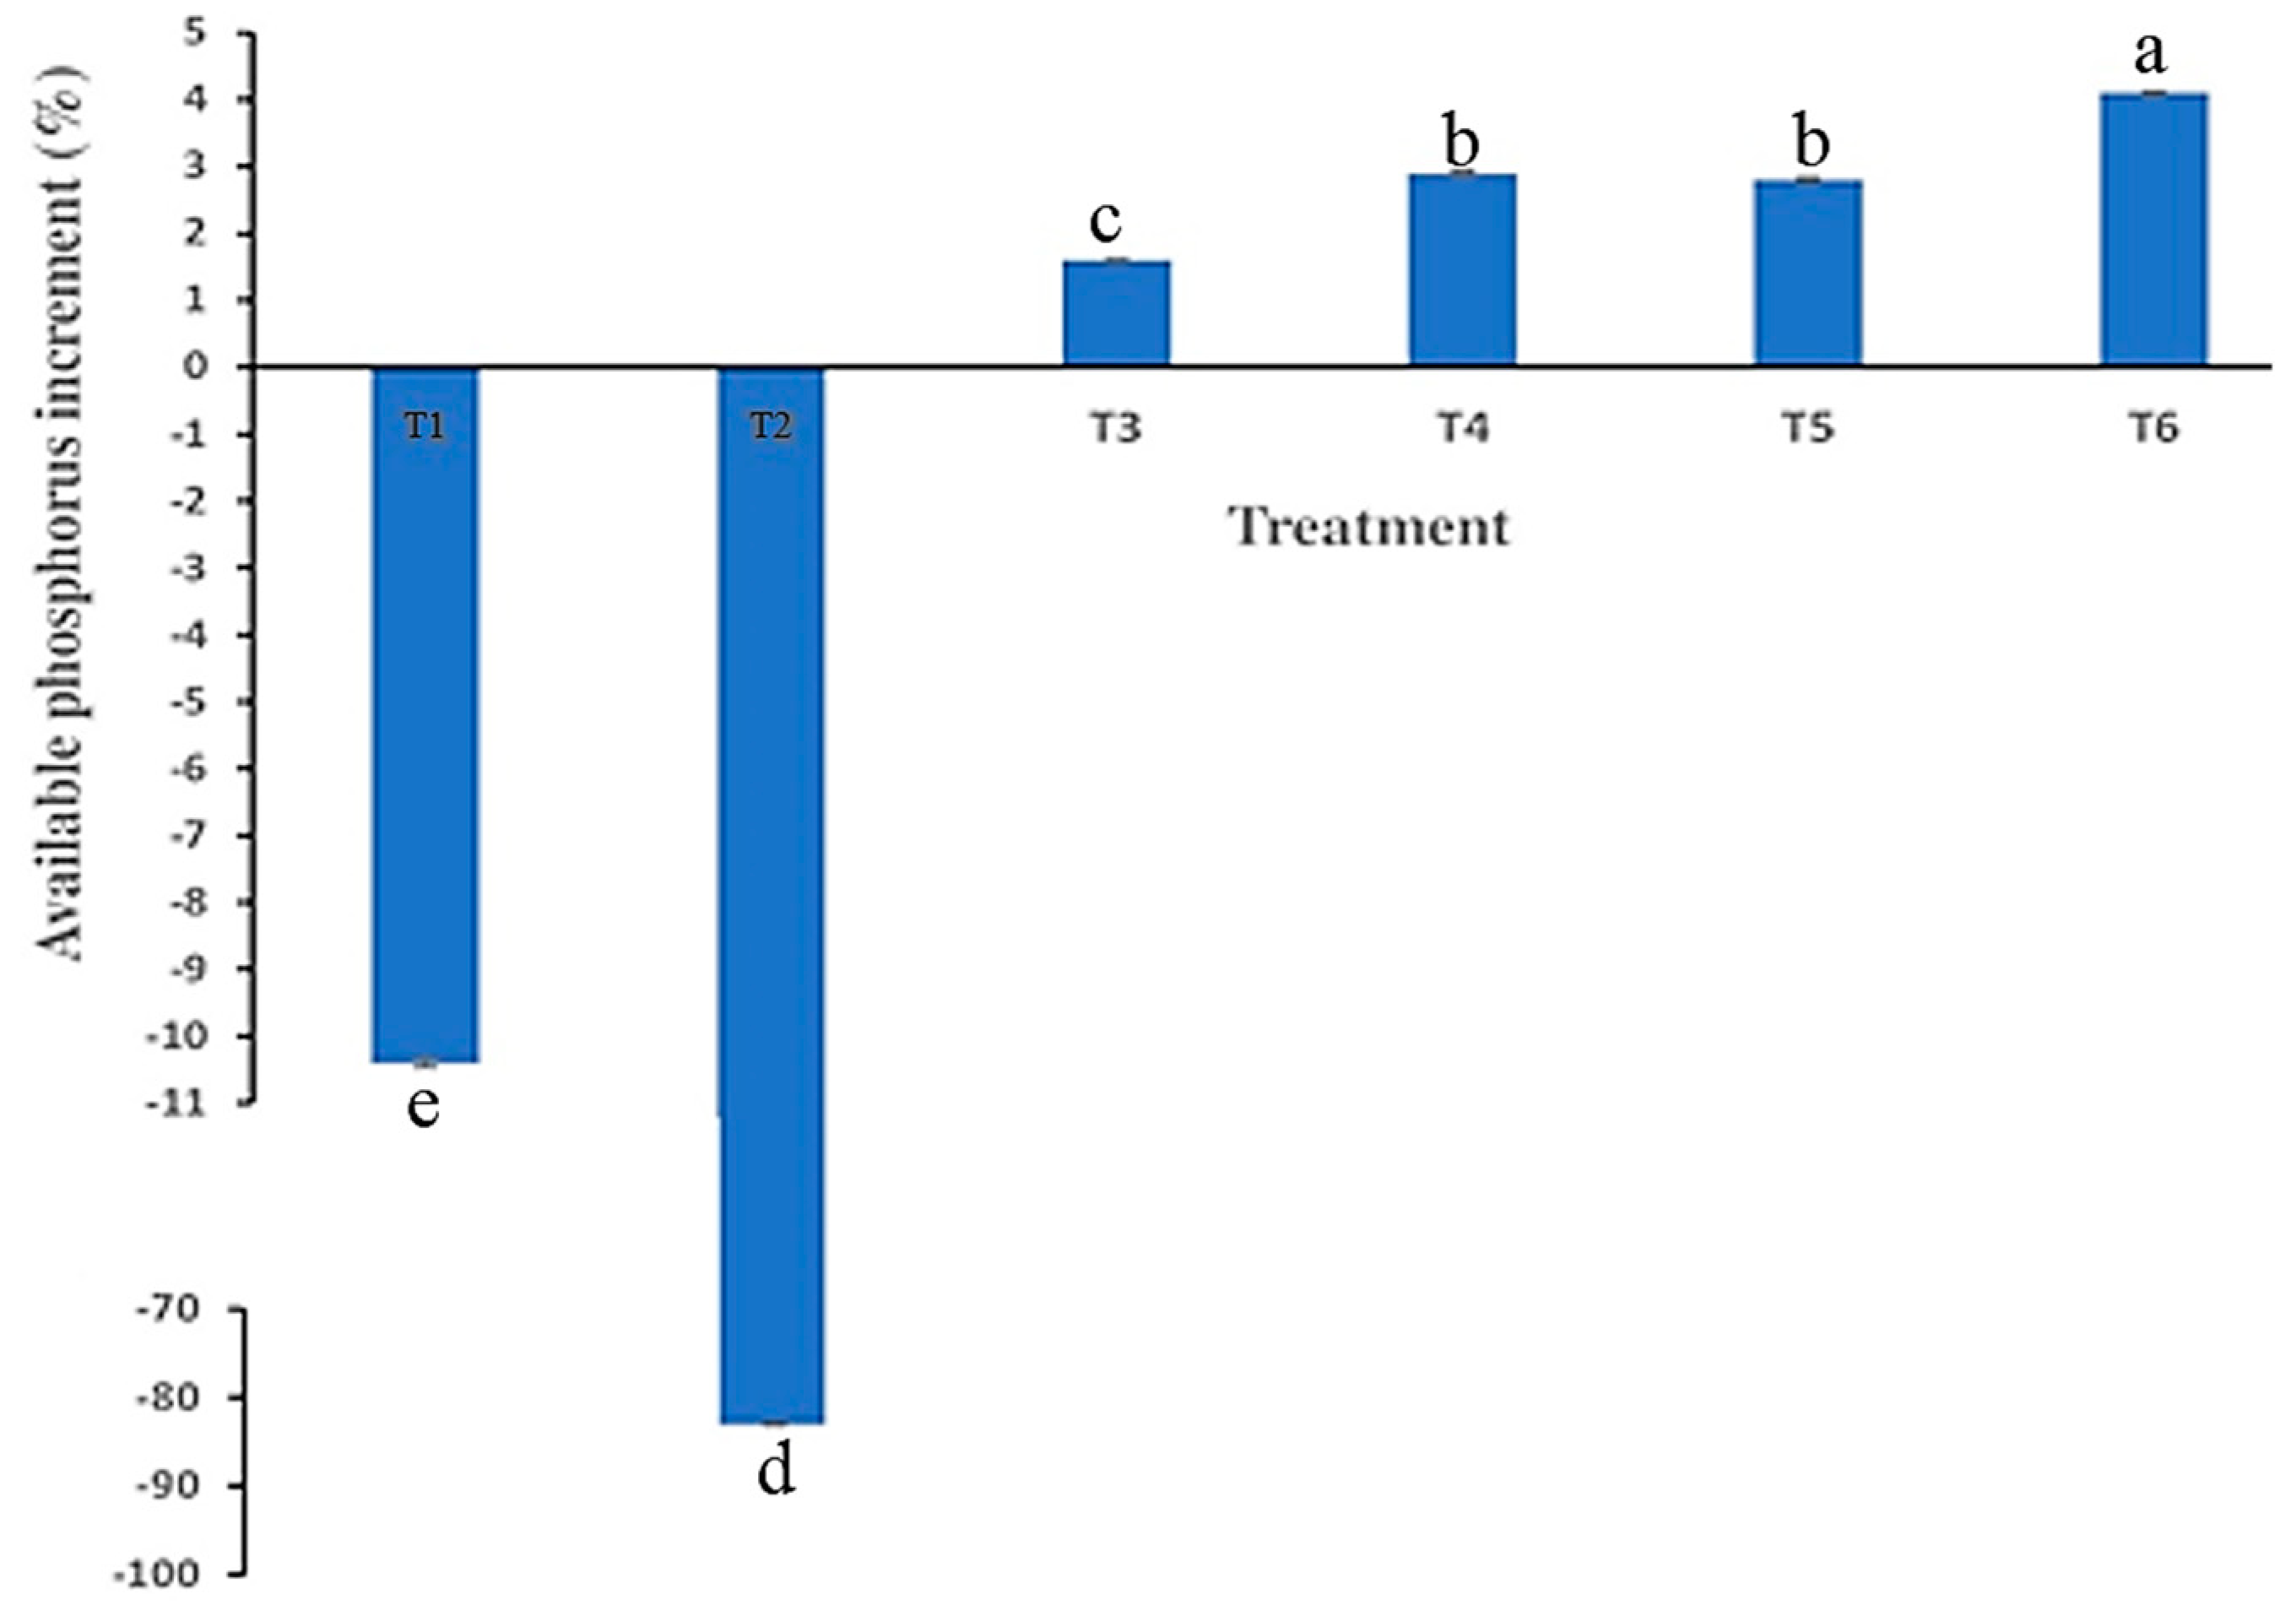
3.5. Influence of Biochar Enrichment on Phosphorus Availability

The addition of enriched biochar led to an initial decrease in P availability due to phosphorus immobilization and this decline continued until Day 10, after which P increased until it reached its highest peak at Day 15. The available P decline upon the addition of phosphorus enriched biochar was attributed to the immobilization of inorganic phosphate by soil microbes. Under this process, the phosphorus available in the soil upon the addition of treatment is acted upon by microorganisms, such as mycorrhizal, who convert inorganic phosphate into organic forms for incorporation into their living cells [45]. The marked initial reduction in available P following the addition of biochar may also result from immobilization due to P strong sorption onto the biochar surface [40].
Phosphorus increase in the soil after Day 10 was thought to result from the mineralization process, which led to the release of P from EEFB treatments (T3, T4, T5, and T6). The phosphorus recorded in EFFB treatments were higher compared to control treatment (T1) during the incubation period.
As shown in Figure 3, the mineralization process started to decrease after 15 days until Day 25. This observation was thought to be due to the available quantity of Al (Table 4) in the soil, which favors phosphate reaction with Al oxides to form an insoluble compound, especially under acidic soil conditions [46]. As shown in Figure 1, during the period between 15–25 days, pH decrease was also recorded in the study, and this acidity condition will favor the activities of Fe and Al oxides in the soil, thus resulting in P fixation and hence the decrease in available P recorded in this period [46]. This decline was temporary as an increase in phosphorus was thereafter observed after Day 25 in all the treatments except for T2 (inorganic fertilizer) where a slight increase in available P was observed on Day 35 after which the level of available P decrease until the end of the experiment. The percentage increase in available P for T3, T4, T5, and T6 at 45 days after incubation was 1.6, 2.9, 2.8, and 4.1%, respectively, while a reduction of 10.4% and 83% was observed in available P in control (T1) and inorganic fertilizer treatments T2 (Figure 4). Generally, the results indicate that the addition of EEFB to soil contributes to an increase in the available P contents in soil. This is in line with the study of Kizito et al. [40] where digestate-enriched biochar was used to provide nutrient to the soil. Hence, this supports our hypothesis on the possibility of using the EEFB as a slow-release fertilizer.

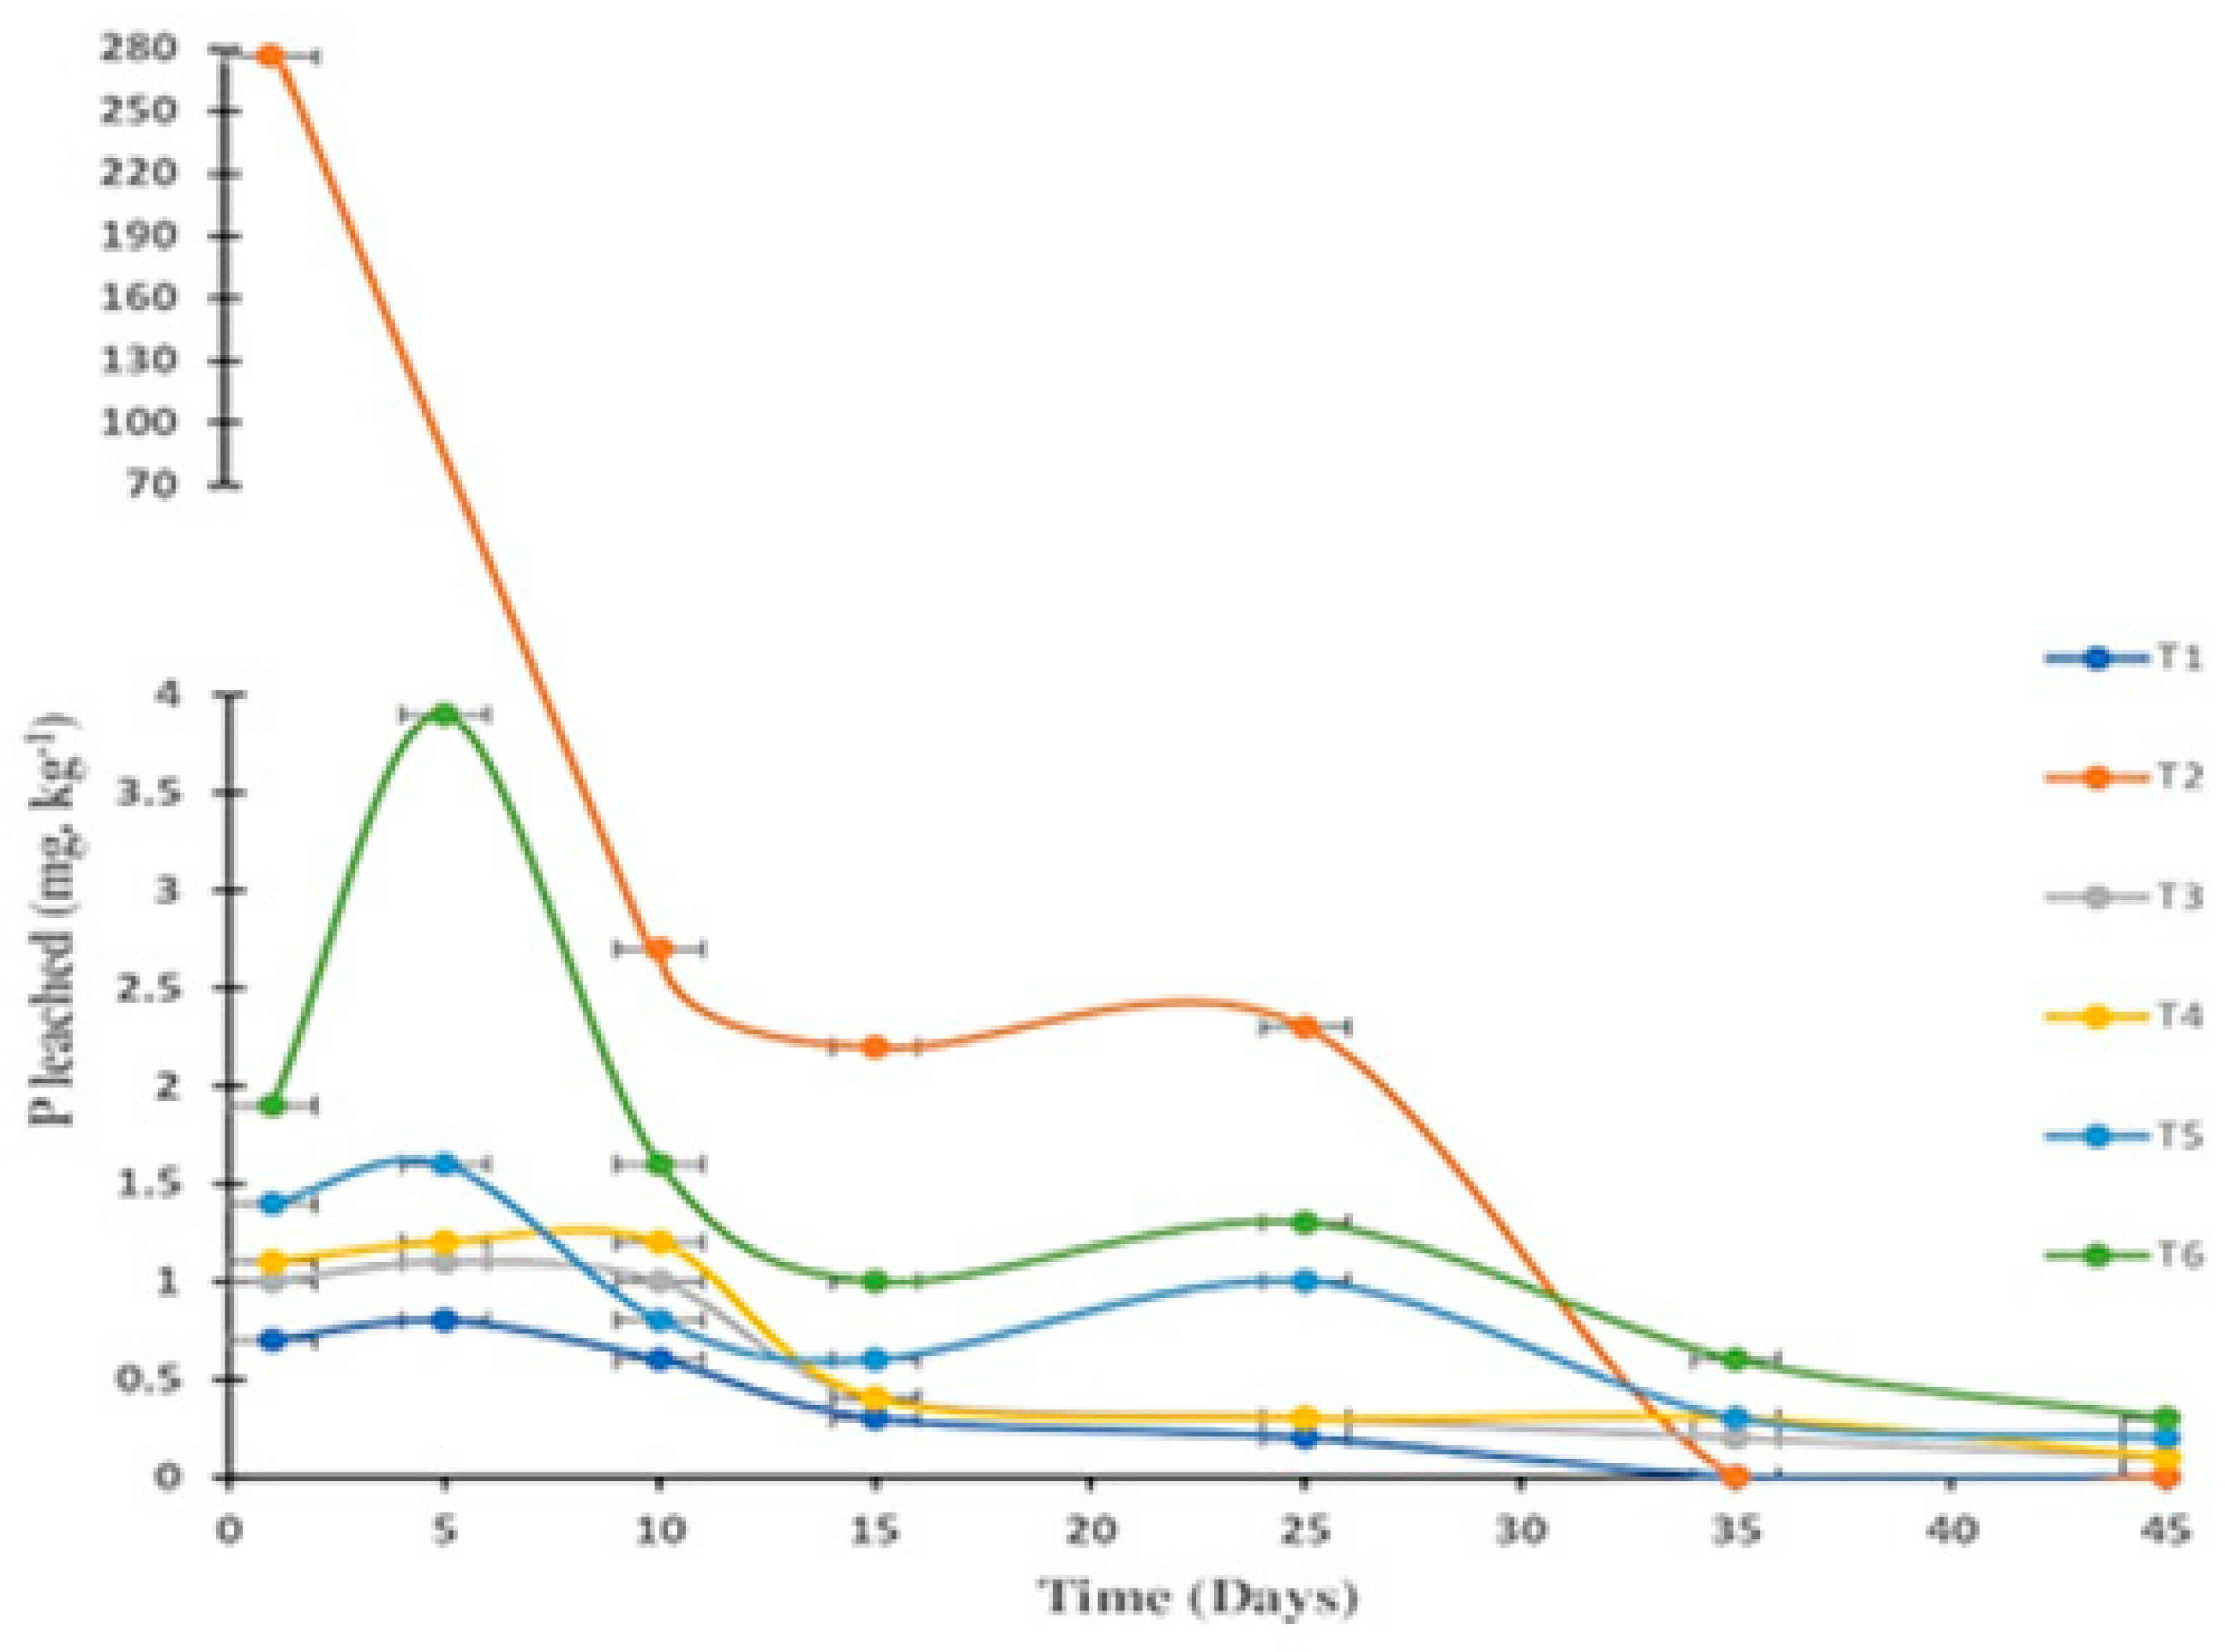
3.6. Influence of Biochar Enrichment on Leaching Losses of Phosphorus

A shown in Figure 5, the highest leaching loss of P was recorded in control (T1) and EEFB treated soils (T3, T4, T5, and T6) at 5 days, there after the losses of P decrease until the end of the experiment, while the highest loss of P was observed from T2 at Day 1, with a consequent decrease in leaching of P until Day 35 when it completely stopped. From the results, the fastest and highest loss of phosphorus was observed in inorganic fertilizer treatment (T2) compared to EEFB treatments. The higher retention of phosphorus retention in EFFB treatments is related to the high CEC (73.7 cmol (−) kg−1) of the empty fruit bunch biochar. The high CEC of the biochar favors the retention of phosphorus, which is bound with positive cations, i.e., Ca2+ and Mg2+, in the chicken manure extract, occurring as compounds of calcium and magnesium phosphate, thereby preventing the rapid leaching of the nutrient. These calcium and magnesium phosphate compound is gradually disintegrated by microbial action, which allows the slow release and availability of phosphorus in the long run, thus promoting the action of enriched empty fruit biochar as a slow-release P fertilizer [40]. In addition, the biochar has a high anion capacity that favors the retention of free ions of phosphate on the surface of the biochar. These processes give a good indication of the ability of EEFB to retain phosphorus in the soil for a longer period, minimizing the loss of this nutrient. This is beneficial for plant growth and may help reduce the need for P fertilization in the soil.

4. Conclusions

Our findings show that amending sandy soil (tailing soil) with different rates of enriched biochar (EEFB) resulted in increased soil pH. The highest pH was recorded between 10–15 days of incubation. A slight decrease was observed in the trend until after Day 35 when pH continued to increase until the end of the experiment. The highest change in soil pH from Day 1 to the last day of incubation was recorded in EEFB treatment (T6) with an increment of 0.49 unit. The study showed that available P released from EEFB treatments (T3, T4, T5 and T6) during incubation was higher compared to control. The microbial effect resulting in immobilization was evident on Day 5, while mineralization process had its effect on Day 15. The changes in available P between the first and last day of incubation were positive for EEFB treatments (T3, T4, T5, and T6), with values ranging from 1.6–4.1%, whereas a 10.4 and 83% decrease in available P was recorded in control (T1) and T2 (inorganic fertilizer), respectively.
Phosphorus loss from the soil through leaching was lower in EEFB treatments compared to inorganic fertilizer (T) but higher than control (T1). The highest loss was recorded at Day 5 in EEFB treatments. Subsequently, phosphorus loss was reduced up till the end of the experiment. At the same time, the phosphorus leaching in inorganic fertilizer treatment stopped completely at Day 35. In the two experiments, an increasing amount of available P was observed in EEFB treatments with P level increasing in the incubation study with time, corresponding to the decreasing loss of phosphorus recorded in the leaching study. This may give a good indication of the ability of EEFB to retain P into the soil for the long term and reducing the losses, finally releasing phosphorus slowly.
Summarily, the current research established that fortifying biochar with nutrients such as phosphorus in liquid chicken manure and soil application of the enriched biochar has a beneficial impact on soil nutrient enrichment and retention. In this context, this can translate to multiple benefits looking from different dimensions. The method can help mitigate environmental challenges associated with disposal and use of raw chicken manure as nutrient sources in the soil, thereby ensuring environmental sustainability. In addition, leaching and depletion of soil nutrient can be effectively reduced using this method alongside other management techniques thereby resulting in better crop productivity in the long run. Meanwhile, value addition to biochar via the enrichment method could ensure a zero-waste agricultural production system where animal waste and crop residue is put into effective use, thus promoting organic farming. The method can also benefit poor farmers in many underdeveloped and developing nations of the world who cannot afford to buy chemical fertilizers.

Author Contributions

Conceptualization, methodology, analysis, writing—original draft preparation, Y.D., R.I., H.J.; writing—review and editing, F.A. All authors have read and agreed to the published version of the manuscript.

Funding

This research received no external funding.

Acknowledgments

The authors wish to acknowledge the technical support provided by staff members and students of the Department of Land Management, Faculty of Agriculture, UPM during the conduct of this research. We also wish to thank individuals or group of people who in one way or another helped us towards the successful and timely implementation of the research project.

Conflicts of Interest

The authors wish to declare that there is no conflict of interest whatsoever.

References

  1. Hanafi, M.M. Managing Phosphorus: Under Acid Soils Environment; Universiti Putra Malaysia Press: Serdang, Selangor, Malaysia, 2010. [Google Scholar]
  2. Asma, I.W.; Rasidah, K.W.; Rosenani, A.B.; Aminuddin, H.; Rozita, A. Effects of mulching and fertilizer on nutrient dynamics of sand tailings grown with Acacia hybrid seedlings. J. Trop. For. Sci. 2011, 1, 440–452. [Google Scholar]
  3. Conley, D.J.; Paerl, H.W.; Howarth, R.W.; Boesch, D.F.; Seitzinger, S.P.; Havens, K.E.; Likens, G.E. Controlling eutrophication: Nitrogen and phosphorus. Science 2009, 323, 1014–1015. [Google Scholar] [CrossRef] [PubMed]
  4. Kanwar, R.S.; Cruse, R.M.; Ghaffarzadeh, M.; Bakhsh, A.; Karlen, D.L.; Bailey, T.B. Corn-soybean and alternative cropping systems effects on NO3-N leaching losses in subsurface drainage water. Appl. Eng. Agric. 2005, 21, 181–188. [Google Scholar] [CrossRef]
  5. Stuart, D. Sandy tin Tailings in Malaysia: Characterization and Rehabilitation; University of Plymouth: Plymouth, UK, 2003. [Google Scholar]
  6. Teh, C.; Sung, B.; Ishak, C.F. Soil Properties (Physical, Chemical, Biological, Mechanical). In Soils of Malaysia, 1st ed.; Ashraf, M.C., Othman, R., Ishak, Eds.; CRC Press: Boca Raton, FL, USA, 2018; pp. 103–154. [Google Scholar]
  7. Shamshuddin, J.; Fauziah, C.I. Weathered Tropical Soils. The Ultisols and Oxisols; University Putra Malaysia Press: Serdang, Malaysia, 2010. [Google Scholar]
  8. Cunha, T.J.; Madari, B.E.; Canellas, L.P.; Ribeiro, L.P.; Benites, V.D.; Santos, G.D. Soil organic matter and fertility of anthropogenic dark earths (Terra Preta de Índio) in the Brazilian Amazon basin. Rev. Bras. Cienc. Solo. 2009, 33, 85–93. [Google Scholar] [CrossRef]
  9. Lehmann, J.; Da Silva, J.P.; Steiner, C.; Nehls, T.; Zech, W.; Glaser, B. Nutrient availability and leaching in an archaeological Anthrosol and a Ferralsol of the Central Amazon basin: Fertilizer, manure and charcoal amendments. Plant Soil 2003, 249, 343–357. [Google Scholar] [CrossRef]
  10. Topoliantz, S.; Ponge, J.F.; Ballof, S. Manioc peel and charcoal: A potential organic amendment for sustainable soil fertility in the tropics. Biol. Fertil. Soils 2005, 41, 15–21. [Google Scholar] [CrossRef] [Green Version]
  11. Bailey, V.L.; Fansler, S.J.; Smith, J.L.; Bolton, H., Jr. Reconciling apparent variability in effects of biochar amendment on soil enzyme activities by assay optimization. Soil Biol. Biochem. 2011, 43, 296–301. [Google Scholar] [CrossRef]
  12. Jindo, K.; Suto, K.; Matsumoto, K.; García, C.; Sonoki, T.; Sanchez-Monedero, M.A. Chemical and biochemical characterisation of biochar-blended composts prepared from poultry manure. Bioresour. Technol. 2012, 110, 396–404. [Google Scholar] [CrossRef]
  13. Yoo, G.; Kang, H. Effects of biochar addition on greenhouse gas emissions and microbial responses in a short-term laboratory experiment. J. Environ. Qual. 2012, 41, 1193–1202. [Google Scholar] [CrossRef]
  14. Kavitha, B.; Reddy, P.V.; Kim, B.; Lee, S.S.; Pandey, S.K.; Kim, K.H. Benefits and limitations of biochar amendment in agricultural soils: A review. J. Environ. Manag. 2018, 227, 146–154. [Google Scholar] [CrossRef]
  15. Lentz, R.D.; Ippolito, J.A. Biochar and manure affect calcareous soil and corn silage nutrient concentrations and uptake. J. Environ. Qual. 2012, 41, 1033–1043. [Google Scholar] [CrossRef]
  16. Macdonald, L.M.; Farrell, M.; Van Zwieten, L.; Krull, E.S. Plant growth responses to biochar addition: An Australian soils perspective. Biol. Fertil. Soils 2014, 50, 1035–1045. [Google Scholar] [CrossRef]
  17. Thies, J.E.; Rillig, M.C. Characteristics of biochar: Biological properties. Biochar for environmental management. Sci. Technol. 2009, 1, 85–105. [Google Scholar]
  18. Moore, P.A.; Daniel, T.C.; Sharpley, A.N.; Wood, C.W. Poultry manure management: Environmentally sound options. J. Soil Water Conserv. 1995, 50, 321–327. [Google Scholar]
  19. Guohua, L.; Li, H.; Leffelaar, P.A.; Shen, J.; Zhang, F. Characterization of phosphorus in animal manures collected from three (dairy, swine, and broiler) farms in China. PLoS ONE 2014, 22, e102698. [Google Scholar]
  20. Peng, F.; He, P.W.; Luo, Y.; Lu, X.; Liang, Y.; Fu, J. Adsorption of phosphate by biomass char deriving from fast pyrolysis of biomass waste. Clean Soil Air Water 2012, 40, 493–498. [Google Scholar] [CrossRef]
  21. Streubel, J.D.; Collins, H.P.; Tarara, J.M.; Cochran, R.L. Biochar produced from anaerobically digested fiber reduces phosphorus in dairy lagoons. J. Environ. Qual. 2012, 41, 166–174. [Google Scholar] [CrossRef] [PubMed]
  22. Yao, Y.; Gao, B.; Chen, J.; Zhang, M.; Inyang, M.; Li, Y.; Alva, A.; Yang, L. Engineered carbon (biochar) prepared by direct pyrolysis of Mg-accumulated tomato tissues: Characterization and phosphate removal potential. Bioresour. Technol. 2013, 138, 8–13. [Google Scholar] [CrossRef]
  23. Singh, B.; Dolk, M.M.; Shen, Q.; Camps-Arbestain, M. Biochar pH, electrical conductivity and liming potential. In Biochar: A Guide to Analytical Methods; CRC Press: Boca Raton, FL, USA, 2017; Volume 1, p. 23. [Google Scholar]
  24. Song, W.; Guo, M. Quality variations of poultry litter biochar generated at different pyrolysis temperatures. J. Anal. Appl. Pyrolysis 2012, 94, 138–145. [Google Scholar] [CrossRef]
  25. Mukherjee, A.; Zimmerman, A.R.; Harris, W. Surface chemistry variations among a series of laboratory-produced biochars. Geoderma 2011, 163, 247–255. [Google Scholar] [CrossRef]
  26. John, P.; Combs, S.; Hoskins, B.; Jarman, J.; Kovar, J.; Watson, M.; Wolf, A.; Wolf, N. Recommended Methods of Manure Analysis; University of Wisconsin Cooperative Extension Publishing: Madison, WI, USA, 2003. [Google Scholar]
  27. Campbell, C.R.; Plank, C.O. Preparation of plant tissue for laboratory analysis. Methods for Plant Analysis; CRC Press: Boca Raton, FL, USA, 1998; p. 37. [Google Scholar]
  28. Zarcinas, B.A.; Ishak, C.F.; McLaughlin, M.J.; Cozens, G. Heavy metals in soils and crops in Southeast Asia. Environ. Geochem. Health 2004, 26, 343–357. [Google Scholar] [CrossRef] [PubMed]
  29. Landon, J.R. Booker Tropical Soil Manual: A Handbook for Soil Survey and Agricultural Land Evaluation in the Tropics and SUBTROPICS; Routledge: Abingdon, UK, 2014. [Google Scholar]
  30. Song, C.T.B.; Talib, J. Soil Physics Analyses; Universiti Putra Malaysia Press: Serdang, Selangor, Malaysia, 2006; Volume 1. [Google Scholar]
  31. Murphy, J.A.; Riley, J.P. A modified single solution method for the determination of phosphate in natural waters. Anal. Chim. Acta. 1962, 27, 31–36. [Google Scholar] [CrossRef]
  32. Aini, Z.; Sivapragasam, A.; Vimala, P.; Roff, M.N. Organic Vegetable Cultivation in Malaysia, 1st ed.; Malaysian Agricultural Research and Development Institute (MARDI): Serdang, Malaysia, 2005. [Google Scholar]
  33. Rodriguez, C.M. Performance of chicken layers as affected by calcium supplement. Int. J. Sci. Res. 2013, 2, 1749–2094. [Google Scholar]
  34. Hazelton, P.; Murphy, B. Interpreting Soil Test Results: What Do all the Numbers Mean? CSIRO Publishing: Collingwood, Australia; Clayton, Australia, 2016. [Google Scholar]
  35. Shi, R.Y.; Li, J.Y.; Ni, N.I.; Xu, R.K. Understanding the biochar’s role in ameliorating soil acidity. J. Integr. Agric. 2019, 18, 1508–1517. [Google Scholar] [CrossRef]
  36. Qian, L.; Chen, B.; Hu, D. Effective alleviation of aluminum phytotoxicity by manure-derived biochar. Environ. Sci. Technol. 2013, 47, 2737–2745. [Google Scholar] [CrossRef] [PubMed]
  37. Berek, A.K.; Hue, N.V. Characterization of biochars and their use as an amendment to acid soils. Soil Sci. 2016, 181, 412–426. [Google Scholar] [CrossRef]
  38. Xu, G.; Zhang, Y.; Sun, J.; Shao, H. Negative interactive effects between biochar and phosphorus fertilization on phosphorus availability and plant yield in saline sodic soil. Sci. Total Environ. 2016, 568, 910–915. [Google Scholar] [CrossRef] [PubMed]
  39. Lucchini, P.; Quilliam, R.S.; DeLuca, T.H.; Vamerali, T.; Jones, D.L. Does biochar application alter heavy metal dynamics in agricultural soil? Agric. Ecosyst. Environ. 2014, 184, 149–157. [Google Scholar] [CrossRef]
  40. Kizito, S.; Luo, H.; Lu, J.; Bah, H.; Dong, R.; Wu, S. Role of nutrient-enriched biochar as a soil amendment during maize growth: Exploring practical alternatives to recycle agricultural residuals and to reduce chemical fertilizer demand. Sustainability 2019, 11, 3211. [Google Scholar] [CrossRef] [Green Version]
  41. Yuan, J.H.; Xu, R.K.; Zhang, H. The forms of alkalis in the biochar produced from crop residues at different temperatures. Bioresour. Technol. 2011, 102, 3488–3497. [Google Scholar] [CrossRef]
  42. Fidel, R.B.; Laird, D.A.; Thompson, M.L.; Lawrinenko, M. Characterization and quantification of biochar alkalinity. Chemosphere 2017, 167, 367–373. [Google Scholar] [CrossRef] [PubMed] [Green Version]
  43. Steiner, C.; Sánchez-Monedero, M.A.; Kammann, C. Biochar as an additive to compost and growing media. In Biochar for Environmental Management: Science, Technology and Implementation; Routledge: London, UK, 2015. [Google Scholar]
  44. DeLuca, T.H.; MacKenzie, M.D.; Gundale, M.J.; Holben, W.E. Wildfire-produced charcoal directly influences nitrogen cycling in ponderosa pine forests. Soil Sci. Soc. Am. J. 2006, 70, 448–453. [Google Scholar] [CrossRef] [Green Version]
  45. Khan, A.A.; Jilani, G.; Akhtar, M.S.; Naqvi, S.M.; Rasheed, M. Phosphorus solubilizing bacteria: Occurrence, mechanisms and their role in crop production. J. Agric. Boil. Sci. 2009, 1, 48–58. [Google Scholar]
  46. Ayanda, A.F.; Shamshuddin, J.; Fauziah, C.I.; Radziah, O. Utilization of magnesium-rich synthetic gypsum as magnesium fertilizer for oil palm grown on acidic soil. PLoS ONE 2020, 15, e0234045. [Google Scholar] [CrossRef] [PubMed]
Figure 1. The effect of different rates of EEFB and inorganic fertilizer on the soil pH during the incubation period. Each value represents the mean of three replicates with the standard error shown by the vertical bars.
Sustainability 13 10851 g001
Figure 2. Changes in pH of soils treated with EEFB and inorganic fertilizer during the incubation study. Means with different letters are significantly different at p < 0.05 Tukey’s test. Each value represents the mean of three replicates with the standard error shown by the vertical bars.
Sustainability 13 10851 g002
Figure 3. The effect of different rates of EEFB on available P in the soil during incubation.
Sustainability 13 10851 g003
Figure 4. Changes in soil available P due to treatments during the incubation study. Means with different letters are significantly different at p < 0.05 Tukey’s test. Each value represents the mean of three replicates with the standard error shown by the vertical bars.
Sustainability 13 10851 g004
Figure 5. Cumulative phosphorus leaching from soil amended with different rate of EEFB and inorganic fertilizer during the incubation study.
Sustainability 13 10851 g005
Table 1. Rates of empty fruit bunches biochar (EEFB) and phosphorus content of treatments in the experiments.
TreatmentRate of EEFB t ha−1Amount of P (kg. ha−1)In Experiments g. g Soil−1
T1(control) 000
T291 kg ha−1 (TSP) 180.0007(TSP)
T3112.870.0065
T4225.740.013
T5338.610.020
T6564.350.033
For each sampling time and treatment combination, three soil replicates are taken for analyses (n = 3 × 7 = 21 samples per treatment). The collected soil samples were analyzed using the soil chemical analyses described earlier.
Table 2. Chemical properties of solid chicken manure and extract.
Soil PropertiesSolid Chicken ManureChicken Manure Extract
pH8.206.25
EC (dS m−1)14.70.0005
C21.73.86
Total N (%)2.80.06
Total P (%)2.951.29
Dissolved P (%)2
K (%)3.30.09
Ca (%)14.51.07
Mg (%)3.70.66
Cu (mg g−1)1.060.18
Zn (mg g−1)4.80.09
Dry matter87.20.69
Moisture content12.87.42
Table 3. Comparison of the chemical components of EFB biochar before and after enrichment.
PropertiesBeforeAfter
Ph (1:5)8.858.50
EC (1:5) (dS m−1)2.980.49
Total C (%)48.760.5
Total N (%)1.191.23
Total P (%)0.031.24
K (%)1.80.7
Ca (%)0.41.2
Mg (%)0.10.3
CEC (cmol (+) kg−1)73.7-
AEC (cmol (−) kg−1) 40.24-
S (%)0.070.14
Cu (ppm)0.10.2
Zn (ppm)0.20.3
Table 4. Chemical and physical properties of experimental soil before treatment application.
Soil PropertiesValues
Sand (%)88.36
Silt (%)7.25
Clay (%)4.37
Textural classSandy
Bulk density (g cm−3)1.6
pH (water)4.31
EC (dS m1)0.09
Available P (mg kg−1)56
Total P (%)0.50
Total C (%)0.50
Total N (%)0.07
C:N7:1
K (cmol (+) kg−1)0.10
Ca (cmol (+) kg−1)0.01
Mg (cmol (+) kg−1)0.01
CEC0.66
Cu (ppm) 19.4
Zn (ppm)17.3
Publisher’s Note: MDPI stays neutral with regard to jurisdictional claims in published maps and institutional affiliations.

