Article

Domestic Retrofit Assessment of the Heat Pump System Considering the Impact of Heat Supply Temperature and Operating Mode of Control—A Case Study

Centre for Sustainable Technologies, Ulster University, Jordanstown BT37 0QB, UK
*
Author to whom correspondence should be addressed.
Sustainability 2021, 13(19), 10857; https://doi.org/10.3390/su131910857
Submission received: 11 September 2021 / Revised: 27 September 2021 / Accepted: 28 September 2021 / Published: 29 September 2021
(This article belongs to the Special Issue Built Environment and Sustainability)

Abstract

:
In this study, performance assessment of the variable speed compressor-based air source heat pump (ASHP) system as a domestic retrofit technology instead of fossil fuel-based heating technologies for the 1900s Mid terraced house is investigated. The assessment was conducted considering operating mode of control and heat supply temperature impact of the system. In the literature, ASHP system experimental development with variable speed mode (VSM) of control in comparison to fixed speed mode (FSM) of control at low to medium and high heat supply temperature in the context of UK was found with very limited number of studies, but without considering retrofit application. The focus of the earlier studies was on the individual components and performance improvement. The designed heat pump (HP), developed, and tested at constant heat load, simulating the real domestic heat demand under the controlled laboratory conditions and numerical modeling is utilized for the analysis purposes. The HP performance, energy demand, carbon emissions, and cost varies significantly due to changing heat supply temperature (35 °C, 45 °C, and 55 °C), control mode and accordingly the carbon emission and cost savings are achieved. The oil and gas boilers ranges from conventional to highly efficient type and evaluated in terms of annual running cost, energy consumptions, and carbon emissions in comparison with the HP system. Additionally, a comparative study with the existing retrofitted very high temperature ASHP inside the house is conducted. The developed HP at 55 °C could not defeat the very high heat supply temperature HP system (75 °C supply temperature) in performance and cost savings but become attractive at low supply temperature (35 °C). The HP system in VSM at low heat supply temperature instead of gas boiler (90% efficiency) could cut the annual carbon emissions by 59% but with additional 6% running cost for the Mid terraced test house in Belfast climatic conditions.

1. Introduction

Building’s sector is one of the major contributors to the global emissions and was responsible for 38% of greenhouse gas (GHG) emissions in 2019 [1]. In the UK, the residential sector consumes 29% of the total final energy consumption [2] and accounted for 17% of the total carbon dioxide emissions [2]. The recent report by International Energy Agency (IE(A) [3] says that the sale of new fossil fuel boilers should stop from 2025 to achieve net-zero emissions target by 2050. On the way to net zero emissions, multiple milestones are there and lags in any sector may results in failures to meet the target elsewhere. The energy and climate policy strengthening, and implementation is required by all government to achieve the global pathway to net-zero emissions. The UK as a signatory of this agreement has legislated and set the target of net-zero carbon emission by 2050 [4,5], banned sale of fossil fuel-based boilers by 2025 [6]. The current measures are insufficient towards the committed pathways and hence acceleration in actions is required. In this regard the climate change conference, COP26 [7] organized in Glasgow, will urge signatory countries to speed up the action required to achieve the goals of Paris climate change agreement. Among the residential sector, space heating (SH) & domestic hot water (DHW) demand consumes 79% while cooking, lighting and other appliances consume the rest [8]. This encourages the renewable energy-based alternatives including greening gas or heat pump (HP) technology instead of fossil fuel-based heating options to decarbonize the space heat and hot water demand. Domestic heating sector decarbonizations via the greening gas including biomethane or hydrogen appears attractive but seems to be more costly and convincing results is missing in this regard. One of the key milestones settled for the building sector is retrofitting measures and 50% of the heating demands supposed to be met with HP by 2045 [3]. The electrification of the domestic heating sector via the electric HP become more feasible due to reduction in carbon footprints because of increasing renewable energy integration into the network grids [9]. The carbon emissions factor reduced by 23% in UK grid electricity during the two years period from 2018–2020 [10]. The ASHP appears more attractive for retrofit solution compared to the ground source heat pump (GSHP) technology due to the lower initial capital cost, labor work and space required, and less house disruption [11]. Recently a review study [12] on ASHP installation in the context of UK found it a promising technology for heating sector decarbonization. The HP as a technology uptake in UK was limited due to issues relating to control, sizing, existing housing stock poor insulation, initial capital cost, and lack of incentives by the government [13]. The major portion of domestic heating sector representing 62.8% of the total 80,000 dwellings were relying on oil boilers in Northern Ireland (NI) mainly because of off-gas grid areas [14] and around 85% of the total 27.4 million in England dwellings use gas boilers [15]. The HP retrofitting inside the very old period housing stock could not be neglected as the number of hard to heat homes in Northern Ireland represent 27.3% [16], and 43% in England [17]. The HP replacement instead of gas boilers requires the performance assessment and improvement potential investigation to compete with the falling gas prices in UK. The existing cost analysis allows the HP technology to compete in off-gas grid areas only. The variable speed compressor-based system could produce range of heating capacity [18] at low to high heat supply temperature could result in performance improvement and reduce carbon emissions and cost. The HP investigation as a domestic retrofit technology is presented in this study considering the control, heat supply temperature impact and climatic conditions impact on system performance.

1.1. Literature Review

The HP system classified depending on the heat supply temperature, as low temperature (35 °C), medium temperature (45 °C), high temperature (55 °C), and very high temperature (above 65 °C) (BS EN14511, 2004) [19]. The role of HP as a low carbon retrofit technology will surely increase among the UK domestic sector but certain factors influencing the installations inside the existing buildings including the high temperature distribution system must be carefully assessed [13]. Around 27.5 million England residential buildings [20] are old aged, installed with wet radiators as a heating distribution system. The wet radiators are installed to work with gas/oil boiler [21] efficiently at very high heat supply temperature of 75 °C, as per BS-EN 442-2:201 standard 4 recommendations [22]. In contrast the HP system works efficiently at lower heat supply temperature. The replacement of heating distribution system inside the existing house will be a major disruption. However, the pros and cons including the efficiency improvement and carbon emissions savings comparison is important to provide solid information to the policy makers and homeowners. The HP studies as a domestic retrofit technology could mainly be divided into two categories based on the supply temperature, i.e., (a) low to medium (35–45 °C) and high supply temperature (55 °C), and (b) very high supply temperature (60 °C and above). The literature on the domestic retrofit applications were mainly based on the predictions/and field trials of the commercially available units, manufacturer data information with no control over supply temperature, assuming nominal value for heat supply temperature [23,24], and without considering the heat supply temperature, control mode, building insulations, climatic conditions simultaneous impact. HP retrofit studies for different HP types have been conducted without proper design considerations and experimental development, neglecting the impact on compressor life. Lab tests at individual heating capacity and test conditions were conducted with variable speed compressor-based system and were recommended for further studies for domestic retrofit [25]. The effect of climatic conditions considerations along with building insulation level as a retrofit technology was assessed with other type of heat pumps [26]. The ASHP type needs special attention due to inverse relationship of building heat demand and heat production in winter [27]. The variable speed compressor-based system could produce a range of heating capacities could avoid the oversizing. Therefore, the proper sizing and experimental results become more critical and assessment studies are required prior to installation of such system in a specific building type, and country location. Earlier studies for different nationalities were available in literature with a focus on different aspects. In this regard, the study of Madonna and Bazzocchi [23] evaluated the seasonal performance factor (SPF) in retrofit applications for different building types, in Italy climatic conditions at 45 °C supply temperature nominal value assumptions, reporting the potential improvement of 19% via weather compensation strategy. The study assumed radiators oversizing without looking into heating distribution system installations/upgradations requirements, heat supply temperature impact on the carbon emissions, cost, and operating mode of control. Asaee et al. [28] evaluated the feasibility of ASHP retrofit installation for the eligible Canadian housing stock for the combined SH and DHW demand. The final heat supply temperature of 55 °C were obtained in the second stage via auxiliary boilers and 50 °C was achieved by the HP in first stage. The HP retrofitting could save energy of 36%, with up to 23% reduction in greenhouse gas emissions in comparison to fossil fuel-based heating technologies. However, the study reported mainly the high-level impact on the carbon emission without looking into the technological depth and improvement. In Germany, the experimental data from the field trials results of 21 ASHP system and 22 GSHP was assessed for retrofit applications by Huchtemann [29]. The heat supplying temperature was 40 °C for underfloor heating options and 55 °C when radiators were used with ON/OFF controlled mode only. The study investigating ASHP replacement instead of gas boiler in UK assessing the carbon-savings, annual running cost in the existing office considering the insulation improvement characteristics by 2030 scenario [30]. The ASHP was found potential decarbonization technology and the amount of carbon emission reduction was based on the future DHW supply and the grid carbon intensity. The ASHP retrofit study for residential buildings in Scotland [9], was conducted by Kelly and Cockroft for the evaluation of annual running cost and carbon emission at supply temperature of 55 °C. The HP retrofitting instead of gas boilers reduces 12% carbon emissions, but with increase of 10% annual running cost. Cabrol and Rowley [31] compared the simulation results in domestic buildings at single heat supply temperature of 35 °C with no comparative results for other supply temperature in UK climatic conditions. The ASHP was found effective both in terms of carbon emission and cost due to low supply temperature in contrast to the gas boilers. Department of Energy and Climate Change (DECC) in combination with the Energy Saving Trust (EST) [32] investigating the field trials results in UK for AWHPs and GSHPs, ranging from 30 °C to 55 °C heat supply temperature. The study concluded that the lower HP performance in UK compared to other European countries were due to lack of match between capacity and demand, large floor area, sizing issue, lack of proper control, and ignoring the house insulation characteristics due to different age period. The conclusions drawn were similar to those by the authors of [33]. Hybrid heat pump-gas boiler system combination was investigated by Bagarella [34] with the aim of reduction the unfavorable behavior of the ASHP during the coldest period of the year to investigate the impact on annual energy saving. Two climatic conditions with several simulations were considered using developed dynamic model. The importance of proper sizing of the HP was highlighted, with the hybrid system more economical in comparison to monovalent HP. The only study [35] investigated ASHP as a domestic retrofit technology instead of gas boiler in south of Italy for cost and energy consumption while considering the heating system installations cost in combination with electricity and/or gas bills. However, the focus was the building insulations. The importance of building heat demand factor for cost savings with the HP was highlighted.
In the context of UK, variable speed compressor HP system retrofit for old age house was identified as one of the optimal possible heating technologies at low to medium and high supply temperature [36]. However, the seasonal performance was not assessed and were recommended for further investigations. The issue with the HP retrofit in the existing housing stock is the poor performance of the at higher supply temperature and needs the replacement of the existing wet radiators either with modern radiators or underfloor heating system. This adds extra cost to the higher initial capital cost of the HP. None of the above studies considered the additional installations cost and comparing the benefits of lower heating supply with high heat supply temperature. The additional heating distribution allows the HP to work efficiently at low to medium and high heat supply temperature retrofit, but with extra cost.
The heating distribution system installations could be avoided in case of second category of very high heat supply temperature of 60 °C and above. The earlier studies with very high heat supply temperature, including economized vapor injection (EVI), cascaded unit were developed and assessed for the 1900s Mid terraced test house considered in our analysis for Belfast climatic conditions, were found expensive in terms of annual running cost [24,25,37,38], with some savings of carbon emissions. The technoeconomic study [24] for the ASHP retrofit inside the test house was conducted at supply temperature of 75 °C to compare the HP annual running costs to that of gas boiler. The annual running cost for the HP was found higher than the gas boiler with a cut on carbon emissions in the range of 14% to 57% depending on the boiler’s efficiency. A comparative result with the very high temperature retrofitted HP is required to compare the carbon emissions savings and move towards net zero carbon targets. The domestic retrofit study with low to medium, high, and very high supply temperature with variable speed diesel engine heat pump system development, illustrating the advantages of high temperature engine driven HP in remote areas (off gas/ electricity networks), while meeting the reference test house heat demand have been reported in [39,40]. The engine was operated at various speed, with low to high supply temperature for possible potential benefits with variable speed mode of control for energy savings and system operations optimization.
The seasonal co-efficient of performance (COP), defined as the ratio between the useful energy heat output to the electrical energy consumed during a specific time, have been calculated using different approaches in the literature. The model validation through experimental results is important for the system performance predictions. In this regard, Kinab et al. [41] formulated a detailed model for variable speed ASHP seasonal performance optimization. The seasonal performance for Nice, Nancy, Macon and Trappers were of the order of 3.27, 2.76, 2.93, and 2.93, respectively, at single heat supply temperature of 45 °C. A simple but novel numerical model for the seasonal performance for Bologna city of Italy for three different kinds ASHP system (i.e., mono/multi, and variable speed compressor) was developed by Dongellini et al. [42]. The seasonal performance value of 3.8 was achieved at heat supply temperature of 35 °C in VSM. The HP used for comparative evaluation were different which sometime could lead to misleading information, and the results were based on the manufacturer data. The issue of frosting with ASHP system was studied [43] and its impact on the seasonal performance evaluations, using the developed model [42]. Other seasonal performance evaluation approaches including parametric model was developed by Underwood et al. [44] with the possibility of validation with lab scale/field trials, and manufacture results for the seasonal performance evaluation. The part load operation considering the HP part load factor was not modelled and were recommended for further investigations. An empirical model was developed for DHW production to find the performance of HP and maximize benefit for the substitution with gas boilers in [45]. The approach developed in [42] were adapted for the seasonal performance evaluation.
Although the main objective of this study was not the investigation of the comparative performance results with the VSM and FSM, the discussion become important for the benefits associated with the retrofit. The literature on the topic of variable speed control was limited to the specific technical and/or economic benefits of variable speed control technology, and energy saving potentials. The high starting current associated with ON/OFF control resulting in extra pressure on the network was found one of the barriers for HP technology uptake inside UK, compared to other European countries [46]. The restart of the unit during ON/OFF control results in high current consumption and lower efficiency because of compressor pressures re-establishment requirements. The risk of network instability due to current load further increases with the requirements of back-up electric heater requirements when the ASHP is unable to meet the required load at very low ambient temperature. The variable speed compressor of the HP for the capacity control have proved more efficient in this context [47,48,49]. Conventional way of controlling the heating capacity is the intermittent operation of compressor and comparative study between the variable speed and on/off control have been conducted by [50,51,52,53,54,55,56] reporting an efficiency improvement in the range of 10–25% [57]. The reason for performance improvement was better part load efficiency, match between the supply and demand, a smaller number of on/off cycles, unloading of heat exchangers, less requirements for back up electric heater, and smaller frosting losses [58]. Experimental and theoretical analysis were proposed by Zhao el al. [59] including the on/off control. The study concluded variable speed operation as more suitable approach for COP improvement. Munari et al. [60] performed comparative study of the two modes of control for the energy performance in terms of heat supply temperature requirements, with the additional consideration of compressor efficiency, and climatic conditions impact studied by Adhikari et al., 2012 [61]. The backup electric heating requirements was studied by Karlsson and Fahlen [62]. The three climatic conditions of Italy (Milan, Rome, Palermo, and significant energy savings with variable speed control specifically at Palermo and Rome during the heating seasons because of part load operation of the system for most of the time were investigated in [61]. The heat supply temperature in the ON/OFF control mode during the on-cycle needs to be higher compared to the continuous system operation which leads to lower performance and higher energy consumptions [63]. The studies found in the literature combining the comparative study of heat supply temperature (low to medium), and control mode (ON/OFF vs. VSM) with ground source heat pump (GSHP) aiming at the system efficiency improvement was found in [64,65]. The impact of hydronic heating distribution system on the HP performance with different supply/return temperature without considering the economic, insulation, property type, and climatic conditions impact [64,65]. The reduction in water supply/return temperature values from 55/45 °C to 35/28 °C results in increasing seasonal performance in the range of 30–35%. A couple of experimental studies comparing the two control modes aiming at industrial applications was conducted by [66,67] aiming at the performance improvement potential and energy saving potential. The previous studies on the developed HP as a retrofit technology highlights the cost as the major barrier for the HP system installation in the UK [36,37].

1.2. Research Gaps and Contribution to the Knowledge

The study combining the ASHP performance with economic aspects of VSM in comparison to FSM at single water heat supply temperature of 55 °C was performed by [50]. The aim was to study the payback period with variable speed control mode, for detached type building, with no considerations of climatic conditions influence and retrofit assessment. Other studies combining the performance and cost analysis for the variable speed compressor technology was performed by Mader and Madani [68,69], but without carbon emission saving investigations. The total cost of ownership analysis approach was used to investigate the economics of both the on/off and variable capacity control schemes for an ASHP in different climate zones [68]. The variable speed capacity control method in contrast to ON/OFF control was found more economical for colder climatic conditions, and savings of up to EUR 5000 was reported for 15 years period. The warmer climatic conditions for SH with variable speed control was not found cost effective. In [69], the study objectives were to investigate annual COP of a variable capacity GSHP system with changing climatic conditions. Focusing on the single aspect and neglecting others could lead to misleading information. Therefore, the ASHP research focused on the simultaneous impacts of the combined important parameter with the variable speed compressor-based system and retrofit assessment will be the major contribution from this research. The house thermal characteristic, property type, climatic conditions, match between heating capacity and heat demand, control approach, in addition to supply temperature have been considered. he HP performance at low to medium and high supply temperature and retrofit assessment via experimental development is presented for possible improvement and carbon emissions savings. Therefore, in this study a 9kW nominal heating capacity HP performance is presented at three different fixed water supply temperature (35 °C, 45 °C, and 55 °C) in two control modes. The HP economic aspect, carbon emission in comparison with the other heating option of oil/gas boiler, electric heating option and very high temperature HP have been evaluated. No study in the open literature exists to the best of authors’ knowledge on the ASHP as a retrofit technology considering annual running cost, carbon emissions, operating modes of control, in the context of Ireland, Northern Ireland, and Scotland at low to medium and high fixed heat supply temperature based with prototype development.

2. Methodology

2.1. HP Characterization

The designed and experimentally developed ASHP system could provide a range of heating capacity by varying compressor speed at different fixed heat supply temperature over the experienced ambient temperature conditions. The HP main components are listed in Table 1. The detailed description of the HP system, with experimental results, are presented in the authors’ other paper [18,70]. The current market prices per unit energy cost for all heating technologies were utilized from [71]. The HP operational map was established through experimental results inside the control lab environment. The measurement instruments accuracy limits are listed in Table 2 with the uncertainty propagation analysis carried out using by ASHRAE Guideline [72]. The testing results summary is presented in Table 3, Table 4 and Table 5. The general trend for COP improvement can be observed at low heat supply temperature in contrast to high heat supply temperature due to additional power consumption. The compressor speed requirements also increase for the fixed heating capacity at higher heat supply temperature. The ambient temperature conditions with the humidity conditions were kept constant.
Based on experimental results, the HP model was calibrated at nominal heating capacity using the approach suggested by [73]. The model calibration and validation were performed via experimental test results using the Mathematica software [74]. First, the model was calibrated with tests for finding the co-efficient values, followed by other test experimental results to validate the model. A comparison was conducted between measured experimental and predicted values to have an idea of the model error via the root mean square error (RMSEs) approach, defined by Equation (1).
R M S E = i = 1 n ( V m e a s u r e d V s i m ) 2 n  
The developed numerical model for the VSM were consisting of two outputs; co-efficient of performance (COP) determined by Equation (2), and electric power consumption(P) predicted by Equation (3). The outputs of the model were dependent on three variables, i.e., water supply temperature, ambient temperature conditions, and operating frequency. The validated model was used for the HP performance characterization in VSM and considerations of the part load operations.
CoP = 3.64 0.000242 × ω 2 + 0.000739 × ω × T w 0.00097 × T w 2 + 0.001825 × ω × T a + 0.0009 × T w × T a 0.0000438 × ω × T w × T a + 0.00237 × T a 2
P = 0.385 + 0.00013 × ω 2 + 0.00066 × ω × T w + 0.0001 × T w 2   + 0.00036 × ω × T a + 0.000288 × T w × T a 0.00000633 × ω × T w × T a 0.00094 × T a 2
The HP annual COP, electric power consumption (P), individual bin (i) COP values was calculated using the respective Equations (4)–(6). The total annual electric energy consumptions consumed were consisted of electric back-up heater and HP. The COP value was negatively impacted by additional back-up requirements in case of ON/OFF control.
Annual   COP = Q total P total
P hp ( i ) = Q hp ( i ) COP hp ( i )
COP ( i ) = COP hp ( i ) f COP ( i )
f COP ( i ) = PLR ( i ) 1 C c + C c PLR ( i )
The f COP ( i ) in Equation (7) determines the COP correction factor.
The HP part load curves with characteristics properties were calculated using Equations (8)–(10) following the same approach by several researchers [23,31,41,42].
PLR ( i ) = Partial   load   capacity   Full   load   capacity = Q ( i ) / Q full
EIR ( i ) = Consumption   of   power   at   partial   load Consumption   of   power   at   full   load   performance = P ( i ) / P full
PLF ( i ) = Partial   load   performance Full   load   performance = COP ( i ) / COP full
The HP performance in each bin was strongly dependent on the part load factor, ambient temperature and heat supply temperature. The cycling losses, defrost occurring at the surface of evaporator at high humidity ratios, and low ambient temperature conditions were considered in each bin with the performance evaluation with the cycling losses occurring during transient’s period. Modeling of defrost strategy was found complicated and various approaches have been used in the literature including as a COP reduction parameter [31]. The defrost was considered as a COP reduction parameter using the approach [75], based on the real experimental tests.

2.2. Case Study: 1900s Mid Terrace Test House

The case study under consideration is 1900s mid terrace typical 3-bedroom test house in Belfast, Northern Ireland, with floor area of 105 m2 [24]. The combined heat load demand calculated experimentally includes both domestic hot water (DHW) and space heating (SH) [24,70]. The HP in two control modes, i.e., VSM and FSM at three heat supply temperature of 35 °C, 45 °C, and 55 °C, were evaluated for the performance improvement, energy consumption, cost and carbon emission savings potential once retrofitted instead of other heating technologies.

2.3. Different Locations

The HP performance assessment was conducted in four different climatic conditions of Valentia, Dublin, Belfast, Aviemore. The climatic conditions vary from milder to severe conditions with average hourly, maximum, and minimum, temperature parameter shown in Table 6. The parameters were calculated using TRNSYS 17 [76] database meteonorm weather data file. The heating degree days (HDDs) for all locations was calculated using base temperature of 16 °C.
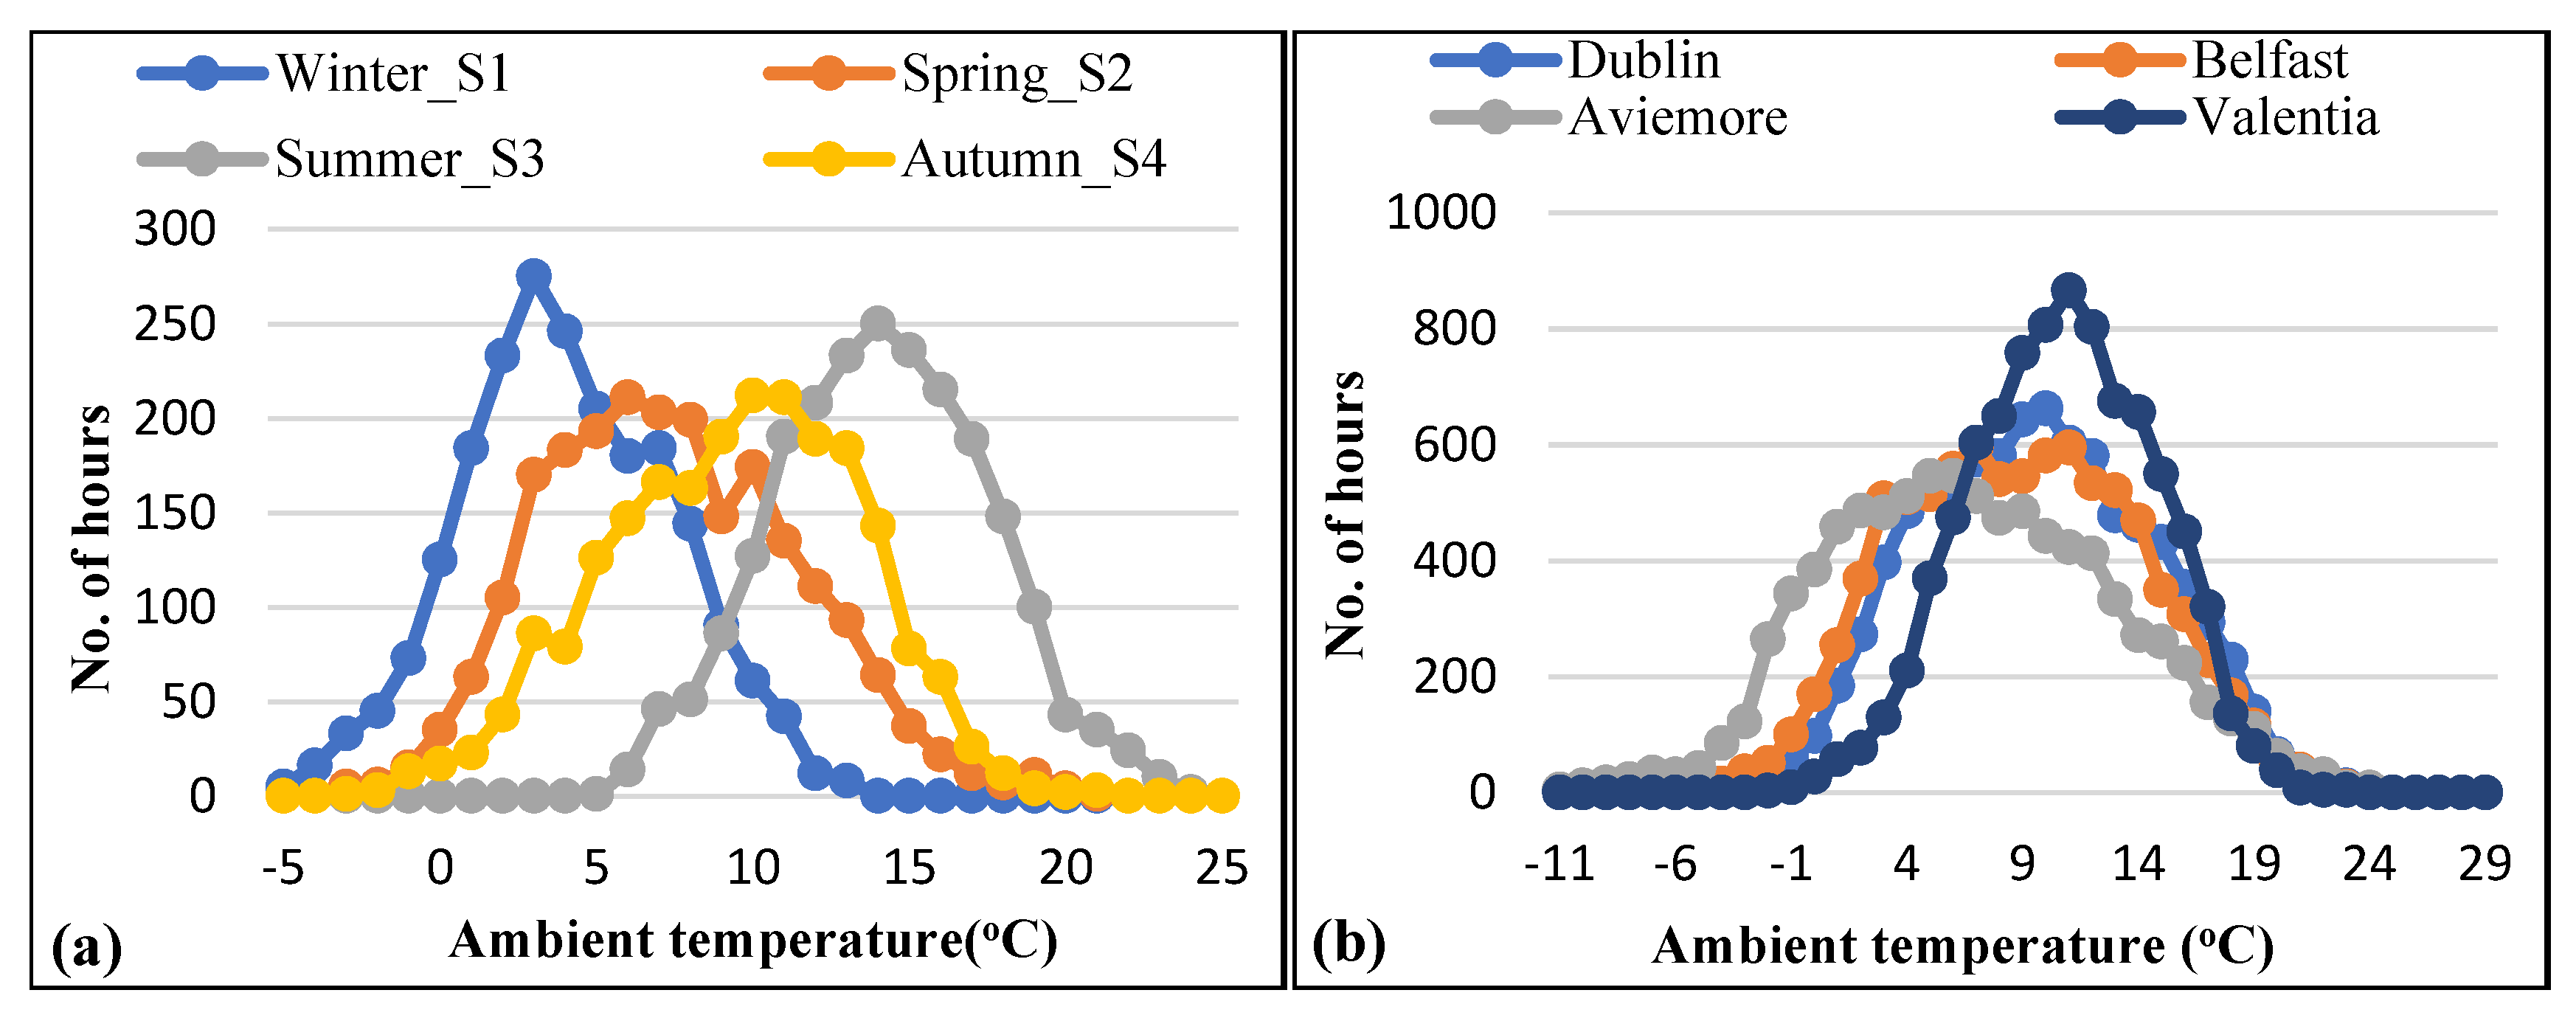
The HP performance has been evaluated during twelve (12) months, four (4) seasons and annual performance for the Belfast climatic conditions. The seasonal (S1, S2, S3, and S4) bin distribution representing the respective seasons of Winter (Dec-Feb), Spring (Mar–May), Summer (Jun-Aug) and Autumn (Sep–Nov) for Belfast climatic conditions is shown in Figure 1a. The annual bin distribution for the four (4) other locations are shown in Figure 1b.

2.4. Cost Analysis

2.4.1. Additional Cost Due to Heat Supply Temperature and Control Mode (VSM vs. FSM)

The issue with the HP retrofit is the higher initial capital cost, extra control devices in VSM, and heating distribution installation required for low heat supply temperature. The additional cost associated with VSM against FSM was calculated as GBP 1000 (inverter and additional control devices) using approach suggested by [50,68], and the heating distribution installations cost as GBP 6000 [42]. The unit capital cost for 8 kW HP system and installation was 8750 pounds with an 44% additional cost for the existing heating distribution system replacement because of emitters reduction in capacity due to lower delta T. The only upgradation of existing radiators system is less expensive compared to the new heating distribution system installation with combination of underfloor heating at the ground floor and radiators at upper floor. Table 7 present the capacity increase requirements considered for the heat emitters cost relative to Δ T = 50 at 70 °C heat supply temperature and room temperature of 20 °C.

2.4.2. Comparative Study with Other Heating Technologies

The developed HP technology was compared as a retrofit option instead of other heating technologies including oil boilers (O(B), gas boilers (G(B), electric heating (EH), and air-sourced very high temperature heat pump (VHTHP) at three (3) different percentage (%) efficiency. The OB/ GB have been compared at percentage efficiency of 90%, 80%, and 70%, representing range of newly advanced condensing boilers to earlier heavy weight less efficient boilers to investigate different age period installations and corresponding energy savings and carbon emissions reduction. The very high temperature heat pump (VHTHP) system was based on actual installed experimental results for the test house with COP of 2.32, 2.15, at respective fixed heat supply temperature of 75 °C and weather compensation control strategy for the cascaded ASHP units [24,25]. The third COP utilized for comparative study was from the earlier experimental development at lab scale units with a value of 2.12 was considered and reported in earlier studies [37]. The cost and carbon emission factor with comparison of different fuel types consumption have been investigated using the corresponding fuel price shown in Table 8. The electricity prices was 0.175 (GBP/KWh), oil price of 0.068(GBP/KWh), and gas price of 0.047(GBP/KWh), respectively [71] were utilized. The greenhouse gas emission factor was used from GHGs emission report [10], with oil and gas having values of 0.243 and 0.203, respectively.

3. Results and Discussions

3.1. Seasonal Co-Efficient of Performance (SCOP)

The seasonal (S1, S2, S3, S4), annual house heat demand, electrical energy consumptions, COP values is summarized in Table 9 for the three considered cases, during the two mode of control. The COP values depends on the heat supply temperature, mean hourly ambient temperature of the climatic conditions, and control mode of operation. The HP annual useful heat output was found to be 23,429 KWh with electric power consumption variation according to case considered, and control modes. The COP value trends shows higher values in VSM in comparison to the FSM in all cases, with C1 shows superior performance over C2 and C3 for the same annual heat load demand. The seasonal COP values ranges between 3.85 to 2.77 in VSM control, while the range becomes 2.62–2.34 during FSM of control for C1. Other case studies (C2, and C3) have shown the same trend with the highest COP during S3 and lowest during S1.
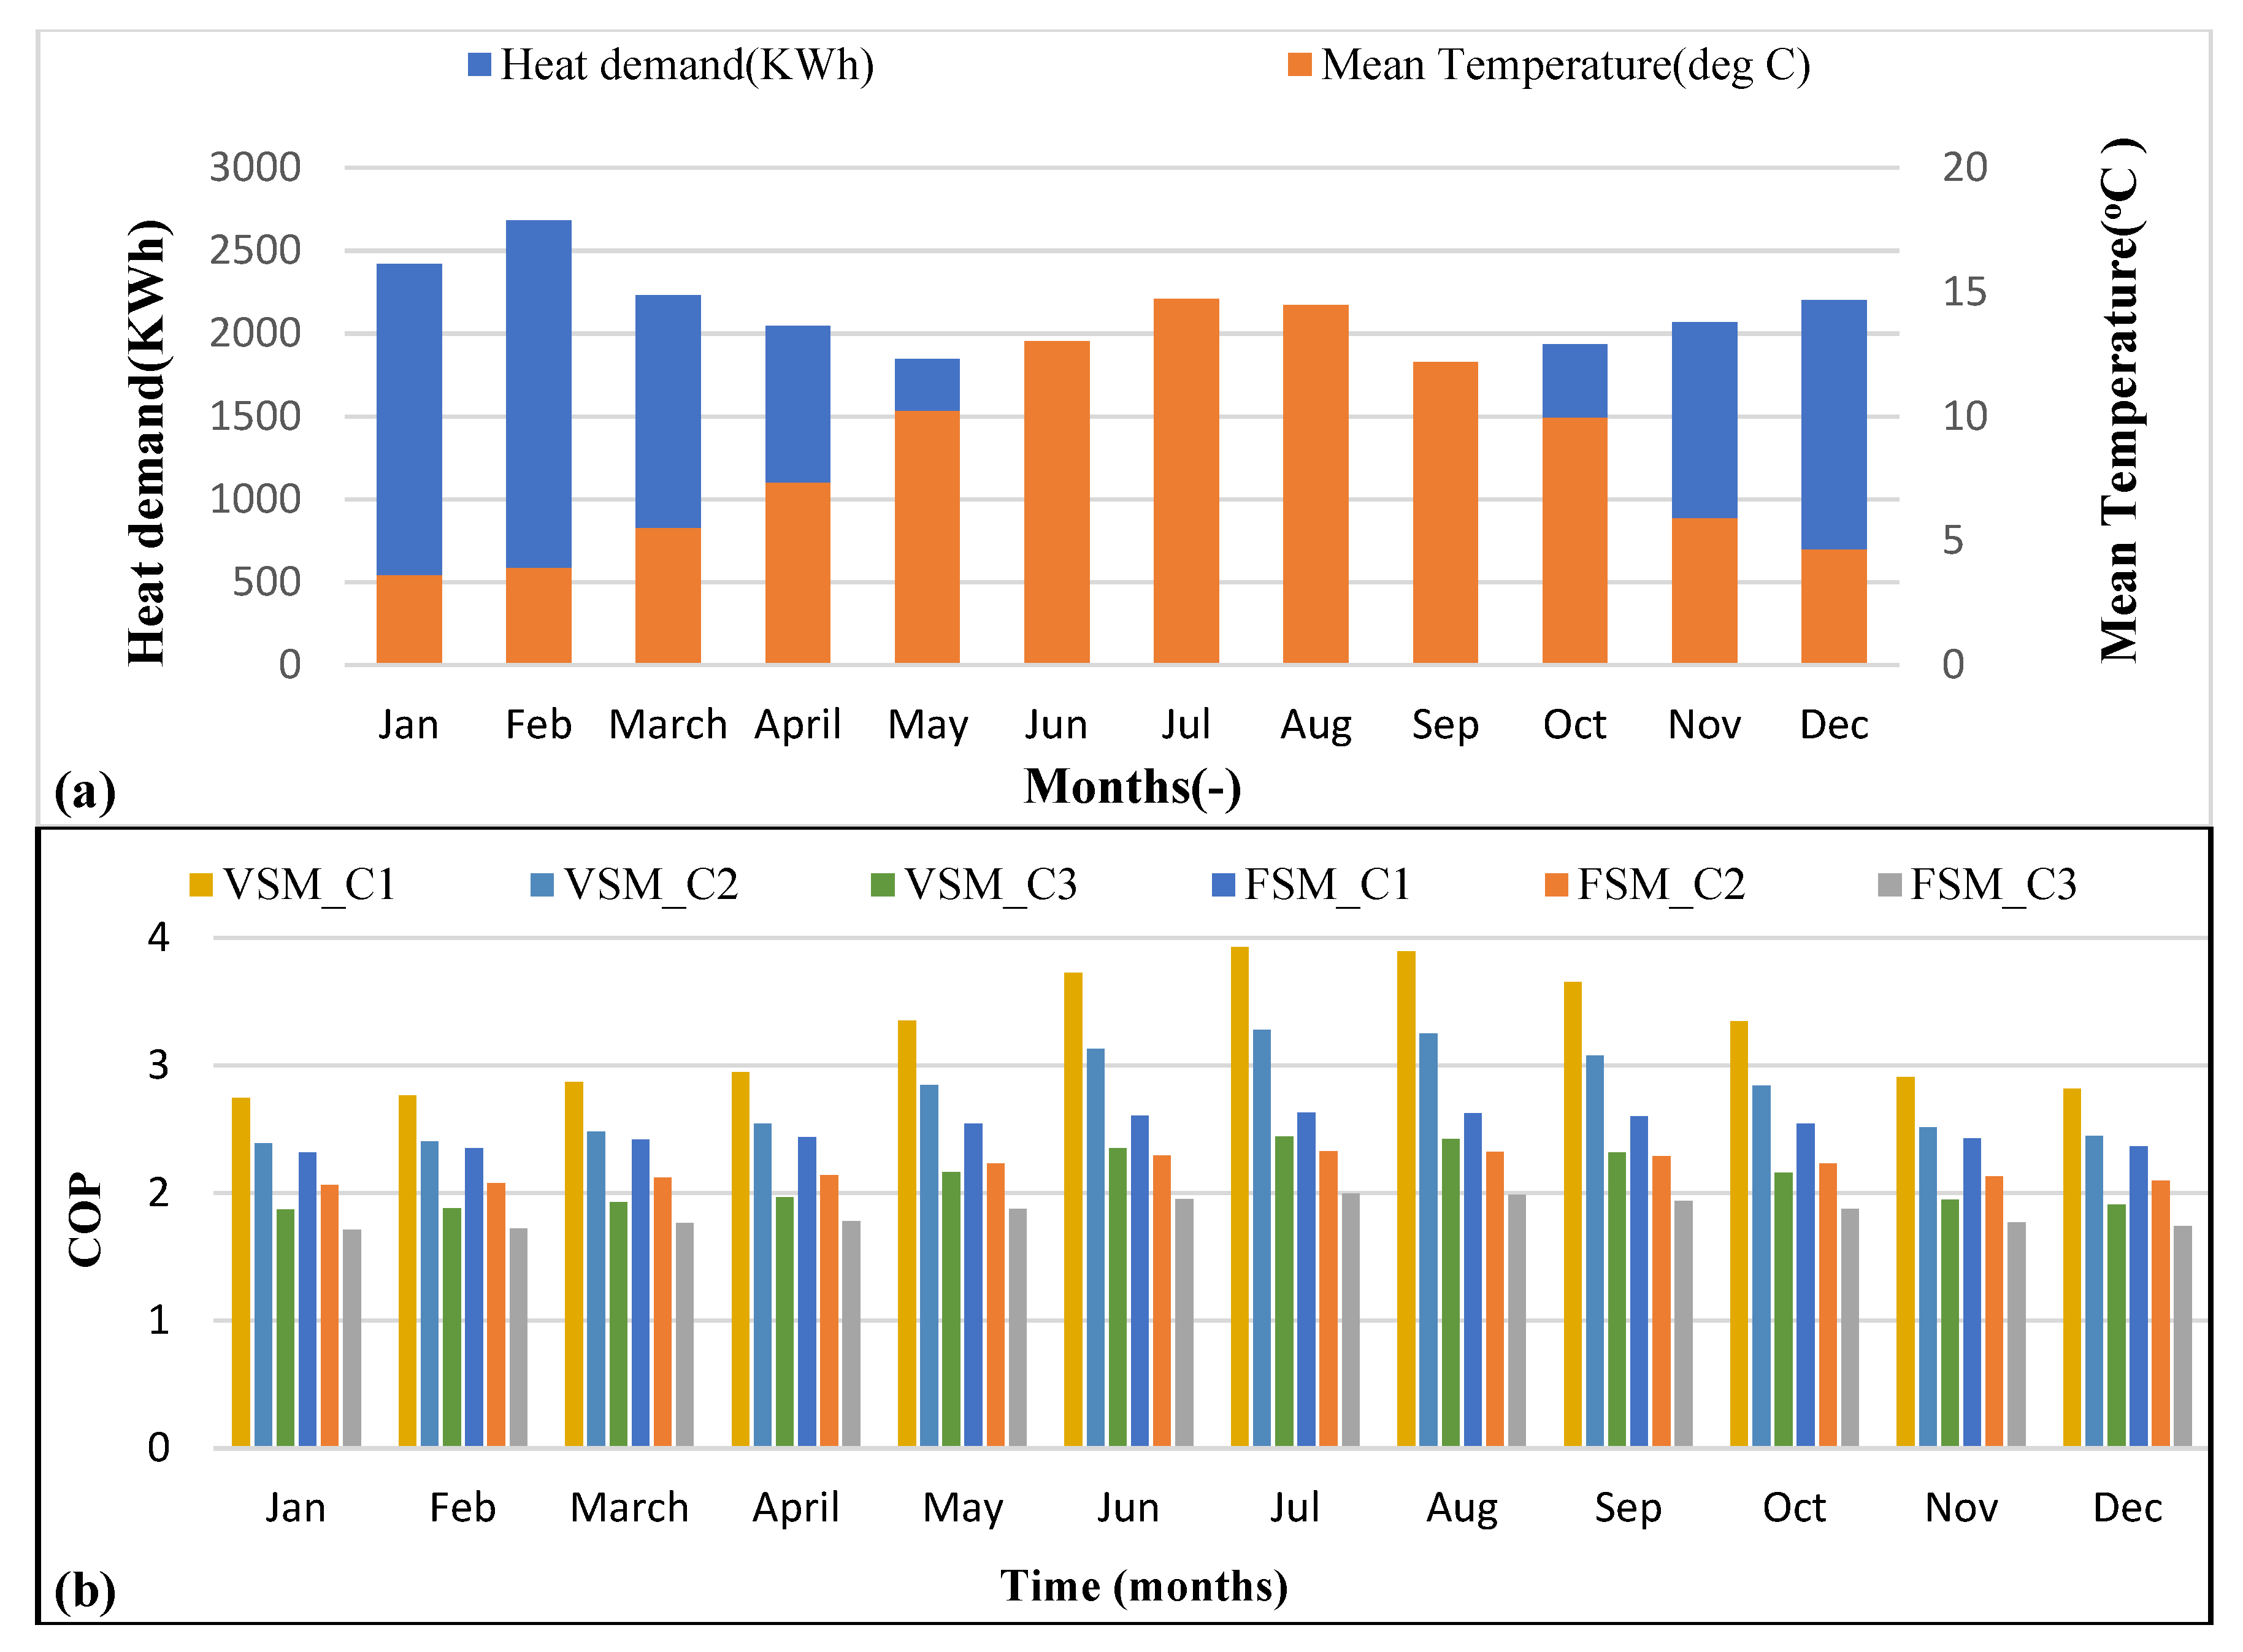
Monthly COP values depicted in Figure 2. with the higher mean ambient temperature month showing higher COP in comparison to the lower mean hourly ambient temperature in both control mode. The monthly values range from 3.93 to 2.74 with the highest value in July and smallest value in month of January in VSM(C1). The trend is maintained with other cases as well and for FSM control but with different percentage impact.
The seasonal percentage (%) improvement in COP and energy consumption due to change in control mode (VSM vs. FSM) for three cases studied is illustrated in Figure 3a,b. The potential improvement is higher during summer season S3 and lowest during the winter season S1. The highest COP improvement during the summer season in VSM compared to FSM was because of the additional cycling losses during FSM. The highest energy savings with a value of 31.89% occurs for summer season with the lowest improvement in S1 with the value of 15.54% for the C1 with the same trend for other two cases.

3.2. Other Locations

3.2.1. Annual COPs

The HP annual performance depends on the climatic conditions with the highest COP value in milder climatic conditions of Valentia for lower supply temperature(C1) with a value of 2.55 during FSM and increases to 3.40 during VSM. The reason for this was higher mean weighted average hourly ambient temperature of 10.65 °C (Table 6). The COP value in other climatic conditions was lower than Valentia because of higher HDDs, and poor performance at lower mean weighted average hourly ambient temperature. Among the considered climatic conditions the lowest annual COP occurs in Aviemore, with value of 2.38 and 2.98 during respective FSM and VSM (C1) of control. The COP values in C1 in both control modes are either higher or equal to 2.5, hence could be considered as eligible for renewable heat incentives scheme proposed in Northern Ireland (NI) [35]. The only exception was Aviemore during FSM in case of C1. The annual COPs changes significantly with the change in control mode of operation plus the heat supply temperature, and climatic conditions. The annual performance results were summarized in Table 10. The COP improvement due to change in control mode (VSM vs. FSM) and heat supply temperature (C1 vs. C2 and C1 vs. C3) in four climatic conditions have been shown in Figure 4a,b. The highest COP improvement (%) due to change in control mode occurs in case of C1 in milder climatic conditions of Valentia with 33.4% increase and become 25% in
Aviemore. It could be concluded that the benefit associated with VSM against FSM is more in milder climatic conditions at low supply temperature(C1) with similar results by other researchers [24,68]. The highest COP improvement during VSM for changing heat supply temperature (C1 vs. C3) was found 55% in Valentia.

3.2.2. Energy Consumptions

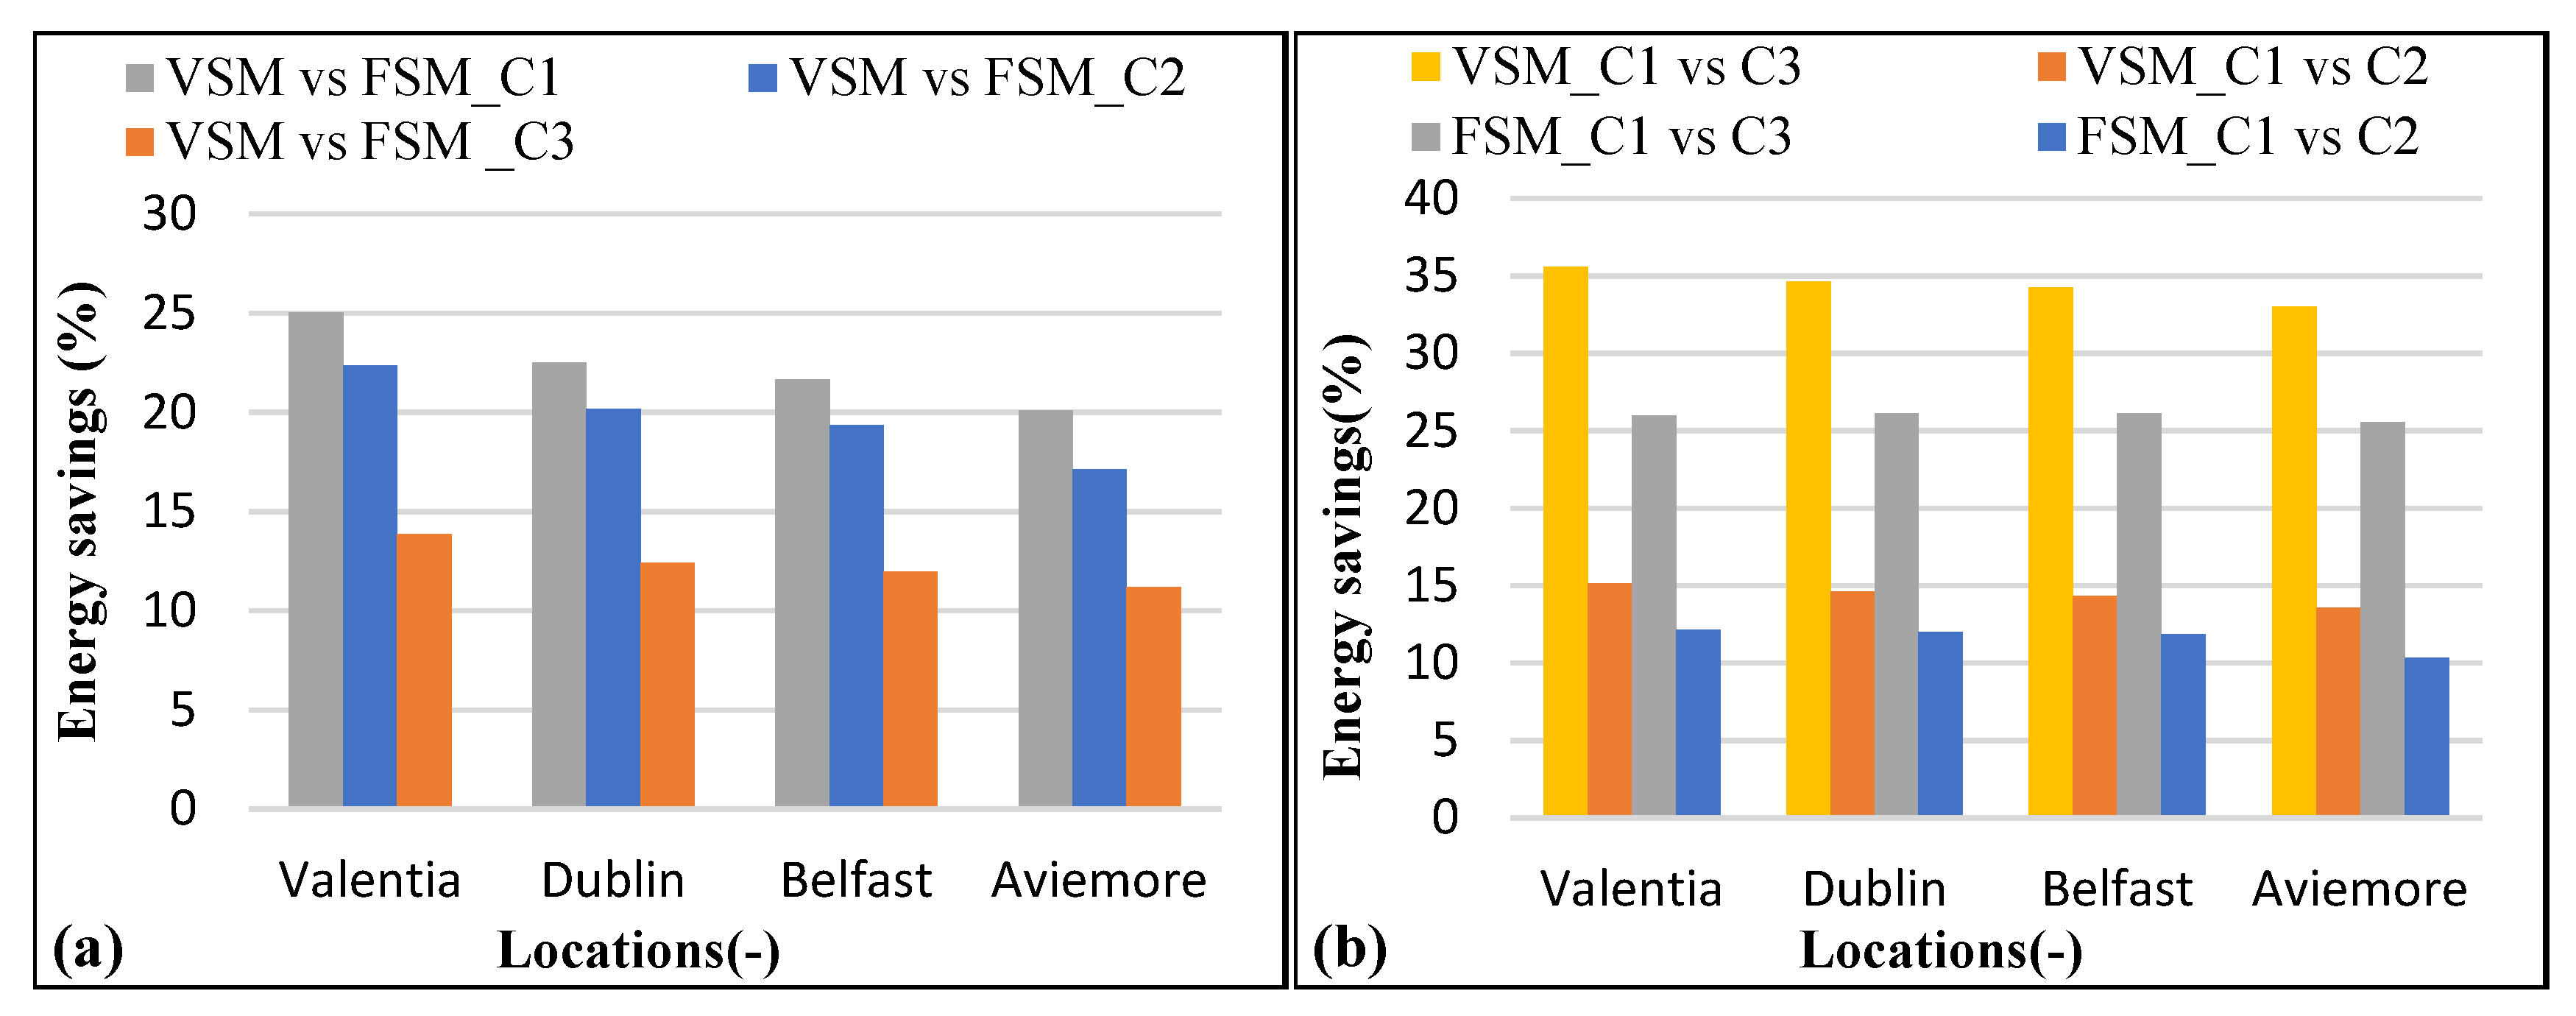
The energy savings in percentage (%) due to control mode and heat supply temperature in four locations with different climatic conditions have been shown in Figure 5a,b. The energy savings reduce for the colder climatic condition of Aviemore due to change in control mode and heat supply temperature also highlighted by other researchers [23,68,69]. In case of FSM energy savings percentage change due to varying climatic conditions is very minute and with smaller range of around 35% to 26%, respectively (C1 vs. C3).

3.3. HP Retrofit Assessment

The HP retrofit instead of OB/GB, electric heating option and a comparative study with the existing installed air sourced-VHTHP system inside the test house [24] in two different control modes with different heat supply temperature (C1, C2, C3) in four different climatic conditions is summarized in Table 11. The price per unit of energy for different fuel type, and carbon emission factor were used presented earlier. The results for annual running cost, annual carbon emissions for all the considered heating technologies at different percentage (%) efficiencies in four climatic conditions have been presented.
The VHTHP carbon emissions and electric energy consumptions in comparison to the developed system depends on the supply temperature. The climatic conditions influence the HP performance as a retrofit option. The HP annual running cost, and carbon emissions changes according to climatic conditions mainly because of two reasons, i.e., changing heat load demand, and HP performance. In case of boilers (oil/gas), and electric heating option the annual running cost varies only because of changing house heat load demand. The air sourced- VHTHP performance real experimental data was only available for the Belfast climatic conditions. Therefore, while comparing cost and carbon savings with the other heating technologies in the following subsections, VHTHP was presented only for Belfast climatic conditions. The control mode of operation, and heat supply temperature (C1, C2, C3) significantly affect the annual running cost and carbon emissions. In the following two subsections the HP annual running cost and carbon emissions savings in percentage have been compared to other heating technologies, when the HP retrofitted into the reference building. The developed HP in both control mode performance in terms of carbon emissions and primary energy consumptions is higher than the fossil fuel-based oil/gas boilers and electric heating option. However, the developed HP in terms of carbon emissions was found only more valuable at lower heat supply temperature in contrast to VHTHP.

3.3.1. Annual Running Cost Savings

As a rule of thumb, HP to be competitive with the gas/oil boilers in relation to the annual running cost the criteria mentioned in Equation (11), needs to be fulfilled.
Annual   COP hp electricity   price   per   KWh gas / oil   boiler   price   per   KWh
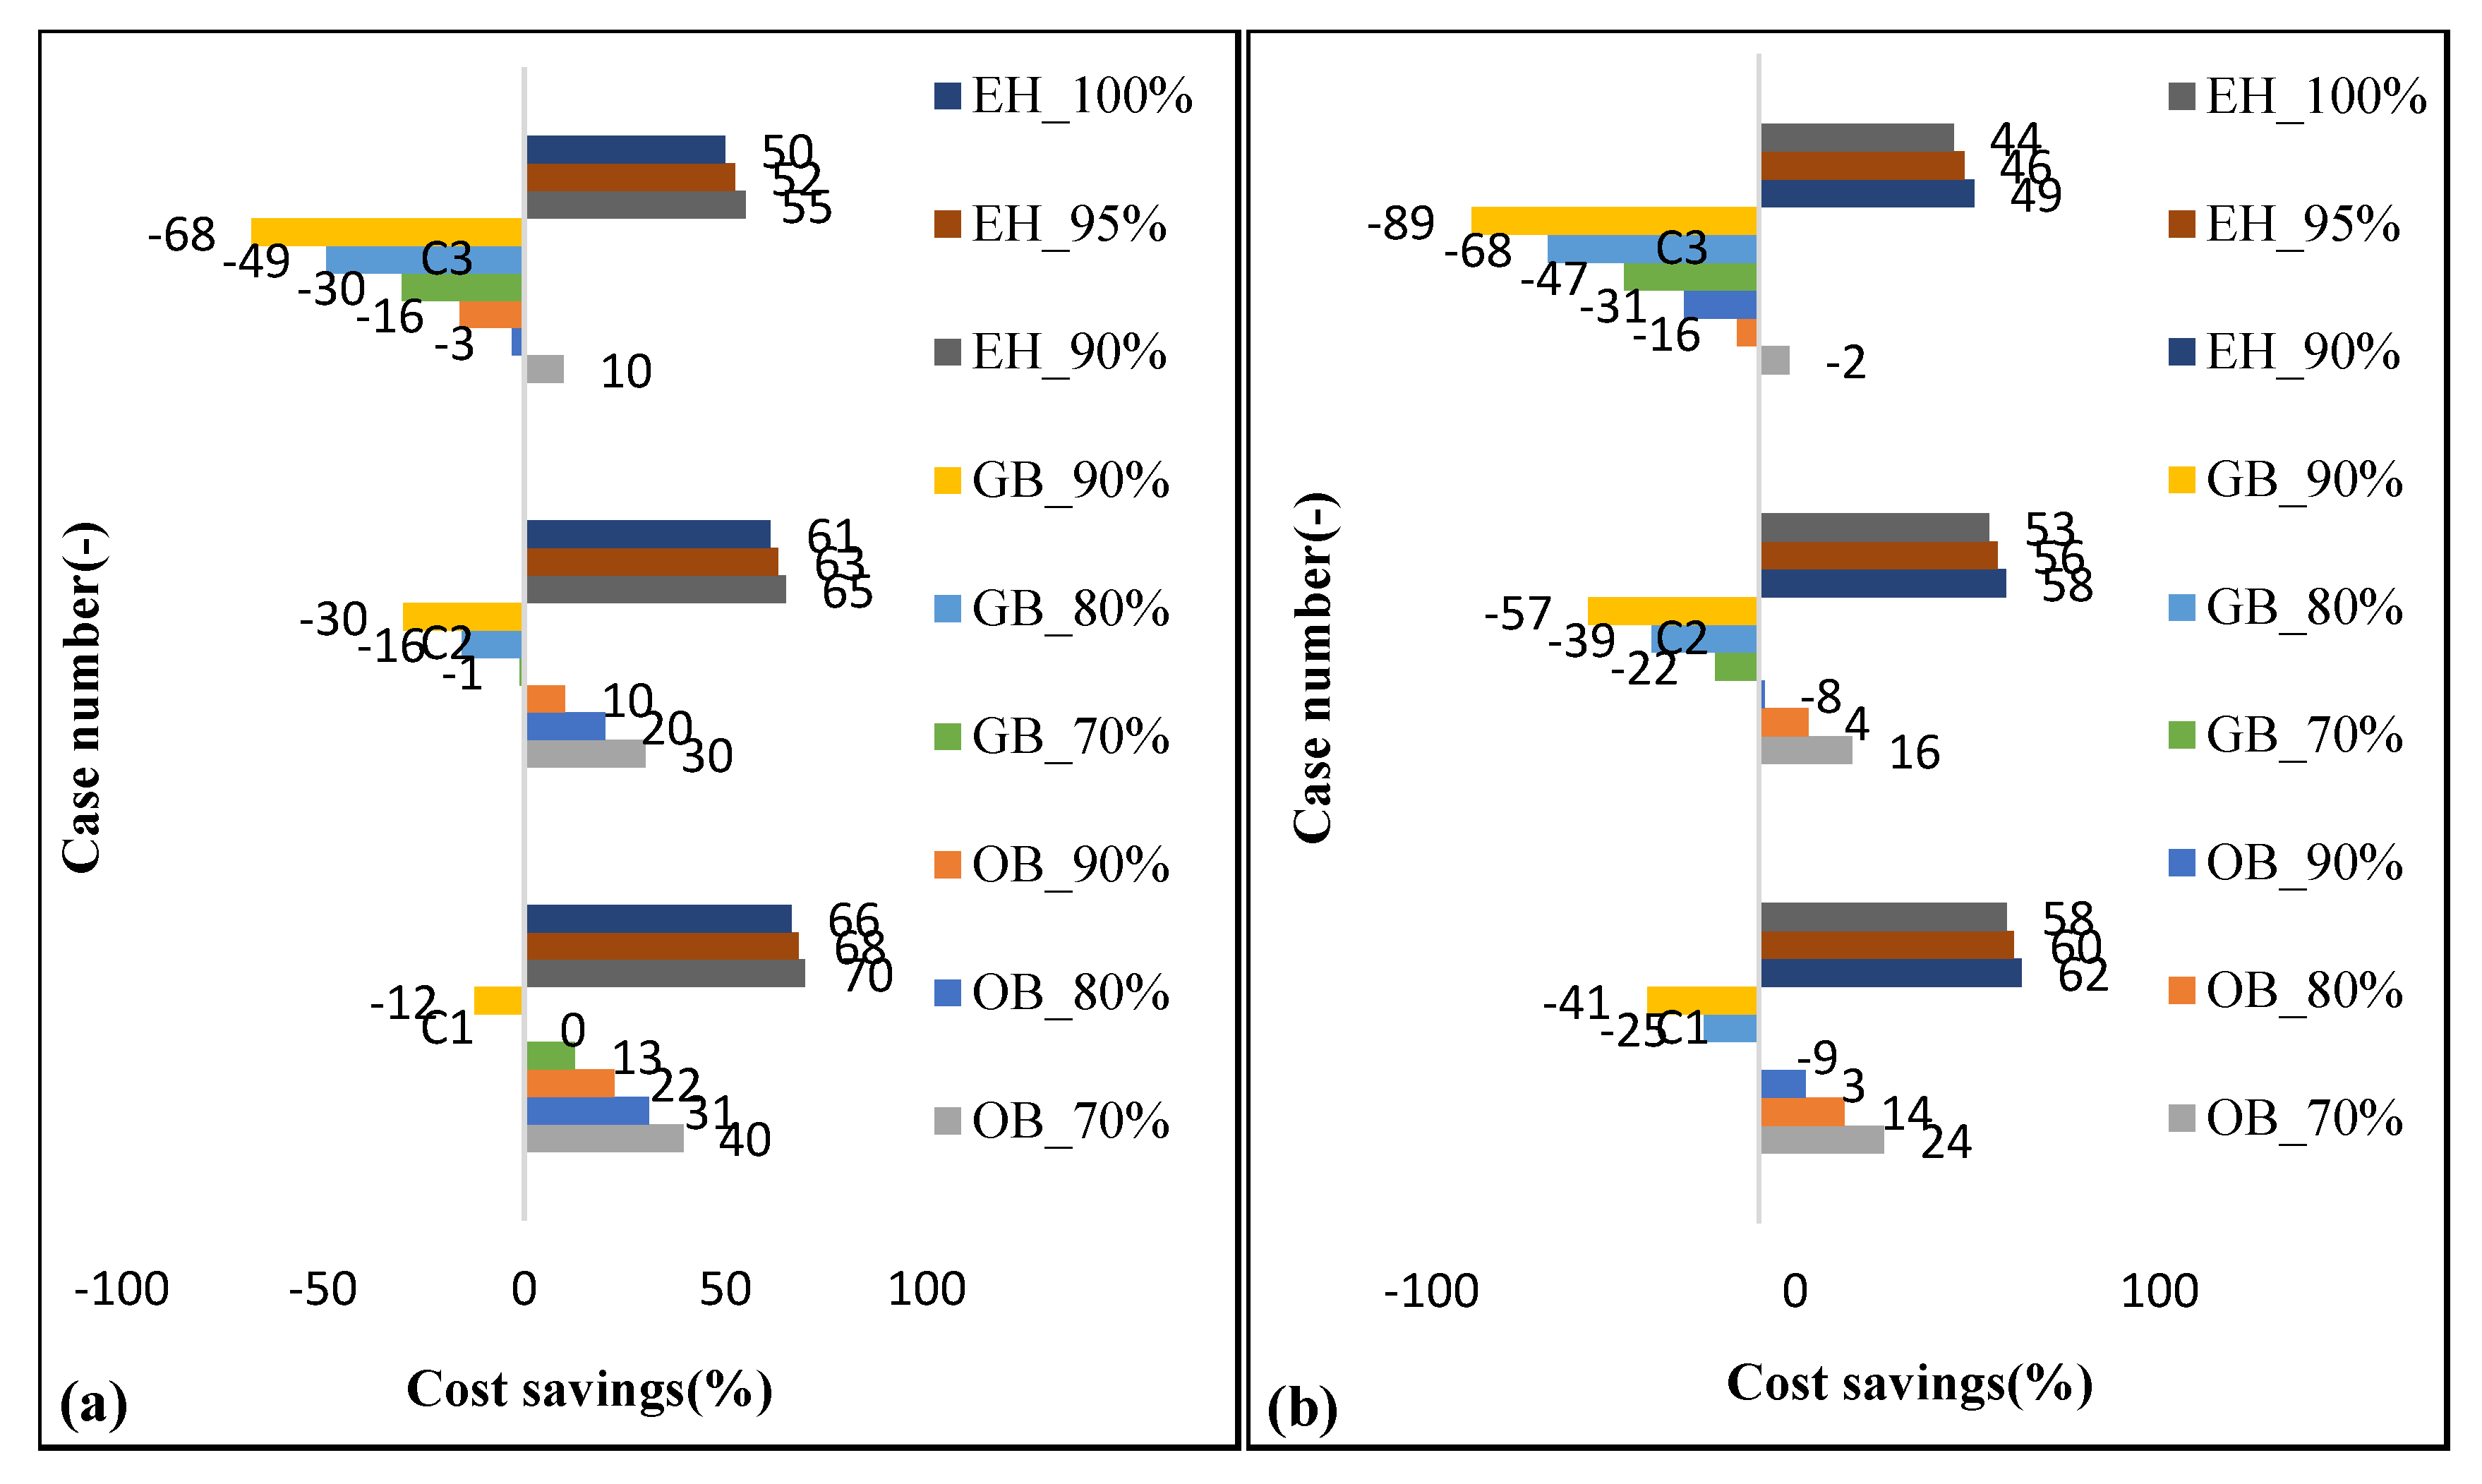
The percentage (%) cost savings when the OB, GB, VHTHP, and EH is replaced by the developed HP in the four considered climatic conditions was presented in Figure 6, Figure 7, Figure 8 and Figure 9. The positive values indicate running cost for the developed HP was smaller than other heating technologies, while negative values means that the developed HP is not cost effective. In Valentia, during VSM (C1), could save cost in comparison to OB/GB, EH option at all percentage efficiencies. Similar trends of cost savings have been shown for other climatic conditions with the only exception of GB at 90% efficiencies. In Dublin, Belfast, and Aviemore, VSM(C1) instead of GB at 90% shows negative respective values of −4%, −6%, and −12%, means no money savings. It could be anticipated that the cost savings for the HP reduces with the colder climatic conditions. The other two cases considered (C2, C3) could also shows the same trends. The VHTHP compared for cost savings is only shown for Belfast. The HP in comparison to VHTHP have shown savings (C1 and C2) for both control mode (VSM and FSM) with negative values when it comes to C3, and the reason is superior performance of VHTHP at higher supply temperature. During FSM money was saved for C1, when compared to OB at all efficiency, with some negative values at 90% and 80% efficiency GB and increasing trend in negative cost savings as we move from milder to severe climate conditions. The C3 shows negative cost savings also for OB at 90%, 80% in addition to GB (90%, 80%,70%) during FSM.

3.3.2. Annual Carbon Emission Savings

The carbon emission savings with the developed HP at C1, C2, C3 in both control modes compared to other heating options into the reference building is shown in Figure 10, Figure 11, Figure 12 and Figure 13. The carbon emission savings depends on the control strategy (VSM or FSM), climatic conditions, case considered (C1, C2, C3) and percentage efficiency for other heating technologies. In case of FSM the carbon emission savings is lower in comparison to VSM for all cases considered. The HP have shown positive values for carbon emissions savings compared to all other heating technologies even at highest efficiency with the only exception of VHTHP. The developed HP when retrofitted with GB at the highest percentage efficiency of 90% could cut the carbon emission in VSM(C1) ranges from 62% to 57% according to the climatic conditions from milder to severe. The respective values ranges become 71% to 66% when the GB is operated at 70% efficiency. The HP in VSM (C1) when compared with the most efficient (90%) modern oil boilers could cut the carbon emissions in the range of 68–64% with the increase in savings between 75–72% for old heavy weight OB (70%) efficiency.

3.4. Payback Period

The payback period analysis for VSM, and low temperature heating distribution installations is summarized in Table 12. The annual running cost savings with the HP operation depends on the control mode of operations, and installed heating distributions systems. The cost of control devices is reducing with advancement in technology [68]. The HP at low heat supply temperature of 35 °C needs additional installation cost of GBP 6000 [77] and the payback period was found as 10.2 years in FSM and reduces to 9 years in case of VSM. The additional cost associated with VSM in contrast to FSM is calculated as G B P   1000 [68] with payback period depending on the case considered. The cost analysis in the present calculation using the simple payback period approach by Equation (12).
Pay   back   period = Additional   cost   due   to   control   devices / heating   distribution   system ( GBP ) Annual   cost   savings ( GBP )

4. Conclusions and Future Work

The question of best operating point for the variable speed compressor-based heat pump technology at lower to medium and high heat supply temperature for domestic retrofit have been investigated for the 1900s Mid terraced test house. The aim was co-efficient of performance improvement potential, using the control techniques and heat supply temperature for domestic retrofit. The carbon emissions and cost savings were analyzed based on the real prototype development. The energy savings with the system was dependent on climatic conditions, house thermal inertia, control mode of operations and heat supply temperature. All these factors are interconnected to each other and needs to be considered at the same time to draw solid conclusion. The maximum improvement possible for the Mid terraced 1900s test house with change of control (VSM vs. FSM) was at lower heat supply temperature, up to 33% in milder climatic of conditions of Valentia and reduces to 25% in case of severe climatic conditions of Aviemore.
The developed HP as a domestic retrofit technology have shown promising results in terms of carbon emissions reduction in comparison to fossil fuel-based heating technologies for all considered locations. The respective carbon emission savings of 62%, and 68% were obtained when the HP (VSM, C1) was retrofitted instead of modern GB and OB at 90% efficiency in the milder climatic conditions of Valentia. In case of heavy weight condensing GB and OB assumptions (70% efficiency) the carbon emission could reduce even more with a value of up to 71% and 75%, respectively. The HP (VSM) was able to show superior characteristics than the VHTHP system at low supply temperature but become less effective at high supply temperature of 55 °C. This could be concluded that if the existing radiators is being used without heating distribution replacement with either modern radiators, or underfloor heating, then the VHTHP is more favorable due to its higher performance at high supply temperature and lower ambient temperature. This scenario is similar to plug and play with minimum house disruption. The annual running cost for the developed HP in Belfast climatic conditions was not economical compared to GB at all percentage efficiencies with higher heat supply temperature (C1, C2) in both control mode but become effective at lower heat supply temperature(C1) during VSM when the GB was operating at 80%, and 70% efficiency and a respective cost savings of 6% and 17% were obtained. However, an increase of 6% annual running cost with the HP during VSM(C1) was observed when compared to GB at 90% efficiency. The HP during VSM(C1) was able to defeat the GB at all percentage efficiencies (90%,80%,70%) and respective cost savings of 1%, 12%, and 23% was achieved in Valentia climatic conditions. The HP was unable to defeat the GB at all percentage efficiency in terms of annual running cost in Valentia climatic conditions with high supply temperature (C2, C3). However, was able to show superior performance than OB at all percentage efficiencies in all cases (C1, C2, C3) during VSM of control with the only exception of OB (90% efficiency) at C3. The following other conclusions could be drawn;
(a)
The low supply temperature with variable speed capacity control approach is more beneficial for the electrifications of heating sector with the HP but with increased initial cost of heating distribution system installations.
(b)
The HP (VSM vs. FSM) annual performance improves by 27% at 35 °C heat supply temperature for Belfast climatic conditions.
(c)
The HP(VSM) annual performance degrades by 51% with the change in supply temperature from 35 °C to 55 °C in Belfast climatic conditions.
(d)
The HP retrofit assessment needs to be performed prior to large scale installations.
(e)
The VHTHP was found more beneficial with the existing heating distribution system.
(f)
In terms of annual running cost, the developed HP was not economical compared to advanced GB but proved to be advantageous in terms of carbon emissions savings.

5. Research Limitations and Future Work

The retrofit assessment was performed with the lab-based testing results and numerical model, the actual installations inside the test house could produce more valuable and solid results. The transient losses inside the existing work were calculated based on the approach mentioned in the standard. The losses could be calculated more realistically in actual installations inside the test house. The following work could be considered in future;
(a)
Other property types and the impact of the load demand on the carbon emission savings could be assessed to investigate the benefits associated with the variable speed compressor-based system.
(b)
The comparative performance results evaluation with the ground source heat pump and other renewable energy technology could also be valuable in future work as a domestic retrofit option.
(c)
Detail economic analysis at low heat supply temperature distribution installations system.
(d)
The heat pump testing with thermal energy storage for possible load shifting potential would be valuable work as part of SPIRE 2 project.

Author Contributions

Conceptualization, N.H. and M.-J.H.; methodology, M.-J.H.; software, M.A.; validation, M.A.; formal analysis, M.A.; investigation, M.A.; resources C.W. and D.C.; data curation, M.A.; writing—original draft preparation, M.A.; writing—review and editing, M.-J.H.; visualization, M.A.; supervision, N.H. and M.-J.H.; project administration, N.H. and M.-J.H.; funding acquisition, N.H. and M.-J.H. All authors have read and agreed to the published version of the manuscript.

Funding

The SPIRE 2 project is supported by the European Union’s INTERREG VA Program, managed by the Special EU Programs Body (SEUP(B). The views and opinions expressed in this paper do not necessarily reflect those of the European Commission or SEUPB.

Conflicts of Interest

The authors declare no conflict of interest.

Nomenclature

ASHPair-source heat pump
C1case study 1 (35 °C fixed heat supply temperature)
C2case study 2 (45 °C fixed heat supply temperature)
C3case study 3 (55 °C fixed heat supply temperature)
CFcorrections factor (−)
CO2carbon di-oxide
COPco-efficient of performance (−)
DBdry bulb temperature ( °C)
Eelectrical energy consumption (KWh)
EHelectric heater
EIRelectric input ratio (−)
FSMfixed speed mode
GBgas boiler
GHGsgreenhouse gas emissions
HDDsheating degree days
OBoil boilers
Pelectric power (KW)
Qheat pump useful heat output (KWh)
PLFpart load factor (−)/ratio of part load to full load efficiency
PLRpart load ratio (−)/ratio of heating capacity to maximum HP capacity
RHrelative humidity
VSMvariable speed mode
VHTHPvery high temperature heat pump
V m e a s measured value (−)
V p r e d   predicated value (−)
WBwet bulb temperature ( °C)
WSTwater supply temperature ( °C)
Symbols
φ relative humidity (−)
G B P pound
ω frequency (Hz)
ρ water density
f C O P COP correction factor (−)
  C c degradation co-efficient
Subscripts
Aair
hpheat pump
fullfull load
ibin number
wwater

References

  1. United Nations Environment Programme. Renewables 2020 Global Status Report; United Nations Environment Programme: Nairobi, Kenya, 2020; p. 367. Available online: Https://www.ren21.net/wp-content/uploads/2019/05/gsr_2020_full_report_en.pdf (accessed on 29 September 2021).
  2. Energy Consumption in the UK. Technical. Report., Department for Business, Energy, and Industrial Strategy. 2019. Available online: Https://www.gov.uk/government/collections/digest-of-uk-energy-statistics-dukes (accessed on 24 May 2021).
  3. Net Zero by 2050: A Roadmap for the Global Energy System. Available online: Https://www.iea.org/events/net-zero-by-2050-a-roadmap-for-the-global-energy-system (accessed on 18 May 2021).
  4. Climate Change Act 2008, Technical Report., Parliament of the United Kingdom. Available online: Https://www.legislation.gov.uk/ukpga/2008/27/pdfs/ukpga_20080027_en.pdf (accessed on 30 March 2021).
  5. CCC. Net Zero. The UK’s Contribution to Stopping Global Warming. 2019. Available online: Https://www.theccc.org.uk/publication/net-zero-the-uks-contribution-to-stopping-global-warming/ (accessed on 18 May 2021).
  6. GOV.UK. Spring Statement 2019: What You Need to Know—GOV.UK. 2019. Available online: Https://www.gov.uk/government/topical-events/spring-statement-2019 (accessed on 18 May 2021).
  7. UN Climate Change Conference, Glasgow, UK, 1–12 November 202. Available online: Https://ukcop26.org/; (accessed on 18 May 2021).
  8. Druckman, A.; Jackson, T. Household energy consumption in the UK: A highly geographically and socio-economically disaggregated model. Energy Pol. 2008, 36, 3177–3192. [Google Scholar] [CrossRef] [Green Version]
  9. Kelly, N.; Cockroft, J. Analysis of retrofit air source heat pump performance: Results from detailed simulations and comparison to field trial data. Energy Build. 2011, 43, 239–245. [Google Scholar] [CrossRef] [Green Version]
  10. Greenhouse Gas Reporting: Conversion Factors 2020. Available online: Https://www.gov.uk/government/publications/greenhouse-gas-reporting-conversion-factors-2020 (accessed on 18 May 2021).
  11. Self, S.J.; Reddy, B.V.; Rosen, M.A. Geothermal heat pump systems: Status review and comparison with other heating options. Appl. Energy 2013, 101, 341–348. [Google Scholar] [CrossRef]
  12. Carroll, P.; Chesser, M.; Lyons, P. Air Source Heat Pumps field studies: A systematic literature review. Renew. Sustain. Energy Rev. 2020, 134, 110275. [Google Scholar] [CrossRef]
  13. Singh, H.; Muetze, A.; Eames, P. Factors influencing the uptake of heat pump technology by the UK domestic sector Renew. Energy 2010, 35, 873–878. [Google Scholar] [CrossRef]
  14. BBC Briefing-Energy. Available online: Https://news.files.bbci.co.uk/include/newsspec/pdfs/bbc-briefing-energy-newsspec-25305-v1.pdf (accessed on 30 March 2021).
  15. Dwelling Stock Estimates in England, Technical Report., Ministry of Housing, Communities and Local Government. UK. Available online: Https://assets.publishing.service.gov.uk/government/uploads/system/uploads/attachment_data/file/987564/Dwelling_Stock_Estimates_31_March_2020_Release.pdf (accessed on 25 May 2021).
  16. Northern Ireland House Condition Survey 2016. Main Report. Technical. Rep., Northern Ireland Housing Executive. Available online: Https://www.nihe.gov.uk/Working-With-Us/Research/House-Condition-Survey (accessed on 30 March 2021).
  17. Energy Analysis Focus Report: A study of Hard-to-Treat Homes using the English House Condition Survey 2008. Technical Report., BRE Housing. Available online: Https://www.bre.co.uk/filelibrary/pdf/rpts/Hard_to_Treat_Homes_Part_I.pdf (accessed on 30 March 2021).
  18. Abid, M.; Hewitt, N.; Huang, M.J.; Wilson, C.; Cotter, D. Experimental study of the heat pump with variable speed compressor for domestic heat load applications. In Proceedings of the 25th Conference of Compressor Engineering, Perdue, MD, USA, 24–28 May 2021. [Google Scholar]
  19. European Standard EN 14511-3—Air Conditioners, Liquid Chilling Packages and Heat Pumps with Electrical Driven Compressors for Space Heating and Cooling-Part 3, Test Methods. 2018. Available online: Https://www.iea.org/policies/7031-en-14511-22018-test-methods-and-standards-for-air-conditioners-liquid-chilling-packages-and-heat-pumps (accessed on 18 May 2021).
  20. EU Directive on the Energy Performance of Buildings (recast) (2010/31/EU). Technical. Report, European Parliament. 2010. Available online: Https://ec.europa.eu/energy/topics/energy-efficiency/energy-efficient-buildings/energy-performance-buildings-directive_en (accessed on 18 May 2021).
  21. Palmer, J.; Cooper, I. United Kingdom housing energy fact file. London, 2013. Technical Report, Department of Energy and Climate Change. 2013. Available online: Https://www.gov.uk/government/collections/domestic-energy-fact-file-and-housing-surveys (accessed on 18 May 2021).
  22. BS EN 442-2: Radiators and Convectors Part 2: Test Methods and Rating, Technical. Report., BSI. 2014. Available online: Https://civilnode.com/download-standard/10691893642898/bs-en-442-2-radiators-and-convectors-part-2-test-methods-and-rating (accessed on 18 May 2021).
  23. Madonna, F.; Bazzocchi, F. Annual performances of reversible air-to-water heat pumps in small residential buildings. Energy Build. 2013, 65, 299–309. [Google Scholar] [CrossRef]
  24. Khoa, K.; Jun, M.; Shah, N.; Wilson, C.; Mac, P.; Byrne, R.; Hewitt, N.J. Techno-economic assessment of cascade air-to-water heat pump retrofitted into residential buildings using experimentally validated simulations. Appl. Energy 2019, 250, 633–652. [Google Scholar] [CrossRef]
  25. Le, K.X. Cascade Air-To-Water Heat Pump with and Without Thermal Energy Storage: A Study for UK Domestic Retrofit 2020. Ph.D. Thesis, Ulster University, Coleraine, Northern Ireland, 2020. Available online: Https://pure.ulster.ac.uk/ws/portalfiles/portal/86064289/2020LeKPhd.pdf (accessed on 18 May 2021).
  26. Junghans, L. Evaluation of the economic and environmental feasibility of heat pump systems in residential buildings, with varying qualities of the building envelope. Renew. Energy 2015, 76, 699–705. [Google Scholar] [CrossRef]
  27. Hewitt, N.; Huang, M.J. Defrost cycle performance for a circular shape evaporator air source heat pump. Int. J. Refrig. 2008, 31, 444–452. [Google Scholar] [CrossRef]
  28. Asaee, S.; Ugursal, V.; Beausoleil-Morrison, I. Techno-economic feasibility evaluation of air to water heat pump retrofit in the Canadian housing stock. Appl. Therm. Eng. 2017, 111, 936–949. [Google Scholar] [CrossRef] [Green Version]
  29. Huchtemann, K.; Muller, D. Evaluation of a field test with retrofit heat pumps. Build Environ. 2012, 53, 100–106. [Google Scholar] [CrossRef]
  30. Jenkins, D.; Tucker, R.; Ahadzi, M.; Rawlings, R. The performance of air-source heat pumps in current and future offices. Energy Build. 2008, 40, 1901–1910. [Google Scholar] [CrossRef]
  31. Cabrol, L.; Rowley, P. Towards low carbon homes—A simulation analysis of building-integrated air-source heat pump systems. Energy Build. 2012, 48, 127–136. [Google Scholar] [CrossRef] [Green Version]
  32. Detailed Analysis from the First Phase of the Energy Saving Trust’s Heat Pump Field Trial 2012. Tech. Rep., Department of Energy and Climate Change. Available online: Https://assets.publishing.service.gov.uk/government/uploads/system/uploads/attachment_data/file/48327/5045-heat-pump-field-trials.pdf (accessed on 18 May 2021).
  33. Boait, P.; Fan, F.; Stafford, A. Performance and control of domestic ground-source heat pumps in retrofit installations. Energy Build. 2011, 43, 1968–1976. [Google Scholar] [CrossRef]
  34. Bagarella, G.; Lazzarin, R.; Noro, M. Annual simulation, energy, and economic analysis of hybrid heat pump systems for residential buildings. App. Therm. Eng. 2016, 99, 485–494. [Google Scholar] [CrossRef]
  35. Ala, G.; Orioli, A.; Di Gangi, A. Energy and economic analysis of air-to-air heat pumps as an alternative to domestic gas boiler heating systems in the South of Italy. Energy 2019, 173, 59–74. [Google Scholar] [CrossRef]
  36. Hewitt, N.J.; Huang, M.J.; Anderson, M.; Quinn, M. Advanced air source heat pumps for UK and European domestic buildings. Appl. Therm. Engr. 2011, 31, 3713–3719. [Google Scholar] [CrossRef]
  37. Matthew, V.Q. The Development of a Capacity Controlled Advanced Cycle Air Source Heat Pump for Domestic Retrofit Applications. Ph.D. Thesis, CST, Ulster University, Belfast, UK, 2012. Available online: Https://ethos.bl.uk/OrderDetails.do?did=1&uin=uk.bl.ethos.592665 (accessed on 18 May 2021).
  38. Lea, K.X.; Huang, M.J.; Shah, N.; Wilson, C.; Artain, P.M.; Byrne, R.; Hewitt, N.J. High Temperature Air Source Heat Pump Coupled with Thermal Energy Storage: Comparative Performances and Retrofit Analysis. Energy Procedia 2019, 158, 3878–3885. [Google Scholar] [CrossRef]
  39. Shah, N.; Huang, M.; Hewitt, N. Experimental study of a diesel engine heat pump in heating mode for domestic retrofit application. Appl. Therm. Eng. 2016, 98, 522–531. [Google Scholar] [CrossRef]
  40. Shah, N.N.; Huang, M.J.; Hewitt, N.J. Performance analysis of diesel engine heat pump incorporated with heat recovery. Appl. Therm. Eng. 2016, 108, 181–191. [Google Scholar] [CrossRef]
  41. Kinab, E.; Marchio, D.; Riviere, P.; Zoughaib, A. Reversible heat pump model for seasonal performance optimization. Energy Build. 2010, 42, 2269–2280. [Google Scholar] [CrossRef]
  42. Dongellini, M.; Naldi, C.; Morini, G.L. Seasonal performance evaluation of electric air-to-water heat pump systems. Appl. Therm. Eng. 2015, 90, 1072–1081. [Google Scholar] [CrossRef]
  43. Vocale, P.; Morini, G.L.; Spiga, M. Influence of outdoor air conditions on the air source heat pumps performance. Energy Procedia. 2014, 45, 653–662. [Google Scholar] [CrossRef] [Green Version]
  44. Underwood, C.P.; Royapoor, M.; Sturm, B. Parametric modelling of domestic air source heat pumps. Energy Build. 2017, 139, 578–589. [Google Scholar] [CrossRef] [Green Version]
  45. Hervas-Blasco, E.; Pitarch, M.; Navarro-Peris, E.; Corberan, J.M. Optimal sizing of a heat pump booster for sanitary hot water production to maximize benefit for the substitution of gas boilers. Energy 2017, 127, 558–570. [Google Scholar] [CrossRef]
  46. Jeter, S.M.; Wepfer, W.J.; Fadel, G.M.; Cowden, N.E.; Dymfk, A.A. Variable speed drive heat pump performance. Energy 1987, 12, 1289–1298. [Google Scholar] [CrossRef]
  47. Qureshi, T.Q.; Tassou, S.A. Variable-speed capacity control in refrigeration systems. Appl. Therm. Eng. 1996, 16, 103–113. [Google Scholar] [CrossRef]
  48. Wong, A.K.H.; James, R.W. Capacity control of a refrigeration system using a variable speed compressor. Build. Serv. Eng. Res. Technol. 1988, 9, 63–68. [Google Scholar]
  49. Wong, A.K.H.; James, R.W. Influence of control systems on the performance of refrigeration systems. AIRAH J. 1989, 43, 21–36. [Google Scholar]
  50. Marquand, C.J.; Tassou, S.A.; Wang, Y.T.; Wilson, D.R. An economic comparison of a fixed speed, a two speed, and a variable speed vapour compression heat pump. Appl. Energy 1984, 16, 59–66. [Google Scholar] [CrossRef]
  51. Miller, W.A. Laboratory examination and seasonal analyses of the dynamic losses for a continuously variable-speed heat pump. ASHRAE Trans. 1988, 94, 1246–1268. Available online: Https://ui.adsabs.harvard.edu/#abs/1988STIN...8911174M/abstract (accessed on 18 May 2021).
  52. Tassou, S.A.; Qureshi, T.Q. Comparative performance evaluation of positive displacement compressors in variable-speed refrigeration applications. Int. J. Refrig. 1998, 21, 29–41. [Google Scholar] [CrossRef]
  53. Halozan, H. Inverter-driven heat pumps for hydronic systems. ASHRAE Trans. 1988, 1269–1278. Available online: Https://heatpumpingtechnologies.org/publications/inverter-driven-heat-pumpsanalysis-of-heat-pump-units-and-systems. (accessed on 18 May 2021).
  54. Lande, J. Tests on air-to-air heat pumps, with and without inverter control (in Swedish). R. Inst. Technol. 1992, 92, 36. [Google Scholar]
  55. Tassou, S.A.; Marquand, C.J. Comparison of the performance of capacity controlled and conventional on/off con-trolled heat pumps. Appl. Energy 1983, 14, 241–256. [Google Scholar] [CrossRef]
  56. Bergman, A. Impact of on/off Control of Heat Pumps Laboratory Testing (in Swedish); Byggforskningsrådet R111: Stockholm, Sweden, 1985; 67p. [Google Scholar]
  57. Tassou, S.A. Experimental investigation of the dynamic performance of variable-speed heat-pumps. J. Energy Inst. 1991, 64, 95–98. [Google Scholar]
  58. Garstang, S.W. Variable frequency speed control of refrigeration compressors. AIRAH J. 1990, 44, 21–23. [Google Scholar]
  59. Zhao, L.; Zhao, L.L.; Zhang, Q. Theoretical and basic experimental analysis on load adjustment of geothermal heat pump systems. Energy Convers. Manag. 2003, 44, 1–9. [Google Scholar] [CrossRef]
  60. Munari, P.; Riva, D.E.; Col, D.D.; Mantovan, M. 2011, Energy efficiency of variable capacity ground source heat pumps. In Proceedings of the International Sorption Heat Pump Conference, Padua, Italy, 5–7 April 2011. [Google Scholar]
  61. Adhikari, R.S.; Aste, N.; Manfren, M.; Marini, D. Energy savings through variable speed compressor heat pump systems. Energy Procedia 2012, 14, 1337–1342. [Google Scholar] [CrossRef] [Green Version]
  62. Karlsson, F.; Fahlen, P. Improving efficiency of hydronic heat pump heating systems. In Proceedings of the 21st International Congress of Refrigeration, Washington, DC, USA, 17–22 August 2003. [Google Scholar]
  63. Karlsson, F.; Fahlen, P. Capacity-controlled ground source heat pumps in hydronic heating systems. Int. J. Refrig. 2007, 30, 221–229. [Google Scholar] [CrossRef]
  64. Karlsson, F. Capacity Control of Residential Heat Pump Heating Systems. Ph.D. Thesis, Building Services Engineering Department of Energy and Environment Chalmers University of Technology, Stockholm, Sweden, 2007. Available online: Https://www.sematicscholar.org/paper/Capacity-Control-of-Residential-Heat-Pump-Heating-Karlson/80522395b743eb5d5a5cd89841b572ba40b69fb3 (accessed on 18 May 2021).
  65. Karlsson, F.; Fahlen, P. Impact of design and thermal inertia on the energy saving potential of capacity-controlled heat pump heating systems. Int. J. Refrig. 2008, 31, 1094–1103. [Google Scholar] [CrossRef]
  66. Aprea, C.; Mastrullo, R.; Renno, C. Experimental analysis of the scroll compressor performances varying its speed. Appl. Therm. Eng. 2006, 26, 983–992. [Google Scholar] [CrossRef]
  67. Aprea, C.; Mastrullo, R.; Renno, C. Determination of the compressor optimal working conditions. Appl. Therm. Eng. 2009, 29, 1991–1997. [Google Scholar] [CrossRef] [Green Version]
  68. Mader, G.; Madani, H. Capacity control in air-water heat pumps: Total cost of ownership analysis. Energy Build. 2014, 81, 296–304. [Google Scholar] [CrossRef]
  69. Madani, H.; Claesson, J.; Lundqvist, P. Capacity control in ground source heat pump systems part II: Comparative analysis between on/off controlled and variable capacity systems. Int. J. Refrig. 2011, 34, 1934–1942. [Google Scholar] [CrossRef]
  70. Abid, M.; Hewitt, N.; Huang, M.J.; Wilson, C.; Cotter, D. Heat Supply Temperature Impact on the Seasonal Cost of Low Carbon Domestic Heat Pump Technology. ICAE; December 2020. Available online: Https://www.enerarxiv.org/page/thesis.html?id=2685 (accessed on 18 May 2021).
  71. Price Comparison Table—The Consumer Council. Available online: Https://www.consumercouncil.org.uk/energy-tables (accessed on 30 March 2021).
  72. ASHRAE. ASHRAE Guideline 2-2005, Engineering Analysis of Experimental Data; ASHRAE: Atlanta, GA, USA, 1986. [Google Scholar]
  73. Correa, F.; Cuevas, C. Air-water heat pump modelling for residential heating and domestic hot water in Chile. Appl. Therm. Eng. 2018, 143, 594–606. [Google Scholar] [CrossRef]
  74. Wolfram Research, Inc. Mathematica, Version 12.2; Wolfram Research, Inc.: Champaign, IL, USA, 2020. [Google Scholar]
  75. Huang, M.J.; Hewitt, N.J. The experimental analysis of the effect of ambient factors on the defrosting of economised vapour injection compressor air source heat pump in marine climates. Int. J. Refrig. 2013, 36, 820–827. [Google Scholar] [CrossRef]
  76. Klein, S.A. TRNSYS 17: A Transient System Simulation Program; Solar Energy Laboratory, University of Wisconsin: Madison, WI, USA, 2010. [Google Scholar]
  77. Myers, M.; Kourtza, E.; Kane, D.; Harkin, S. The Cost of Installing Heating Measures in Domestic Properties A Delta-EE Report for the Department for Business, Energy, and Industrial Strategy BEIS. Final Report 2018; Research Paper Number: 2020/028. Available online: Https://assets.publishing.service.gov.uk/government/uploads/system/uploads/attachment_data/file/913508/cost-of-installing-heating-measures-in-domestic-properties.pdf (accessed on 18 May 2021).
Figure 1. Bin distribution in (a) Belfast climatic conditions (Seasonal), (b) all locations (Annual).
Sustainability 13 10857 g001
Figure 2. HP monthly (a) Heat load demand, (b) COP in Belfast climatic conditions.
Sustainability 13 10857 g002
Figure 3. Operating control mode (VSM vs. FSM) improvement (%) in (a) CoP, (b) Energy savings.
Sustainability 13 10857 g003
Figure 4. Annual COP improvement (%) due to (a) control mode, (b) heat supply temperature.
Sustainability 13 10857 g004
Figure 5. Annual energy savings (%) due to (a) control mode, (b) heat supply temperature.
Sustainability 13 10857 g005
Figure 6. Valentia climatic conditions, (a) VSM, (b) FSM.
Sustainability 13 10857 g006
Figure 7. Dublin climatic conditions, (a) VSM, (b) FSM.
Sustainability 13 10857 g007
Figure 8. Belfast climatic conditions, (a) VSM, (b) FSM.
Sustainability 13 10857 g008
Figure 9. Aviemore climatic conditions, (a) VSM, (b) FSM.
Sustainability 13 10857 g009
Figure 10. Valentia climatic conditions, (a) VSM, (b) FSM.
Sustainability 13 10857 g010
Figure 11. Dublin climatic conditions, (a) VSM, (b) FSM.
Sustainability 13 10857 g011
Figure 12. Belfast climatic conditions, (a) VSM, (b) FSM.
Sustainability 13 10857 g012
Figure 13. Aviemore climatic conditions, (a) VSM, (b) FSM.
Sustainability 13 10857 g013
Table 1. Developed HP main components.
Component NameModel Number
Scroll compressorXPV0302E-4X9
DriveED3015B-H2XB
CondenserB80ASHx28/1P
ControllerSuperheat and Envelope Controller
Electronic expansion valveEXL-BF1-Unipolar stepper motor valve
ConverterRS 485
Temperature sensorNTC (ECN-EG30)
Communication cableSEC2-ED3-3W
RefrigerantR410a
Table 2. Uncertainties ranges for measurement instruments.
Measured QuantityMeasurement DeviceUnitsUncertainties
Relative Humidity ( )Hygrometer°±0.8%
Dry bulb temperature (DB)Thermocouple (T-type)°C± 2
Wet bulb Temperature (WB)Thermocouple (T-type)°C±0.3
Mass flow rateMASS 2100 DI15kg·s−1±1.3%
Enthalpy (h)Estimated from P, T measured valueskJ kg−11–1.76%
Pressure (P)PT5 Pressure transmitterskPa±1%
Temperature (Tr)NTC (ECN-EG30)°C±0.5
Mass flow rateElectromagnetic, Eltek, GC 62kg·s−1±1.5%
Pressure difference(static)Pressure GaugePa±5%
Temperature inlet/outlet (Tw)PT100, Eltek GD 24°C±0.1
Electric power meterLandis and Gr P350W±1%
CurrentTransducers LEM AKR 50 C420LA±0.5%
VoltageTransducers (ABB CC-U/VV±0.5%
Table 3. Heat Pump test results summary at lower heat supply temperature of 35 °C.
Set   Point   T a   ( ° C ) HC (kW) Δ T m ˙ w ( kg / s ) RH (%) T a   ( ° C ) ω (Hz)P (KW)COP
151810.060.4390.2514.91101.354.943.64
159.890.3689.7015.1693.103.654.11
129.950.2991.1815.1962.872.424.96
910.010.2291.8714.9545.601.884.78
610.080.1489.3415.1130.041.294.64
39.910.0791.4714.9215.210.853.50
7159.970.3689.146.90107.694.803.12
129.990.2988.376.8285.273.573.35
99.840.2287.856.7658.772.343.84
69.860.1487.916.7937.781.573.80
39.850.0787.777.3218.371.062.81
2129.890.2985.672.1292.253.943.04
99.980.2287.042.1367.192.633.43
69.970.1484.471.9243.481.823.29
39.850.0786.102.1921.101.072.79
−2129.920.2983.25−2.33102.844.262.81
99.980.2282.23−2.2374.322.953.05
610.030.1482.52−2.2248.641.963.05
39.960.0781.93−1.8523.801.142.62
Table 4. Heat Pump test results summary at medium water supply temperature of 45 °C.
Set   Point   T a   ( ° C ) HC (kW) Δ T m ˙ w   ( kg / s ) RH (%) T a   ( ° C ) ω (Hz) P (KW)COP
15189.920.4390.9915.25112.585.723.14
159.980.3690.1214.8797.024.373.43
129.930.2991.5414.8765.273.133.83
99.920.2290.5614.8847.462.403.75
69.890.1489.2714.8830.991.643.65
39.960.0791.5414.8715.521.112.68
7159.850.3688.076.82108.335.562.64
129.970.2988.227.7188.504.342.76
910.050.2288.426.8659.692.893.11
69.860.1488.686.8338.951.963.05
310.080.0788.816.9519.151.232.43
2129.970.2986.462.1093.844.602.61
99.880.2288.782.1867.643.292.73
69.950.1485.082.0444.392.362.54
38.920.0785.972.0820.791.362.20
−21210.030.2982.29−2.28105.174.942.41
99.880.2283.25−2.2575.633.432.62
69.930.1480.43−2.2348.832.392.51
39.930.0781.82−1.7923.071.392.15
Table 5. Heat Pump test results summary at high water supply temperature of 55 °C.
Set   Point   T a   ( ° C ) HC (kW) Δ T m ˙ w   ( kg / s ) RH (%) T a   (   ° C ) ω (Hz)P (KW)COP
151810.020.4392.6114.92114.236.842.63
159.960.3691.2314.8197.425.392.78
129.930.2989.8214.4368.644.182.87
99.880.2291.1014.6150.523.062.94
69.930.1489.9214.8032.492.112.83
39.880.0791.7814.8915.971.382.18
7159.860.3687.977.62110.906.262.39
1210.000.2987.327.0889.694.932.43
910.060.2289.136.2063.223.722.41
69.980.1487.876.3640.002.462.43
39.960.0788.216.5919.851.312.28
2129.980.2986.852.2194.525.432.21
99.910.2287.932.0269.374.072.21
69.970.1485.451.8844.832.702.22
39.950.0785.192.0524.341.372.14
−299.910.2281.69−2.2381.257.071.27
69.790.1481.93−2.2254.534.871.23
Table 6. Four (4) locations with climatic characteristic conditions.
LOCATIONValentiaDublinBelfastAviemore
Annual average hourly ambient temperature (°C)10.659.488.826.79
Max. hourly temperature (°C)23.0023.1523.7024.25
Min. hourly temperature (°C)−1.55−4.05−4.70−11.15
HDDs1829228425153252
Table 7. Impact of heat emitter output with Δ T   [77].
Heat Supply Temperature (°C) ( Δ T   ) Heat Output Relative to Δ T   = 50 in Percentage (%)Capacity Increase Required Relative to Δ T   = 50
5535631.6
4525412.4
3515214.8
Table 8. Other heating technologies with fuel cost, and carbon emissions factor.
Heating TechnologyEfficiency (−)/COPFuel Price (GBP/KWh)Carbon Emission Factor (−)
123
OB90%80%70%0.0680.243
GB90%80%70%0.0470.203
EH100%95%90%0.1750.29
VHTHP2.322.152.120.1750.29
Table 9. HP performance house results in the test for Belfast climatic conditions.
Type of Control (−)FSMVSM
Seasons/AnnualS1S2S3S4AnnualS1S2S3S4Annual
Case No.Mean ambient temperature (°C)4.057.6814.089.348.794.057.6814.089.348.79
Annual useful heat output(kWh)747861204121576523,429747861204121576523,429
1Input power(kWh)3195248715722292946626992019107017727419
Annual COPs2.342.462.622.522.482.773.033.853.253.16
2Input power(kWh)359528341783260910,73731022349127920788661
Annual COPs2.082.162.312.212.182.412.613.222.772.71
3Input power(kWh)434733972081311112,813395630451717271911,280
Annual COPs1.721.801.981.851.831.892.012.402.122.08
Table 10. HP annual performance results in four (4) different climatic conditions.
Control Mode (−)FSMVSM
Case
No. (−)
LocationValentiaDublinBelfastAviemoreValentiaDublinBelfastAviemore
Twma10.659.488.826.7910.659.488.826.79
Heat output(kWh)22,33523,02523,42924,63622,33523,02523,42924,636
1Input power(kWh)87699209946610,3386576713674198263
Mean Annual COPs2.552.502.482.383.403.233.162.98
2Input power(kWh)998010,46410,73711,5307750835586619558
Mean Annual COPs2.242.202.182.142.882.762.712.58
3Input power(kWh)11,84812,46612,81313,88610,20510,91911,28012,332
Mean Annual COPs1.891.851.831.772.192.112.082.00
Table 11. HP retrofit assessment for the test house instead of other heating technologies.
Developed HPBelfastValentiaDublinAviemore
Case/efficiency No: (−)123123123123
(1) Variable speed mode (VSM)
Annual heat output (KWh)23,42923,42923,42922,335223,3522,33523,02523,02523,02524,636246,3624,636
Annual Input power (KWh)7419866111,2806576775010,2057136835510,9198263955812,332
Annual COP3.162.712.083.402.882.193.232.762.112.982.582.00
Annual running cost (GBP)129815161974115113561786124914621911144616732158
Annual CO2 emissions(kg)215125123271190722482959206924233167239627723576
(2) Fixed speed mode (FSM)
Annual Input power (KWh)946610,73712,8138769998011,848920910,46412,46610,33811,53013,886
Annual COP2.482.181.832.552.241.892.502.201.852.382.141.77
Annual running cost (GBP)165718792242153517472073161218312182180920182430
Annual CO2 emissions(kg)274531143716254328943436267130353615299833444027
(3) Oil boilers
Efficiency (%)90%80%70%90%80%70%90%80%70%90%80%70%
Annual oil used (KWh)26,03329,28733,47024,81627,91831,90725,58328,78132,89327,37330,79535,194
Annual running cost (GBP)177019912276168818982170174019572237186120942393
Annual CO2 emissions(kg)632671178133603067847753621769947993665274838552
(4) Gas boilers
Efficiency (%)90%80%70%90%80%70%90%80%70%90%80%70%
Annual gas used (KWh)26,03329,28733,47024,81627,91831,90725,58328,78132,89327,37330,79535,194
Annual running cost (GBP)122413761573116613121500120213531546128714471654
CO2 emission(kg)528559456794503856676477519358436677555762517144
(5) Electric heater
Efficiency (%)100%95%90%100%95%90%100%95%90%100%95%90%
Annual Input power (KWh)23,42924,66226,03322,33523,51024,81623,02524,23725,58324,63625,93227,373
Annual running cost (GBP)410043164556390941144343402942414477431145384790
Annual CO2 emissions(kg)679471527549647768187197667770297419714475207938
(6) Very high temperature HP
Supply Temperature( °C)55–75607565–75607565–75607565–756075
Annual Input power (KWh)10,09910,89711,0529627103,8810,535992510,70910,861106,1911,45911,621
Annual COP2.322.152.122.322.152.122.322.152.122.322.152.12
Annual running cost (GBP)176719071934168518181844173718741901185820052034
Annual CO2 emissions (kg)292931603205279230133055287831063150307933233370
Table 12. Payback period for control modes (VSM vs. FSM) and (C1 vs.C3).
Control Mode (VSM vs. FSM)/Case Considered (C1 vs. C3)Annual Cost Savings
( G B P )
Payback Period (−)
VSM vs. FSM at 35 °C heat supply temperature (C1)3582.8
VSM vs. FSM at 55 °C heat supply temperature (C3)2683.7
Heating distribution installation cost (C1 vs. C3) in VSM6758.9
Heating distribution installation cost (C1 vs. C3) in FSM58510.2
Installation cost for underfloor heating option = 6000 pounds, additional control devices capital cost is 1000 pounds for VSM in comparison to FSM.
Publisher’s Note: MDPI stays neutral with regard to jurisdictional claims in published maps and institutional affiliations.