
Assessing the Role of Phosphorus as a Macropollutant in Four Typical Mediterranean Basin Soils


Abstract
:1. Introduction
2. Materials and Methods
2.1. Study Area
2.2. Soil Data and Analysis
2.3. Statistical analysis
3. Results
4. Discussion
5. Conclusions
Author Contributions
Funding
Institutional Review Board Statement
Informed Consent Statement
Data Availability Statement
Acknowledgments
Conflicts of Interest
References
- Loures, L.; Gama, J.; Nunes, J.; Lopez-Piñeiro, A. Assessing the Sodium Exchange Capacity in Rainfed and Irrigated Soils in the Mediterranean Basin Using GIS. Sustainability 2017, 9, 405. [Google Scholar] [CrossRef] [Green Version]
- Azimi Sardari, M.R.; Bazrafshan, O.; Panagopoulos, T.; Sardooi, E.R. Modeling the Impact of Climate Change and Land Use Change Scenarios on Soil Erosion at the Minab Dam Watershed. Sustainability 2019, 11, 3353. [Google Scholar] [CrossRef] [Green Version]
- Guiot, J.; Cramer, W. Climate change: The 2015 Paris Agreement thresholds and Mediterranean basin ecosystems. Science 2016, 354, 465–468. [Google Scholar] [CrossRef] [PubMed]
- Vozinaki, A.-E.K.; Tapoglou, E.; Tsanis, I.K. Hydrometeorological impact of climate change in two Mediterranean basins. Int. J. River Basin Manag. 2018, 16, 245–257. [Google Scholar] [CrossRef]
- Stagnari, F.; Maggio, A.; Galieni, A.; Pisante, M. Multiple benefits of legumes for agriculture sustainability: An overview. Chem. Biol. Technol. Agric. 2017, 4, 2. [Google Scholar] [CrossRef] [Green Version]
- Pagnani, G.; Pellegrini, M.; Galieni, A.; D’Egidio, S.; Matteucci, F.; Ricci, A.; Stagnari, F.; Sergi, M.; Sterzo, C.L.; Pisante, M.; et al. Plant growth-promoting rhizobacteria (PGPR) in Cannabis sativa ‘Finola’ cultivation: An alternative fertilization strategy to improve plant growth and quality characteristics. Ind. Crop. Prod. 2018, 123, 75–83. [Google Scholar] [CrossRef]
- Farooq, M.; Rehman, A.; Pisante, M. Sustainable Agriculture and Food Security. In Innovations in Sustainable Agriculture; Farooq, M., Pisante, M., Eds.; Springer: Cham, Switzerland, 2019; pp. 3–24. Available online: http://link.springer.com/10.1007/978-3-030-23169-9_1 (accessed on 5 July 2021).
- Naranjo Gómez, J.M.; Lousada, S.; Garrido Velarde, J.G.; Castanho, R.A.; Loures, L. Land-Use Changes in the Canary Archipelago Using the CORINE Data: A Retrospective Analysis. Land 2020, 17, 232. [Google Scholar] [CrossRef]
- Radermacher, W.; Johansson, A.; Lang, V. Europe in Figures: Eurostat Yearbook 2012; Renouf Publishing Company Limited: Ogdensburg, NY, USA, 2013; Volume 6. [Google Scholar]
- Eurostat—Data Explorer. Available online: https://ec.europa.eu/eurostat/web/main/data/database (accessed on 7 July 2021).
- Butusov, M.M.; Jernelöv, A. Phosphorus: An Element That Could Have Been Called Lucifer; Springer: New York, NY, USA, 2013; p. 106. [Google Scholar]
- Monteiro, M.C.H.; Torent, J. Dinâmica do Fósforo no Solo: Perspectiva Agronómica e Ambiental; IPCB: Castelo Branco, Portugal, 2010; p. 97. ISBN 978-989-8196-10-1. [Google Scholar]
- Yin, Z.; Fan, B.; Roberts, D.P.; Chen, S.; Shi, F.; Buyer, J.S.; Jiang, H. Enhancement of maize growth and alteration of the rhizosphere microbial community by phosphate-solubilizing fungus Aspergillus aculeatus P93. J. Agric. Biotechnol. 2017, 2, 10. [Google Scholar]
- Delgado, A.; Torrent, J. Phosphorus Forms and Desorption Patterns in Heavily Fertilized Calcareous and Limed Acid Soils. Soil Sci. Soc. Am. J. 2000, 64, 2031. [Google Scholar] [CrossRef] [Green Version]
- Saavedra, C.; Delgado, A. Phosphorus Fractions and Release Patterns in Typical Mediterranean Soils. Soil Sci. Soc. Am. J. 2005, 69, 607. [Google Scholar] [CrossRef]
- Devau, N.; Cadre, E.L.; Hinsinger, P.; Jaillard, B.; Gérard, F. Soil pH controls the environmental availability of phosphorus: Experimental and mechanistic modelling approaches. Appl. Geochem. 2009, 24, 2163–2174. [Google Scholar] [CrossRef]
- Carreira, J.; Lajtha, K.; Niell, X. Phosphorus transformations along a soil/vegetation series of fire-prone, dolomitic, semi-arid shrublands of southern Spain Soil P and Mediterranean shrubland dynamic. Biogeochemistry 1997, 39, 87–120. [Google Scholar] [CrossRef]
- De la Peña-Lastra, S.; Affre, L.; Otero, X.L. Soil nutrient dynamics in colonies of the yellow-legged seagull (Larus michahellis) in different biogeographical zones. Geoderma 2020, 361, 114109. [Google Scholar] [CrossRef]
- Makttoof, E.A.; Kassim, J.K.; Khuzale, K.H. Distribution of different forms of phosphorus in calcareous soils from middle and south of Iraq. Al-Qadisiyah J. Agric. Sci. 2020, 10, 293–303. [Google Scholar]
- Borrero, C.; Peña, F.; Torrent, J. Phosphate sorption by calcium carbonate in some soils of the Mediterranean part of Spain. Geoderma 1988, 42, 261–269. [Google Scholar] [CrossRef]
- Telo da Gama, J.; Rato Nunes, J.; Loures, L.; Lopez Piñeiro, A.; Vivas, P. Assessing Spatial and Temporal Variability for Some Edaphic Characteristics of Mediterranean Rainfed and Irrigated Soils. Agronomy 2019, 9, 132. [Google Scholar] [CrossRef] [Green Version]
- Telo da Gama, J.; Loures, L.; Lopez-Piñeiro, A.; Quintino, D.; Ferreira, P.; Nunes, J.R. Assessing the Long-Term Impact of Traditional Agriculture and the Mid-Term Impact of Intensification in Face of Local Climatic Changes. Agriculture 2021, 11, 814. [Google Scholar] [CrossRef]
- Kaletová, T.; Loures, L.; Castanho, R.A.; Aydin, E.; da Gama, J.T.; Loures, A.; Truchy, A. Relevance of Intermittent Rivers and Streams in Agricultural Landscape and Their Impact on Provided Ecosystem Services—A Mediterranean Case Study. IJERPH 2019, 16, 2693. [Google Scholar] [CrossRef] [Green Version]
- Nunes, J. Los suelos del perimetro regable del Caia (Portugal): Tipos, fertilidad e impacto del riego en sus propriedades químicas. Ph.D Thesis, Universidad de Extremadura, Badajoz, Spain, 2003. [Google Scholar]
- FAO. World Reference Base for Soil Resources 2014: International Soil Classification System for Naming Soils and Creating Legends for Soil Maps; FAO: Rome, Italy, 2014. [Google Scholar]
- Egnér, H.; Riehm, H.; Domingo, W.R. Investigations on chemical soil analysis as the basis for estimating soil fertility. II. Chem. Extr. Methods Phosphorus Potassium Determ. K. Lantbr. Ann. 1960, 26, 199–215. [Google Scholar]
- Shapiro, S.S.; Wilk, M.B. An Analysis of Variance Test for Normality (Complete Samples). Biometrika 1965, 52, 591. [Google Scholar] [CrossRef]
- Razali, N.M.; Wah, Y.B. Power comparisons of shapiro-wilk, kolmogorov-smirnov, lilliefors and anderson-darling tests. J. Stat. Modeling Anal. 2011, 2, 21–33. [Google Scholar]
- Cramer, D. Fundamental Statistics for Social Research: Step-by-step Calculations and Computer Techniques Using SPSS for Windows; Routledge: London, UK, 2003. [Google Scholar]
- Cramer, D.; Howitt, D.L. The Sage Dictionary of Statistics: A Practical Resource for Students in the Social Sciences; Sage: Thousand Oaks, CA, USA, 2004. [Google Scholar]
- Doane, D.P.; Seward, L.E. Measuring skewness: A forgotten statistic? J. Stat. Educ. 2011, 19, 6. [Google Scholar] [CrossRef]
- Nordstokke, D.W.; Zumbo, B.D. A new nonparametric Levene test for equal variances. Psicol. Int. J. Methodol. Exp. Psychol. 2010, 31, 401–430. [Google Scholar]
- Nordstokke, D.W.; Zumbo, B.D.; Cairns, S.L.; Saklofske, D.H. The operating characteristics of the nonparametric Levene test for equal variances with assessment and evaluation data. Pract. Assess. Res. Evaluation 2011, 16, 5. [Google Scholar]
- Fischer, H. A History of the Central Limit Theorem: From Classical to Modern Probability Theory; Springer: New York, NY, USA; London, UK, 2011; p. 402. [Google Scholar]
- Hengl, T.; Heuvelink, G.B.M.; Stein, A. A generic framework for spatial prediction of soil variables based on regression-kriging. Geoderma 2004, 120, 75–93. [Google Scholar] [CrossRef] [Green Version]
- Baxter, S.J.; Oliver, M.A. The spatial prediction of soil mineral N and potentially available N using elevation. Geoderma 2005, 128, 325–339. [Google Scholar] [CrossRef]
- Inácio, M.; Pereira, V.; Pinto, M. The Soil Geochemical Atlas of Portugal: Overview and applications. J. Geochem. Explor. 2008, 98, 22–33. [Google Scholar] [CrossRef]
- Li, Y. Can the spatial prediction of soil organic matter contents at various sampling scales be improved by using regression kriging with auxiliary information? Geoderma 2010, 159, 63–75. [Google Scholar] [CrossRef]
- Sun, W.; Minasny, B.; McBratney, A. Analysis and prediction of soil properties using local regression-kriging. Geoderma 2012, 171, 16–23. [Google Scholar] [CrossRef]
- Behera, S.K.; Shukla, A.K. Spatial Distribution of Surface Soil Acidity, Electrical Conductivity, Soil Organic Carbon Content and Exchangeable Potassium, Calcium and Magnesium in Some Cropped Acid Soils of India. Land Degrad. Dev. 2015, 26, 71–79. [Google Scholar] [CrossRef]
- Chen, T.; Chang, Q.; Liu, J.; Clevers, J.G.P.W.; Kooistra, L. Identification of soil heavy metal sources and improvement in spatial mapping based on soil spectral information: A case study in northwest China. Sci. Total. Environ. 2016, 565, 155–164. [Google Scholar] [CrossRef]
- Hou, D.; O’Connor, D.; Nathanail, P.; Tian, L.; Ma, Y. Integrated GIS and multivariate statistical analysis for regional scale assessment of heavy metal soil contamination: A critical review. Environ. Pollut. 2017, 231, 1188–1200. [Google Scholar] [CrossRef]
- Tziachris, P.; Metaxa, E.; Papadopoulos, F.; Papadopoulou, M. Spatial Modelling and Prediction Assessment of Soil Iron Using Kriging Interpolation with pH as Auxiliary Information. Isprs Int. J. Geo-Inf. 2017, 6, 283. [Google Scholar] [CrossRef] [Green Version]
- Team, Q.D. QGIS geographic information system. Open Source Geospat. Found. Proj 2015. [Google Scholar]
- INIAP. Manual de Fertilização das Culturas; Laboratório Químico Agrícola Rebelo da Silva: Lisboa, Portugal, 2006. [Google Scholar]


| pH | SOM | EC | Sand | Silt | Clay | Ca | Mg | K | Na | CEC | BSP | ||
|---|---|---|---|---|---|---|---|---|---|---|---|---|---|
| Depth (cm) | (Water) | (%) | (dS m−1) | (%) | (cmol(+) kg−1) | ||||||||
| Fluvisols | 0–20 | 6.59 | 1.22 | 157.1 | 72 | 13 | 15 | 8.26 | 2.13 | 0.40 | 0.17 | 21.6 | 49.3 |
| Luvisols | 7.21 | 1.31 | 158.9 | 70 | 12 | 18 | 17.8 | 3.28 | 0.45 | 0.19 | 29.1 | 71.8 | |
| Calcisols | 8.04 | 1.53 | 148.8 | 50 | 21 | 29 | 11.68 | 2.42 | 0.50 | 0.15 | 37.4 | 86.2 | |
| Cambisols | 6.33 | 1.34 | 135.1 | 71 | 13 | 16 | 7.12 | 3.04 | 0.40 | 0.17 | 21.9 | 48.1 | |
| Parameter | Year | Mean | N | Test | p |
|---|---|---|---|---|---|
| P (mg kg−1) | 2002 | 140 | 1308 | T(2616): −4.056 | 0.242 |
| 2012 | 161 | 1310 |
| Parameter | Year | AS | Mean | N | Test | p |
|---|---|---|---|---|---|---|
| P (mg kg−1) | 2002 | Rain-fed | 143 | 631 | U: 216,360.500 | 0.685 |
| Irrigation | 139 | 677 | ||||
| 2012 | Rain-fed | 141 | 526 | U: 162,324.500 | 0.000 | |
| Irrigation | 174 | 784 |
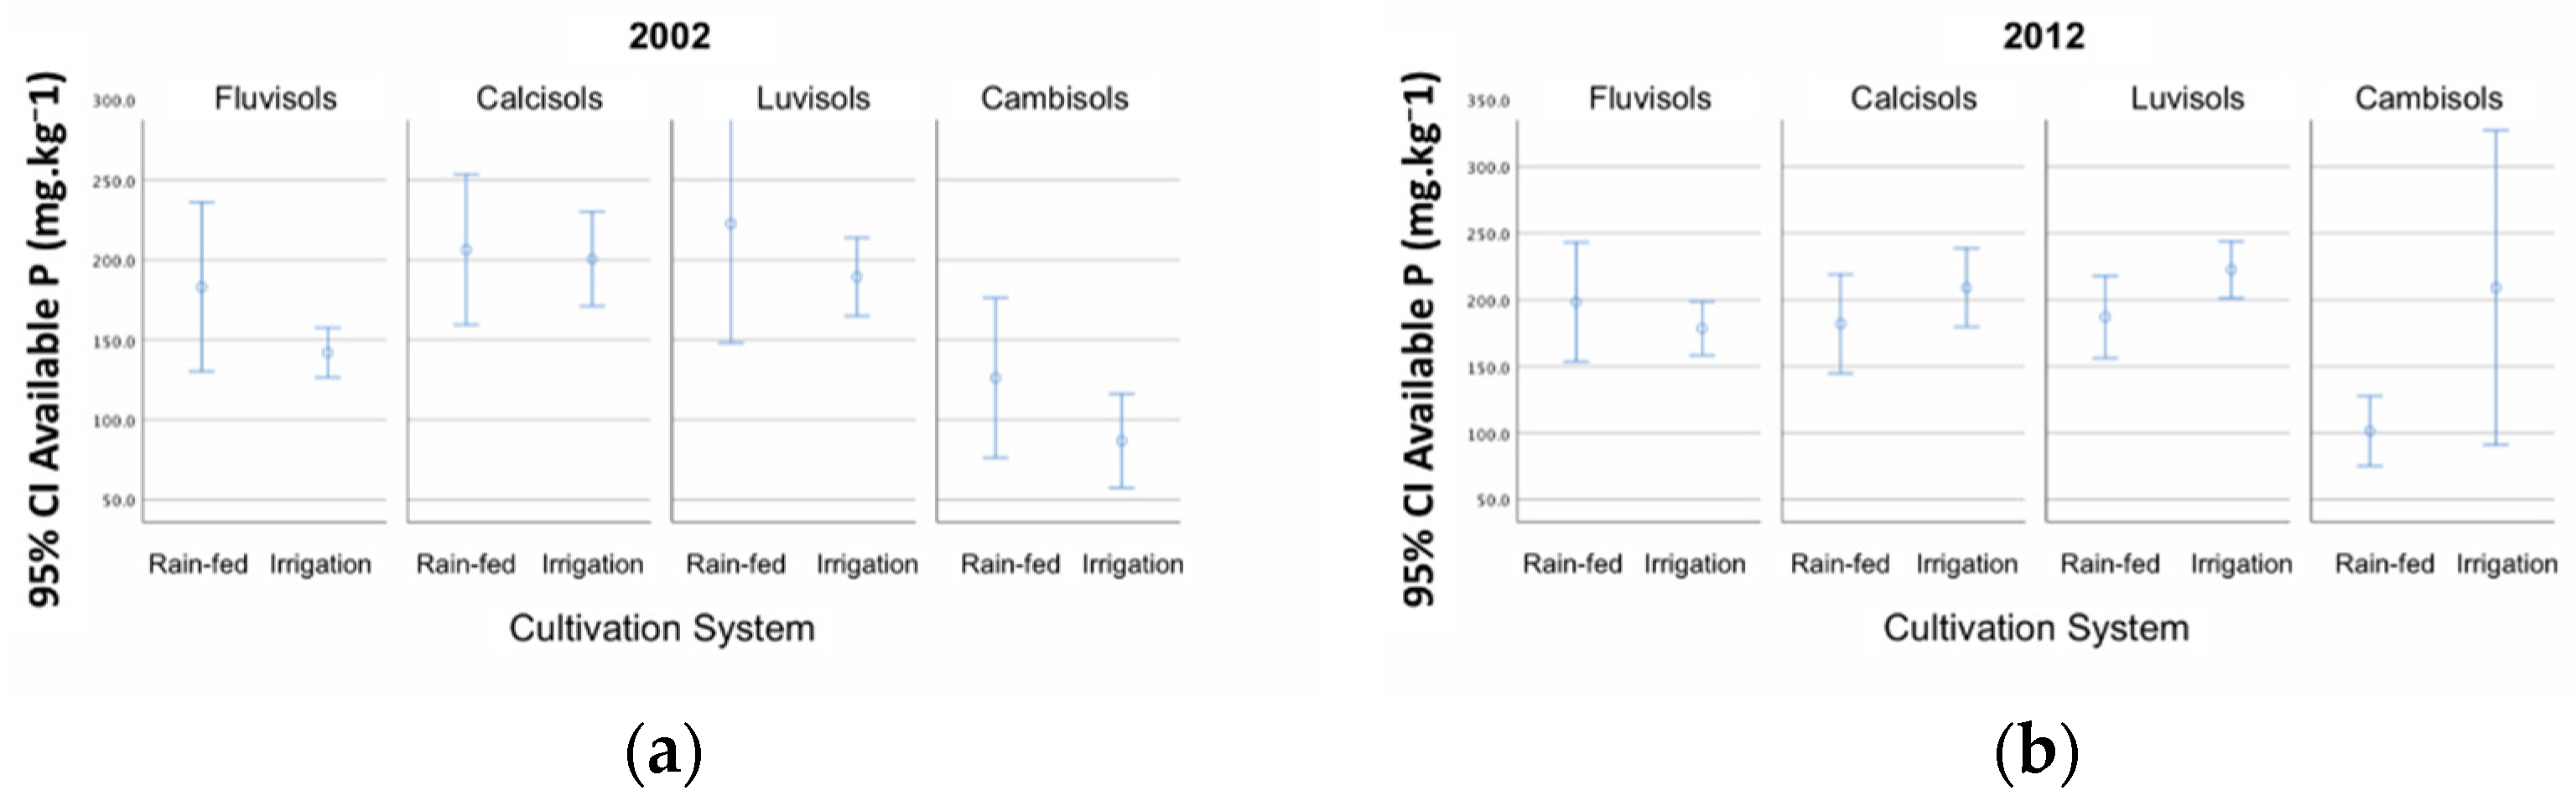
| Parameter | Year | RSG | AS | Mean | N | Test | p |
|---|---|---|---|---|---|---|---|
| P (mg kg−1) | 2002 | Fluvisols | Rain-fed | 136 | 222 | U: 44,455.500 | 0.734 |
| Irrigation | 123 | 394 | |||||
| Luvisols | Rain-fed | 144 | 194 | T (352): −0.770 | 0.442 | ||
| Irrigation | 173 | 160 | |||||
| Calcisols | Rain-fed | 171 | 143 | T (226): −0.177 | 0.860 | ||
| Irrigation | 187 | 85 | |||||
| Cambisols | Rain-fed | 100 | 61 | T (95): −1.144 | 0.255 | ||
| Irrigation | 77 | 36 | |||||
| 2012 | Fluvisols | Rain-fed | 144 | 198 | U: 33,343.000 | 0.000 | |
| Irrigation | 157 | 430 | |||||
| Luvisols | Rain-fed | 160 | 152 | T (338): 1.928 | 0.055 | ||
| Irrigation | 208 | 188 | |||||
| Calcisols | Rain-fed | 156 | 99 | T (227): 1.148 | 0.252 | ||
| Irrigation | 189 | 130 | |||||
| Cambisols | Rain-fed | 87.6 | 64 | U: 692.000 | 0.001 | ||
| Irrigation | 147 | 36 |
| Parameter | Year | RSG | Rain-Fed | Irrigation | |||||||
|---|---|---|---|---|---|---|---|---|---|---|---|
| Mean | N | Test | p | Mean | N | Test | p | ||||
| (a) | P (mg kg−1) | 2002 | Overall | 143 | 631 | T (1.155): 0.903 | 0.367 | 139 | 677 | T (1.459): −4.027 | 0.000 |
| 2012 | 141 | 526 | 174 | 784 | |||||||
| (b) | P (mg kg−1) | 2002 | Fluvisols | 136 | 222 | T (418): −0.427 | 0.670 | 123 | 394 | T (418): −0.427 | 0.005 |
| 2012 | 144 | 198 | 157 | 430 | |||||||
| 2002 | Luvisols | 144 | 194 | T (344): 0.793 | 0.428 | 173 | 160 | T (346): −2.032 | 0.043 | ||
| 2012 | 160 | 152 | 208 | 188 | |||||||
| 2002 | Calcisols | 171 | 143 | T (240): 0.751 | 0.454 | 187 | 85 | T (213): −0.388 | 0.698 | ||
| 2012 | 156 | 99 | 189 | 130 | |||||||
| 2002 | Cambisols | 100 | 61 | T (123): 0.893 | 0.374 | 76.9 | 36 | T (70): −2.042 | 0.045 | ||
| 2012 | 87.6 | 64 | 147 | 36 | |||||||
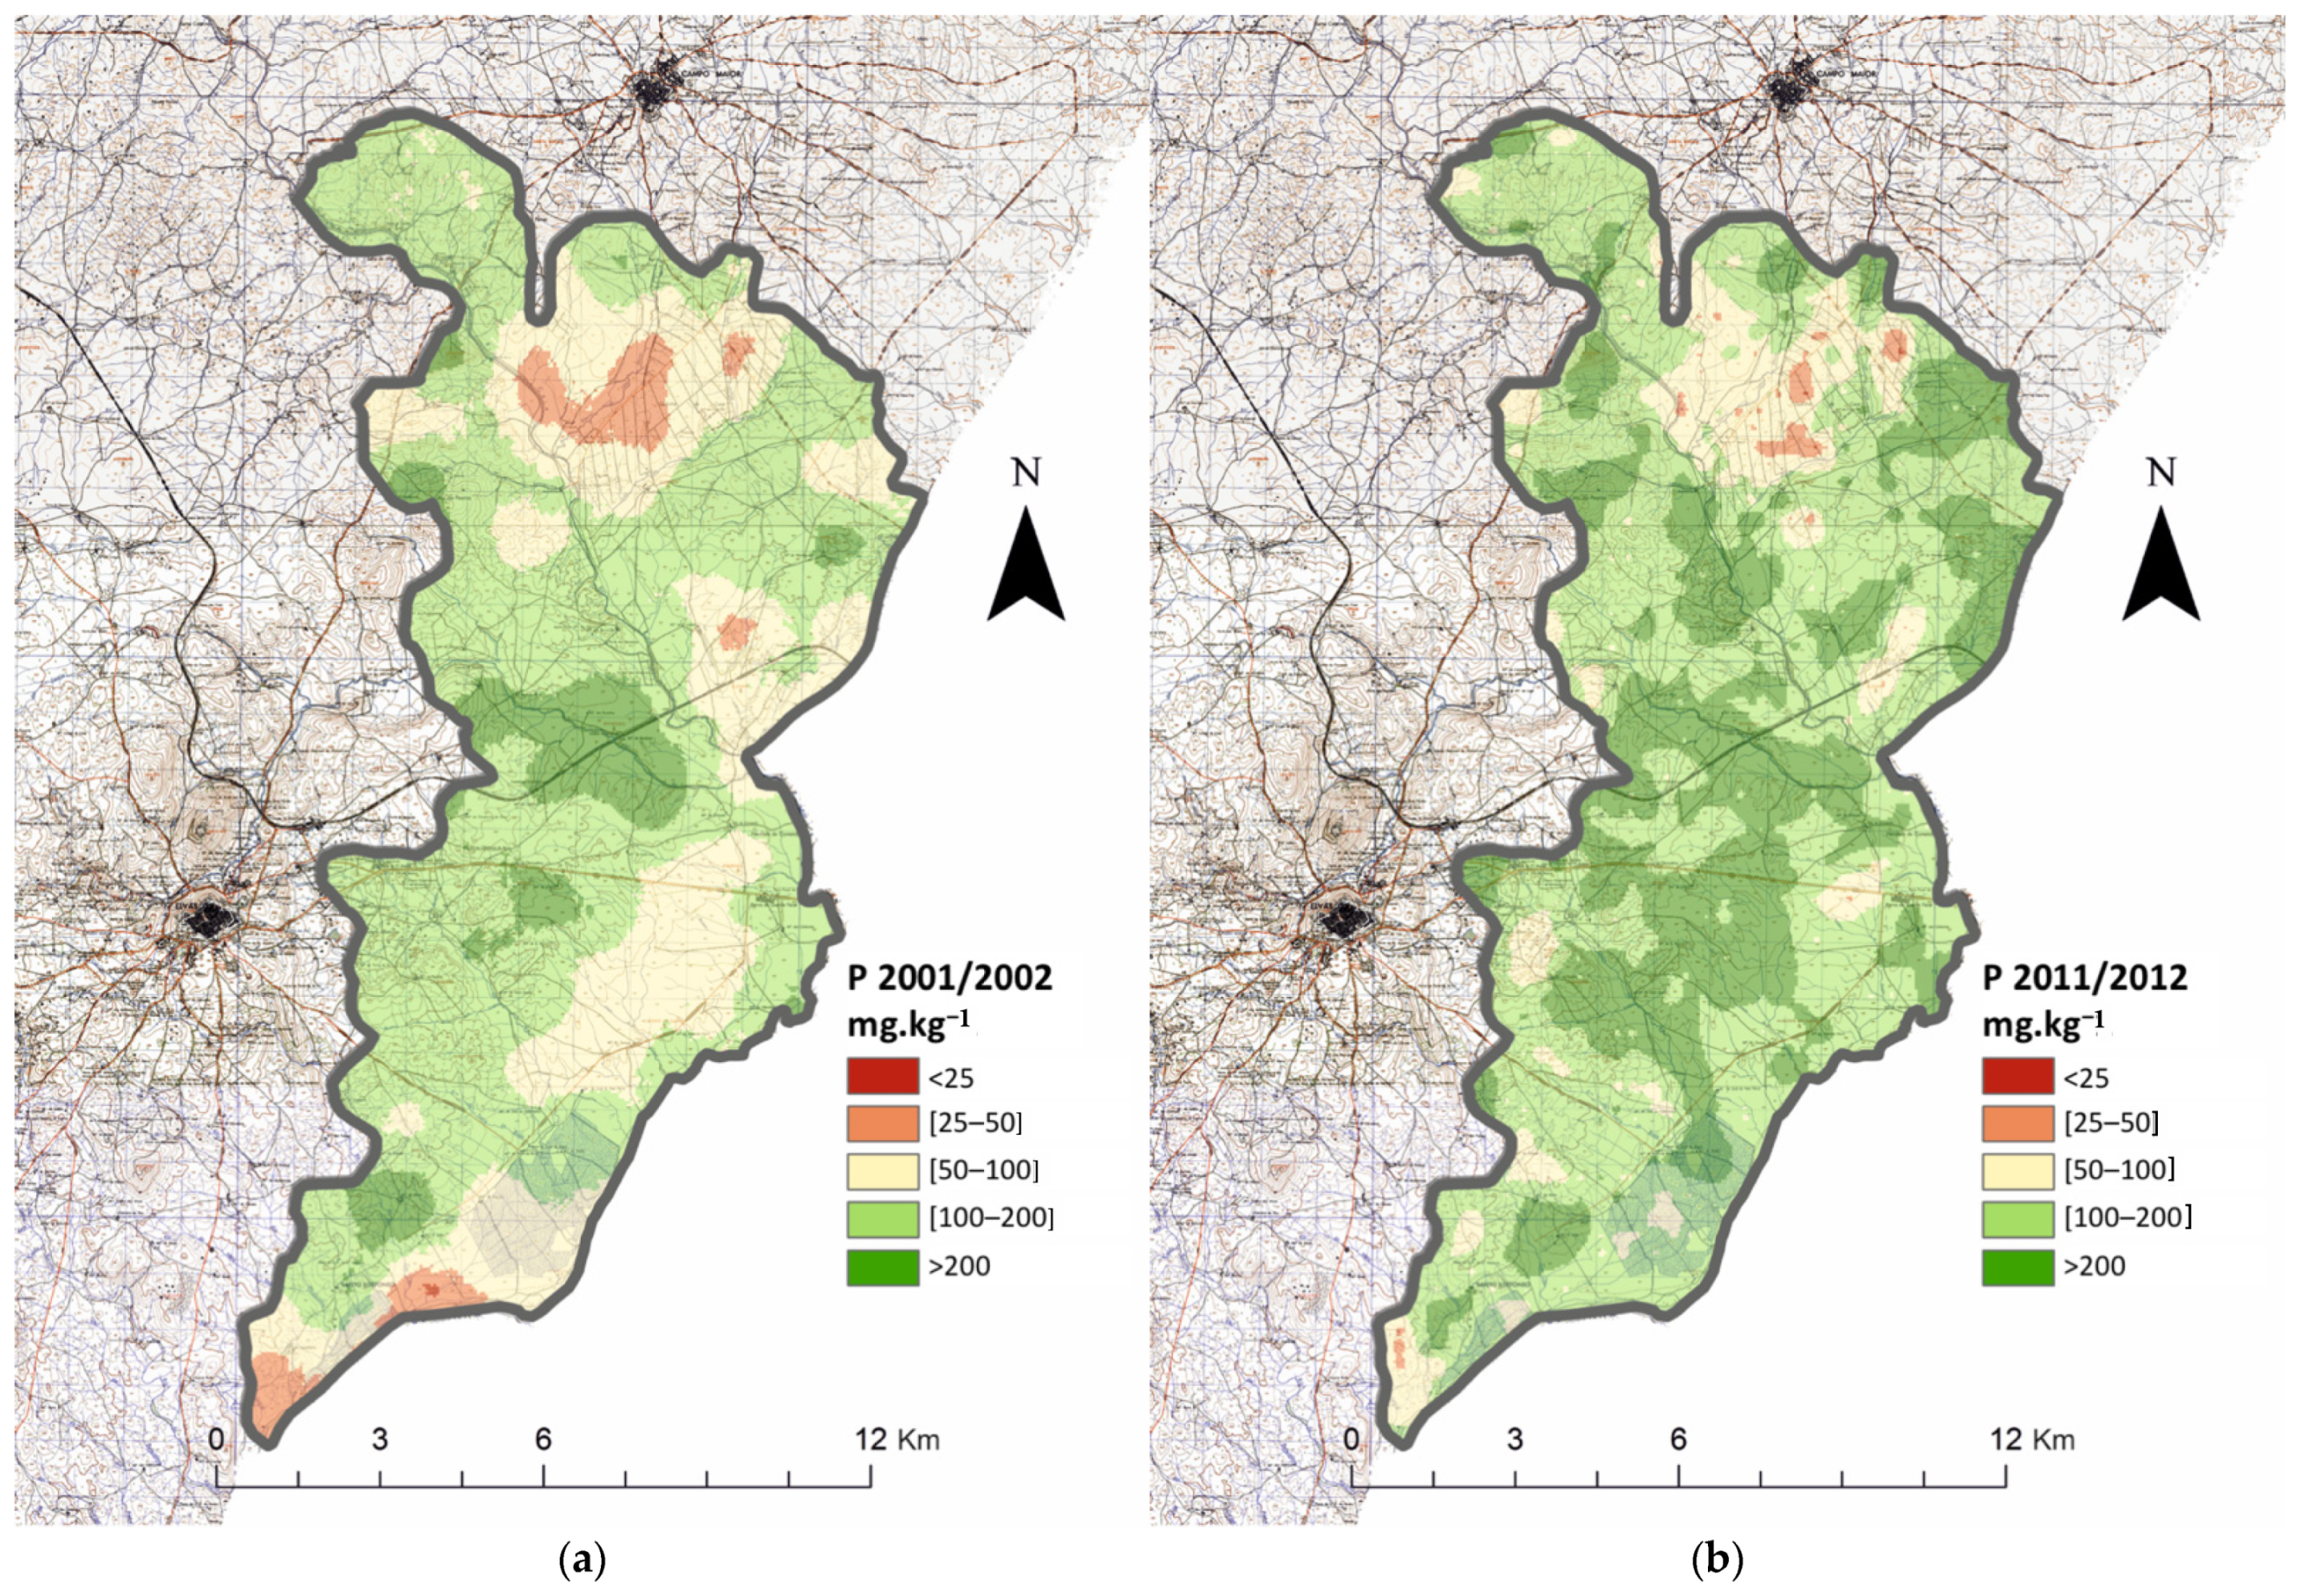
| P(mg kg−1) | Fertility Class | Crop Response | 2002 | 2012 | ||
|---|---|---|---|---|---|---|
| Area (ha) | % | Area (ha) | % | |||
| <25 | Very low | <50% | 4.70 | 0.000 | 1.50 | 0.000 |
| 25–50 | Low | [50–75%] | 672 | 4.40 | 131 | 0.900 |
| 50–100 | Medium | [75–95%] | 4337 | 28.6 | 1860 | 12.3 |
| 100–200 | High | [95–99] | 8825 | 58.2 | 8396 | 55.4 |
| >200 | Very high | >99% | 1319 | 8.70 | 4770 | 31.5 |
Publisher’s Note: MDPI stays neutral with regard to jurisdictional claims in published maps and institutional affiliations. |
© 2021 by the authors. Licensee MDPI, Basel, Switzerland. This article is an open access article distributed under the terms and conditions of the Creative Commons Attribution (CC BY) license (https://creativecommons.org/licenses/by/4.0/).
Share and Cite
Telo da Gama, J.; Loures, L.; López-Piñeiro, A.; Nunes, J.R. Assessing the Role of Phosphorus as a Macropollutant in Four Typical Mediterranean Basin Soils. Sustainability 2021, 13, 10973. https://doi.org/10.3390/su131910973
Telo da Gama J, Loures L, López-Piñeiro A, Nunes JR. Assessing the Role of Phosphorus as a Macropollutant in Four Typical Mediterranean Basin Soils. Sustainability. 2021; 13(19):10973. https://doi.org/10.3390/su131910973
Chicago/Turabian StyleTelo da Gama, José, Luis Loures, António López-Piñeiro, and José Rato Nunes. 2021. "Assessing the Role of Phosphorus as a Macropollutant in Four Typical Mediterranean Basin Soils" Sustainability 13, no. 19: 10973. https://doi.org/10.3390/su131910973
APA StyleTelo da Gama, J., Loures, L., López-Piñeiro, A., & Nunes, J. R. (2021). Assessing the Role of Phosphorus as a Macropollutant in Four Typical Mediterranean Basin Soils. Sustainability, 13(19), 10973. https://doi.org/10.3390/su131910973