Article

Factors Affecting Carbonation Depth in Foamed Concrete Bricks for Accelerate CO2 Sequestration

by
Abdullah Faisal Alshalif
1,*,
J. M. Irwan
1,*,
Husnul Azan Tajarudin
2,*,
N. Othman
3,
A. A. Al-Gheethi
3,
S. Shamsudin
4,
Wahid Ali Hamood Altowayti
3 and
Saddam Abo Sabah
1
1
Jamilus Research Centre for Sustainable Construction (JRC-SC), Faculty of Civil Engineering and Built Environment, Universiti Tun Hussein Onn Malaysia, Parit Raja 86400, Johor, Malaysia
2
Division of Bioprocess, School of Industrial Technology, Universiti Sains Malaysia, Gelugor 11800, Pulau Pinang, Malaysia
3
Micro-Pollutant Research Centre (MPRC), Faculty of Civil Engineering and Built Environment, Universiti Tun Hussein Onn Malaysia, Parit Raja 86400, Johor, Malaysia
4
Sustainable Manufacturing and Recycling Technology, Advanced Manufacturing and Materials Center (SMART-AMMC), Universiti Tun Hussein Onn Malaysia, Parit Raja 86400, Johor, Malaysia
*
Authors to whom correspondence should be addressed.
Sustainability 2021, 13(19), 10999; https://doi.org/10.3390/su131910999
Submission received: 26 July 2021 / Revised: 24 August 2021 / Accepted: 26 August 2021 / Published: 4 October 2021

Abstract

:
Foamed concrete bricks (FCB) have high levels of porosity to sequestrate atmospheric CO2 in the form of calcium carbonate CaCO3 via acceleration of carbonation depth. The effect of density and curing conditions on CO2 sequestration in FCB was investigated in this research to optimize carbonation depth. Statistical analysis using 2k factorial and response surface methodology (RSM) comprising 11 runs and eight additional runs was used to optimize the carbonation depth of FCB for 28 days (d). The main factors selected for the carbonation studies include density, temperature and CO2 concentration. The curing of the FCB was performed in the chamber. The results indicated that all factors significantly affected the carbonation depth of FCB. The optimum carbonation depth was 9.7 mm, which was determined at conditions; 1300 kg/m3, 40 °C, and 20% of CO2 concentration after 28 d. Analysis of variance (ANOVA) and residual plots demonstrated the accuracy of the regression equation with a predicted R2 of 89.43%, which confirms the reliability of the predicted model.

1. Introduction

Foamed concrete is lightweight concrete made without coarse aggregate. It can either be cement or lime mortar that generates air voids in the mortar via a suitable aerated agent [1]. Foamed concrete has numerous advantages including low density, which results in a reduction of the load on the structure, especially foundations. It is also environmentally friendly and economical when compared to other types of concrete. It also provides a high degree of thermal insulation and sound-proofing [2,3]. Therefore, the applications of foamed concrete have become more popular worldwide, especially on housing constructions and insulations, road sub-based and other applications such as; old sewers, soil stabilization, trench fills earthquake purpose and storage tanks [1,2,4].
Foamed concrete has a wide range of density starting from 300 kg/m3 to 1800 kg/m3, which depends on the level of porosity (voids) that are introduced by the foaming agent or aluminium powder [1,5]. The reaction is initiated with water when the aluminium powder is added to the mixture. The heat of reaction under alkaline conditions generates hydrogen gas bubbles, which create air voids in the concrete to accelerate carbonation in the foamed concrete [5,6]. Several factors affect carbonation in concrete such as material chemical properties, solid physical characteristics, and curing conditions [7]. However, the concrete density, CO2 concentration, and temperature are considered the most critical factors examined in previous research in the literature [6]. Studying the effect of each factor separately while ignoring the effect of other factors may give defective results, which in turn reduces the sustainability of the concrete. Optimization considers an appropriate solution to accelerate carbonation in foamed concrete bricks (FCB). However, the literature on the main factors affecting carbonation of foamed concrete should be studied carefully before using any optimization methods to identify the range of each factor that may cause enhancement of FCB.
Density can cause drastic changes on foamed concrete properties, particularly strength and penetration such as carbonation depth. According to [1], there is an underlining relationship between carbonation depth and density, since the increase in density increases the carbonation depth. Similarly, Namsone [8] reported that the most critical factor affecting the carbonation of foamed concrete when compared to normal concrete is the density because the change in density resulted in a change in level of porosity. It is possible to produce high pores foamed concrete with density 300 kg/m3, which has the capability to accelerate carbonation; however, the strength of the specimens will be lower than 1 MPa [9]. On the other hand, concrete with density more than 1850 kg/m3 will be out of the range of foamed concrete density 300 kg/m3–1800 kg/m3. Therefore, 1300 kg/m3 and 1800 kg/m3 was selected as low and high levels of densities in this study to produce FCB. Density is not the only factor affecting the carbonation of foamed concrete, particularly the curing conditions such as CO2 concentration, as temperature and humidity also play a vital role too [10,11]. Many researchers have stated that the best range of relative humidity to accelerate carbonation in concrete is 50–70% [12,13]. However, the humidity is influenced by the changes in temperature degree and CO2 concentration [12].
The atmospheric CO2 concentration is the main source of sequestrated CO2 in concrete via the carbonation process. The standard atmospheric concentration of CO2 is between (0.03% and 0.06%), which indicates that carbonation at standard concentration is very slow [14,15]. In this case, a curing long time is required. Therefore, the chamber with different CO2 concentration levels is used to accelerate the carbonation process in concrete [15]. The concentration of CO2 and curing time has a strong relationship, the increase of CO2 concentration and curing time resulted in increment of the carbonation depth and vice versa [13,16]. The researchers prefer to use a high concentration of CO2 to accelerate carbonation in concrete with a short period of curing in the chamber [13]. Additionally, some chambers use a heater to control the temperature during curing. The increase in temperature up to 60 °C promotes the ability of the concrete to absorb CO2 and the formation of calcium carbonate (CaCO3) [17]. In contrast, higher temperatures above 60 °C may decrease the CO2 content since solubility in water decreases at elevated temperatures, which could also decrease the carbonation rate [18]. Therefore, most researchers adopt temperatures below 60 °C to accelerate the process of concrete carbonation [19,20,21].
This research aims to optimize the carbonation depth in foamed concrete bricks. Hence, the effects of density, temperature and CO2 concentration that influence CO2 sequestration in foamed concrete via carbonation process was examined as the main factors.

2. Materials and Methods

2.1. Materials and Mix Proportion

The materials used in this study are cement, sand, water and the foaming agent. Ordinary Portland Cement (OPC) with the specific surface area 2250 cm2/g and chemical composition details are shown in Table 1 [22].
The sand was adapted to pass through a sieve with a size of 1 mm according to BS 882-1992 [20]. According to the British Cement Association-1994, the maximum size of fine aggregate (sand) in foamed concrete is 1.18 mm. Additionally, the percentage of sand passed through 600 microns should be between 60–90% to produce foamed concrete as shown in the particle size distribution of sand in Figure 1 [21,22].
Tap water was used for the foamed concrete mix and diluting the foaming agent. A synthetic type CF 500 foaming agent was mixed with water to produce air bubbles in the foamed concrete mixtures. The ratio of foamed agent to water was 1:20, which aerated to 65 kg/m3 density according to the ASTM C796 Standard for foaming agents used in cellular concrete and preformed foam production [21,23]. The design of foamed concrete depends on the adjusted density. The weight of solid materials (cement/sand) was distributed in the ratio of 1:1.35 according to ACI 523.3R with the trial method of mix design [21].
For this study, 3 factors were used to optimize the carbonation depth, namely; density, temperature and CO2 concentration using the 2k Full Factorial and Response Surface Methodology (RSM) designs that analysed through Minitab 18 software. The software was developed at the Pennsylvania State University, USA.
The first 8 experiments were factorial runs followed by 3 centre runs for curvature analysis. The design was completed by RSM by adding 6 axials runs and 2 more runs at the centre, which resulted in a total of 19 runs. The runs were comprised of 8 factorial runs and 6 axial runs (all without repetition), while 5 runs were located at the centre. Lastly, the density of the foamed concrete was the main factor affecting the mix proportion in this study because the change of density resulted in change on materials used in the mixture proportion as shown in Table 2. Furthermore, the materials used were cement, sand and water mass which subjected to changes from run to run and in line with the changes in density.

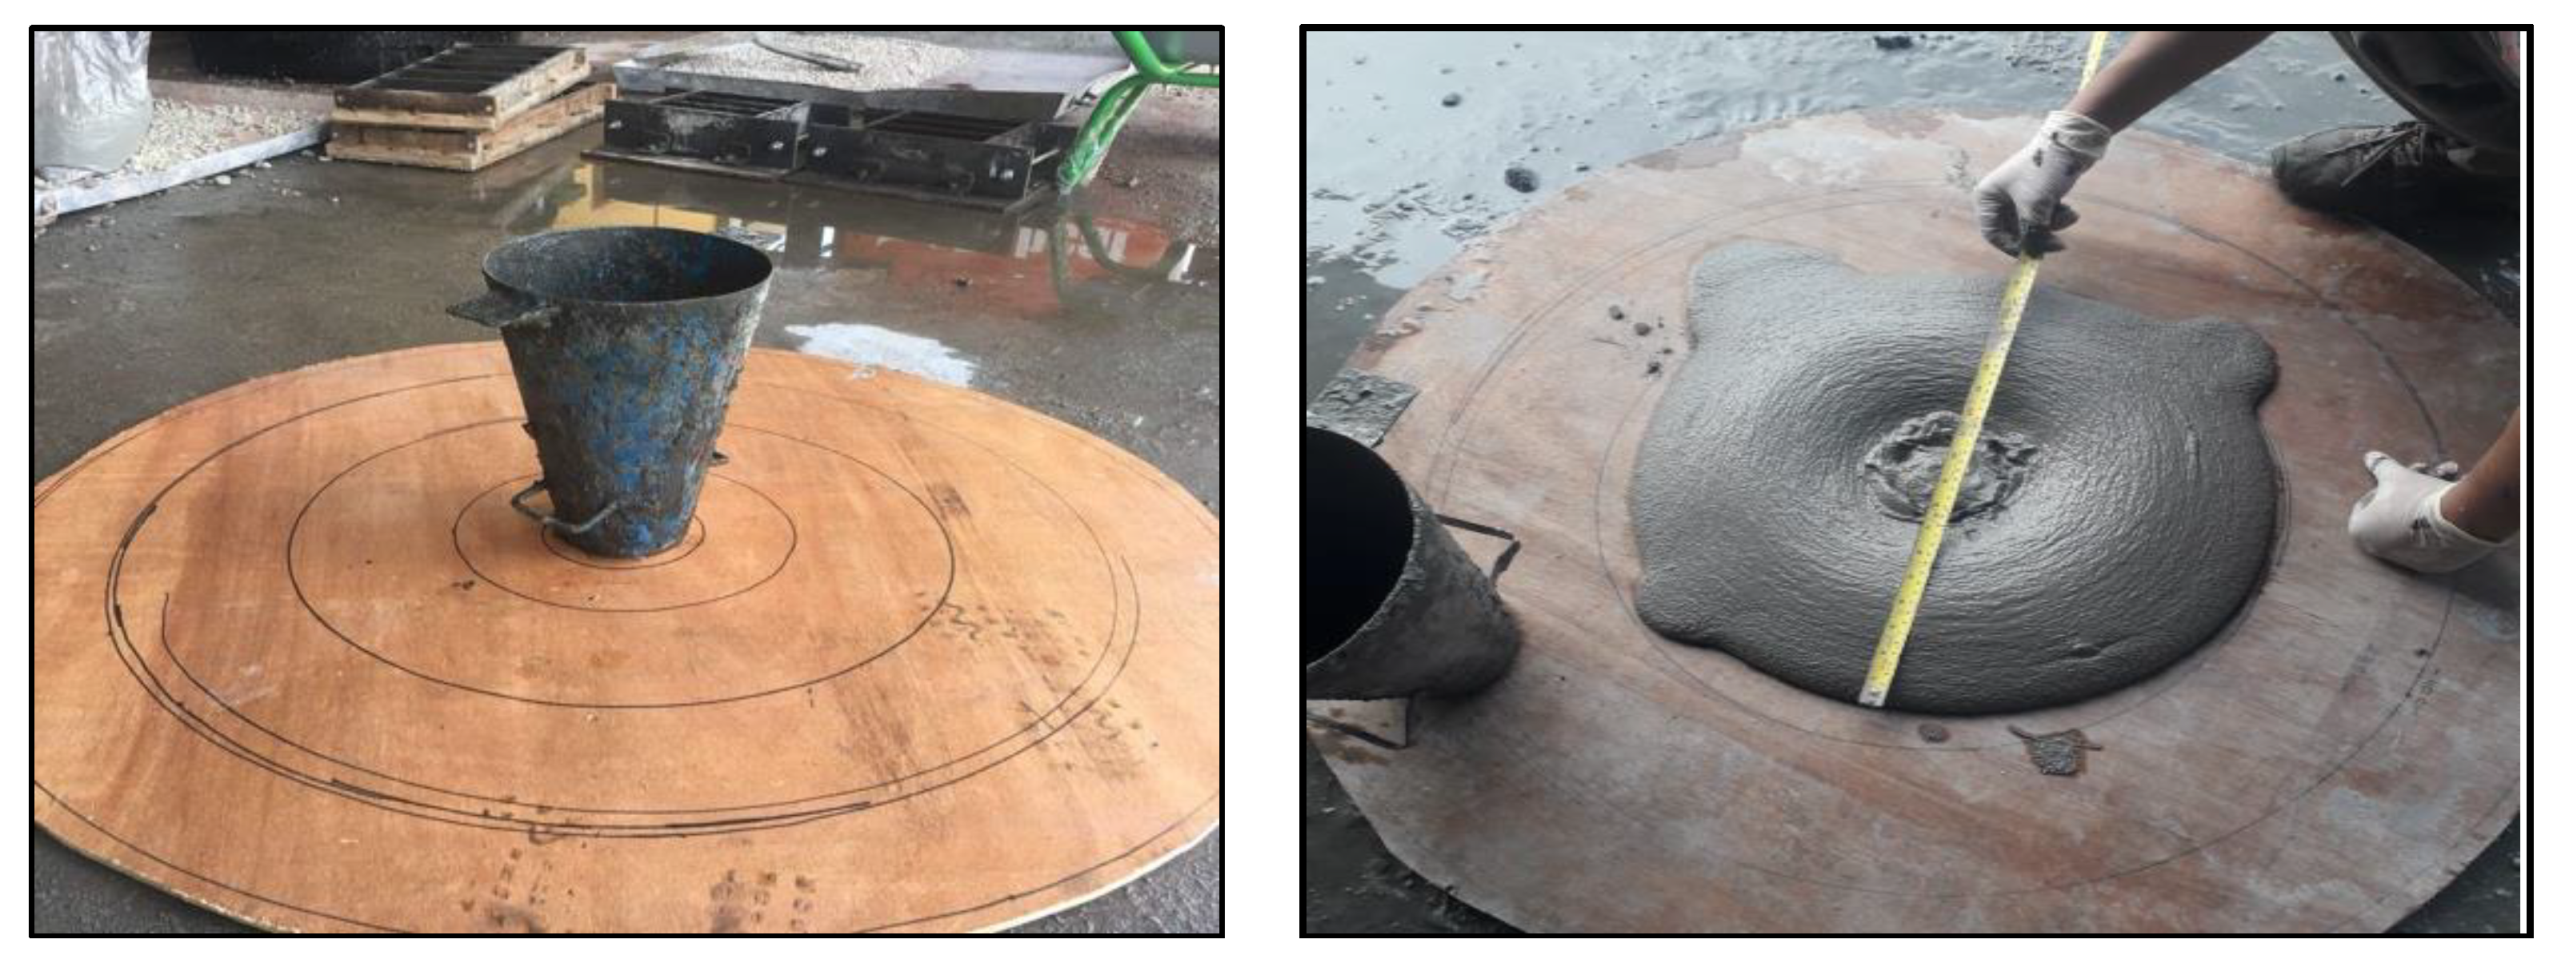
2.2. Fresh Stage Tests (Fresh Density Test/Inverted Slump Test)

The foamed concrete was tested using the fresh density test and slump test methods. A container with 1-L capacity was used to perform the fresh density test, which was tared to zero at the balance machine before being overfilled with fresh foamed concrete. The compaction of the foamed concrete was performed by lightly tapping the sides of the container to allow consolidation of the fresh foamed concrete. The 1 litter container was weighed to obtain the fresh density of foamed concrete [24]. The inverted slump test was conducted according to the ASTM C995 (2001) standard using a slump cone and flat base plate. The slump cone was inverted and placed at the centre of the base plate and filled with fresh foamed concrete until it was filled. The inverted slump cone was lifted to 1 ft height within 3–5 s (s). The dimension of the spread was measured from four angles and recorded as shown in Figure 2 [24]. The slump flow was calculated using Equation (1).
Slump   flow = d 1 + d 2 2
where;
  • d1 = Maximum diameter of slump flow;
  • d2 = Perpendicular diameter of d1.

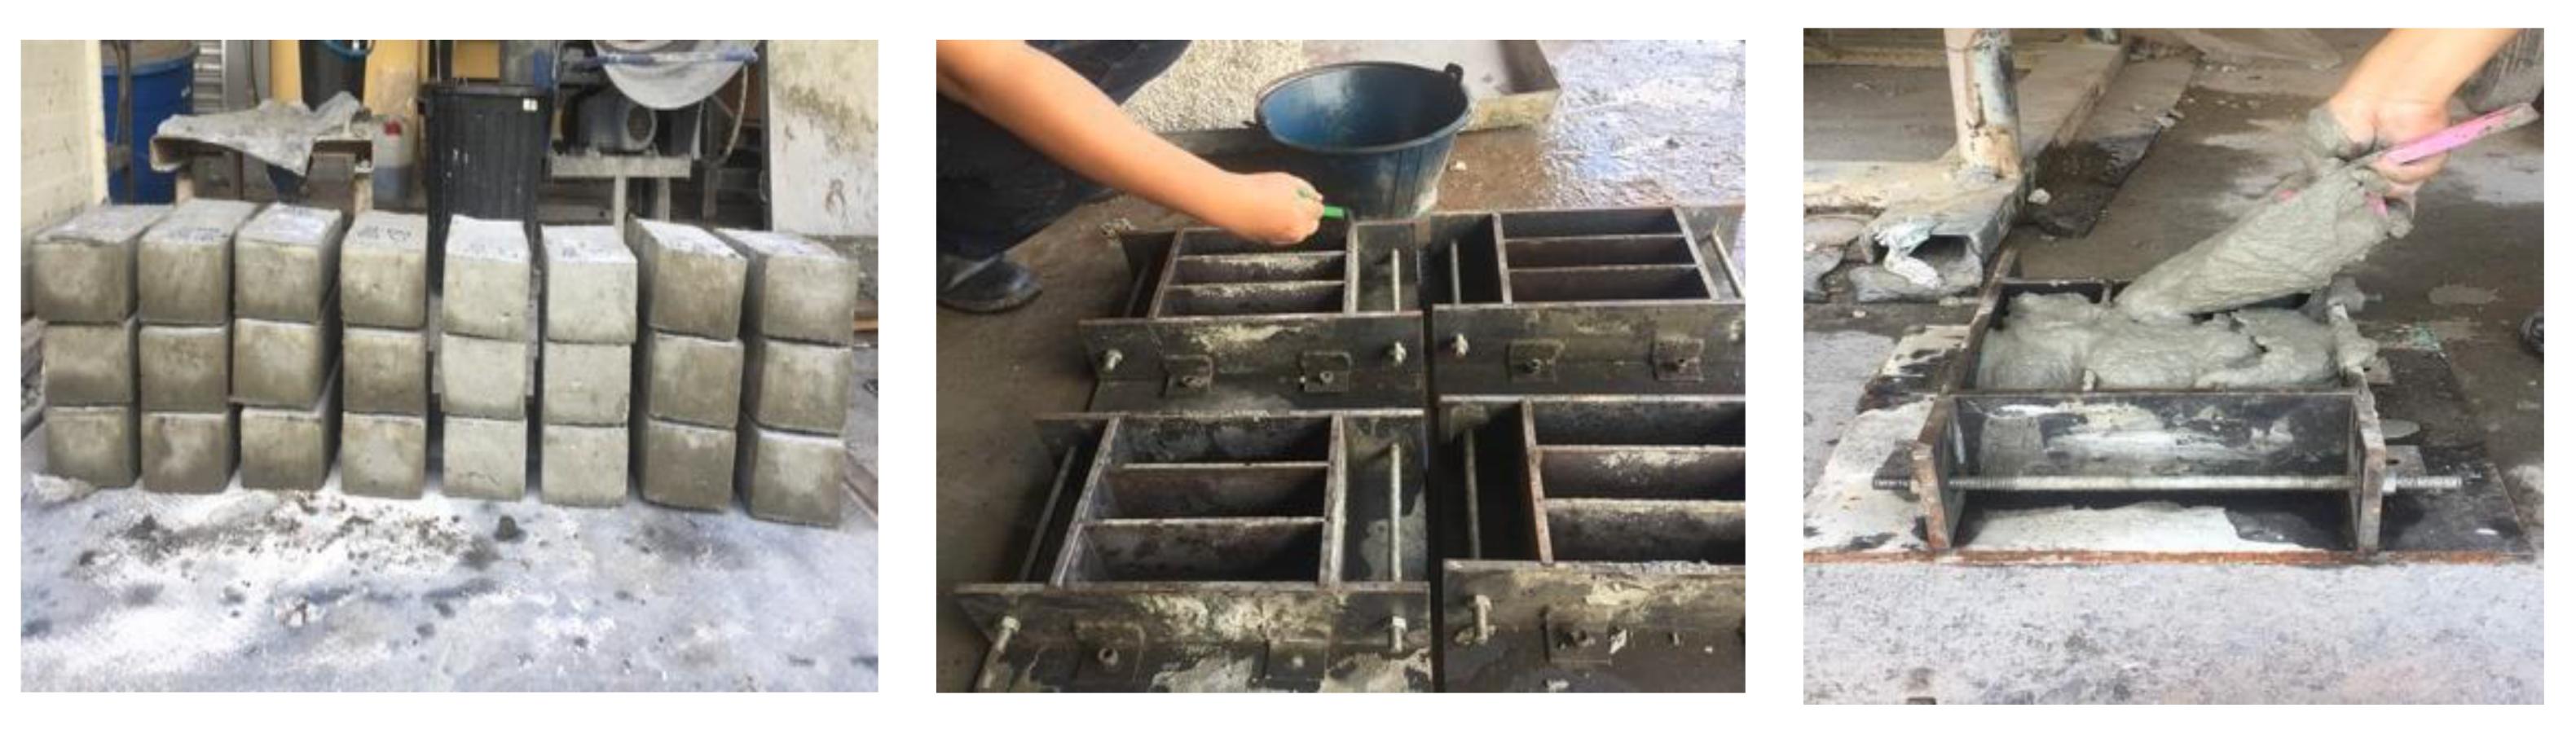
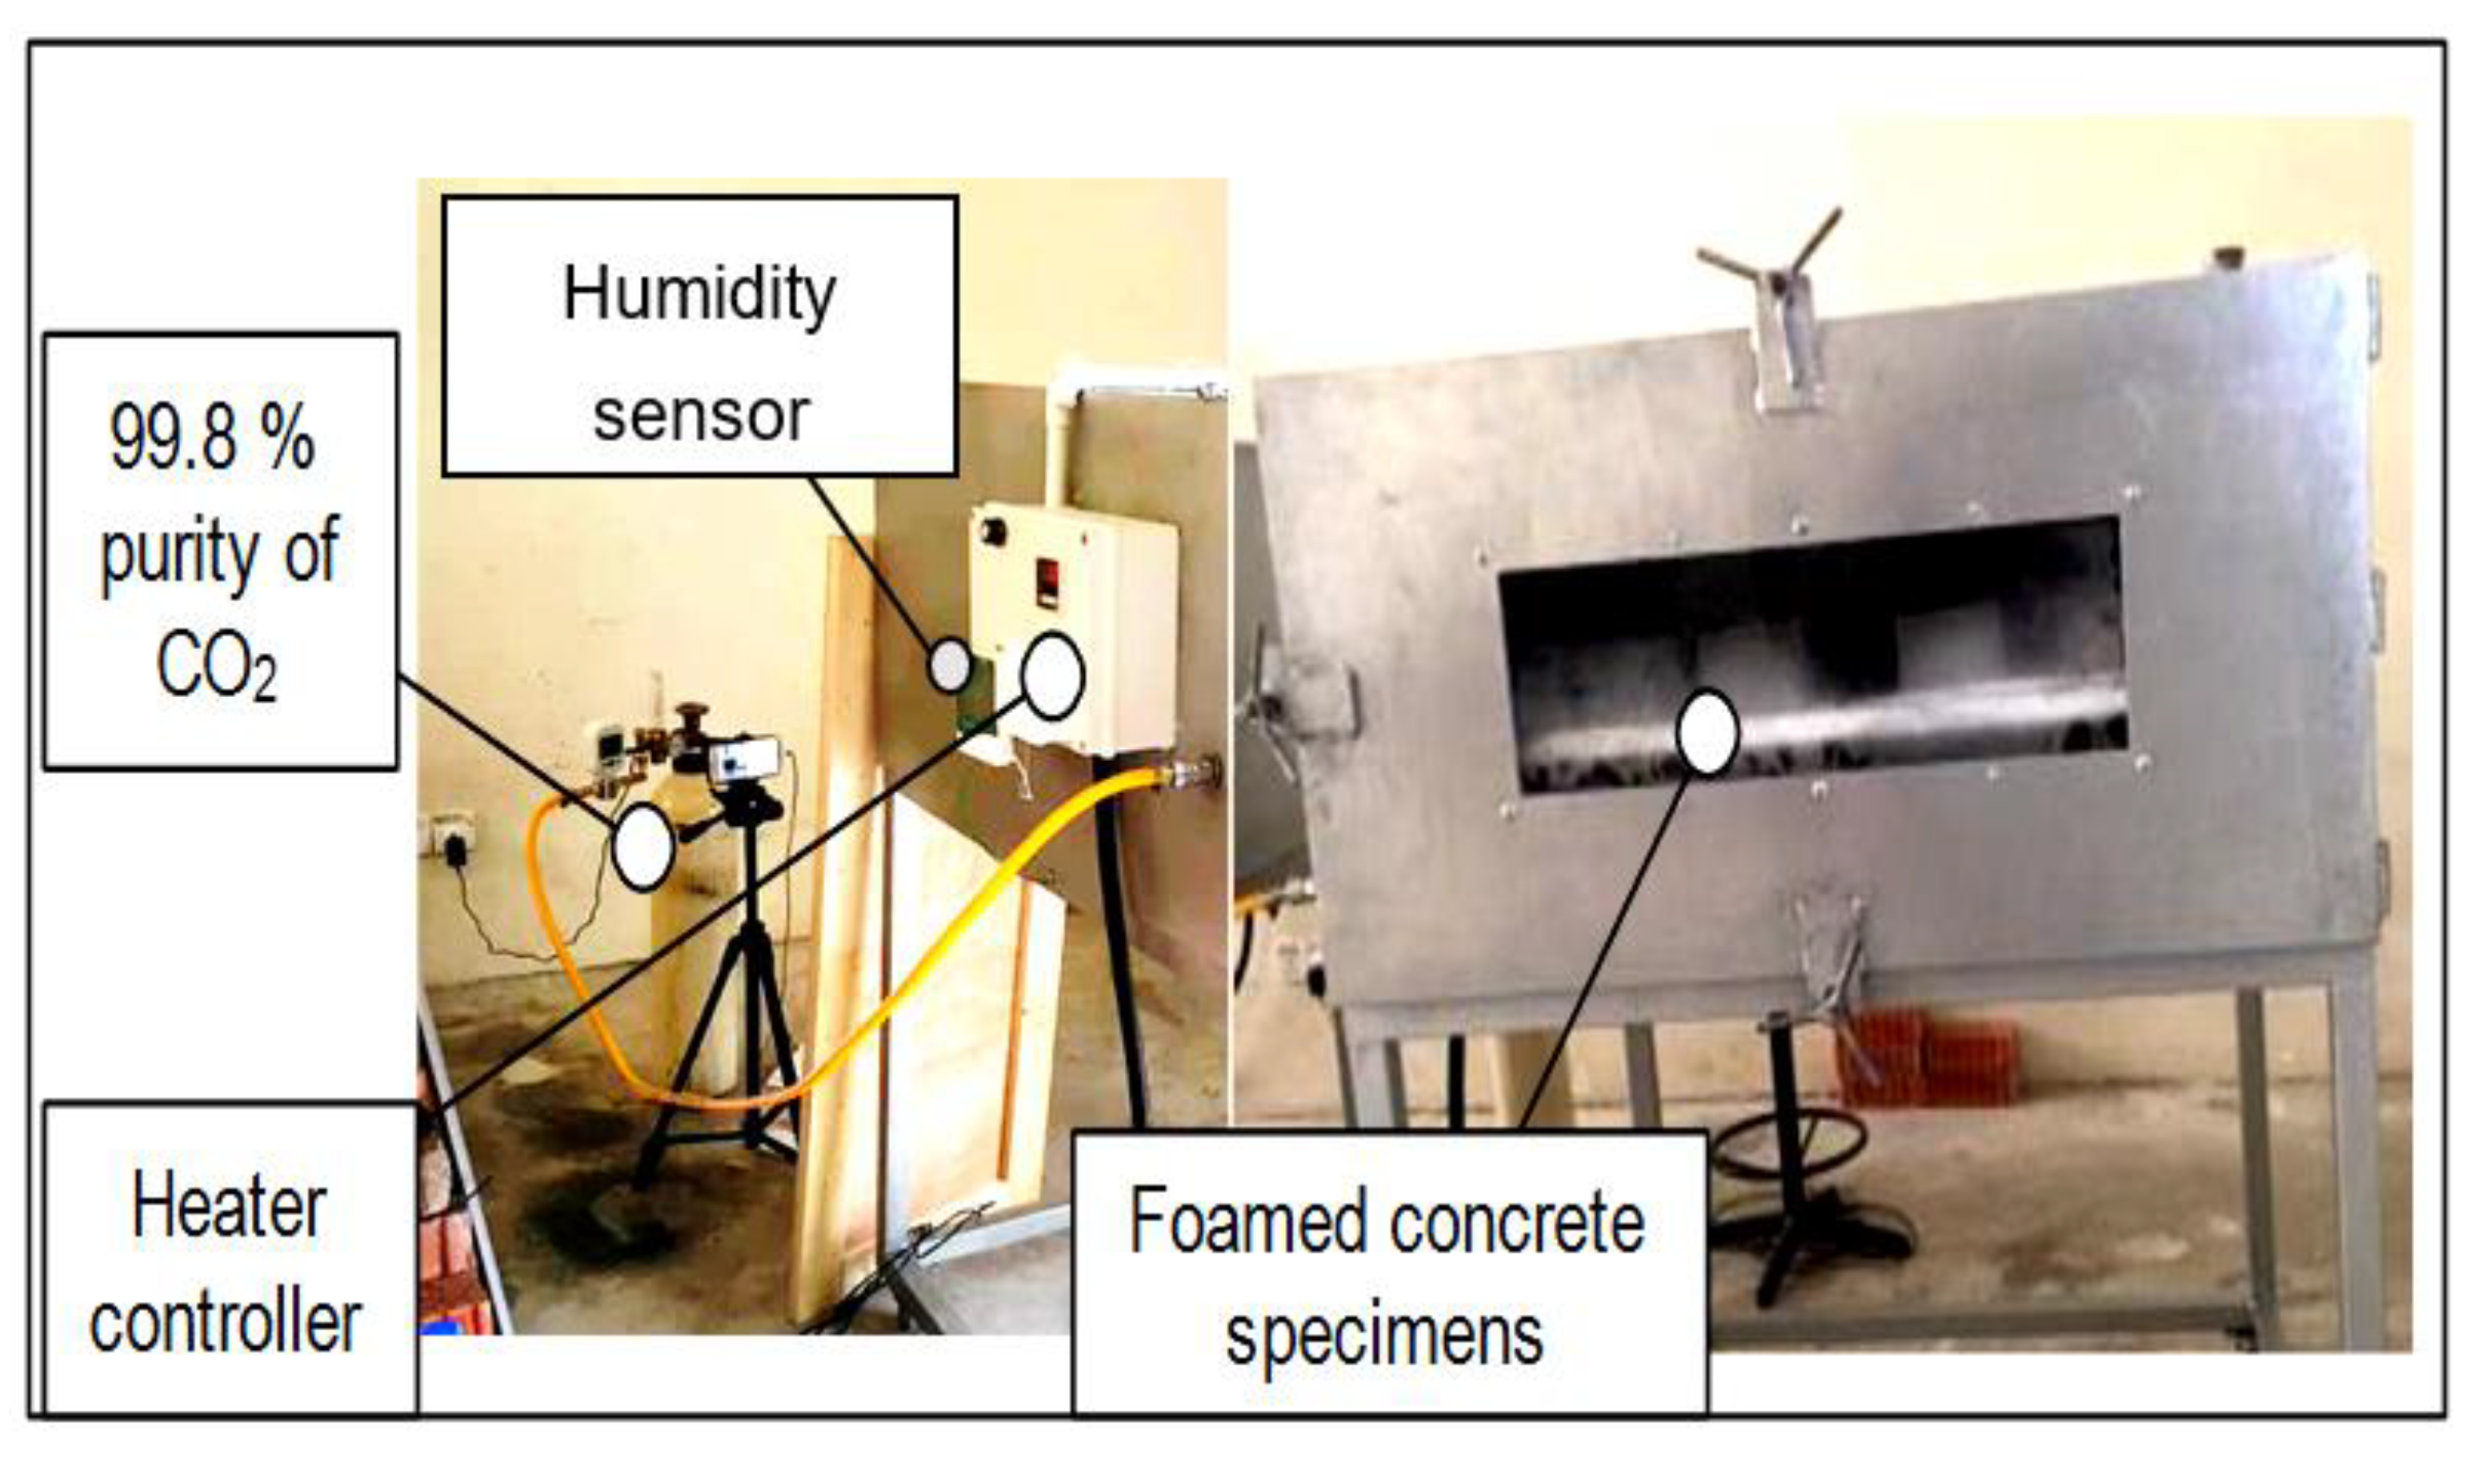
2.3. Sample Preparation and Chamber Curing

The moulds with the size of (215 × 100 × 65 mm) were prepared to fill up by fresh foamed concrete according to the BS6073-2:2008 standard. The concrete specimens were demoulded after 24 h in moulds shown in Figure 3. The specimens were dried in the chamber at 50 °C for 72 h without supplying CO2 in the chamber at this stage. After that, the specimens were cured in the chamber according to the conditions suggested by 2k factorial and RSM as listed in Table 2.
The curing chamber has the ability to control CO2 concentration, temperature and sensor to monitor humidity as shown in Figure 4. The process of carbonation curing commenced after drying the specimens in the same chamber. The carbonation curing was applied for 28 d, whereas the concentration of CO2 for each experimental run was suggested by the 2k factorial and RSM design methods as presented in Table 2. In addition, the relative humidity was monitored along curing period for each run using a humidity sensor inside chamber. The humidity was in the range of 55–75% in all runs, which was increased and decreased within this range according to changes in temperature degree and CO2 concentration in each run.

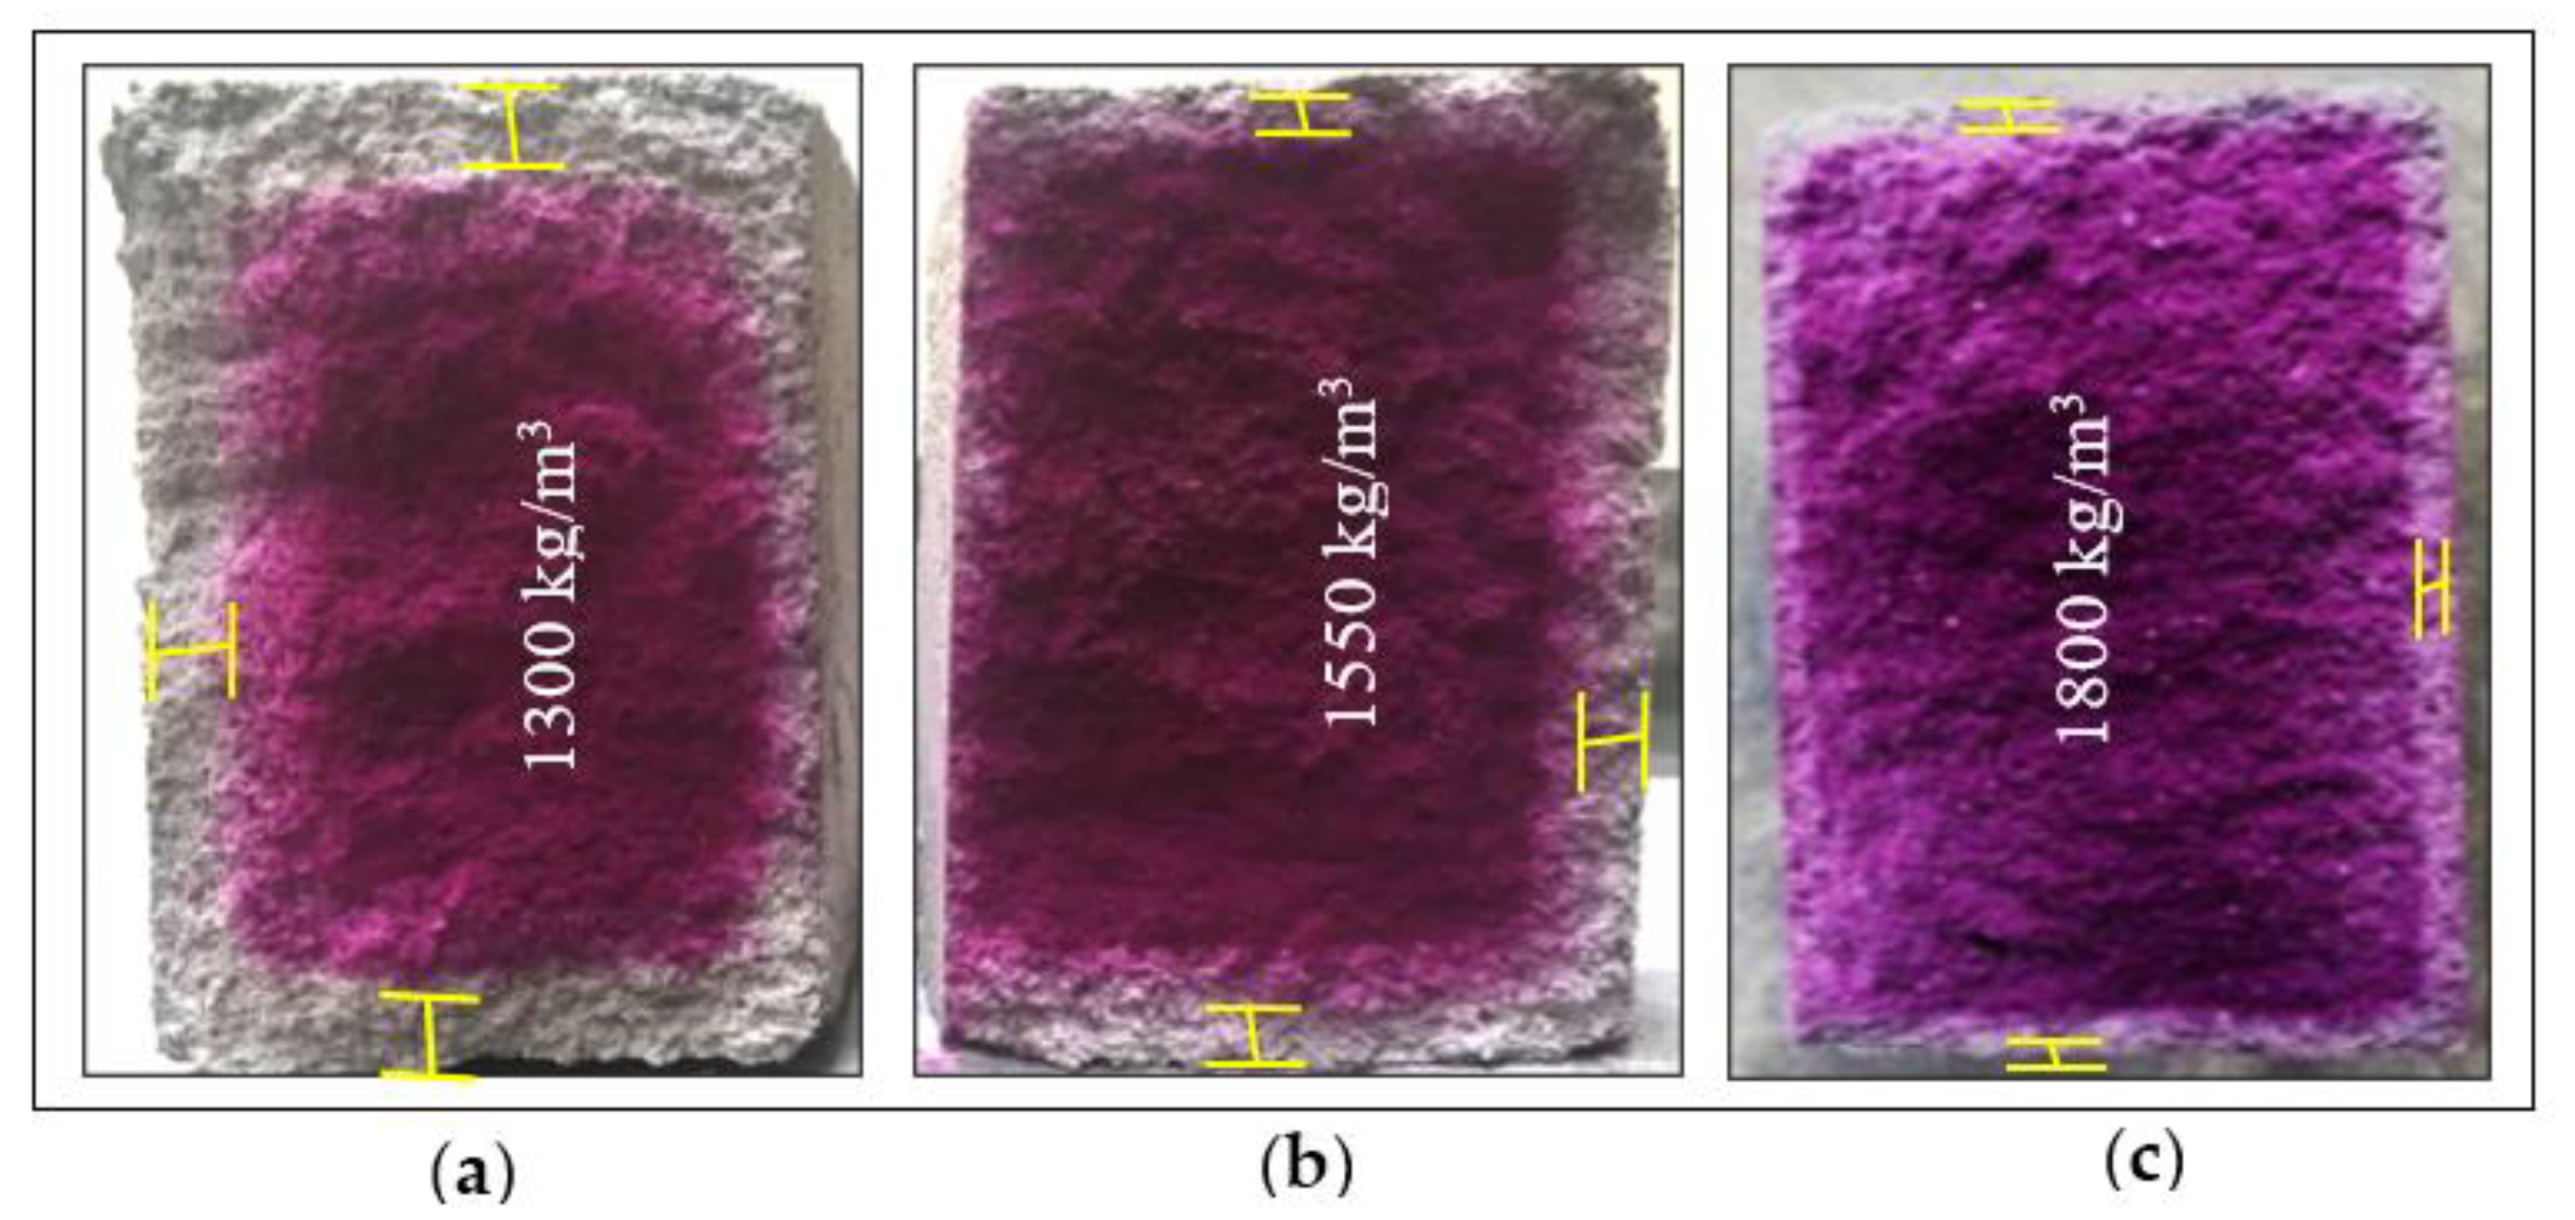
2.4. Hardened Stage Test (Carbonation Depth Test)

The depth of carbonation through the surface of FCB was measured using the simple collared dye field test for detecting carbonation. The specimens of FCB were placed in the chamber to control the CO2 concentration and temperature according to the statistical analysis of 2k factorial and RSM design for 28 d. The phenolphthalein solution was then diluted to indicate carbonation depth as follows; 1 g phenolphthalein dissolved in 100 mL high purity ethanol. The carbonation depth test commenced by splitting the specimen into two halves followed by spraying the freshly broken specimens with phenolphthalein indicator solution. If the colour is reddish-purple, it means the specimens are still in high alkaline condition, while a colourless edge indicates that the specimen is already carbonated and the average corresponding depth is measured. The carbonation depth was measured from the 3 sides exposed to atmospheric CO2, whereas the average of the three sides used as the carbonation depth of the specimen was computed using Equation (2). The average of three specimens of each run of FCB was considered as carbonation depth on each run.
Carbonation   depth   ( mm ) = d 1 + d 2 + d 3 3
whereas;
  • d1 = is the carbonation depth from the first side specimens;
  • d2 = is the carbonation depth from the second side specimens;
  • d3 = is the carbonation depth from the third side specimens.

3. Results

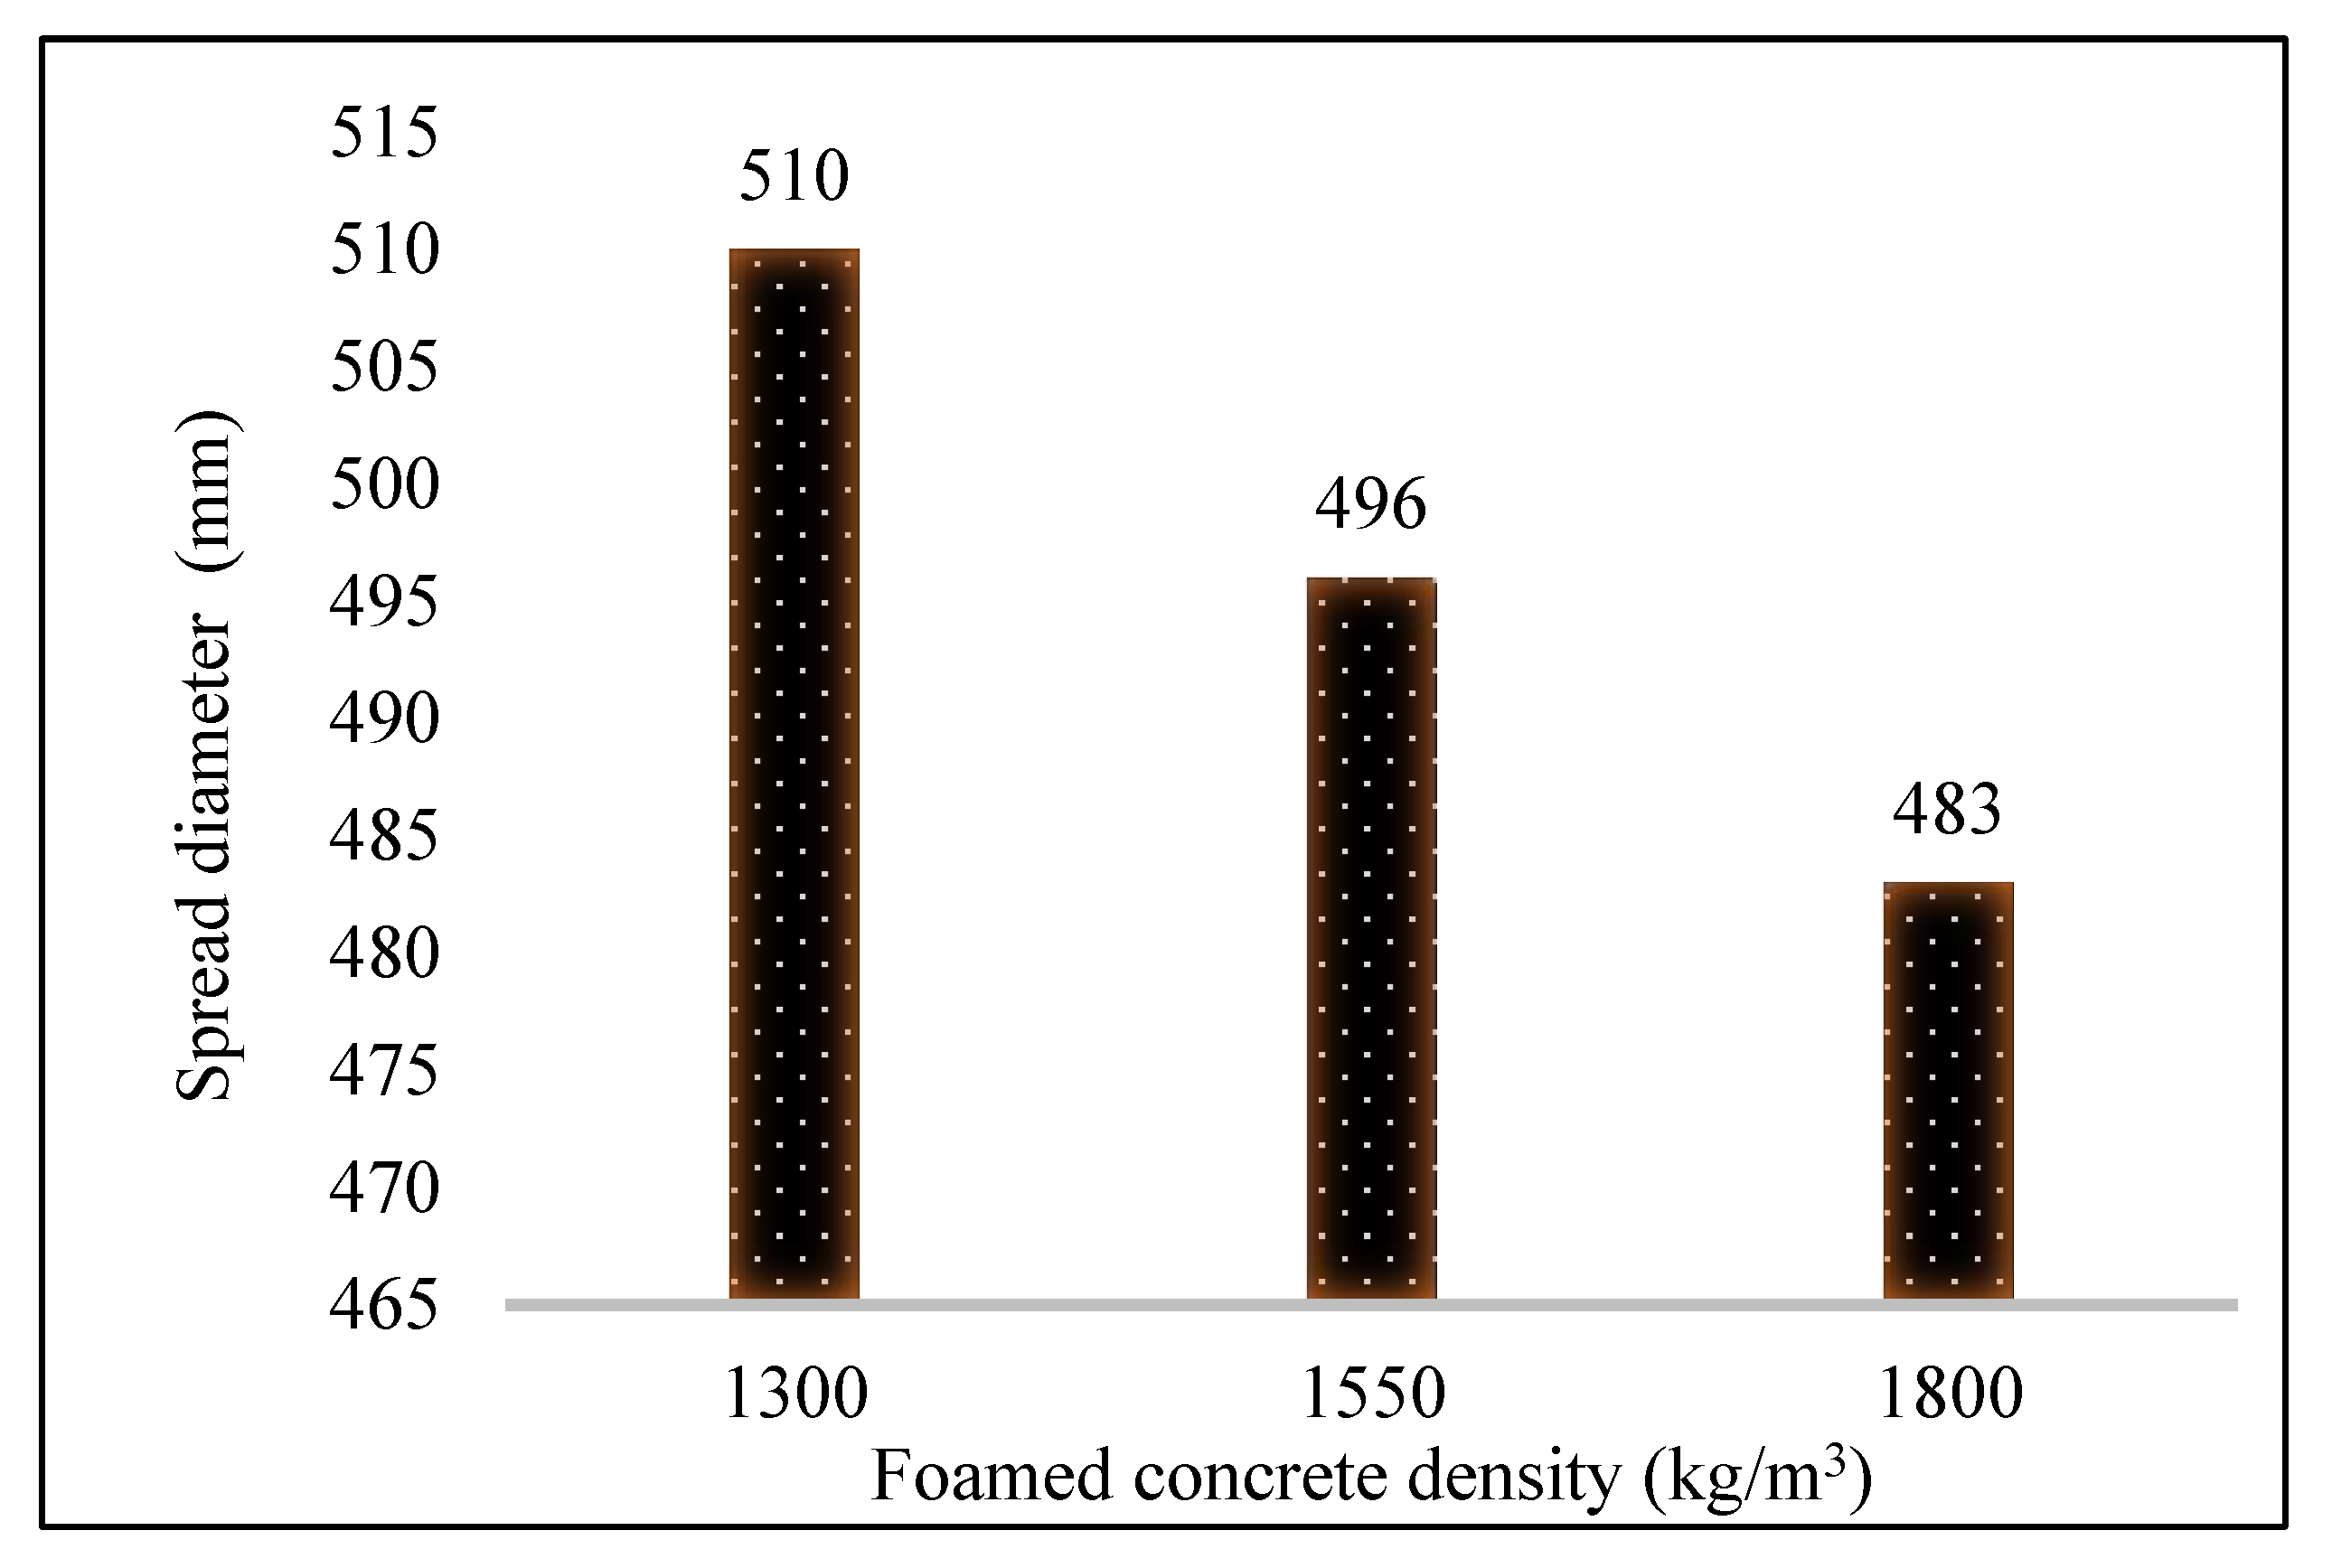
3.1. Fresh and Inverted Slump Tests

The fresh foamed concrete density was adjusted for each mixture via the fresh density test. The main factor for controlling the foamed concrete density is the foaming agent [25]. The three different densities used in this study as follows; 1800 kg/m3, 1550 kg/m3 and 1300 kg/m3. The fresh density was measured successfully for the selected densities. Thereafter, the inverted slump test was performed to determine the workability of the foamed concrete. The results of the inverted slump test demonstrated that the spread diameter of the mixture of 1300 kg/m3 is higher than the mixture with 1550 kg/m3 and 1800 kg/m3. Figure 5 depicts the increase in the spread diameter of the foamed concrete with low density compared to the foamed concrete with higher density. The foaming agent was used to produce foamed concrete with low density, therefore the spread diameter was higher.

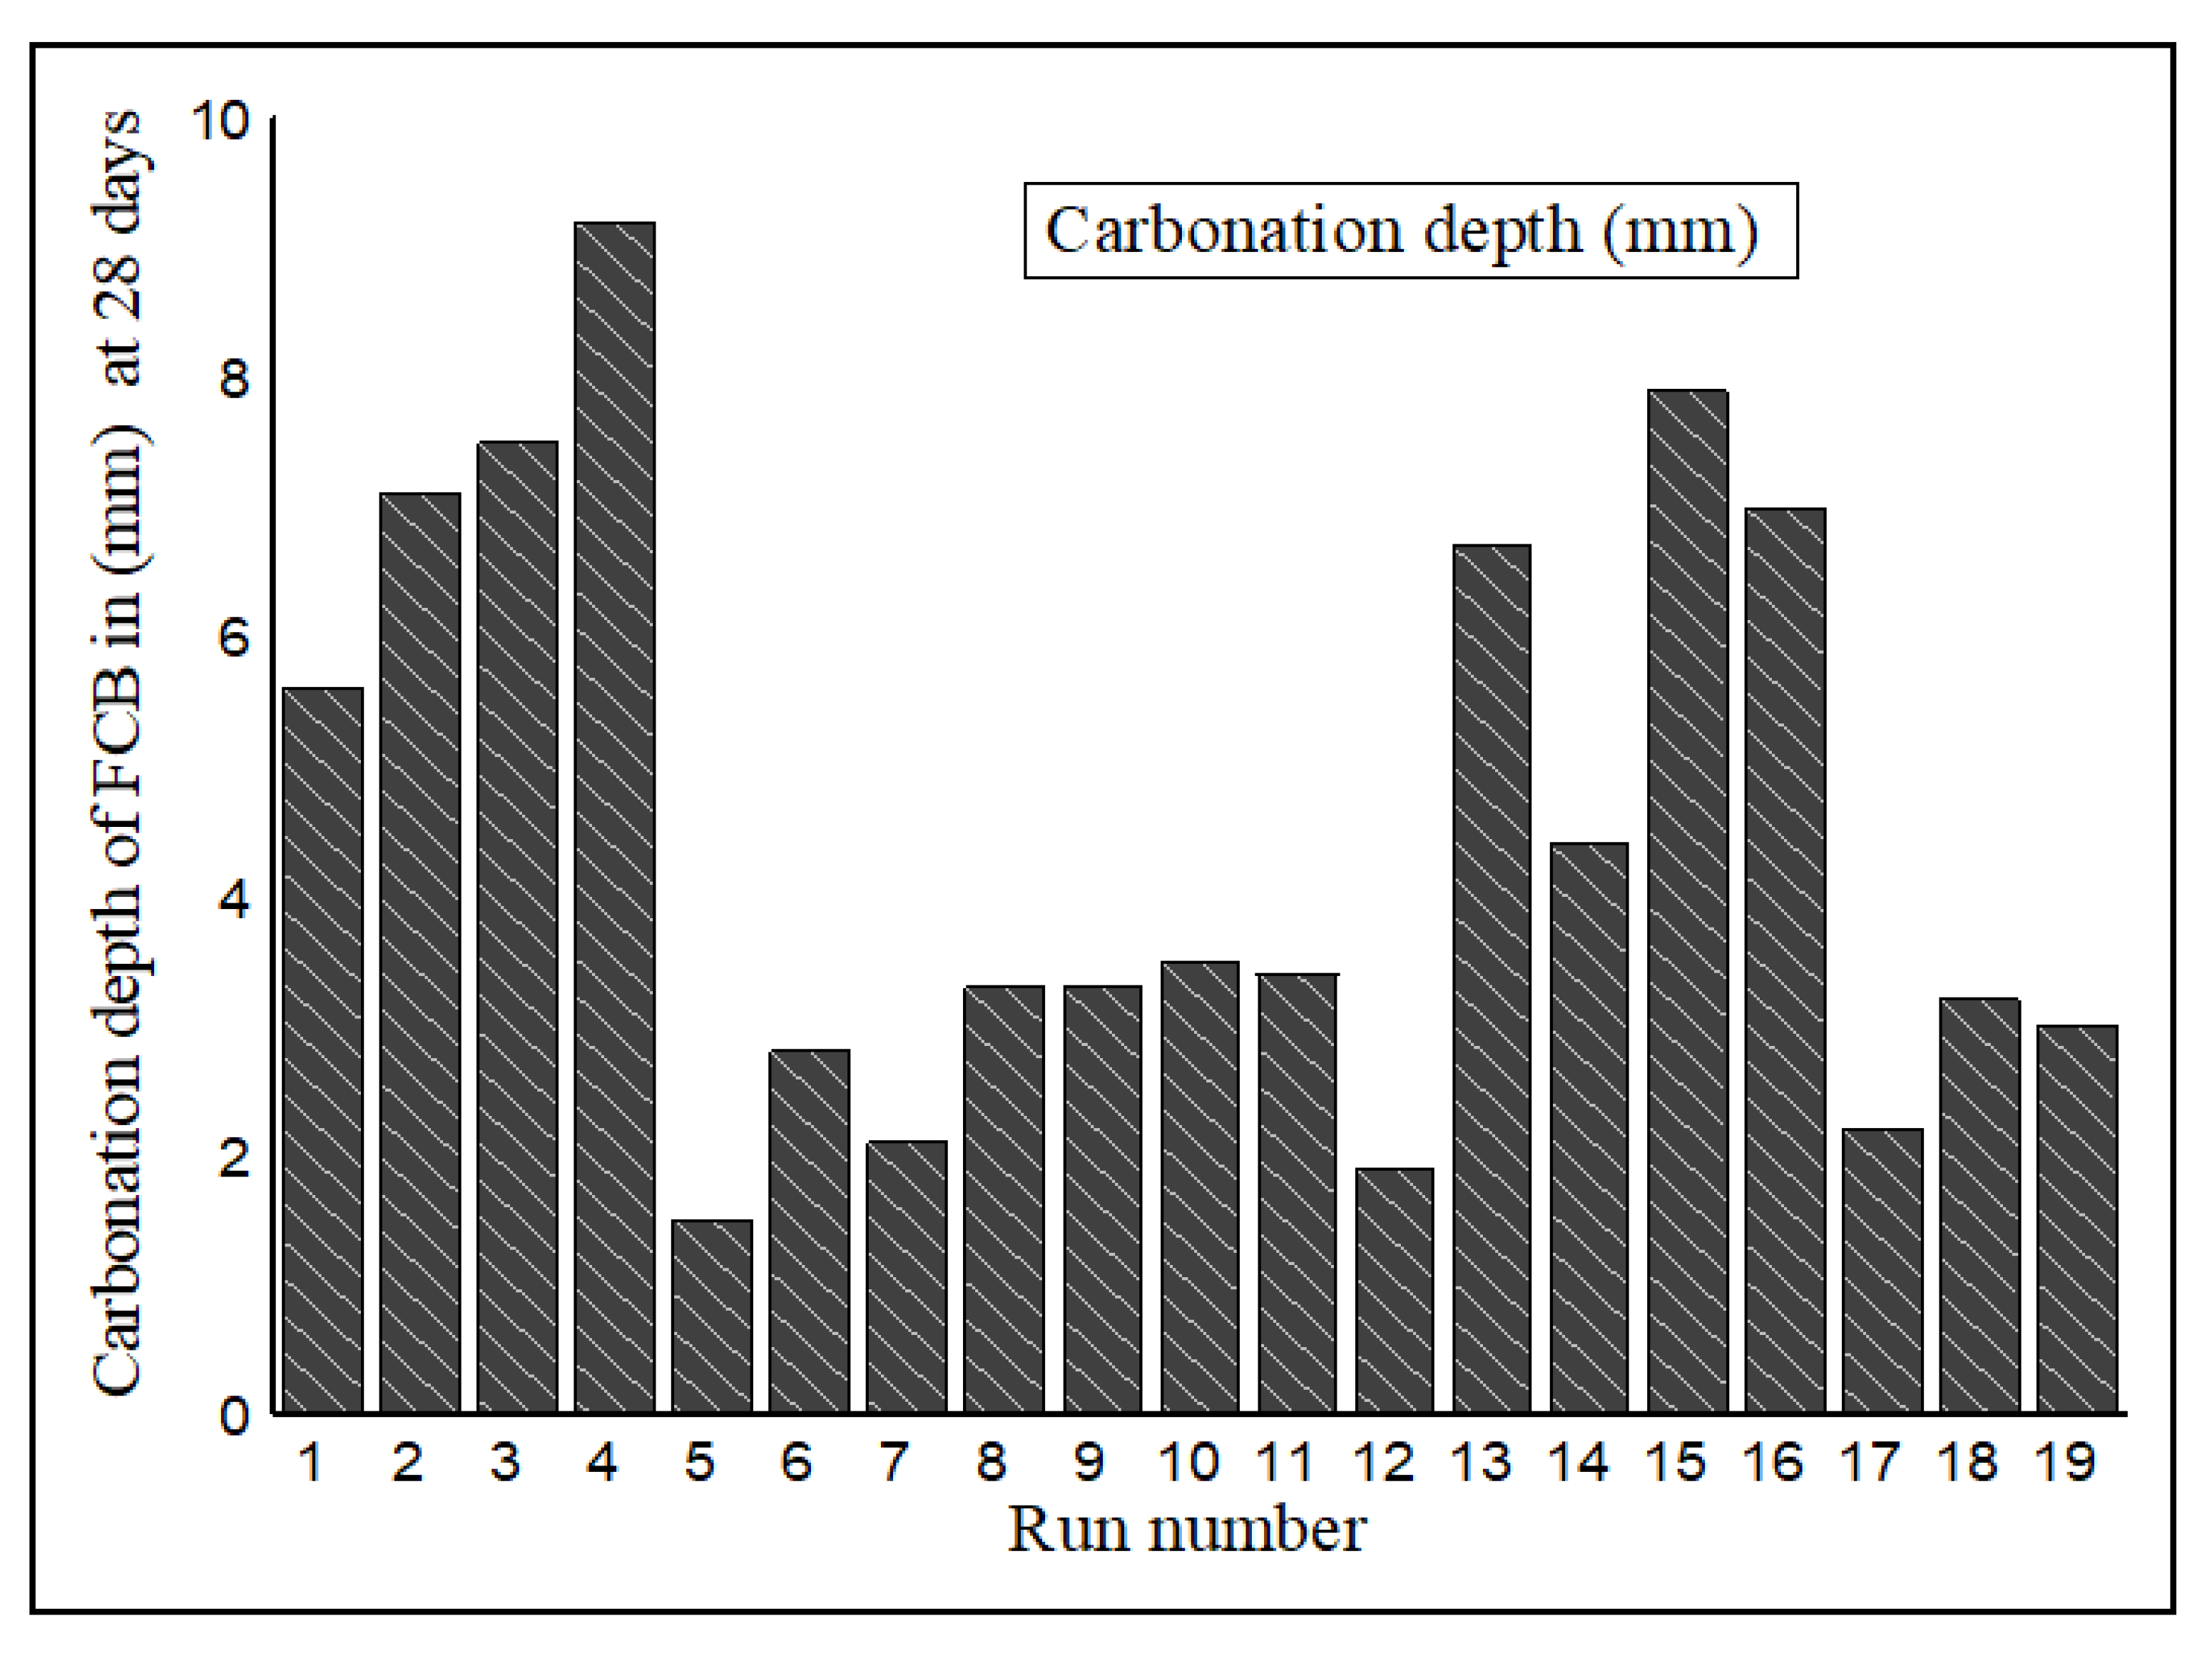
3.2. Carbonation Depth of FCB

The CO2 can be sequestrated into concrete by carbonation depth [26]. However, several factors play important roles in accelerating the sequestration of CO2 or carbonation in concrete especially density and curing conditions such as temperature and CO2 concentration [27]. The results of the carbonation depth of 19 runs as a response of the 2k factorial and RSM designs were analysed. The effects of density, temperature and CO2 concentration on the carbonation depth of FCB is presented in Figure 6.
The increment of carbonation depth in concrete with low density compared to concrete with a higher density is a normal effect [6]. However, the purple-red colour in the specimens with 1800 kg/m3 was obtained due to the extreme pH value [28]. Thus, the portlandite (Ca(OH)2) has the ability to control Ca and caused an expansion of the solid volume inside the concrete at pH > 12 [29,30]. Furthermore, the used of temperature between 27 °C and 40 °C help to keep H2O in portlandite (Ca(OH)2), which in turn increased CO2 ensuing from the carbonation. In contrast, note the higher temperature corresponding to loss of H2O as well as the solubility of CO2 in concrete [10,31].
Consequently, the carbonation depth performance on run numbers: 4, 10 and 17 with the densities 1300 kg/m3, 1550 kg/m3 and 1800 kg/m3 were 9.2 mm, 3.8 mm and 2.1 mm at 28 d, respectively as shown in Figure 7. However, the density was not the only factor that caused a significant effect on the increase or decrease of carbonation depth in FCB. Nevertheless, the change of carbonation depth on FCB that has the same density is unusual except due to some reasons. Temperature and CO2 concentration along with curing conditions also altered the carbonation depth of FCB when the density held on some runs. For example, the highest carbonation depth was 9.2 mm at run 4 with 1300 kg/m3, 40 °C and 20% of CO2 concentration, while for the density at run 1, the carbonation depth was 5.6 mm when the temperature and CO2 concentration were at 27 °C and 20%, respectively. Similarly, the carbonation depth of runs 7 and 8 are 2.1 mm and 3.2 mm at the density and temperature 1800 kg/m3 and 40 °C, respectively. However, the concentration of CO2 changed from 10% and 20%, respectively. This finding has demonstrated the effect of CO2 concentration on the increase carbonation depth of FCB.

3.3. Factorial and RSM Analyses

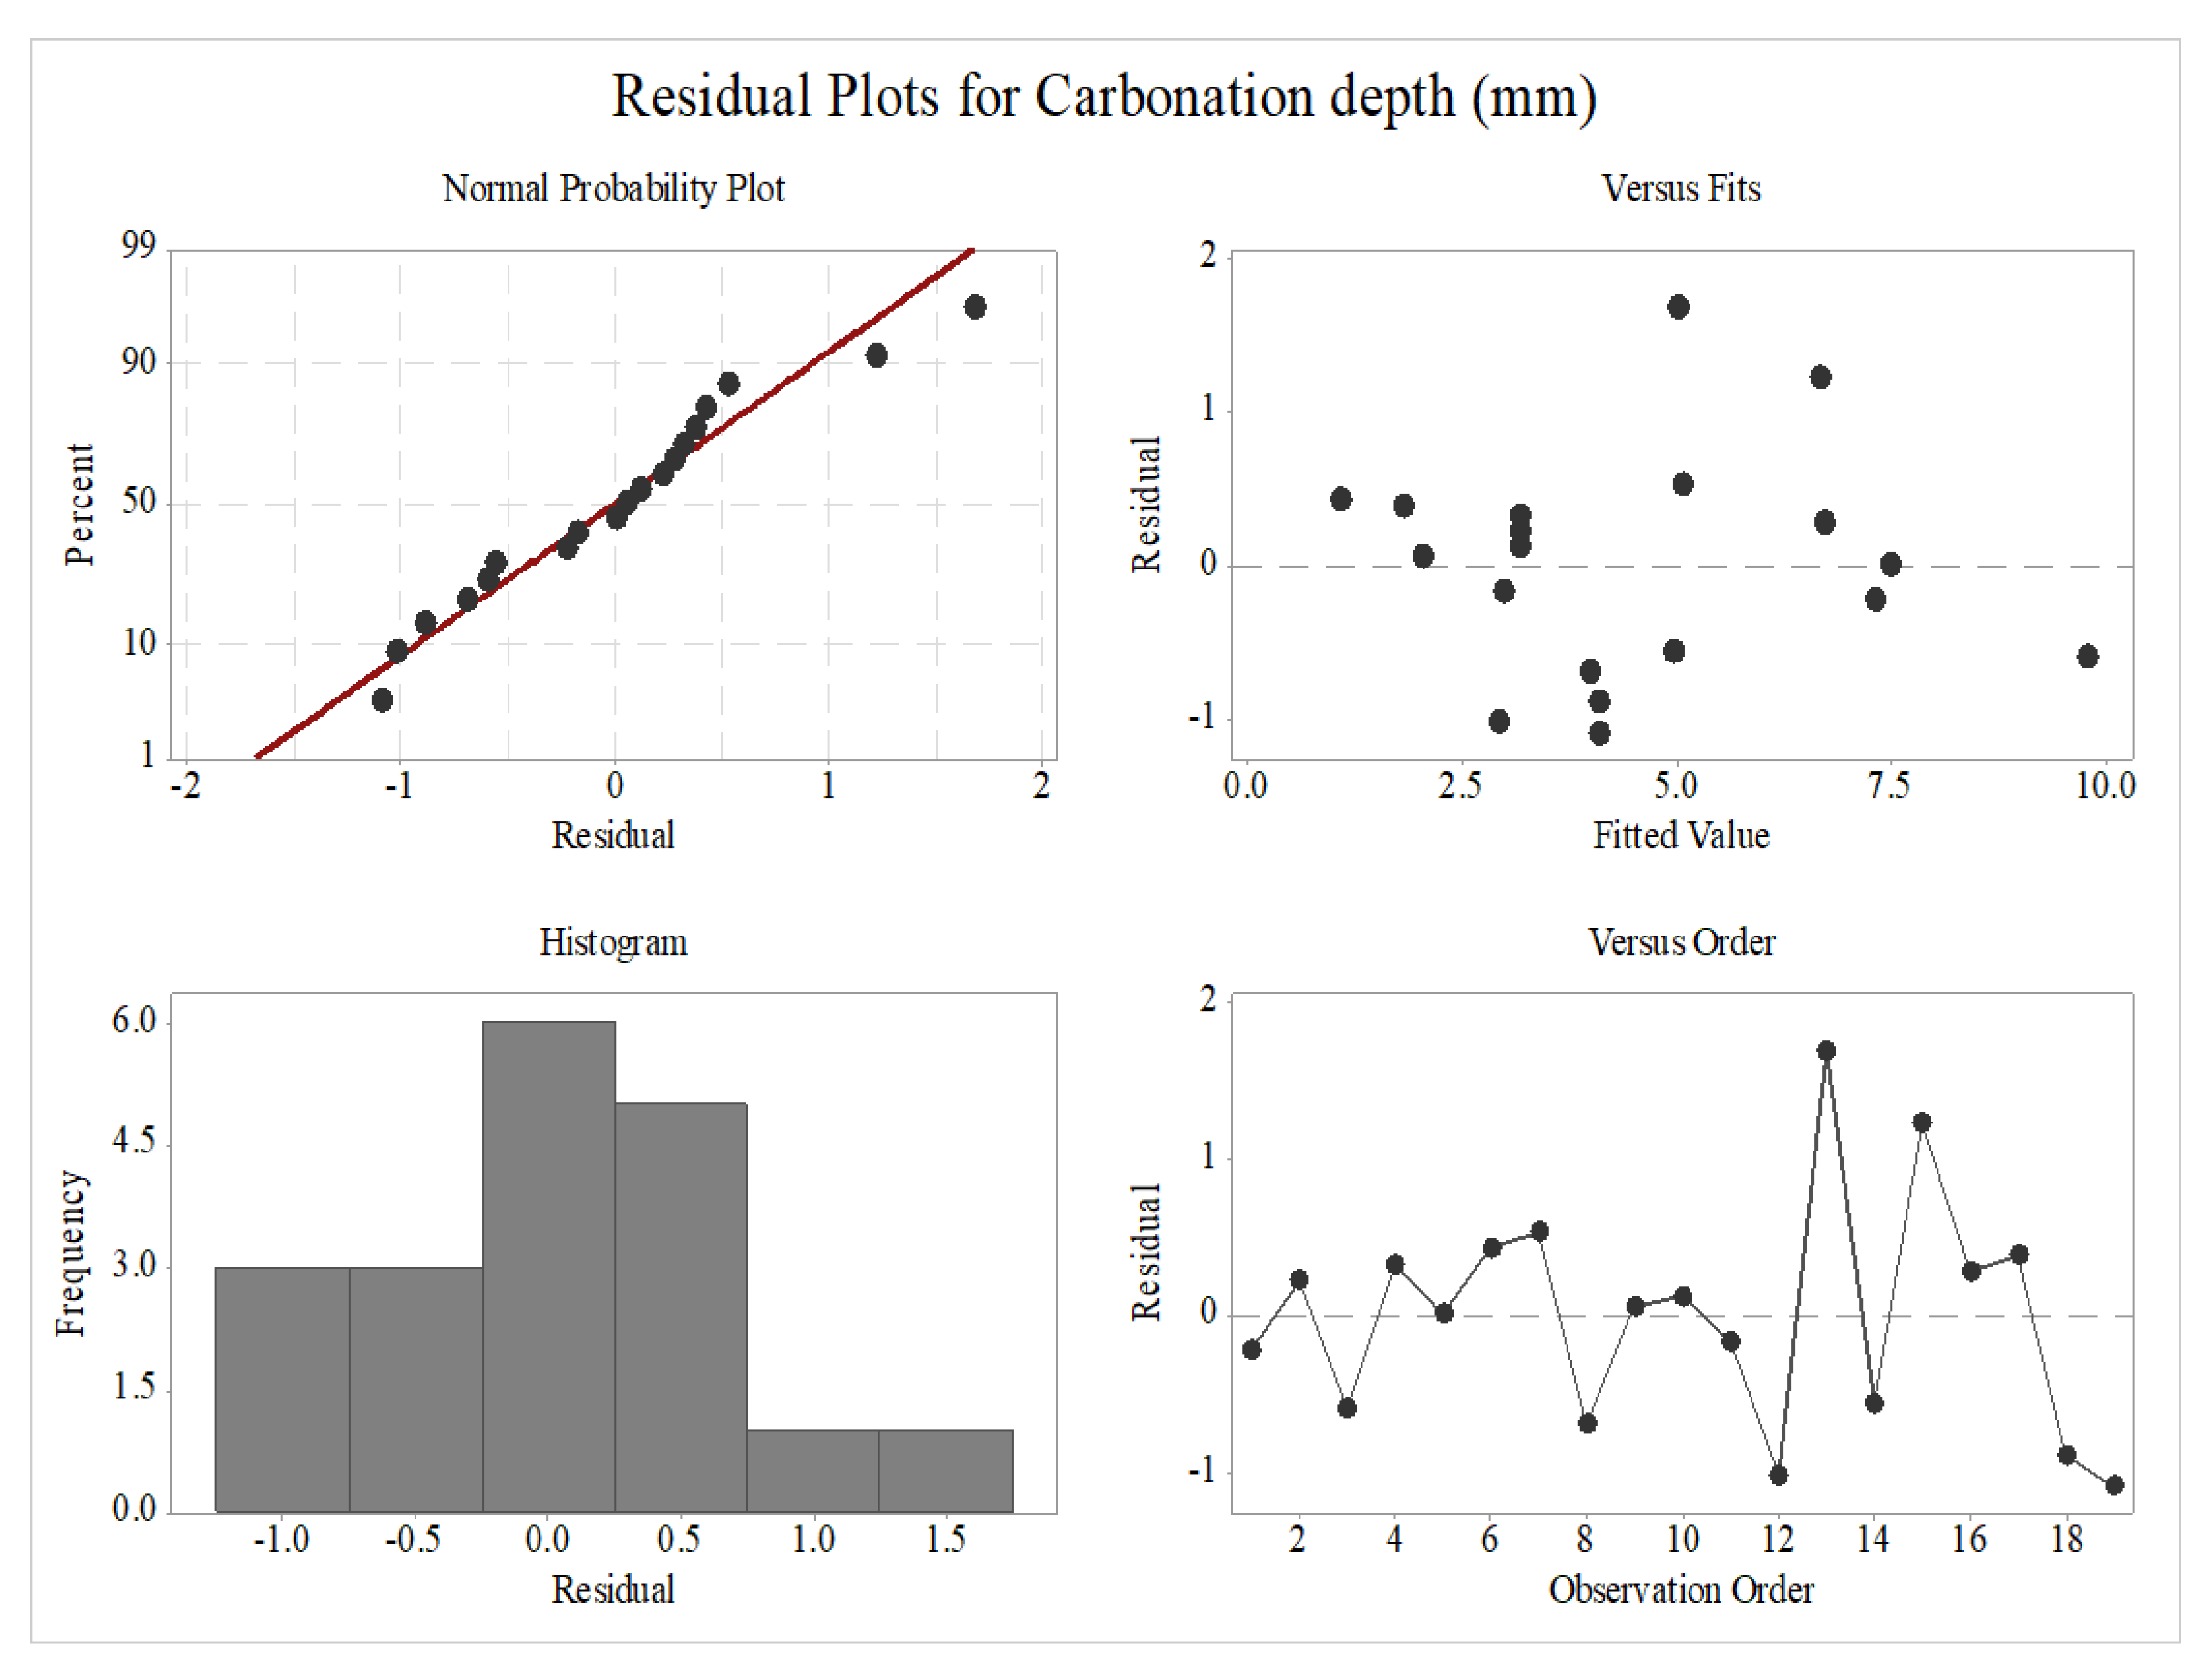
3.3.1. Residual Plots of Carbonation Depth

In factorial design, the ANOVA conclusions can only be accepted when the adequacy of the underlying model has been evaluated. The primary diagnostic tool to gauge the model adequacy is residual analysis. The residual data or the measured errors should demonstrate normal distribution, independent distribution, zero mean value and constant variance σ2 at all runs. If all residuals satisfy the aforementioned requirements, so that the F0 ratio will follow an F distribution that will lead to accurate ANOVA results. Furthermore, the effects of nuisance factors will be excluded from the analysis [32]. In this study, the residual plots of normal probability were used to indicate whether the model meets the assumptions of the analysis or not [33]. As can be seen in Figure 8, the normal probability plot (NPP) shows the majority points cluster to a straight line and this indicates the residual distributions are likely to be a normal and hence the model meets the assumption. On top of that, the fine segregation of the points around the normal probability line demonstrates a precise prediction of the carbonation depth of FCB. Meanwhile, the versus fits in residual plots present the scattered values about zero and no obvious pattern can be observed. In addition, only two points are slightly departed from the red line in the NPP, in which the errors can be assumed as normal [32], whereas the allowable error of the findings is <5% to reflect a high level of accuracy in the data analysis [33].

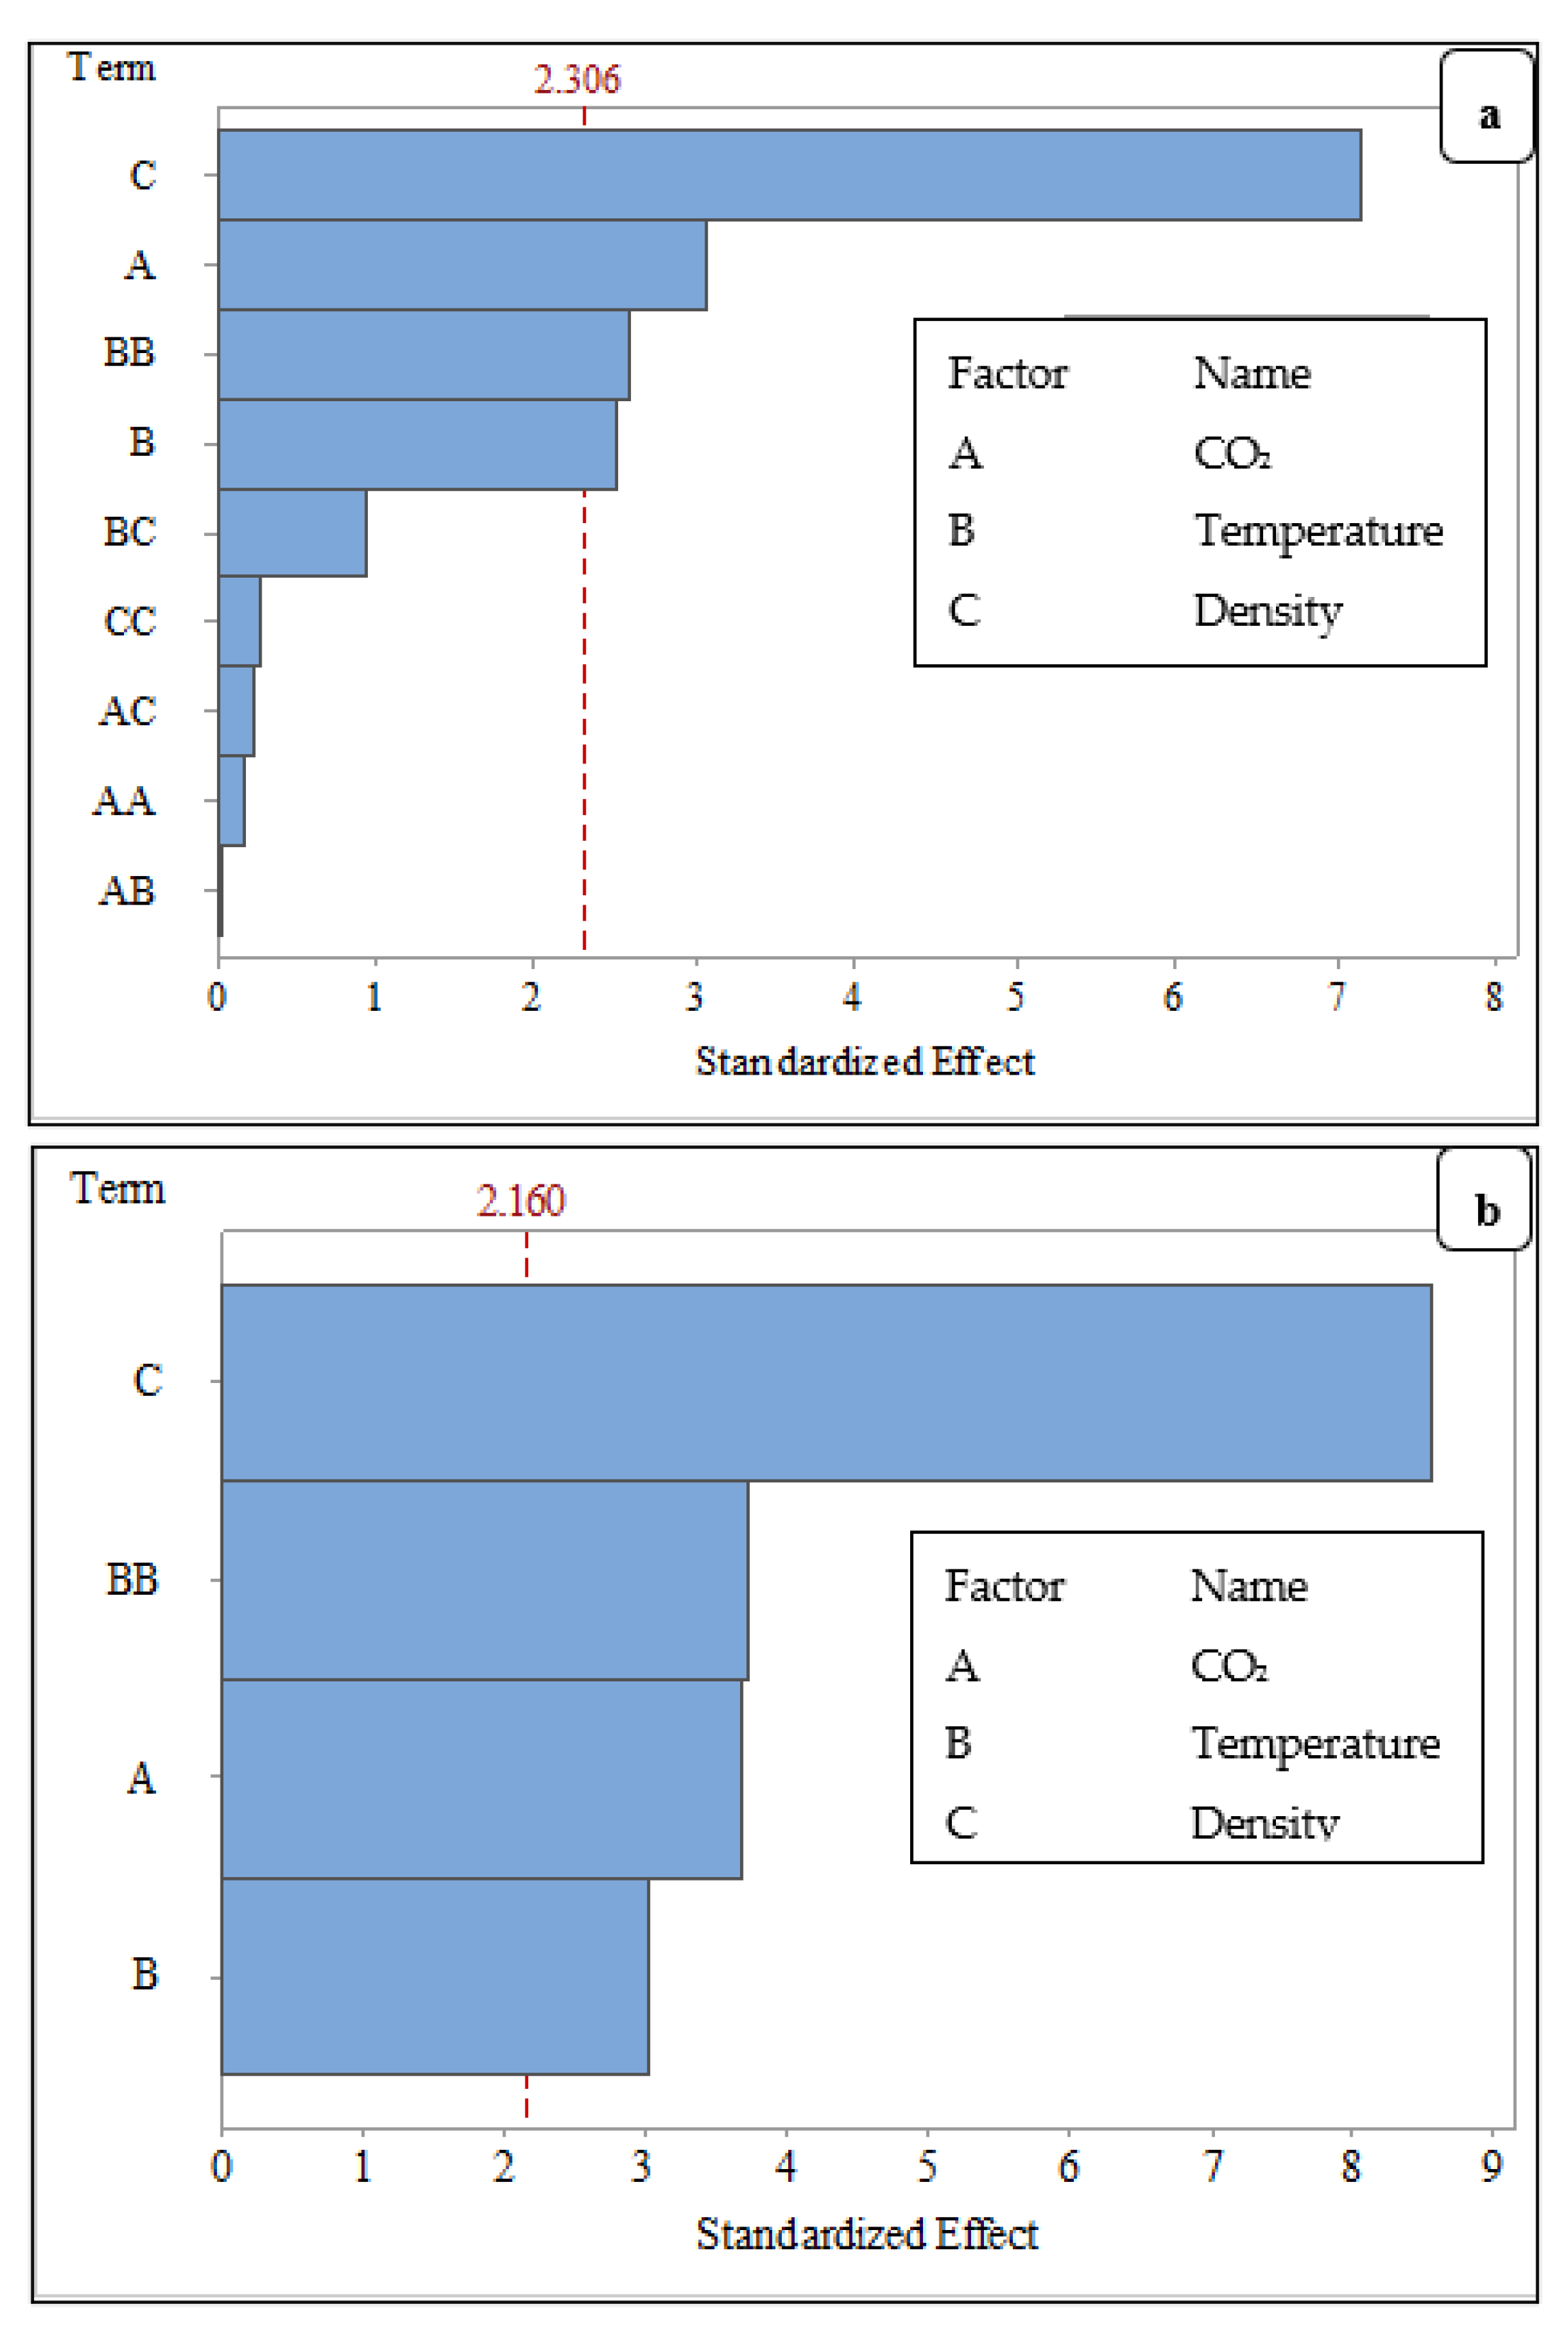
3.3.2. Significance of the Factors to Carbonation Depth of FCB

The statistical significance of the factors to carbonation depth of FCB was evaluated from the results of the 19 runs of the 2k factorial and RSM analysis. The p-value of each factor was below 0.05, as illustrated by ANOVA analysis in Table 3. The p-value of CO2, temperature and density were; 0.003, 0.010 and 0.000, respectively. The ANOVA results reflect the highly significant effect of the factors on the response (carbonation depth). Consequently, the effect of CO2, temperature and density were 3.67, 3.01, and −8.57, respectively. The results show that the highest effect on carbonation depth was by the density of FCB. This finding, in line with previous studies, shows that the increase or decrease of concrete density mainly affects the performance of carbonation depth [1,8]. Likewise, the CO2 concentration and the temperature also influenced the carbonation depth of FCB. However, the increase of temperature higher than 60 °C may reduce CO2 sequestration because the solubility of CO2 decreases in the waste at high degree of temperature, which in turn reduces the carbonation depth in concrete [18]. Due to that, most of the researchers preferred to use temperatures lower that 60 °C to increase carbonation in concrete as practiced in this research [13].
The Pareto charts in Figure 9a demonstrate the significance of each input CO2, temperature, and density. Therefore, the magnitude and the importance of the standardized effect of each factor and interactions were obtained in the statistical analysis. The horizontal bars of the factor and interaction that crosses the segmented vertical reference line is considered as statistically significant. The results show that the total number of single and double interaction terms was 9, although five of the terms were non-significant, as demonstrated in Figure 9a. Consequently, the significant terms A, B, C and BB were maintained, but the non-significant terms BC, CC, AC, AA and AB were removed from the analysis to improve the accuracy of the model as shown in Figure 9a,b. As observed, the main factors A, B and C significantly affect the carbonation of FCB. The observation from the results of C had the highest effect on the carbonation depth of FCB, followed by A and B accordingly. The curing conditions, such as temperature and CO2 concentration, play an important role in the carbonation of concrete, as also observed by previous researchers [17,34].

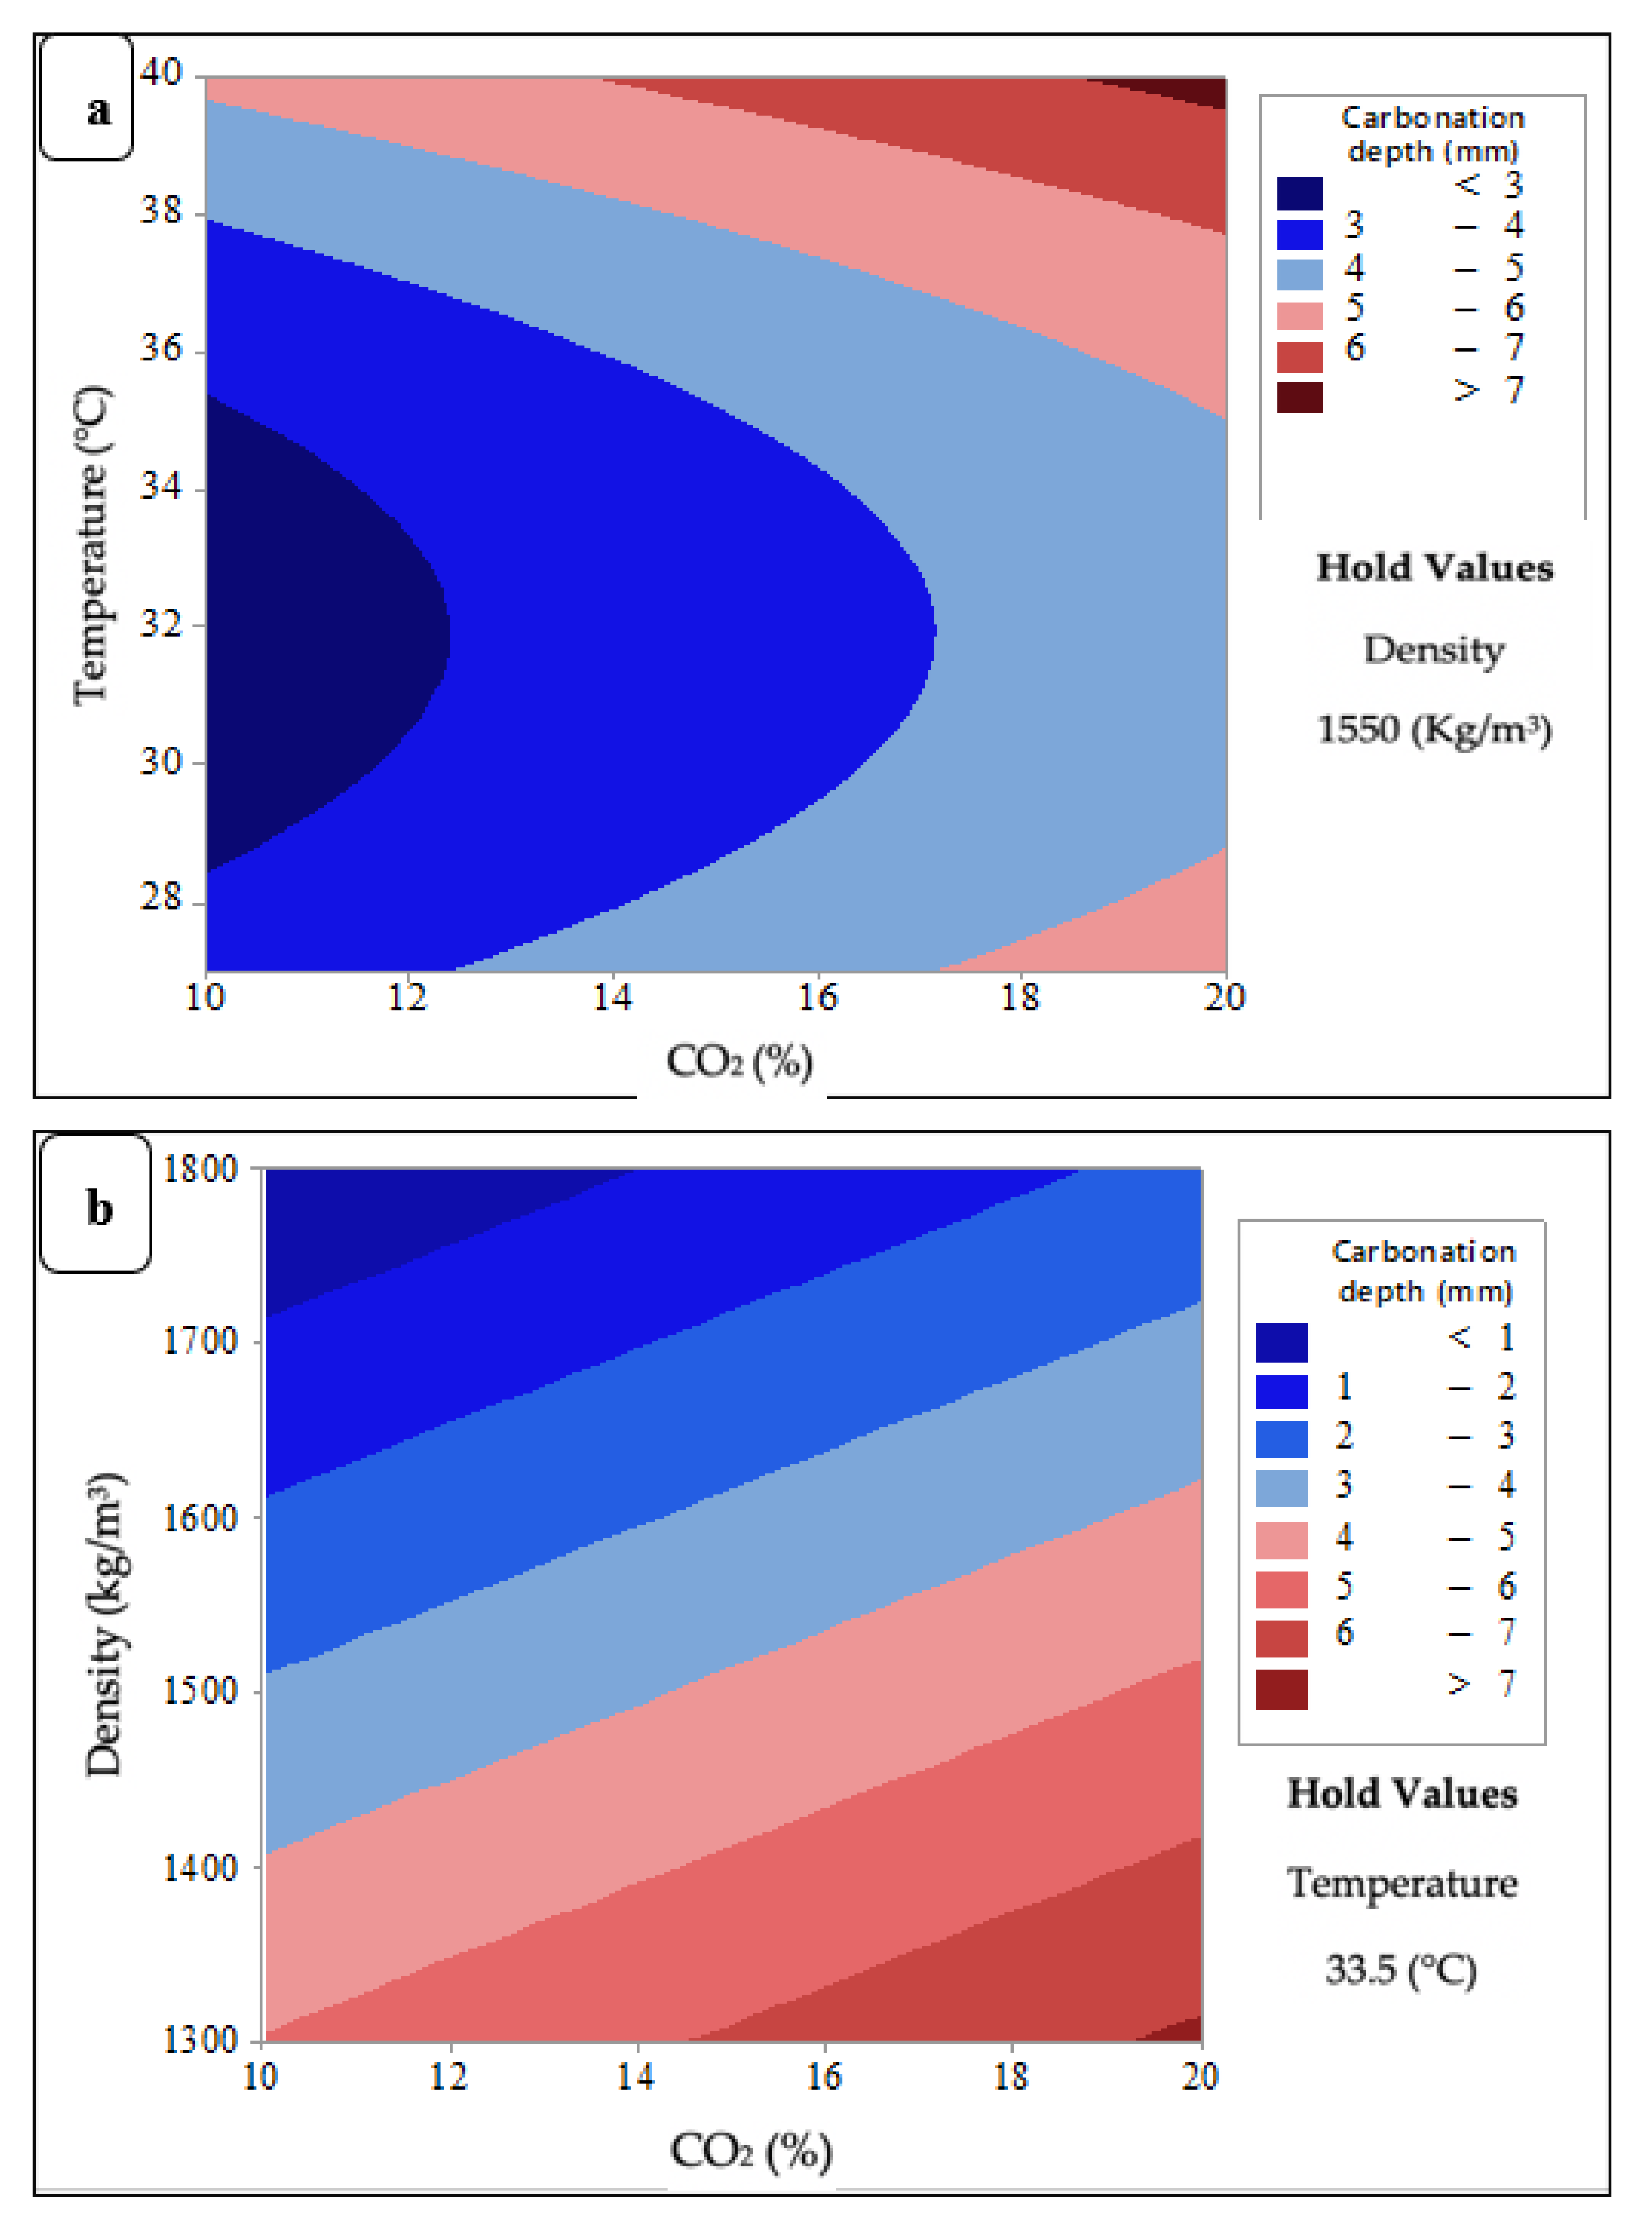
3.3.3. Contour Plots of Carbonation Depth of FCB

The contour plots shown in Figure 10a,b depict the effect of the parameters on carbonation depth of FCB. The contour plot is one of the most useful plots in RSM used to demonstrate the effect of two factors and holding the other factors. The plots exhibit layers with different gradually changing colours indicative of the possible independence of factors with a response. The contour plots depict the graphical relationship of two factors, i.e., density and temperature over the carbonation depth of FCB, while the CO2 concentration is held at the centre value.
Figure 10a depicts the effect of density and CO2 concentration on the carbonation of FCB. In general, the carbonation depth at a low level of CO2 and temperature was very low, while it was higher at higher settings of temperature and CO2. The lowest carbonation depth occurred when the temperature was between 28.2 °C and 35.5 °C and the CO2 concentration was between 10% and 12%, respectively. In contrast, the highest carbonation depth occurred at 40 °C and 20% CO2. Based on the findings, the increase in temperature and CO2 concentration along with the curing of FCB accelerates the process of carbonation.
Figure 10b demonstrates the effect of density and CO2 concentration on the carbonation depth of FCB. The increase in density reduced of the carbonation depth, while the increase in CO2 concentration increased the carbonation depth. Thus, the highest carbonation depth of FCB was at 20% CO2 for specimens with a density of 1300 kg/m3. However, the lowest carbonation depth occurred at 10% CO2 for the specimen 1800 kg/m3 density.
From the above discussions, it can be surmised that carbonation depth could be enhanced at higher CO2 concentrations and temperatures. Besides, the low density of FCB played an important role in accelerating CO2 sequestration due to the high level of porosity.

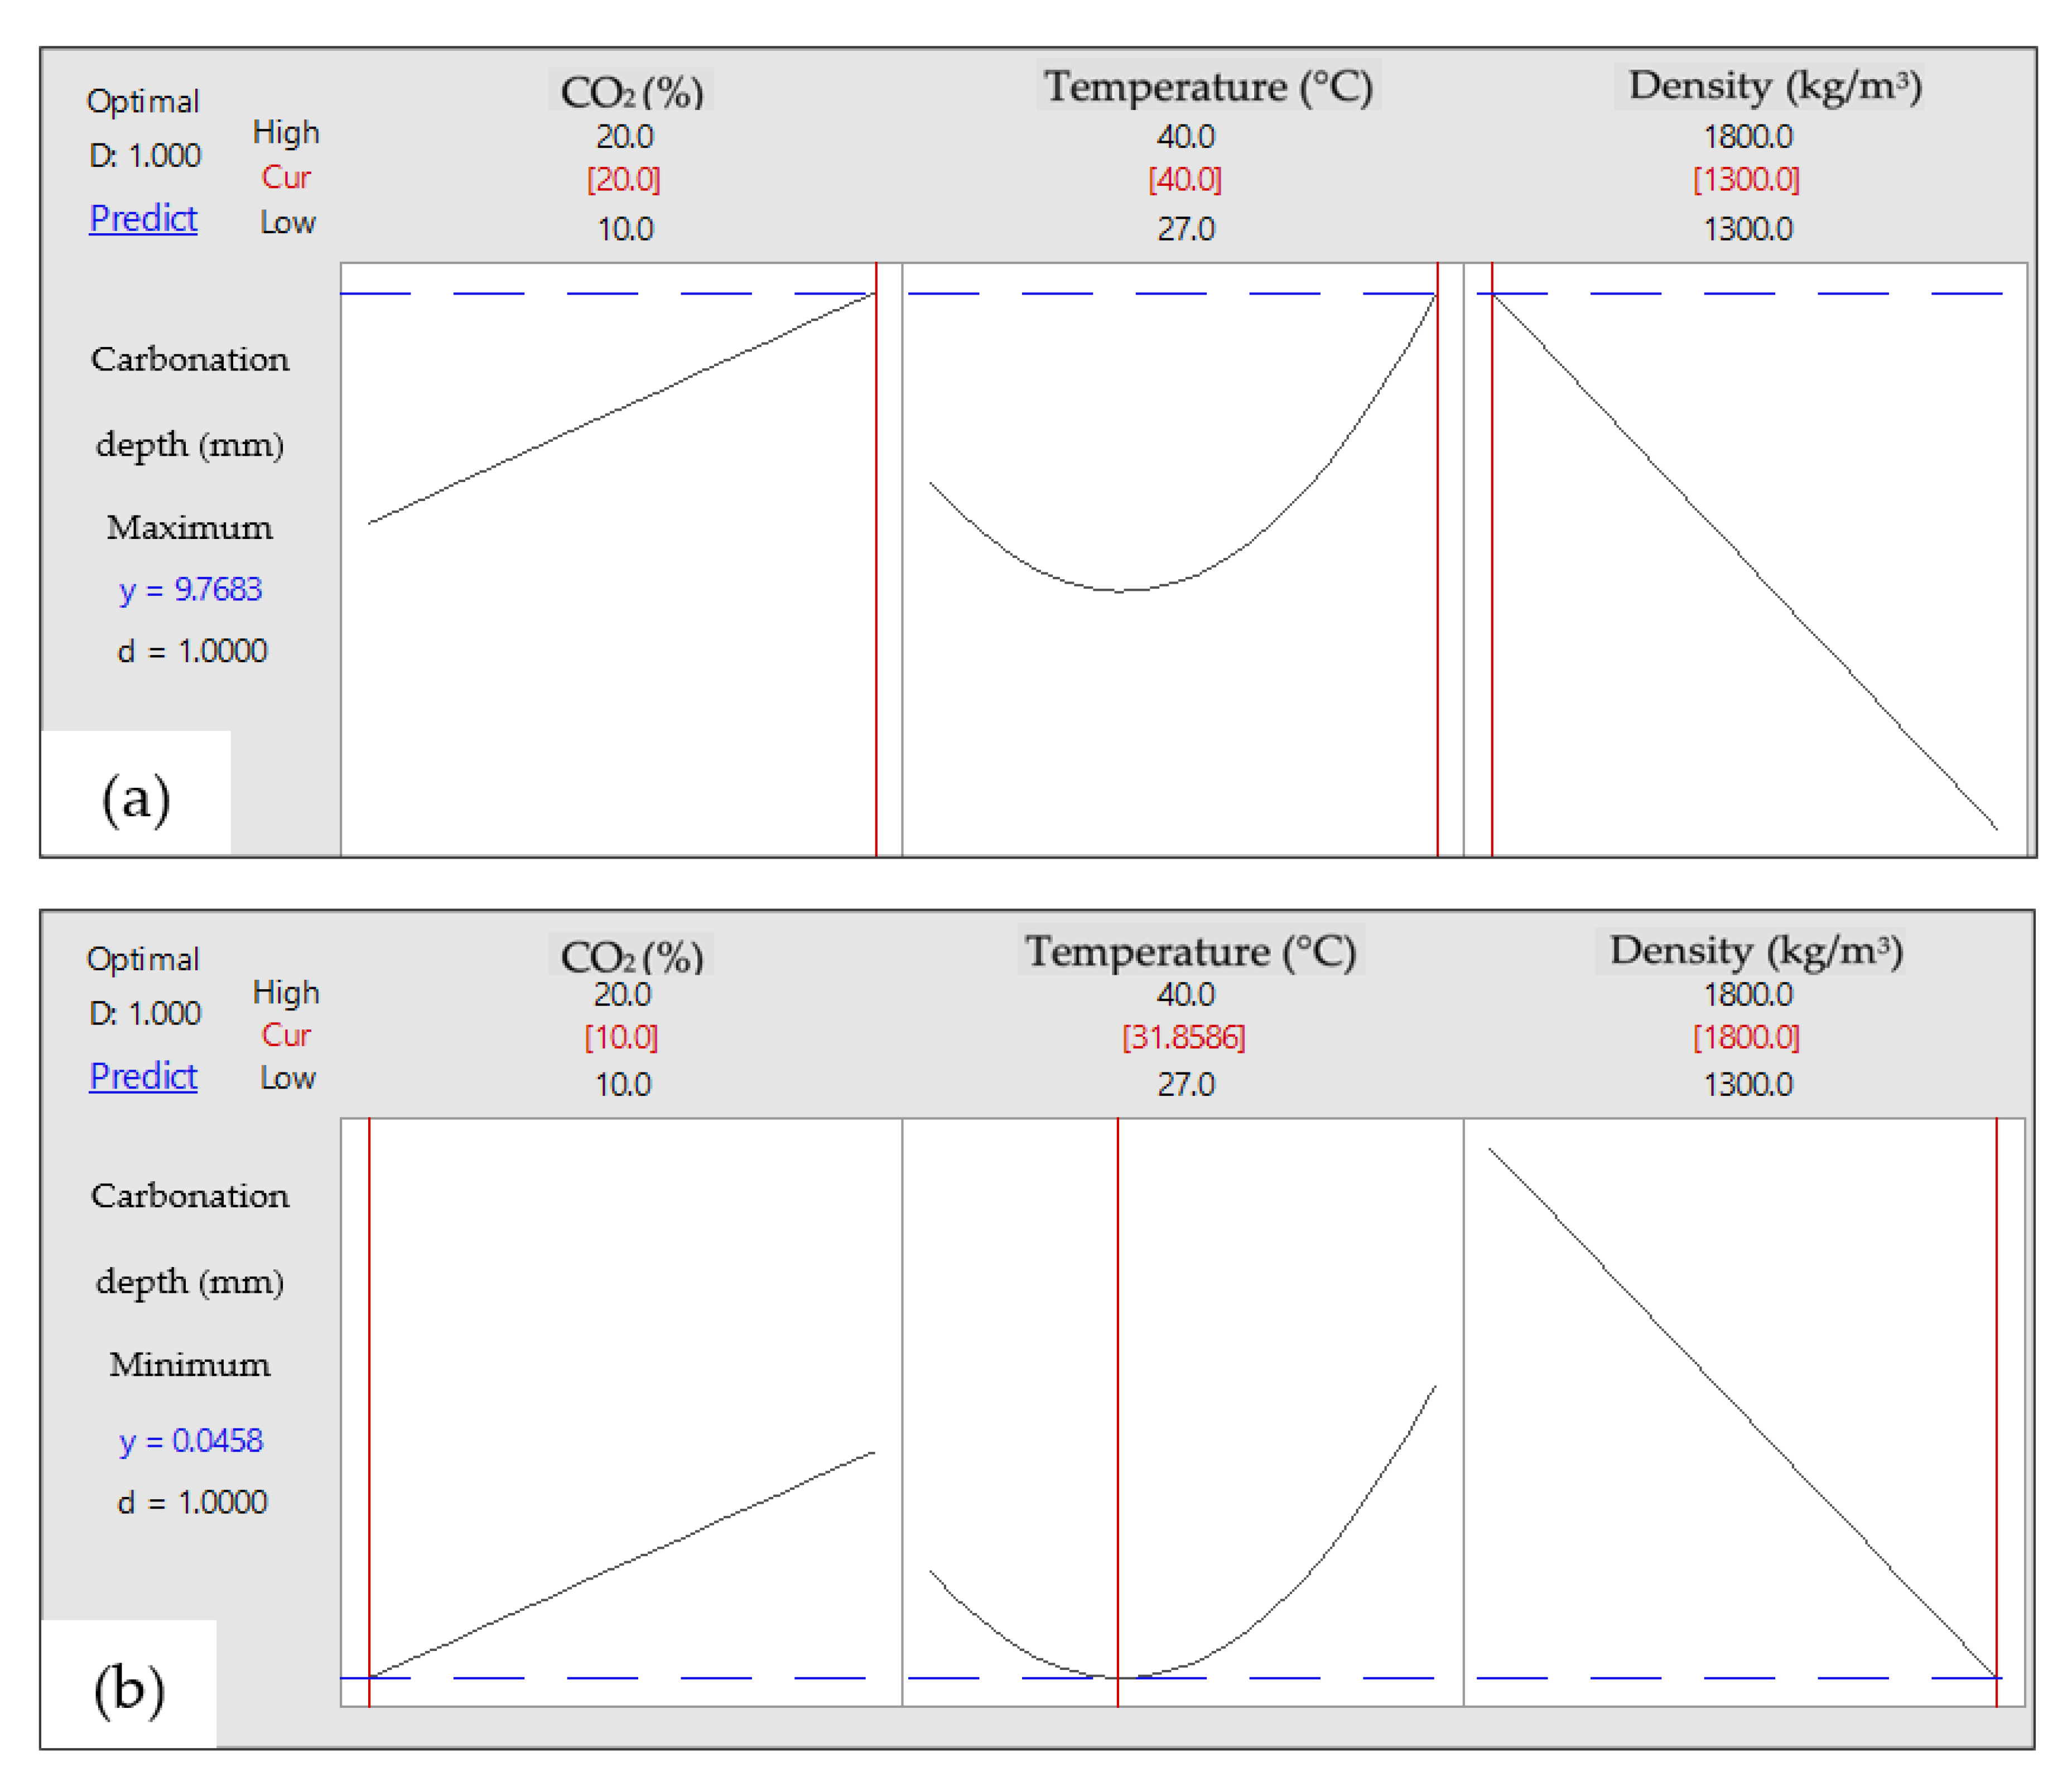
3.3.4. Optimum Conditions of Carbonation Depth of FCB

The optimisation plot shows how different experimental settings affect the predicted carbonation depth of FCB at two targets minimum and maximum carbonation depths as shown in Figure 11a,b. The best setting of each factor is represented by the red lines, while the dotted blue line represents the highest attainment of carbonation depth of FCB. Figure 11a,b show that the single desirability (d) for the maximum and minimum carbonation depth are 1.000 and the response (y) are 9.7683 mm and 0.0458 mm, respectively.
The increase in the CO2 concentration and temperature during the curing process increases the carbonation depth of FCB as percent in Figure 11a. Thus, the highest predicted carbonation depth of FCB was 9.7 mm, which occurred at 1300 kg/m3, 40 °C and 20% of CO2 concentration. The change on the factors values can make drastically change on the response value as presents in Figure 11b. The opposite trend was observed on the carbonation depth, whereby it decreased with decreasing of CO2 concentration and temperature along curing conditions and increasing density of FCB. Therefore, the lower predicted carbonation depth was 0.0458 mm at the following conditions 10% of CO2 concentration, 1800 kg/m3 of FCB density and 31.8 °C of temperature.

3.3.5. Development of Initial and Final Regression Equation

The initial regression equation was developed by 2k factorial method after the screening stage of the factors affecting carbonation depth in FCB, as shown in Equation (3). Thereafter, final regression equation in uncoded units was developed via RSM analysis after optimizing the carbonation depth of FCB as shown in Equation (4) [35].
Carbonation depth (mm) = 5.31 − 0.002 CO2 + 0.331 Temperature − 0.00365 Density+ 0.00754 CO2 * Temperature + 0.000085 CO2 * Density − 0.000154 Temperature
* Density − 0.000005 CO2 * Temperature * Density − 1.4875 Ct Pt
Carbonation depth (mm) = 57.9 + 0.2100 CO2 − 2.655 Temperature − 0.00980 Density + 0.0416 Temperature * Temperature
Both equations derived from the ANOVA results illustrates the relationship between significant variables and the response of carbonation depth. The accuracy of the regression equation was further justified through the ANOVA analysis and normal probability plot. The initial equation reflects the strong effect of the factors on carbonation depth of FCB through the significant effect of the interactions between the factors. This finding confirmed by the percentage of predicted R2 of carbonation depth, which was 99.84%. On the other hand, the predicted percentage R2 of the carbonation depth for final regression equation was 89.43%, which is considered significant. The predicted R2 for both equations indicates the prediction ability of the model is acceptable. Furthermore, the equations were indicated that all factors have a significant effect on the carbonation depth, which confirms the role of density and curing conditions on accelerating the sequestration of CO2 into FCB.

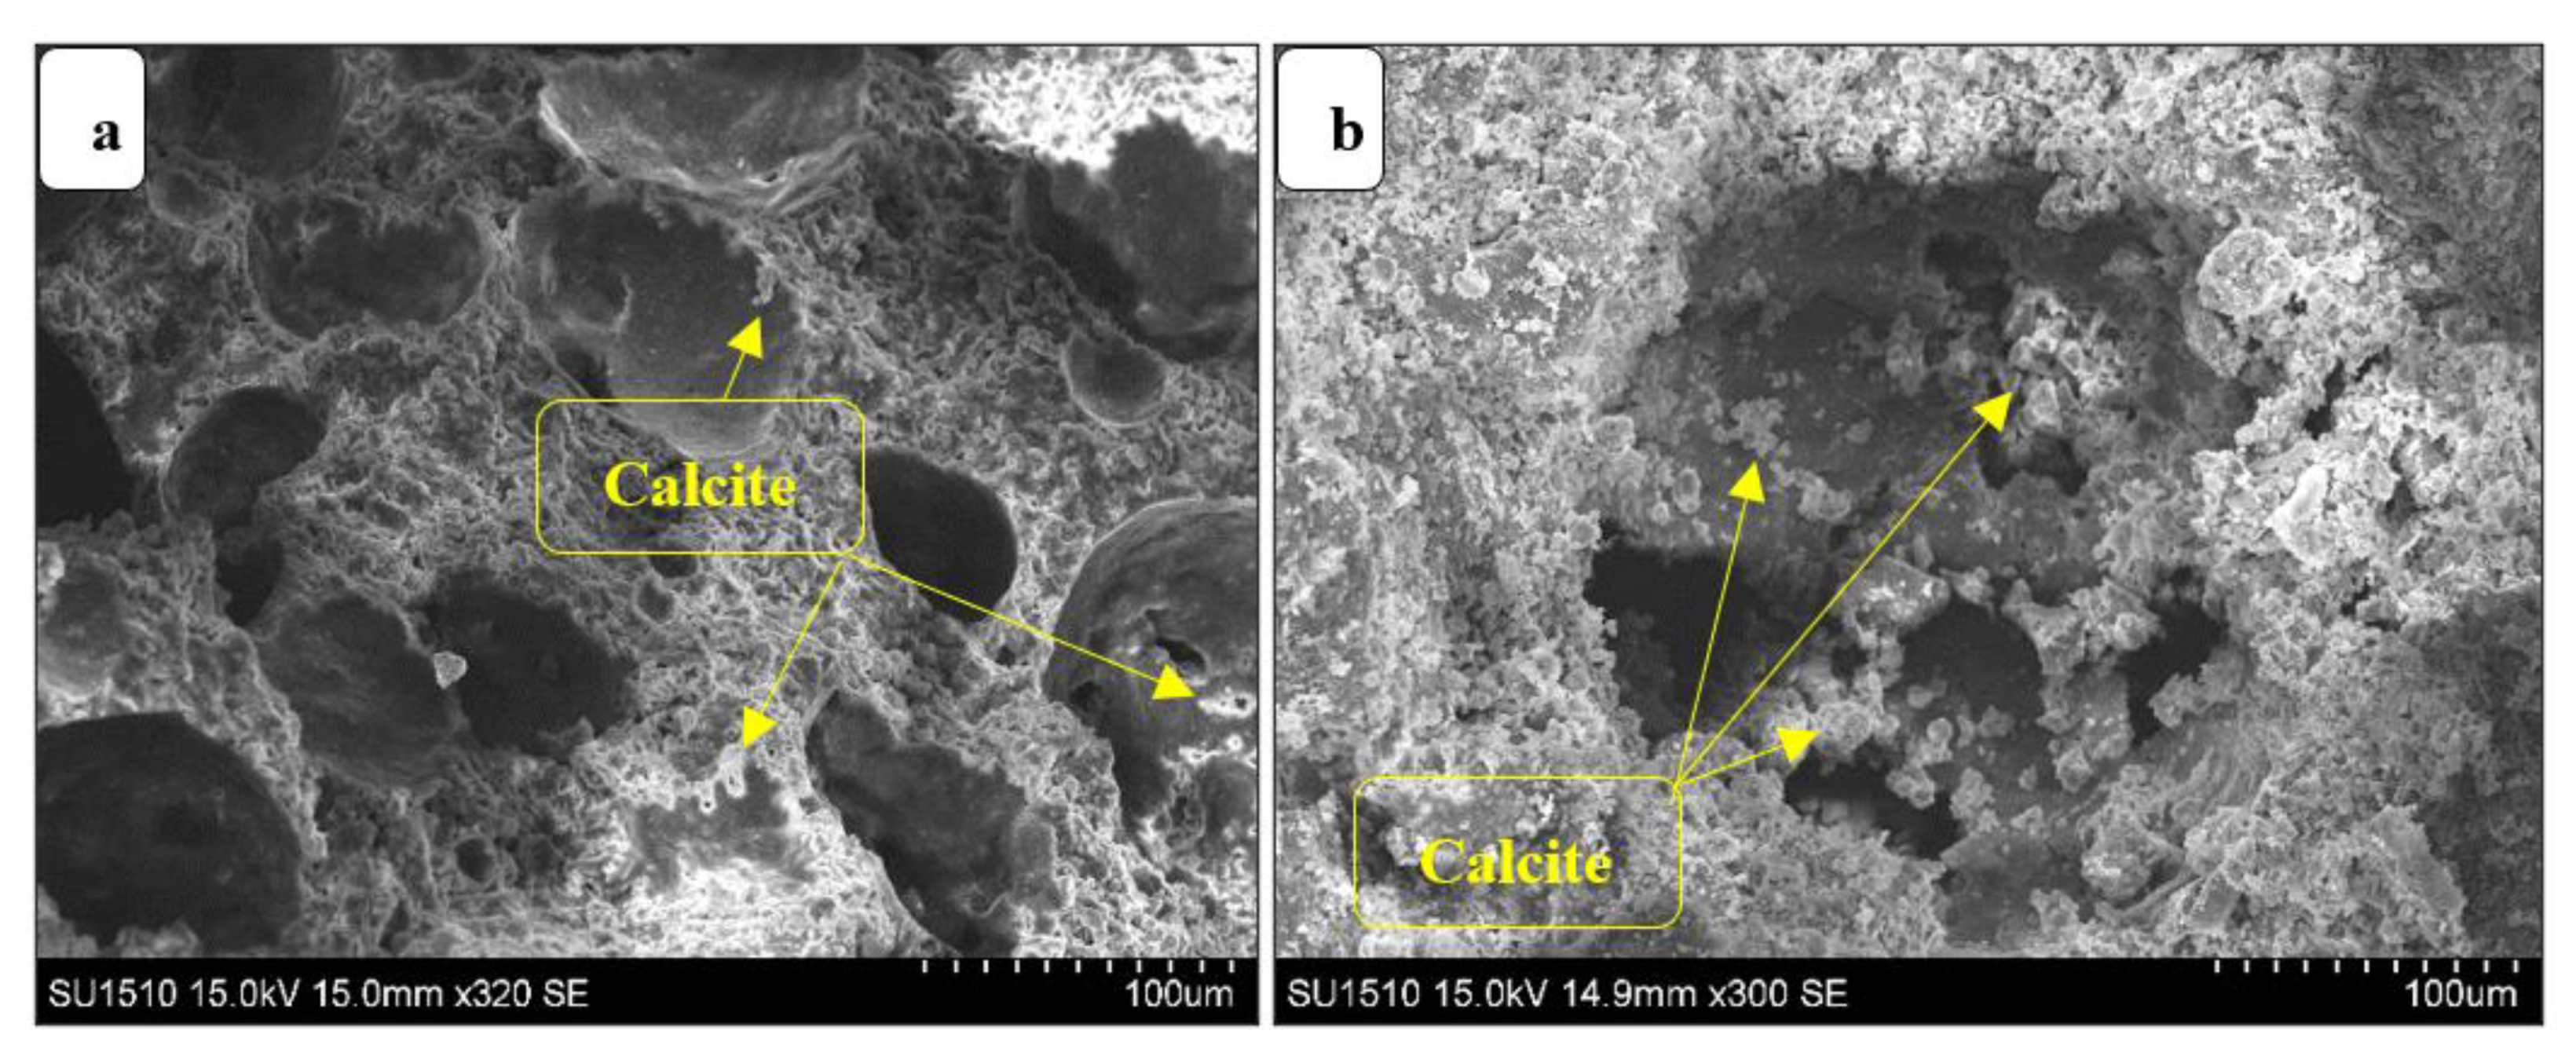
3.3.6. Microstructure Analysis (SEM)

SEM images were used to identify the morphology characteristic of FCB samples that are related to the density aspects and curing conditions. Images show, after 28 days of carbonation, the formation of calcite (CaCO3) in FCB, Figure 12a,b. The results revealed that a low level of calcite formation was represented in the specific surface area of carbonated FCB that cured at low temperature and CO2 concentration 27 °C and 10%, respectively, as shown in Figure 12a. In contrast, the increment of temperature and CO2 concentration to 40 °C and 20% were playing a vital role in the formation of calcite in FCB, as presented in Figure 12b. As expected, a great deal of hydration products mainly consisting of C-S-H formed via carbonation resulting healing of FCB pores [36]. However, the pores cannot be totally healed in 28 days due to the high level of porosity in the FCB, which has a low level of density compared to normal concrete bricks as demonstrate in SEM images. This finding confirmed the finding of the previous studies, the carbonation process is slow therefore, its takes time to heal the pores via precipitated CaCO3 [37,38]. Overall, the microstructural analysis of FCB confirms that the carbonation reaction has the ability to decrease the porosity by formation of CaCO3, which in turn increase with the increasing of temperature and CO2 concentration.

4. Conclusions

This study showed the use of 2k factorial and RSM as statistical analysis tools to optimize the carbonation depth of FCB. The optimization was carried out to investigate the effect of the parameters (density, temperature and CO2 concentration) on the carbonation depth of FCB. Based on the desirability optimization approach, the optimal carbonation depth was 9.7 mm, which was achieved with 1300 kg/m3, 40 °C and 20% CO2 concentration. The density of FCB is considered the most significant factor on the carbonation depth followed by CO2 concentration and temperature with the effective values −8.57, 3.67, and 3.01, respectively. In contrast, the minimum carbonation depth could be achieved when the density, temperature and CO2 concentration are at the following levels of 1800 kg/m3, 31.8 °C and 10% CO2 concentration, respectively. The significance of the factors used to accelerate the carbonation depth of FCB presents novel feedback. Notably, a single parameter may accelerate the carbonation depth, but to reach the optimum point, the other factors cannot be neglected. Therefore, the statistical analysis and optimization of the carbonation depth are required to sequester large quantities of CO2 into FCB.

Author Contributions

A.F.A.; conceptualization, data curation, formal analysis, resources, writing—original draft, funding acquisition, J.M.I.; conceptualization, supervision, validation, funding acquisition, project administration, writing—review and editing, H.A.T.; methodology, microstructure analysis, visualization, N.O.; data curation and review, A.A.A.-G.; investigation and software, S.S.; chamber fabrication, curing conditions, funding, W.A.H.A.; writing—review and editing and S.A.S.; data curation, investigation and analysis. All authors have read and agreed to the published version of the manuscript.

Funding

The research was funded by MDR (VOT No. H487), Fundamental Research Grant Scheme (FRGS/1/2019/WAB05/UTHM/02/1) and Universiti Sains Malaysia.

Institutional Review Board Statement

Not applicable.

Informed Consent Statement

Not applicable.

Data Availability Statement

The results of the study are not placed in any publicly archived datasets.

Acknowledgments

This research was supported by Universiti Tun Hussein Onn Malaysia through MDR (Vot H487) and Ministry of Higher Education (MOHE) Malaysia through Fundamental Research Grant Scheme (FRGS)(FRGS/1/2019/WAB05/UTHM/02/1). The research was also supported by Universiti Sains Malaysia.

Conflicts of Interest

The authors declare no conflict of interest.

References

  1. Narayanan, N.; Ramamurthy, K. Structure and properties of aerated concrete: A review. Cem. Concr. Compos. 2000, 22, 321–329. [Google Scholar] [CrossRef]
  2. Amran, Y.H.M.; Farzadnia, N.; Ali, A.A.A. Properties and applications of foamed concrete; A review. Constr. Build. Mater. 2015, 101, 990–1005. [Google Scholar] [CrossRef]
  3. Lim, S.K.; Tan, C.S.; Zhao, X.; Ling, T.C. Strength and toughness of lightweight foamed concrete with different sand grading. KSCE J. Civ. Eng. 2015, 19, 2191–2197. [Google Scholar] [CrossRef] [Green Version]
  4. Mindess, S. Developements in the Formulation and Reinforcement of Concrete; Woodhead Publishing: Sawston, UK, 2019; ISBN 9781845692636. [Google Scholar]
  5. Song, Y.; Li, B.; Yang, E.; Liu, Y.; Ding, T. Cement & Concrete Composites Feasibility study on utilization of municipal solid waste incineration bottom ash as aerating agent for the production of autoclaved aerated concrete. Cem. Concr. Compos. 2015, 56, 51–58. [Google Scholar]
  6. Costa, B.L.D.S.; Freitas, J.C.D.O.; Melo, D.M.D.A.; Araujo, R.G.D.S.; de Oliveira, Y.H.; Simão, C.A. Evaluation of density influence on resistance to carbonation process in oil well cement slurries. Constr. Build. Mater. 2019, 197, 331–338. [Google Scholar] [CrossRef]
  7. Kellouche, Y.; Boukhatem, B.; Ghrici, M.; Tagnit-Hamou, A. Exploring the major factors affecting fly-ash concrete carbonation using artificial neural network. Neural Comput. Appl. 2019, 31, 969–988. [Google Scholar] [CrossRef]
  8. Namsone, E.; Šahmenko, G.; Korjakins, A. Durability Properties of High Performance Foamed Concrete. Procedia Eng. 2017, 172, 760–767. [Google Scholar] [CrossRef]
  9. Jiang, J.; Lu, Z.; Niu, Y.; Li, J.; Zhang, Y. Study on the preparation and properties of high-porosity foamed concretes based on ordinary Portland cement. Mater. Des. 2016, 92, 949–959. [Google Scholar] [CrossRef]
  10. Wang, T.; Huang, H.; Hu, X.; Fang, M.; Luo, Z.; Guo, R. Accelerated mineral carbonation curing of cement paste for CO2 sequestration and enhanced properties of blended calcium silicate. Chem. Eng. J. 2017, 323, 320–329. [Google Scholar] [CrossRef]
  11. Zhang, D.; Shao, Y. Effect of early carbonation curing on chloride penetration and weathering carbonation in concrete. Constr. Build. Mater. 2016, 123, 516–526. [Google Scholar] [CrossRef]
  12. Ekolu, S.O. A review on effects of curing, sheltering, and CO2 concentration upon natural carbonation of concrete. Constr. Build. Mater. 2016, 127, 306–320. [Google Scholar] [CrossRef]
  13. Alshalif, A.F.; Irwan, J.M.; Othman, N.; Al-Gheethi, A.A.; Shamsudin, S. A systematic review on bio-sequestration of carbon dioxide in bio-concrete systems: A future direction. Eur. J. Environ. Civ. Eng. 2020, 1–20. [Google Scholar] [CrossRef]
  14. Yoon, I.S.; Çopuroǧlu, O.; Park, K.B. Effect of global climatic change on carbonation progress of concrete. Atmos. Environ. 2007, 41, 7274–7285. [Google Scholar] [CrossRef]
  15. Pacheco Torgal, F.; Miraldo, S.; Labrincha, J.A.; De Brito, J. An overview on concrete carbonation in the context of eco-efficient construction: Evaluation, use of SCMs and/or RAC. Constr. Build. Mater. 2012, 36, 141–150. [Google Scholar] [CrossRef] [Green Version]
  16. Lovato, P.S.; Possan, E.; Molin, D.C.C.D.; Masuero, Â.B.; Ribeiro, J.L.D. Modeling of mechanical properties and durability of recycled aggregate concretes. Constr. Build. Mater. 2012, 26, 437–447. [Google Scholar] [CrossRef]
  17. Drouet, E.; Poyet, S.; Le Bescop, P.; Torrenti, J.M.; Bourbon, X. Carbonation of hardened cement pastes: Influence of temperature. Cem. Concr. Res. 2019, 115, 445–459. [Google Scholar] [CrossRef] [Green Version]
  18. Liu, L.; Ha, J.; Hashida, T.; Letters, S.T. Development of a CO2 solidification method for recycling autoclaved lightweight concrete waste. J. Mater. Sci. Lett. 2001, 1791–1794. [Google Scholar] [CrossRef]
  19. Ji, L.; Yu, H.; Yu, B.; Zhang, R.; French, D.; Grigore, M.; Wang, X.; Chen, Z.; Zhao, S. Insights into Carbonation Kinetics of Fly Ash from Victorian Lignite for CO2 Sequestration. Energy Fuels 2018, 32, 4569–4578. [Google Scholar] [CrossRef]
  20. Muthu Kumar, E.; Ramamurthy, K. Effect of fineness and dosage of aluminium powder on the properties of moist-cured aerated concrete. Constr. Build. Mater. 2015, 95, 486–496. [Google Scholar] [CrossRef]
  21. Kumar, R.; Lakhani, R.; Tomar, P. A Simple Novel Mix Design Method and Properties Assessment of Foamed Concretes with Limestone Slurry Waste; Elsevier B.V.: Amsterdam, The Netherlands, 2018; Volume 171, ISBN 9113322834. [Google Scholar] [CrossRef]
  22. Alshalif, A.F.; Irwan, J.M.; Tajarudin, H.A.; Othman, N.; Al-Gheethi, A.A.; Shamsudin, S.; Altowayti, W.A.H.; Abo Sabah, S. Optimization of Bio-Foamed Concrete Brick Strength via Bacteria Based Self-Healing and Bio-Sequestration of CO2. Materials 2021, 14, 4575. [Google Scholar] [CrossRef]
  23. Chen, B.; Wu, Z.; Liu, N. Experimental Research on Properties of High-Strength Foamed Concrete. J. Mater. Civ. Eng. 2012, 24, 113–118. [Google Scholar] [CrossRef]
  24. Zambrano Leal, A. Sociedad de control y profesión docente. Las imposturas de un discurso y la exigencia de una nueva realidad. Antimicrob. Agents Chemother. 2012, 95, 45–52. [Google Scholar] [CrossRef]
  25. Panesar, D.K. Cellular concrete properties and the effect of synthetic and protein foaming agents. Constr. Build. Mater. 2013, 44, 575–584. [Google Scholar] [CrossRef]
  26. Possan, E.; Thomaz, W.A.; Aleandri, G.A.; Felix, E.F.; dos Santos, A.C.P. CO2 uptake potential due to concrete carbonation: A case study. Case Stud. Constr. Mater. 2017, 6, 147–161. [Google Scholar] [CrossRef]
  27. Lo, T.Y.; Nadeem, A.; Tang, W.C.P.; Yu, P.C. The effect of high temperature curing on the strength and carbonation of pozzolanic structural lightweight concretes. Constr. Build. Mater. 2009, 23, 1306–1310. [Google Scholar] [CrossRef]
  28. Chang, C.F.; Chen, J.W. The experimental investigation of concrete carbonation depth. Cem. Concr. Res. 2006, 36, 1760–1767. [Google Scholar] [CrossRef]
  29. De Ceukelaire, L.; Van Nieuwenburg, D. Accelerated carbonation of a blast-furnace cement concrete. Cem. Concr. Res. 1993, 23, 442–452. [Google Scholar] [CrossRef]
  30. Meima, J.A.; Comans, R.N.J. Geochemical modelling of weathering reactions in MSWI bottom ash. Environ. Sci. Technol. 1997, 31, 1269–1276. [Google Scholar] [CrossRef]
  31. Villain, G.; Thiery, M.; Platret, G. Measurement methods of carbonation profiles in concrete: Thermogravimetry, chemical analysis and gammadensimetry. Cem. Concr. Res. 2007, 37, 1182–1192. [Google Scholar] [CrossRef]
  32. Shamsudin, S.; Lajis, M.A.; Zhong, Z.W.; Ahmad, A.; Wagiman, A. Weld strength in solid–state recycling of aluminum chips: Schweißnahtfestigkeit im Festkörper-Recycling von Aluminium-Spänen. Mater. Werkst. 2017, 48, 290–298. [Google Scholar] [CrossRef]
  33. Biglarijoo, N.; Nili, M.; Hosseinian, S.M.; Razmara, M.; Ahmadi, S.; Razmara, P. Modelling and optimisation of concrete containing recycled concrete aggregate and waste glass. Mag. Concr. Res. 2017, 69, 306–316. [Google Scholar] [CrossRef]
  34. Yang, K.-H.; Seo, E.-A.; Tae, S.-H. Carbonation and CO2 uptake of concrete. Environ. Impact Assess. Rev. 2014, 46, 43–52. [Google Scholar] [CrossRef]
  35. Talebi, A.; Razali, Y.S.; Ismail, N.; Rafatullah, M.; Azan Tajarudin, H. Selective adsorption and recovery of volatile fatty acids from fermented landfill leachate by activated carbon process. Sci. Total Environ. 2020, 707, 134533. [Google Scholar] [CrossRef]
  36. Qin, L.; Gao, X. Recycling of waste autoclaved aerated concrete powder in Portland cement by accelerated carbonation. Waste Manag. 2019, 89, 254–264. [Google Scholar] [CrossRef]
  37. Sharma, D.; Goyal, S. Accelerated carbonation curing of cement mortars containing cement kiln dust: An effective way of CO2 sequestration and carbon footprint reduction. J. Clean. Prod. 2018, 192, 844–854. [Google Scholar] [CrossRef]
  38. Branch, J.L.; Kosson, D.S.; Garrabrants, A.C.; He, P.J. The impact of carbonation on the microstructure and solubility of major constituents in microconcrete materials with varying alkalinities due to fly ash replacement of ordinary Portland cement. Cem. Concr. Res. 2016, 89, 297–309. [Google Scholar] [CrossRef] [Green Version]
Figure 1. Grading curve of river sand.
Sustainability 13 10999 g001
Figure 2. Inverted slump test.
Sustainability 13 10999 g002
Figure 3. Specimens preparation.
Sustainability 13 10999 g003
Figure 4. Setup of the carbonation curing in the chamber.
Sustainability 13 10999 g004
Figure 5. Spread diameter of inverted slump of foamed concrete.
Sustainability 13 10999 g005
Figure 6. Carbonation depth of FCB (a) with 1300 kg/m3 (b) with 1550 kg/m3 (c) with 1800 kg/m3 after 28 days.
Sustainability 13 10999 g006
Figure 7. Carbonation depth of FCB in (mm) after 28 days.
Sustainability 13 10999 g007
Figure 8. Residual plots of carbonation depth of FCB after 28 days.
Sustainability 13 10999 g008
Figure 9. Pareto chart of the standardized effects at a 95% confidence interval on carbonation of FCB (a) before removing non-significant terms, and (b) after removing non-significant terms.
Sustainability 13 10999 g009
Figure 10. Contour plots for carbonation depth of FCB; (a) between temperature and CO2 concentration, and (b) between density and CO2 concentration.
Sustainability 13 10999 g010
Figure 11. Optimization plot of FCB at 28 days (a) at the maximum target of carbonation depth, and (b) at the minimum target of carbonation depth.
Sustainability 13 10999 g011
Figure 12. SEM images. (a) FCB specimens at 27 °C of temperature and 10% of CO2 concentration. (b) FCB specimens at 40 °C of temperature and 20% of CO2 concentration.
Sustainability 13 10999 g012
Table 1. Chemical composition of cement.
Chemical CompoundSiO2Al2O3Fe2O3SO3K2OCaOMgO
Concentration (%)20.65.44.22.20.664.82.2
Table 2. Mix proportions of foamed concrete by 2k factorial and RSM designs.
Run
No.
Density
(kg/m3)
Cement
(kg/m3)
Fine Sand
(kg/m3)
Water
(L/m3)
T
(°C)
CO2
(%)
11300553.2746.8276.627.010
21300553.2746.8276.627.020
31300553.2746.8276.640.010
41300553.2746.8276.640.020
51800766103438327.010
61800766103438327.020
71800766103438340.010
81800766103438340.020
91550659.5890.4329.733.515
101550659.5890.4329.733.515
111550659.5890.4329.733.515
121550659.5890.4329.733.510
131550659.5890.4329.733.520
141550659.5890.4329.727.015
151550659.5890.4329.740.015
161300553.2746.8276.633.515
171800766103438333.515
181550659.5890.4329.733.515
191550659.5890.4329.733.515
Table 3. ANOVA analysis of the complete RSM design.
SourceDFAdj SSAdj MSF-Valuep-ValueEffect
Model589.83217.96622.0000.000-
Blocks12.8802.8803.5300.083-
Linear378.44626.14832.0200.000-
CO2111.02511.02513.5000.0033.670
Temperature17.3967.3969.0600.0103.010
Density160.02560.02573.4900.000−8.570
Square111.37111.37113.9200.0033.730
Temperature * Temperature111.37111.37113.9200.0033.670
Error1310.6180.816---
Lack-of-Fit1010.5781.05779.3300.002-
Pure Error30.0400.013---
Total18100.449----
Publisher’s Note: MDPI stays neutral with regard to jurisdictional claims in published maps and institutional affiliations.

