1. Introduction
There is a generalized awareness of the huge impact that information and communications technologies (ICT) are having on our societies. In fact, the emergence of ICT is often considered as a major revolution, implying a paradigm shift in the ways in which humans interact (consume, produce, communicate, etc.), paralleling some of the transformative innovations of the past two centuries, such as the steam and electric engines [
1]. As with those previous revolutions, there was an adaptation period in which the effects of a game-changing revolution were not obvious. The late 1980s witnessed some debates regarding the effects on ICT on the general economy, summarized by the Solow productivity paradox [
2], raising doubts about the real effects of ICT investments on productivity, competitive advantage, and profitability [
3]. However, that period has already passed, and now there is a consensus that the ubiquitous internet revolution mediates most socioeconomic relations [
4].
Tourism is an information-intensive activity [
5,
6]. Hence, it is not surprising that a revolution related to information has redefined most elements of this industry. In fact, the separation of tourism and ICT is becoming increasingly difficult [
7,
8]. As technology is gradually integrated into our daily lives, it can be characterized as an additional sense used for interpreting our context—a sixth digital sense [
9] mediating our perceptions of the world. For the past 20 years [
10,
11,
12], a new body of literature has emerged analysing the multiple ways in which the ICT revolution impacts on the three stages into which [
13] tourism experiences can be divided—namely, pre-trip, the stay at the destination, and post-trip.
The effects of ICT on tourist experiences at the destination [
14] have been exacerbated by the popularisation of connected mobile devices (smartphones, PDAs, etc.), which allow for what is referred to as “always on” status [
15]. Today, it seems difficult to believe that the pervasive presence of these mobile devices is a recent trend. However, technical articles illustrating the potential of smartphones’ generalisation appeared only a decade ago [
16,
17].
Regarding ICT and its relationship to tourism, today, most visitors travel with their physical devices and their virtual digital profile. These are used to access information, interact with service providers and other tourists at the destination, make en-route decisions, maintain their virtual self on social media, etc., [
18,
19,
20].
Academic research has soundly studied the effects of this real-time access to information [
12,
21], and the myriad of new software developments (apps, guides, recommender systems, etc.) that it has brought about [
22,
23,
24,
25,
26]. In many of these analyses, fulltime connectivity is taken for granted. This might be appropriate in many highly populated cities; however, this assumption becomes more doubtful when tourists move through broader destinations and beyond urban areas. Moreover, fulltime connectivity is becoming particularly relevant in light of the increasing individualism in tourism. It is worth mentioning that the current COVID-19 pandemic has only exacerbated the previous trend of a higher proportion of visitors who want to explore their destinations by themselves [
27,
28].
The public authorities and destination management organizations (DMOs) are responsible for providing digital services to their visitors. They must organize the destination’s digital data, facilitate ICT access, and offer adequate communication capabilities to the visitors so that they can interact with their digital profiles. In this sense, the level of ICT infrastructure is the first step to meeting the challenge of becoming a smart destination [
29,
30,
31]. There are clear advantages if tourists can access communication capabilities through their own devices, as this eliminates barriers to adaptation and language problems, while also reducing the services’ risks (damage to devices, etc.). Naturally, this requires appropriate access to networks that cover the territory of the destination.
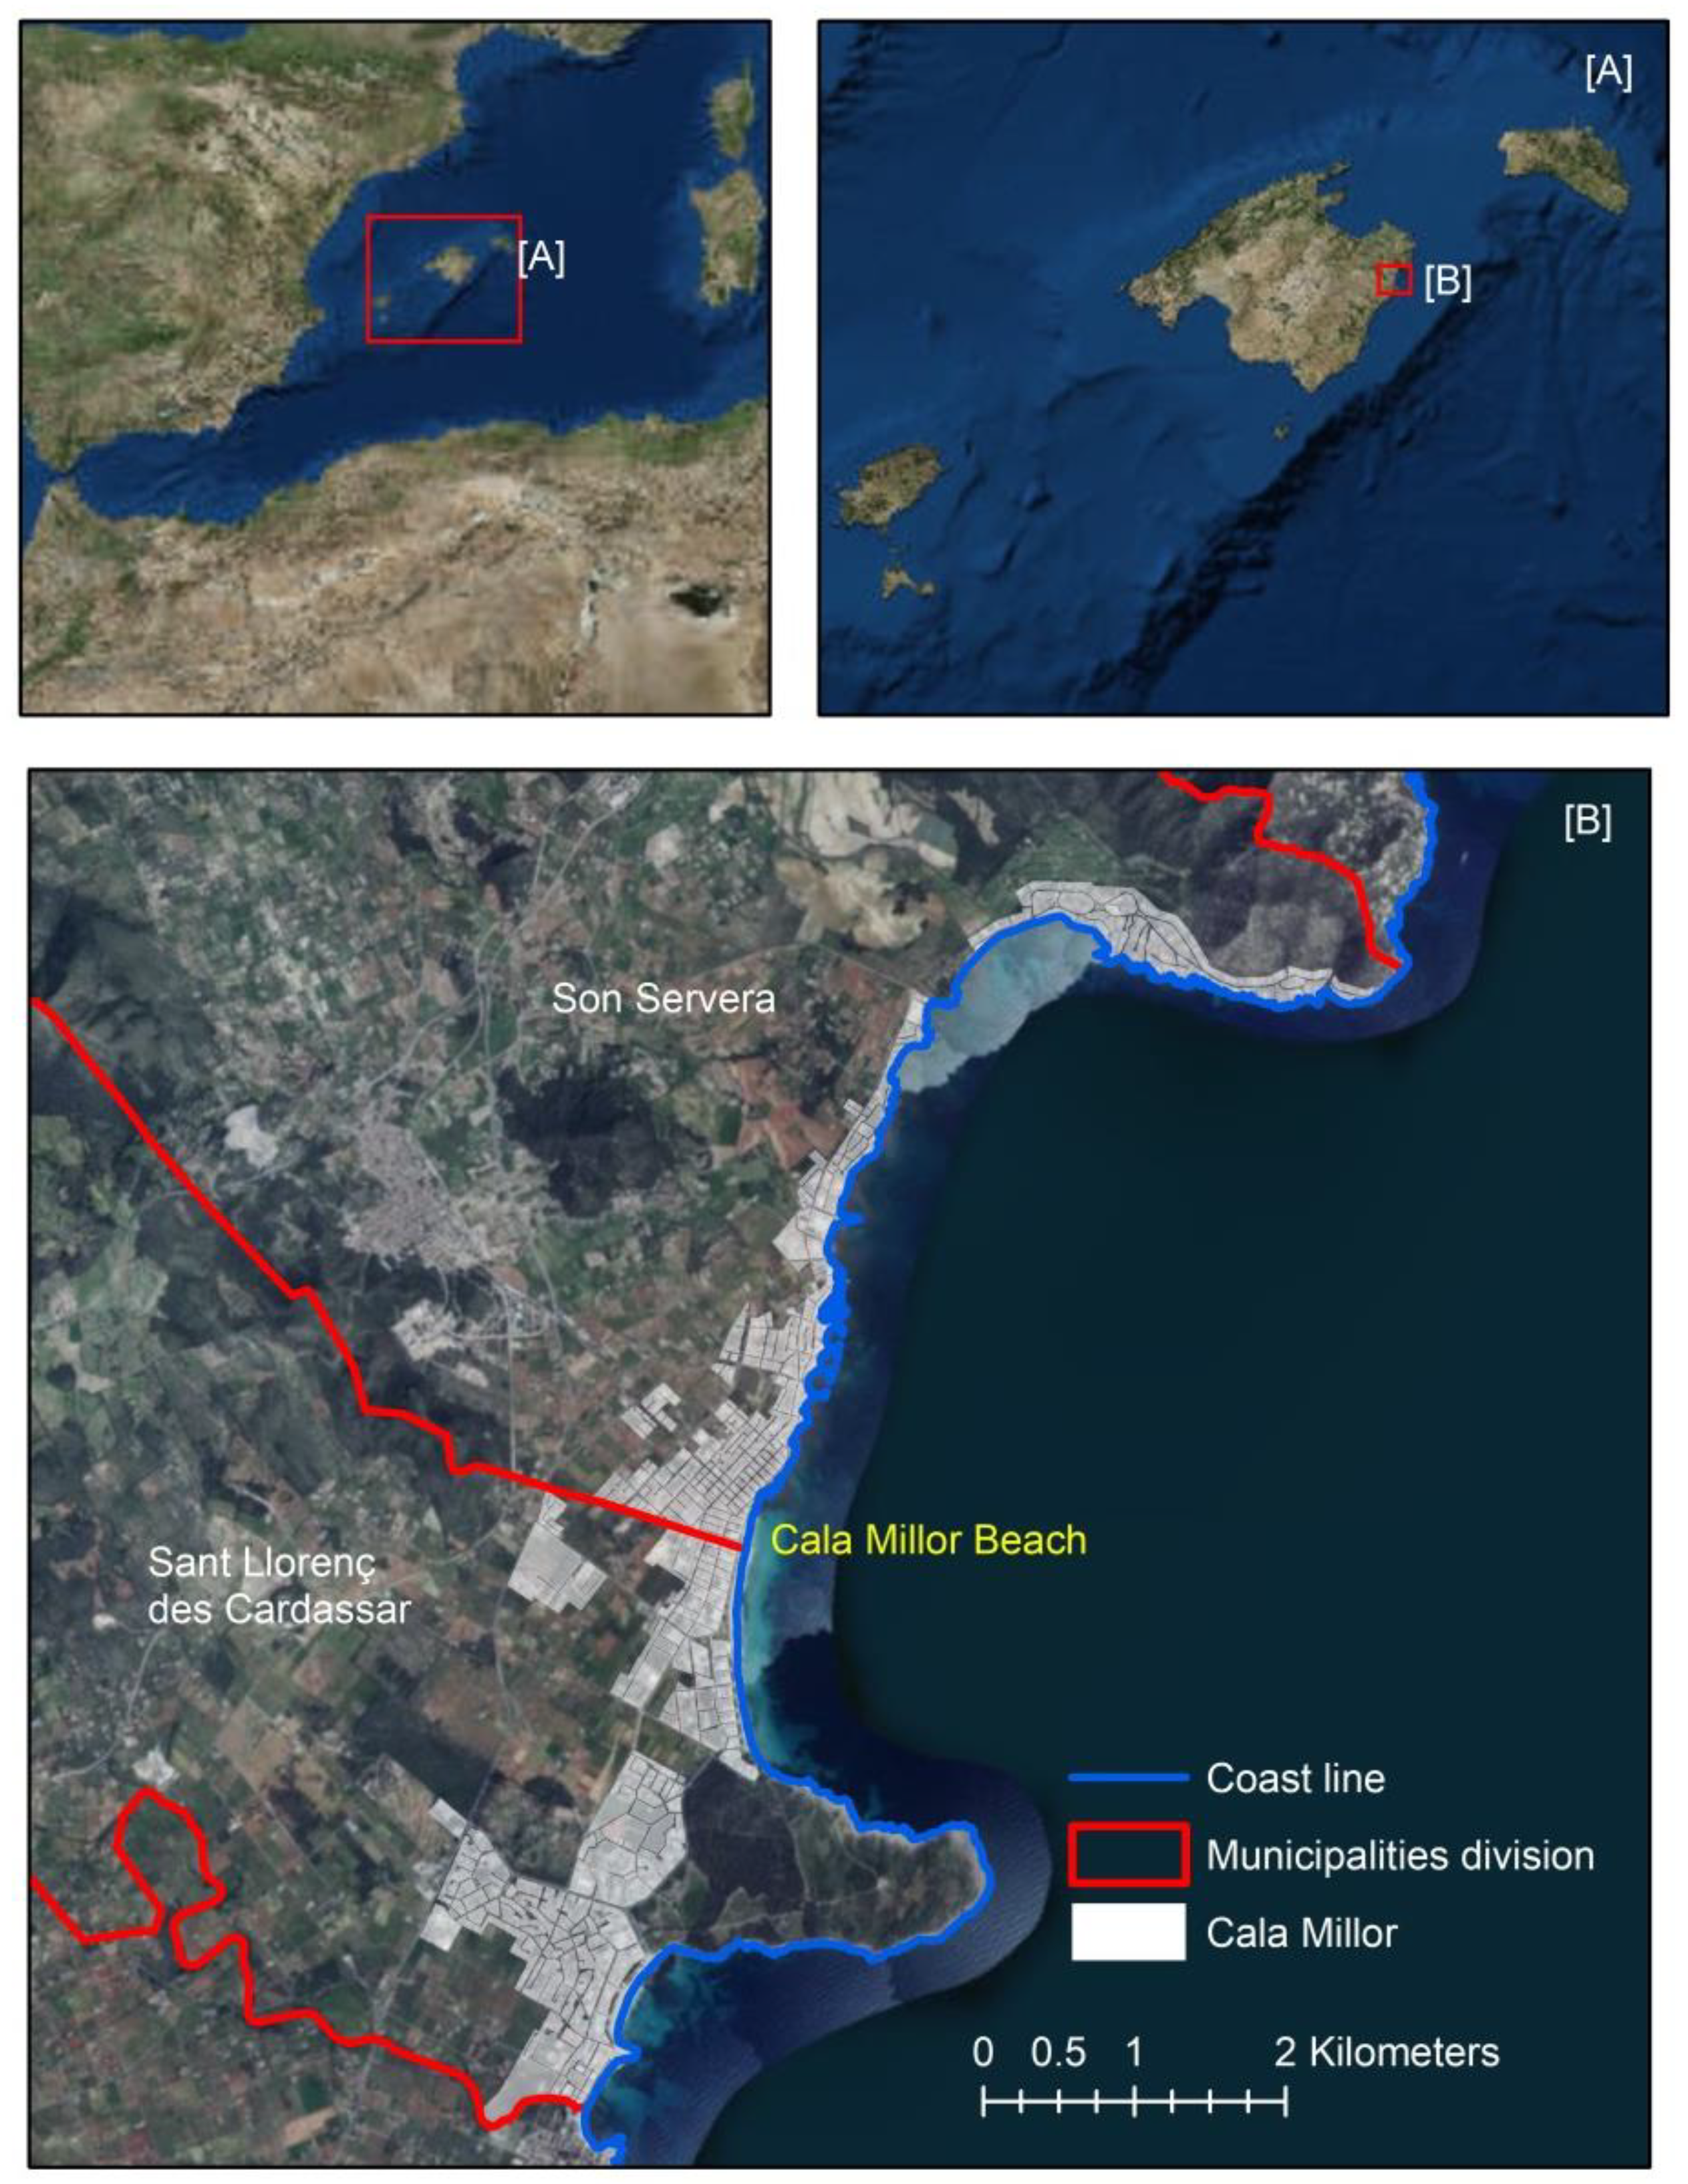
In this context, the purpose of this paper is to contribute to the scarcely researched topic of digital accessibility, incorporating a spatial approach. The geographical dimension of the study determines the type of tool, the diagnostic scope, and the specific policy implications to be derived, especially given that different public institutions might have specific competencies for each geographical dimension. For example, some general responsibilities might be attributed to regional governments, while municipalities might play a relevant role at the local level. For this reason, we considered two geographical dimensions: a regional and a local approach. First, the paper proposes and tests a digital immersion index (DII) for assessing the level of digital communications readiness of all tourism destinations’ municipalities. We focus on the Balearic Islands (panel A in
Figure 1)—a major tourism destination in the south of Europe, which received more than 13.6 million international tourists in 2019 [
32]. Subsequently, the local analysis elaborates and presents several spatial correlational analyses (Moran’s indices) for a specific location: Cala Millor (panel B in
Figure 1). This is an appropriate tourism destination for the analysis because, with 35,000 beds, it ranks as the third-highest destination in the archipelago in terms of hotel capacity [
33]. Moreover, it has an innovative and active DMO (Consorcio de Turismo de Son Servera y Sant Llorenç des Cardassar), which is a public and private partnership aiming at the promotion of tourism at the destination. The usefulness of spatial correlation for improving our understanding of tourism phenomena has been consistently proven in the academic literature [
34,
35]. We used ArcMap (10.4) and the geospatial package GeoDa for the calculations and the cartographic representation of results through their integration in a geographical information system (GIS).
Finally, we elaborate on the implications and applicability of our results to improve destination management. In this sense, using a mature destination allowed for the introduction of the analysis of the effect that ICT readiness can have on some tourism policies. Particularly, this paper elaborates on how the geographical analysis of ICT deployment might help policymakers in their decisions on infrastructural investments. In this context, a common policy objective [
36] is to extend the tourism season through actions aimed at increasing arrivals in the mid-season. This implies going beyond the mature and well-established sun and sand products, and generally involves a higher proportion of individual tourists with more mobility through the destination. The success of such policies is likely to be affected by the degree of ICT readiness throughout the territory. Hence, the present paper identifies the municipalities in which there are investment requirements. Once such endowment gaps are identified, the location of this infrastructure at the municipality level can be optimized by the proposed analyses of spatial correlation at specific destinations.
The rest of the paper is organized as follows: The following section summarizes the background used in the paper, focusing on the relationship between tourism and ICT. Then, the sources of information and the spatial analysis methodologies are described in
Section 3. Thereafter, we present the results for both the regional and local levels. The paper finishes by presenting the concluding remarks.
2. Literature Review
As [
8] exposes in its 2008 revision of the eTourism literature, the academic interest in the effects of ICT on tourism started in the early 1990s, and accelerated in the following years. By the end of the decade, pioneering books had established the foundations for understanding the ways in which tourism is affected by technology [
37,
38]. Those early analyses already anticipated the tremendous impact of the generalisation of ITC on the tourism industry, and on visitors’ behaviour at destinations [
5,
13]. The authors of [
39] present an envisioning description of how technological developments could help to solve conventional problems faced by tourists (what to do; when, when and how to get there; how to share the experiences, etc.). A great deal has been covered since then, and many of those ideas are now common.
The literature on eTourism covers a very broad range of topics, from production and distribution to consumption and experience sharing. This background analysis focuses mainly on the relationship between ICT and tourist behaviour at the destination. Technology is often considered to mediate tourism experiences [
7,
12], as it increasingly participates in the relationship between tourists and destinations. The authors of [
21] relate this issue to the co-creation of tourism experiences, proposing the concept of “technology-enhanced destination experiences”. Hence, following [
40]’s typologies, the human–technology interactions in tourism can be classified as hybrid. In this approach, technology forms part of the human system to interpret the world. ICT goes beyond being a tool to achieve an objective, as some human needs and desires would not exist without the technology. A good tourism-based example is the role of digital recommender systems that define the route to explore a destination.
Getting closer to the precise objective of this paper, the recent generalisation of mobile devices has had an enormous impact on the way tourists visit destinations. The authors of [
12,
17] present an overview of the opportunities presented by smartphones for tourism, derived from the combination of easy access to information, portability, and local tracking. Interestingly, these devices are blurring the conventional time–space division of the stages of tourism [
6]. The relevance of planning in the pre-trip stage is being reduced, as geopositioning and real-time applications identify the activities around the visitor, and provide suggestions for its enjoyment. This is what [
41] accurately describes as “a change from sit and search to roam and receive”. Moreover, sharing is often done in real time at the destination through social media [
19], or by what is known as moblogging—using the mobile device to post new entries in blogs [
42,
43].
The existence of smartphones has also fostered the development of software with a huge impact on tourism, from the well-known review portals to digital mobile guides, or recommender systems that combine information with visitors’ location and preferences [
22,
24,
26].
Most of the above analysis emphasizes the relevance of real-time connectivity. The author of [
24] already noted the limitations of wireless networks as an obstacle for mobile usage environments. However, as far as the authors of this paper are aware, there is scarce quantitative research on the actual level of ICT readiness at destinations, which is precisely the aim of this paper.
Going beyond the effects of ICT on tourist behaviour, this paper follows the academic literature to define the destination as the appropriate dimension of analysis. The heterogeneous and composite nature of tourism is better analysed if destinations are taken as the “production units” [
44], in which different products and services conjointly provide the product that is consumed by the visitor—namely, the tourism experience [
45]. Today, destinations need to adapt their management and communication to the ICT revolution [
13], and they are responsible for providing the level of advanced technical services that their visitors require [
7].
Finally, ICT does not only work as a one-direction flow of information to improve visitor experiences. The new digital environment should be understood as a means of multilateral communication. Smart destinations can capture and analyse valuable data to improve the understanding and segmentation of their visitors [
11,
29,
46]. In fact, the current trend of big data analysis to generate market intelligence [
47,
48] is associated with the readiness of communication capabilities covering the destination’s entire territory.
3. Data and Methods
3.1. Data Sources
We start by defining the variables that we used to measure communication capabilities. In this sense, the first challenge was the absence of unified and complete information on communication infrastructure (CI). A complete dataset covering CI’s spatial distribution and description was essential to evaluate the potential geographical imbalances, and to extract conclusions and recommendations.
We considered the Wi-Fi access points that can be used by tourists of all nationalities as our indicator of CI. Hence, this included all open Wi-Fi, as well as the networks offered as complementary tourist services. Two different sources of data related to CI were combined to generate a comprehensive geopositioned database. The first set of data uses WiGLE (WiGLE, 2021)—an infrastructure-tracking application that locates and classifies Wi-Fi networks. A research team covered the territory of the Balearic Islands (a total of 2147 Km) before 2020, identifying and positioning more than 400,000 networks. A second source of data is “IslaWifi”—a database that identifies the presence of public Wi-Fi networks.
The combination of these two sets of information was used to create a complete database. Then, any CI that could not be used to create a tourism connectivity network was excluded for the purposes of this paper. Therefore, we removed the networks with a hidden service set identifier (SSID), as they are not accessible for tourist purposes, as well as SSIDs containing default names that telecommunication providers usually assign to private networks. In addition, all duplicities and GPS data errors were eliminated. After the filtering process, the database had a total of 96,464 networks that could potentially be used for tourism purposes.
3.2. Digital Immersion Index
We propose the following digital immersion index (DII) to measure the level of communication capabilities of all of the municipalities. As Equation (1) indicates, the DII adjusts the number of CIs by the accommodation capacity of the municipality. In our empirical application, we used the total number of hotel beds in the denominator of Equation (1). This information was gathered from the official tourism statistics of the Balearic Islands, providing detailed and credible geopositioned data of all of the hotel beds (for each category) at each municipality.
As happens in any destination, not all municipalities in the Balearic Islands have a tourist orientation. In fact, the regional government defines 21 municipalities that are considered as touristic. The comparison between these municipalities is more illustrative, as they are specialized in this activity. To take this fact into account, we also propose an adjusted digital immersion index (ADII) using only those municipalities. Moreover, we used a more precise indicator of real tourism intensity. The denominator measures the number of occupied beds in the municipality (instead of the total number of beds). These data are also provided by the official tourism statistics of the Balearic Islands. For the 21 touristic municipalities, there are data on the number of available beds and their percentage of occupancy.
3.3. Spatial Analysis at the Local Level
The second part of our spatial analysis is scaled to a local destination level (Cala Millor). Therefore, it requires a higher level of geographical detail and more precise tools to study the spatial correlation at the destination level. We started the local analysis of technological and tourist infrastructure by superimposing a grid of 200 × 200 meters cells over the destination area. For each of them, we quantified the number of Wi-Fi networks and hotel beds.
This descriptive information is complemented by a spatial autocorrelation analysis. In particular, Moran’s global indicator (global indicator of spatial autocorrelation) and the Moran’s local indicator (local indicator of spatial association) were computed for the destination. The main argument that underpins the study of spatial autocorrelation is the first law of geography, expressed by Tobler as “Everything is related to everything else, but near things are more related than distant things” [
49]. Luc Anselin supported this statement in his definition of spatial dependence: the existence of a functional relationship between what happens at one point in space and what happens elsewhere [
50,
51,
52,
53].
(a) Spatial Autocorrelation Analysis
This method analyses whether there is any pattern in the distribution of some variables throughout the territory. Therefore, it indicates the degree to which a measurable fact in a particular location is similar to what happens in the surrounding space. Spatial dependence occurs when the value of a given variable in a spatial unit is partially dependent on the value of the same variable in neighbouring units. Three types of pattern can be identified: grouped, dispersed, or random.
Moran’s index [
50] analyses the global autocorrelation according to the following expression:
where N is the total number of spatial units; the summations are indexed for each unit (i) and the other units (j); X is the variable of interest,
is the mean of X, and w
ij is an element of a spatial weight’s matrix.
Moran’s Index can take values between −1 (perfect dispersion) and +1 (perfect correlation). Note that a value equal to zero would indicate a random spatial distribution, while the expected value under the null hypothesis of no spatial autocorrelation is:
Spatial autocorrelation is subject to spatial heterogeneity, which recognizes a specific contribution of each point to the general autocorrelation. This possibility is evaluated by the local indicator of spatial association:
where
is the variance, z represents the deviations of the mean
,
is the value of the variable in another location, and
represents the elements of the weight matrix.
Moran’s local analysis gives rise to a scatterplot [
53,
54,
55] that presents the relationships between the values of the variables in a location and the mean values of their environment. The resulting quadrants categorise the relationship between a given spatial unit and its neighbours. Quadrant I (upper right) indicates a high (H) value of the variable surrounded by H values; the observations in Quadrant II (upper left) would have an H value of the variable surrounded by low (L) values; Quadrant III corresponds to L-L; Quadrant IV gathers the L–H observations.
In order to go deeper into the analysis of the combined spatial distribution of two variables, the bivariate local Moran analysis relates the values of a variable in relation to the variation of the second variable in its environment.
(b) K-Means Clustering
Elaborating on the previous analyses, this method categorizes each cell depending on the balance between the two endowments (hotel beds and Wi-Fi networks). The results are incorporated into easily interpretable maps, which can optimise the decision about where to invest in ICT infrastructure throughout the destination.
Given a set of observations (x1, x2, x3, …, Xn), where each observation is a real vector of d dimensions, k-means constructs a partition of the observations in k sets (k ≤ n), in order to minimise the sum of the squares within each group:
The k-means method refers to the process of assigning each individual to one of the prefixed k groups with the nearest centroid. The grouping method takes into account the distance between the points. In this regard, the Euclidean distance between points is considered as the criterion for group selection:
where d is the distance from point x to the centroid c.
4. Results
4.1. Digital Economy Readiness at the Regional Level
The first part of the analysis was performed at the regional level, covering all of the Balearic Islands’ territory. The complete database with all of the CI classified by municipality was gathered in a GIS to illustrate the destination’s territorial analysis, as depicted in
Figure 2. The figure represents the four islands: Menorca (north), and moving south: Mallorca, Ibiza, and the smaller Formentera.
The municipal distribution of CI in Menorca is quite uniform. However, clear differences are seen between the east part of the island (the capital Maó) and the nearest municipalities. Ibiza presents more variability; the highest concentration is located near the main cities of the island (Ibiza capital, Sant Antoni de Portmany, and Sant Francesc). The low density in the northeast of Ibiza is explained by its mountainous topography.
Finally, Mallorca can be divided into five zones: Palma, Calvia, and Andratx (west); Pollença and Alcudia bays (northeast); south; mountainous north; and the middle area. The areas with more tourism specialisation display a higher density of CI.
These results identify the density of CI that could be used for tourism purposes throughout the territory. However, the distribution of the tourism infrastructure is very uneven throughout the destination.
Figure 3 presents the DII distribution defined in Equation (1) as the number of CIs per 10 hotel beds available at the municipality.
The areas of the map depicted in white correspond to municipalities for which there were some missing data. In terms of interpretation, higher DII values (green) indicate higher network availability per hotel bed. On the other hand, lower DII values (red) indicate municipalities for which the digital immersion level is weak. In this sense, the DII normalizes the digital connectivity of the territory, considering tourist accommodation infrastructure in the same area. Therefore, those municipalities with a low DII value must be analysed in detail. Lower DII values are observed in municipalities located in mountainous regions (e.g., the northern and eastern parts of Mallorca, and the north of Ibiza), and in municipalities with lower tourist orientation (e.g., the central area in Mallorca). For Menorca, a fairly homogeneous DII distribution is observed for all municipalities, indicating a good balance between CI and available hotel beds.
A policy implication of
Figure 3 is that it identifies the municipalities with low communication capabilities compared with other areas of the same island. A minimum threshold for the DII parameter can be established from each island—for instance, considering the average value. This index can be used to identify the necessity of increasing digital investment in those territories.
However, it is necessary to incorporate other social considerations that moderate the implications of DII values. The index is defined considering the tourism infrastructure; however, not all municipalities have a clear tourist orientation; hence, we adjusted the index (ADDI) to focus only on tourist municipalities. Moreover, we incorporate a more precise tourism intensity indicator (number of occupied beds instead of total beds).
Additionally, in
Figure 4 we propose an alternative means of presenting the results to illustrate the versatility of GISs for visualizing the results in an easily interpretable way. In this figure, we used the standard deviation of the index, instead of the absolute value, to generate the maps. The advantage of this proposal is that it allows for a clear identification of those municipalities below and above the average ADII.
Note that
Figure 4 displays only the tourist municipalities for which there is information on the number of occupied beds in the considered period (the rest are depicted in white). Hence, this figure depicts municipalities for which tourism is a relevant activity. A positive value of the standard deviation (green and blue) was found for 6 of the 18 areas; this indicates which municipalities are above the average SADII. Therefore, the other 67% of the Balearic Islands’ tourist zones should consider the improvement of their digital capabilities. It is reasonable to assume that low provision of ICT infrastructure is a competitive disadvantage, penalizing an area’s attractiveness—at least for certain tourist profiles [
56].
4.2. Spatial Analysis at the Local Level
Once we have completed the analysis at the regional level, we move to the more detailed local analysis.
Figure 5 displays the spatial distribution of ICT and tourism infrastructure through the territory of the local destination (Cala Millor). The maps indicate that there is a massive grouping of ICT infrastructure (Panel a) around the coastal zone. The areas located further north correspond to the oldest coastal development, with greater residential use, leading to a lower provision of public Wi-Fi networks. The spatial distribution of hotel beds (panel b) also shows a significant concentration, although to a lesser degree than the distribution of Wi-Fi networks.
Elaborating on the data,
Figure 6 presents the scatterplot of the Moran’s index for ICT and tourism infrastructure. The results show that there is a pattern of territorial grouping for both ICT (0.39) and tourism (0.19) at the destination. Note that a value closer to 1 indicates a higher level of grouping. Panel a presents a significant concentration and grouping of values in Quadrant III, which shows a high frequency of areas with limited Wi-Fi provision. Panel b displays remarkable concentrations in Quadrants I and II. Note that the latter would correspond to spatial units with low density of hotel beds surrounded by cells with high density. Interestingly, in both panels, the relation is stronger in Quadrant I, where the cloud corresponds to cells with a high–high endowment.
Figure 7 shows the local Moran’s index for each variable, as defined in Equation (4). Regarding ICT infrastructure, there is a marked concentration of Wi-Fi infrastructure in the coastal zone (high-density units surrounded by areas of high density). The figure clearly illustrates the barrier effect caused by a natural area (Punta de N’Amer), whose empty space breaks the continuity of the Wi-Fi networks endowment. The insights derived from
Figure 7 for the case of tourism infrastructure parallel those of ICT infrastructure. The graph shows a concentration of H–H values in the coastal zone, as well as a punctual rupture derived from the natural area. Interestingly, there are no relevant low–low spatial units, mainly because the coverage level is very heterogeneous in most areas.
The analysis of bivariate spatial autocorrelation between the provision of Wi-Fi networks and tourist accommodation infrastructure is particularly interesting for understanding the destinations’ balance.
Figure 8 shows an important spatial correspondence between both variables.
There is a concentration of H–H values in the coastal areas, which are preferred tourist areas. Likewise, there are also areas with low ICT and tourism infrastructure endowments (L–L). These are mainly found in the perimeter areas of the tourist destination, which correspond to peri-urban areas. This reflects a model of concentration of networks and services in the nuclei of the tourist areas, which leads to imbalances in the most peripheral areas. Of particular interest to tourism planers are the low Wi-Fi–high accommodation areas, depicted in light blue, which correspond to tourist areas with deficiencies in Wi-Fi coverage. Finally, some spatial units are indicated as high Wi-Fi–low accommodation—those correspond to areas that are far from hotels, in which Wi-Fi coverage is mostly provided by the complementary supply (shops, restaurants, etc.).
Finally,
Figure 9 aims at providing a usable planning tool that relates ICT and tourist endowment. A model of territorial grouping (k-means) was used to categorize each spatial unit in one of four possible groups: Zone 1 gathers the areas with a higher imbalance in Wi-Fi coverage related to tourist capacity; in this sense, they should be prioritized as soon as the DMO can afford investments in ICT infrastructure. Zones 2 and 3 are areas of balance between the Wi-Fi equipment and the number of beds. It should be noted that Zone 2 presents a slight excess of coverage, while Zone 3 shows a slight deficit. Finally, Zone 4 corresponds to areas with little touristic importance, where no significant deficits are observed.
5. Conclusions
Many areas of human activity have experienced remarkable changes since the generalisation of information and communications technologies (ICT). Tourism is no exception—it has been completely redefined by the exponential growth of information access and data management capacity derived from faster computing capacity and internet access. In recent years, the generalisation of mobile devices that combine portability, positioning, and wireless communication has revolutionised the way in which visitors plan, interact, and share their tourism experiences. Tourism academia has devoted considerable efforts to disentangling the challenges and implications of this new digital context. Traditionally, destinations focused on providing high-quality services for tourists’ physical presence. Now, leading destinations have also realised the need to consider their visitors’ digital profiles, as they mediate all stages of tourism, from the initial destination choice to the sharing of the experiences.
In this context, where ICT is recognized as being crucial for enhancing visitors’ experiences, it is striking that little attention has been devoted to examining whether destinations are able to provide fulltime connectivity throughout their territory. In other words, the spatial destinations’ digital communications readiness is rarely considered.
All of the above lead to the identification of some relevant questions for tourism destinations, such as: What is the real level of fulltime connectivity across the territory? Are there significant differences in the deployment of communication infrastructure capabilities? How can we provide a measure of ICT readiness? Finally, how can we present the information so that it can be easily incorporated into policy decision making?
To answer some of the above questions this paper proposes a two-scale spatial analysis. First, we propose a more comprehensive regional approach that defines and applies several modifications of a digital immersion index (DII). The proposed DII spatially relates the level of communication infrastructure with tourism infrastructure and intensity. Second, a closer destination approach that uses different variations of the Moran’s indices to consider the spatial correlation of ICT and tourism endowment.
The empirical application was conducted for the Balearic Islands, Spain. The first contribution of this paper was the creation of a holistic database including geopositioned information of all Wi-Fi infrastructure that could be used to create a tourist digital network. We used this dataset to compute the DII, which ranks all of the municipalities considering their level of communications capability related to tourism infrastructure. However, as not all municipalities in the Balearic Islands are specialised in tourism services, we also provide an adjusted digital immersion index that considers the tourism intensity. Hence, the tourist municipalities can be ranked in relation to their capacity to provide digital services to their visitors. The results are visualized through GIS maps. In terms of applicability, the proposed approach identifies the municipalities with low levels of digital communications readiness.
The previous regional analysis indicates the locations in which specific investments are required. However, when the decision is transferred to the local level, it requires more fine-grained analysis. In this sense, the second part of the paper focused on a local destination—Cala Millor, the third highest ranking destination of the Balearic Islands in terms of hotel beds. This narrower approach consisted of defining spatial units of 200 × 200 m, for which we quantified both the ICT and accommodation infrastructure. GIS maps were also used to visualize the current situation of both variables throughout the territory of the destination. Thereafter, we computed and presented both global and local Moran’s indices. These methods evaluate the spatial correlation of each of the cells, considering the two variables of interest. Moreover, we used k-means clustering to characterise each unit considering the relationship between tourism and ICT development. These analyses can be integrated into DMOs’ tourism planning tools in order to prioritise and locate investments.
Beyond investment decision making, the uneven distribution of digital capabilities affects several aspects of tourism destination management. For example, there is a current trend (emphasized by COVID-19) toward more independent tourists with higher levels of e-service usage. Connected tourists are more likely to share their experiences, contributing to a positive image of the destination that breaks with conventional stereotypes. In addition, this can lead to security improvements, as visitors can be informed about relevant events. Similarly, a breakthrough in the deployment of smart tourism destination policies is increasingly on the agenda of both public and private agents. These aspects, among many others, are just some examples of how adequate telecommunications infrastructure can play a crucial role in implementing services related to the digital economy.
To conclude, it is worth mentioning future lines of study that might expand our research. In this paper, we used hotel beds as an indicator of tourism activity. However, there are potential refinements of this indicator that might provide informative analysis—for example, considering further segmentations such as category, type of tourism product, tourism rental houses, etc. Additionally, it might be informative to extend the analysis to other variables, including attractions, or tourism complementary supply. Finally, it must be recognized that ICT coverage is a very dynamic variable. Hence, we recommend a periodic monitoring of the available infrastructure at the destinations.


