Abstract
Sustainability development is a core issue in autonomous regions’ construction and development. The paper evaluated the sustainability development of the five autonomous regions in Western China from 2010 to 2019. In order to further analyze the sustainable development level of the autonomous regions, it is compared with the three provinces with the largest GDP in Central China in the past three years, and similarly, with the three provinces in Eastern China. A new weighting method was proposed by combining the grey relational analysis (GRA) and set pair analysis (SPA) methods that not only analyze the correlation between indicators and ideal points but also analyze the status and development trend. The method can ensure the objectivity of indicator weight. Firstly, the ideal reference point is determined by the grey correlation degree between the indicator and the ideal positive point. Secondly, the indicator and the ideal reference point constitute a set pair system, and the relation number is used further to analyze the status and development trend of the indicator to determine the weight objectively. The sustainability results showed that the progress of the autonomous regions’ sustainable development in China was increased slowly in 2010–2019. For example, Ningxia and Xinjiang saw the slowest growth. The prime reason is that economic sustainability has declined severely. Although Inner Mongolia presented the highest increasing trends, the growth rate value was 0.75%. In contrast, other autonomous regions showed a negative growth trend. Regarding sustainable development in three dimensions, the economic sustainability performance of autonomous regions is not ideal, but the environmental sustainability performance is the most ideal. This conclusion implicates the necessity and urgency of improving the coordinated development of the three dimensions of autonomous regions in China.
1. Introduction
China is a unified multi-ethnic country with 55 ethnic minorities and five autonomous regions. The population of ethnic minorities accounts for 8.5% of China’s total population, and the area of autonomous regions accounts for 45.7% of China’s total territory. Autonomous regions (there are five autonomous regions in China) and provinces (there are 23 provinces in China) have the same administrative level, but autonomous regions are pretty different from provinces. First, autonomous regions have more administrative authority to exercise ethnic autonomy than provinces. Secondly, the autonomous regions can enjoy many preferential policies related to ethnic minorities, such as economic subsidy policies for ethnic minorities and extra points for ethnic minority students in the college entrance examination. Finally, the autonomous regions are agglomerations for large minority populations. The system of regional ethnic autonomy is a fundamental political system of China and the cornerstone of ethnic unity in China. The Law of the People’s Republic of China on Regional Ethnic Autonomy was enacted at the 89th Executive meeting of The State Council on 11 May 2005. Every five years or so, the Chinese government has issued autonomous regions development planning-related policies [1,2]. In December 2016, the Communist Party of China (CPC) Central Committee and State Council jointly launched a critical policy document entitled “Plan for Promoting the Development of Minority Areas and Ethnic Groups with Small Populations during the 13th Five-Year Plan Period” [3]. The plan underlined that accelerating the sustainability development of ethnic minorities and national regions becomes a more prominent strategic position to supplement ethnic minorities and national regions [4]. Premier Li Keqiang, in a report on the work of the Government on 5 March 2021, pointed out that we must uphold and improve the system of regional ethnic autonomy, fully implement the party’s policy on ethnic groups, and encourage all ethnic groups to work together for shared prosperity and development [5].
A widely accepted definition of sustainability [6] is “development that meets the needs of the present without compromising the ability of future generations to meet their own needs”. Sustainability is the product of the development of human society, and it is a hot issue widely concerned by scholars and researchers [7,8,9,10,11,12,13,14,15]. A practical evaluation of sustainability is essential as it provides a valuable framework for better decision-making [16]. Despite various methods and tools developed to measure sustainability, indicators are one of the approaches most used [17]. In these approaches, selecting appropriate indicators (criteria) is a critical factor that may significantly influence the evaluation of sustainable performance. In practice, the three pillars model [18,19,20] (social, economic, and environmental) is a widely used method.
The sustainability evaluation process can be regarded as a multi-criteria decision making (MCDM) problem due to the complexity of the criteria. MCDM is an important technique that presents a systematic approach for helping decision-makers measure sustainability [21]. The basic MCDM process generally involves collecting relevant criteria data, normalizing actual data, weighting, and aggregating [22]. Among these steps, all steps are essential for the quality of the final evaluation performance. The weighting and aggregation steps seem to have a more significant impact [23]. Various weighting methods are used for calculating criteria weights. Such as, Chen et al., proposed the TOPSIS-based order relation method to measure and rank the innovation capability of cities in Liaoning province from the year 2012 to 2016 [24]. Li et al., developed an objective coupling weighting method to combine the coupling analysis and the sequential relationship analysis method [25]. Yi et al., proposed a sustainability-oriented sequential relationship analysis method to allocate more weight to the indicator with a higher sustainable level [26]. The GRA (grey relation analysis) has been a widely applied weighting method [27]. GRA is a quantitative method to analyze the correlation degree among various factors, and it is helpful to reduce the subjectivity in the process of setting the criteria [28]. The basic logic of the method is to calculate the geometric similarity of two variables. The more similar the shape, the higher degree of association between the two variables [29]. Li et al., used GRA to analyze the correlation between the indicators to determine indicator weight [30]. Chang et al., proposed a weighting approach where GRA was used to lower repetitiveness and the ordered weighting [31]. Chan et al., used GRA to propose the multi-criteria weighted average in the decision-making process [32].
The GRA for solving complicated interrelationships between multiple factors and variables is a widely used method in MCDM for aggregating multiple criteria and ranking various alternatives. Many studies used GRA as the essential tool for sustainability measurement at different scales, such as international regions, countries, and cities. For example, Alptekin et al., used GRA to evaluate the low carbon development of European Union Countries and Turkey [33]. Altintas et al., proposed an extended GRA to develop a new composite index for comparing the overall energy sustainability performances of 35 OECD member countries [34]. Kose et al., graded Turkey’s six most famous cities using GRA to reduce uncertainty in the evaluation process [35]. Tang et al., ranked the sustainability level of cities in China using GRA to reduce the uncertainty existing in the process of evaluation [28]. Abid et al., analyzed the relations among governance indicators, ISO 14001, and green growth in Pakistan utilized mathematical GRA to capture the relations among the studied variables [36]. Zhang et al., used GRA to evaluate Beijing’s low-carbon sustainable development capability, Shanghai, Shenzhen, and Guangzhou in China [37].
The set pair analysis (SPA) is a novel uncertainty theory proposed by Zhao [38]. The core of this theory is using a connection degree formula to consider certainties and uncertainties as a certain-uncertain system and to depict uniformly all kinds of uncertainties such as random uncertainty, fuzzy uncertainty, indeterminate-known uncertainty, unknown and unexpected incident uncertainty, and uncertainty that results from imperfective information [39,40,41]. SPA has been applied to many sustainability fields, such as decision-making and comprehensive evaluation. For example, Wang et al., used SPA to evaluate the sustainability of Nanfen open-pit areas from 1995–2007 and demonstrates that the method is an excellent comprehensive assessment method for sustainability in mining areas [42]. Wang et al., analyzed the coordination ability in Yanchi County since it implemented the grazing prohibition policy by SPA, and the results indicate that Yanchi County was essentially in the second grade of the national sustainable development level [43]. Luan et al., employed SPA to handle the uncertain relations in the evaluation system and calculate sustainable agricultural development in the middle reach of the Heihe River [44].
In addition, investigating dynamic sustainability is an interesting topic in the literature. The research results could provide a reference for understanding the sustainability level and its dynamic state. Many studies were developed to investigate sustainability at different scales in various years [24,25,26,45]. For example, Zhou et al., obtained objective weight with behavioral guidance by dynamic data analysis to investigate the sustainability performances of 14 Liaoning cities in China from the year 2014 to 2018 [46]. Xu et al., achieved a comprehensive development evaluation via the data of economic growth, social construction, and environmental protection in Jiangsu province from 2002 to 2017, analyzing the current situations and problems [47]. Cui et al., attempted to use URECDI to analyze the sustainability of urbanization for 13 cities in the Jing-Jin-Ji region from 2005 to 2015 [48]. Li et al., focused on the degree of coordination between urbanization and the environment was established using panel data collected from 2000 to 2008 for Lianyungang, China [49]. However, for most studies, the weights of criteria are usually determined by combined subjective and objective weighting methods. The evaluation result or the decision has a strong subjective arbitrariness, increasing the decision maker’s decision burden, and the workload has a substantial limitation in the application. For example, AHP establishes the hierarchy model subjectively in weighting, making the subjective factors significantly influence the whole process [50]. However, they did not consider the overall trend performances on a specific criterion across different years. Under these considerations, this paper extended the GRA weighting method and SPA to a dynamic situation and developed a dynamic GRA-SPA method. GRA analyzed the correlation degree between indicators and positive ideal points in the grey system, and it is helpful to reduce the subjectivity generated in the process of setting the criteria [28]. SPA was selected to analyze indicators’ status and development trends due to its objective processing without considering the decision maker’s subjective judgment.
The State Council issued the 12th Five Year Plan for the cause of ethnic minorities in 2012. It points out that accelerating ethnic minorities and ethnic minority areas should be placed in a more prominent strategic position. Due to historical, natural, and geographical reasons, the development of the autonomous regions still faces some significant problems and extraordinary difficulties. However, few studies have focused on the sustainability of the autonomous regions in China. Many studies used GRA as a fundamental tool for sustainability measurement at different scales, such as international regions, countries, and cities. Most studies of the autonomous regions have focused on the natural environment [50,51,52,53,54,55,56]. Therefore, it is urgent to study the sustainable development of autonomous regions. The sustainability of autonomous regions in China was measured based on the three-pillar model by selecting sustainability criteria from economic, social, and environmental dimensions. To extend the study period taking the year of 2010 as the base period, this paper evaluated the dynamic sustainability of the autonomous regions in China over the following ten consecutive years. The dynamic sustainable development results of autonomous regions provided more references for the local authorities, including development status, trend, impetus, and others. Notably, 10 years (2010–2019) were considered since the data of the criteria in this paper were only released to the year 2019 at present.
The research’s significant contribution is reflected in the new weighting method. Firstly, the GRA-SPA method proposed combines the grey relational analysis (GRA) and set pair analysis (SPA) methods. The integrated method not only analyzes the correlation between indicators and ideal points but also analyzes the status and development trend. Secondly, the method combines the indicator with the grey correlation coefficient to form a pair system and then analyzes the same and different aspects of the index. Enlarging the gap among indicators can effectively guide the development of the evaluated objects. Thirdly, the weighting method can ensure the objectivity of the indicator weight, simplify the calculation, and avoid the subjectivity of the subjective weighting method. Finally, this study is helpful to grasp the sustainable development status of the autonomous region and provide practical solutions for the local government to narrow the gap with the eastern and western provinces of China. The rest of the paper is arranged as follows: Section 2 briefly introduces the study cases. Section 3 proposes the GRA-SPA method used for sustainability evaluation. The evaluation results are shown in Section 4. Finally, conclusions, suggestions, and future works are outlined in Section 5.
2. Study Cases
The autonomous regions are the main ethnic minority areas in China. It covers 4,375,400 km2, accounting for 45.7% of China’s total land area. The autonomous regions in China include Ningxia Hui Autonomous Region, Inner Mongolia Autonomous Region, Xinjiang Uygur Autonomous Region, Tibet Autonomous Region, and Guangxi Zhuang Autonomous Region.
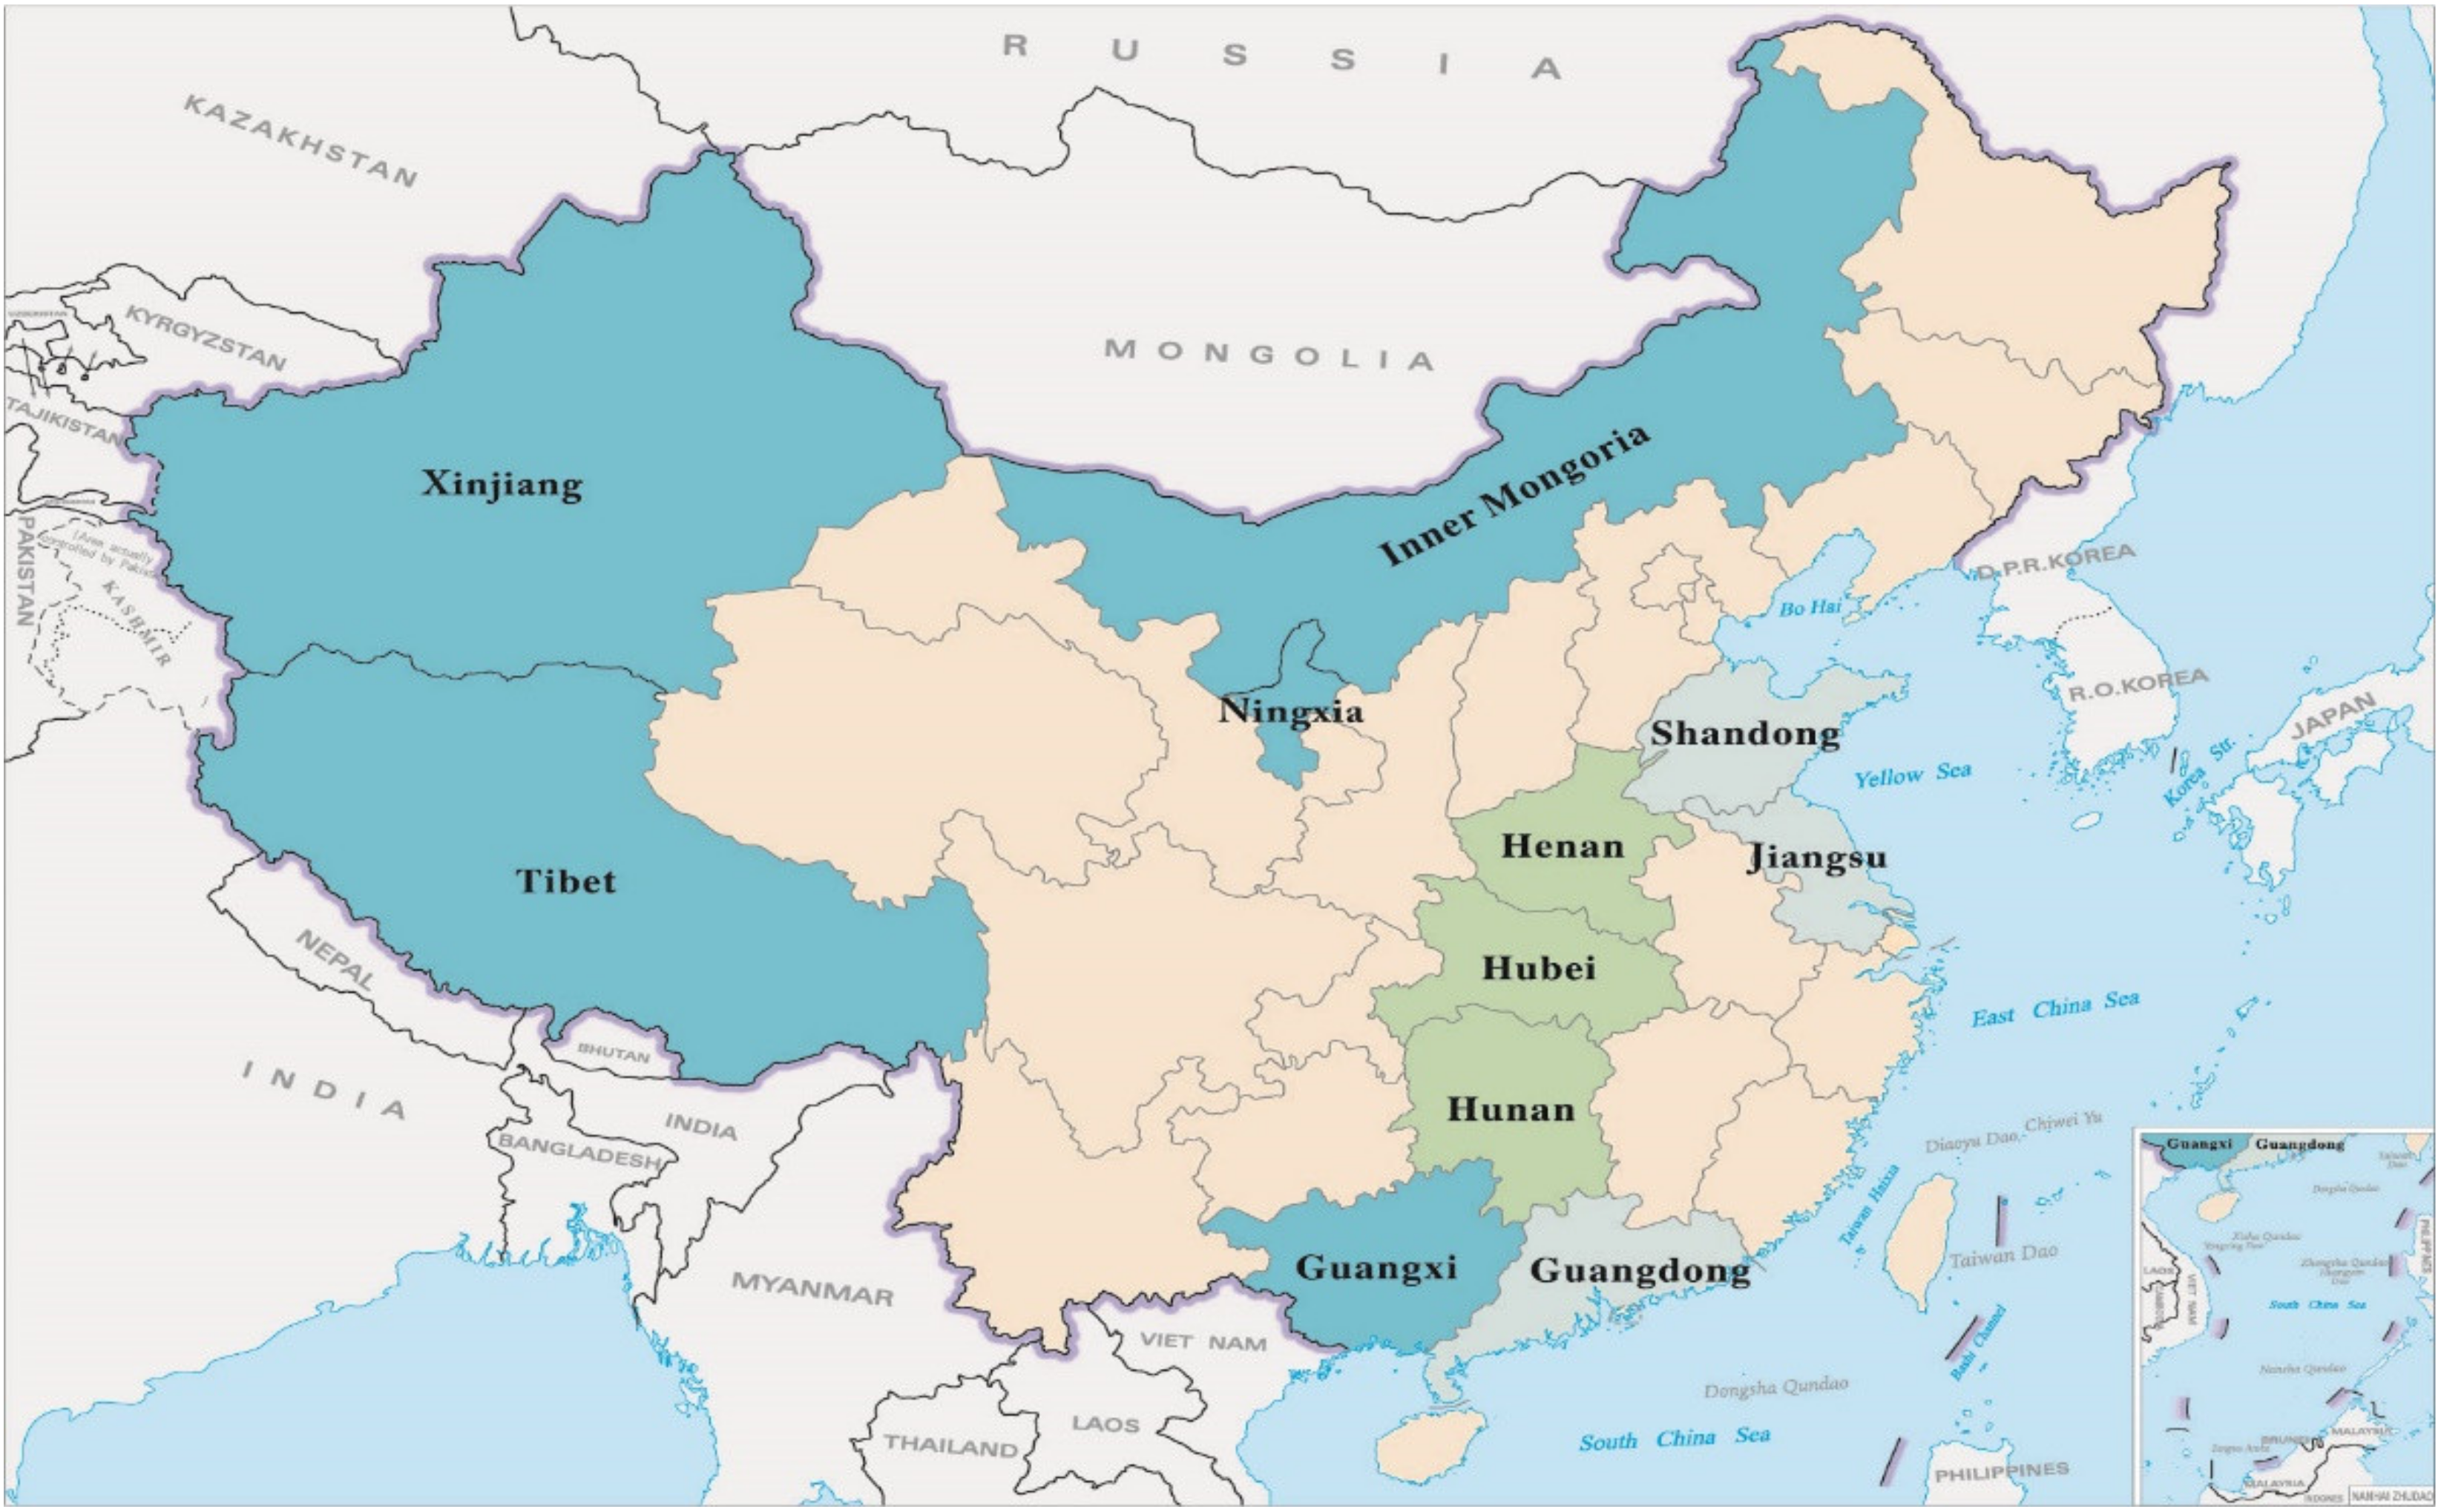
The specific description of the autonomous regions is as follows. Ningxia Hui Autonomous Region is referred to as Ningxia, with Yinchuan as its capital. Ningxia is located between 35°14–39°23′N and 104°17–107°39′E in the north of China. There are five prefecture-level cities, nine municipal districts, two county-level cities, and 11 counties. Inner Mongolia Autonomous Region is referred to as Inner Mongolia. Inner Mongolia in the north of China located between 37°24′–53°23′N and 97°12′–126°04′E. There are 12 prefecture-level administrative regions, including nine prefecture-level cities. Xinjiang Uygur Autonomous Region is referred to as Xinjiang and is located in northwest China with Urumqi as its capital. Xinjiang lies between 34°25′N and 48°10′N and 73°40′E and 96°18′E. Tibet Autonomous Region is referred to as Tibet, lies between 26°50′N and 36°53′N, and 78°25′E and 99°06′E. Lhasa is the capital of Tibet Guangxi Zhuang Autonomous Region is referred to as Guangxi, whose capital is Nanning City. Guangxi is located in South China, between 20°54′–26°24′N latitude and 104°28′–112°04′E longitude. There are 14 prefecture-level cities, 50 counties, 12 autonomous counties, 9 county-level cities, and 40 municipal districts. Guangdong is located between latitude 20°13′–25°31′N and longitude 109°39′–117°19′E. Jiangsu lies between 116°18′–121°57′E longitude and 30°45′–35°20′N latitude. Shandong is located between 34°22.9′–38°24.01′N and 114°47.5′–122°42.3′E. The latitude and longitude of Henan province are between 31°23′–36°22′N, and 110°21′–116°39′E. Hubei is between 108°21′–116°07′ east longitude and 29°01′–33°6′ north latitude. Hunan lies between 111°53′–114 °15′ east longitude and 27°51′–28 °41′ north latitude. The locations of the autonomous regions and provinces in China are shown in Figure 1, and the brief profiles are shown in Table 1.
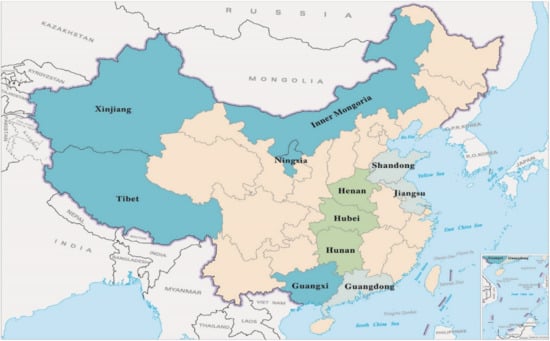
Figure 1.
Spatial distribution of the autonomous regions and provinces in China.

Table 1.
Brief profiles of studied autonomous regions and provinces.
The autonomous regions have made tremendous contributions to the economic development and ethnic unity of China. Therefore, great importance has been attached to the comprehensive development of the autonomous regions by the ruling authorities. However, the unbalanced and inadequate development of autonomous regions is still one of China’s overall development defects. For reasons of history, nature, and geography, the development of autonomous regions faces some significant problems and particular difficulties, such as the low level of economic, social, and industrial development, the complexity of the old and new kinetic energy conversion, unbalanced development of urban and rural areas, and the shortage of essential public services et al [1]. At present, accelerating ethnic minorities and ethnic minority areas is a core issue and priority policy for the Chinese government. The study’s primary purpose is to investigate the dynamic sustainability of autonomous regions in China to provide more technical references for the sustainable development of China.
3. Methods
3.1. Indicators for Sustainability Evaluation
The evaluation of autonomous regions’ sustainability cannot be directly measured. Generally, a widely accepted approach is to select a set of indicators based on the three-pillar model used for reflecting three dimensions of sustainable development. However, there are no commonly recognized indicators for measuring autonomous regions’ sustainability. In this paper, we developed a set of 24 indicators reflecting different dimensions of sustainable development. We then combined the primary literature reviews regarding sustainability investigation of Chinese provinces and the accessibility of the indicators data.
Table 2 shows a summary of the selected 24 indicators. The economy, society, and environment are the dimensions for evaluating the sustainability of autonomous regions. The economic dimension is measured from the quantity of economic growth and the quality of the economy, such as C1 and C2. The social dimension is measured by people’s living standards and happiness, such as C11–C16. The environmental dimension is measured from the degree of comfort of people’s lives and the reasonable use of C22 and C23. Note that the selected indicators cannot completely represent all aspects of autonomous regions’ sustainability due to missing some indicators data. For example, the discharge of dangerous waste indicators of Xinjiang, Tibet, and Guangxi was missing from 2010 to 2019, so these indicators were not included in the dimension of the environment.

Table 2.
Indicator system selected for Autonomous regions sustainability assessment.
3.2. The Dynamic GRA and SPA Model
Assume there are alternatives denoted as , which are measured by m indicators denoted as . Let represent the actual performance value of alternative with respect to indicator in period , where .
To assess autonomous regions’ sustainability, firstly the GRA method was selected to calculate ideal reference points determined by the correlation between indicators and positive ideal points in the period . The indicator showing a higher correlation with the positive ideal point should be given a larger value of the ideal reference point. Then, the SPA method was used to combine indicators and ideal reference points to form a set pair system, and the connection number further analyzed the coupling relationship between indicators and ideal reference points. The indicator showing a higher coupling degree with the ideal reference point will be given a larger weight value. The GRA-SPA method has the advantages of simple calculation, strong practicability, objective, and exact evaluation results. At last, using the simple linear weighting method to integrate the indicator values and weights to an output final sustainability performance. The framework of the research is shown in Figure 2.

Figure 2.
The framework of the research.
In detail, the assessment steps of dynamic sustainability based on the GRA-SPA method are summarized as follows.
Step 1. Collect the actual criteria values of the indicators. The actual criteria values were collected from the China Statistical Yearbook (2010–2019), Inner Mongolia Statistical Yearbook (2010–2019), Ningxia Statistical Yearbook (2010–2019), Xinjiang Statistical Yearbook (2010–2019), Tibet Statistical Yearbook (2010–2019), and Guangxi Statistical Yearbook (2010–2019).
Step 2. Transform the actual criteria values of the indicators into a uniform scale [23].
if is a benefit indicator.
if is a cost indicator, where the range of is 0 minus 1, and is the normalized criteria value. and are the maximum and minimum performance of the alternatives on indicator across all time periods, respectively. The dynamic mean range method was used for obtaining normalized indicator values to observe the dynamic development of alternatives in different periods.
Step 3. Calculate the grey correlation coefficient between each annual indicator and the positive ideal point of the indicators.
where is the absolute difference between indicators and positive ideal points in the period . is the resolution coefficient, and it often takes 0.5 for calculation [37].
Step 4. Calculate the ideal reference points of indicators.
The indicator showing a higher correlation with the ideal point was given a larger value of the ideal reference point .
Step 5. Combine indicators and ideal reference points to form a set pair system and calculate the connection numbers. The ideal reference points divide the indicators of period into two evaluation grades, the first grade range denoted as , and the second evaluation grade range denoted as . takes 0, and takes 1 due to the range of is 0 minus 1. When , the describes the combination degree of a set pair system, such as:
Similarly, when , we have
where is 0 minus 1 and determined by whether the indicators belong to the first grade or the second grade. The higher value of the higher value of . can be used as a different function of the variable proximity fuzzy relationship between indicators and evaluation grade. Let be the corresponding relative membership degree, then
The connection numbers denoted is calculated by:
where represents the identity degree to the ideal reference point of indicators, while represents the degree that reflects the deviation from the ideal reference point of indicators, and . denotes the coefficient of difference, and the range of is −1 minus 1. According to the different values of , the value of is horizontally extended.
Step 6. Obtain the indicator weight.
where the value of is −1 minus 1 denotes the indicator weight, and . It is seen that is determined objectively by the ideal reference points of indicators and the connection numbers simultaneously.
Step 7. Use the simple linear weighting method to integrate the indicator values.
where the range of is 0 minus 1. is the overall state-trend sustainability performance value in the period of , and the larger value indicates the higher sustainability. is the gain value from the previous period. , are the adjusting parameters while , is 0 minus 1, and . If we pay more attention to the state data, the larger the value is, and if more attention is preferred to the trend data, the larger the value is. In the absence of special needs, we can let .
4. Results
4.1. Indicator Weights
The indicator weights were calculated by the dynamic GRA-SPA method. The objective weighting method not only analyzed the correlation degree between indicators and positive ideal points but also analyzed the coupling degree between indicators and ideal reference points to extend the gap of indicators in the horizontal direction. Therefore, the indicator weights preliminarily showed the overall performance of the autonomous regions. Sensitivity analysis further yielded insights into the relationship between indicator value, weight, and comprehensive evaluation results. In this study, GRA was used to calculate the sensitivity of the indicator value. The main idea is that the higher the correlation degree of the indicator value to the comprehensive evaluation value, the higher the indicator’s sensitivity. The annual weight of each indicator value is equal, so the annual sum of each indicator value and the annual sum of the comprehensive evaluation value is used to calculate the grey correlation degree. The calculation steps are as follows:
Step 1. Calculate the grey relational coefficient between indicators and comprehensive evaluation value.
where is the absolute difference between indicators and comprehensive evaluation value in the period. and . is the resolution coefficient, and it often takes 0.5 for calculation.
Step 2. Calculate the indicator sensitivity.
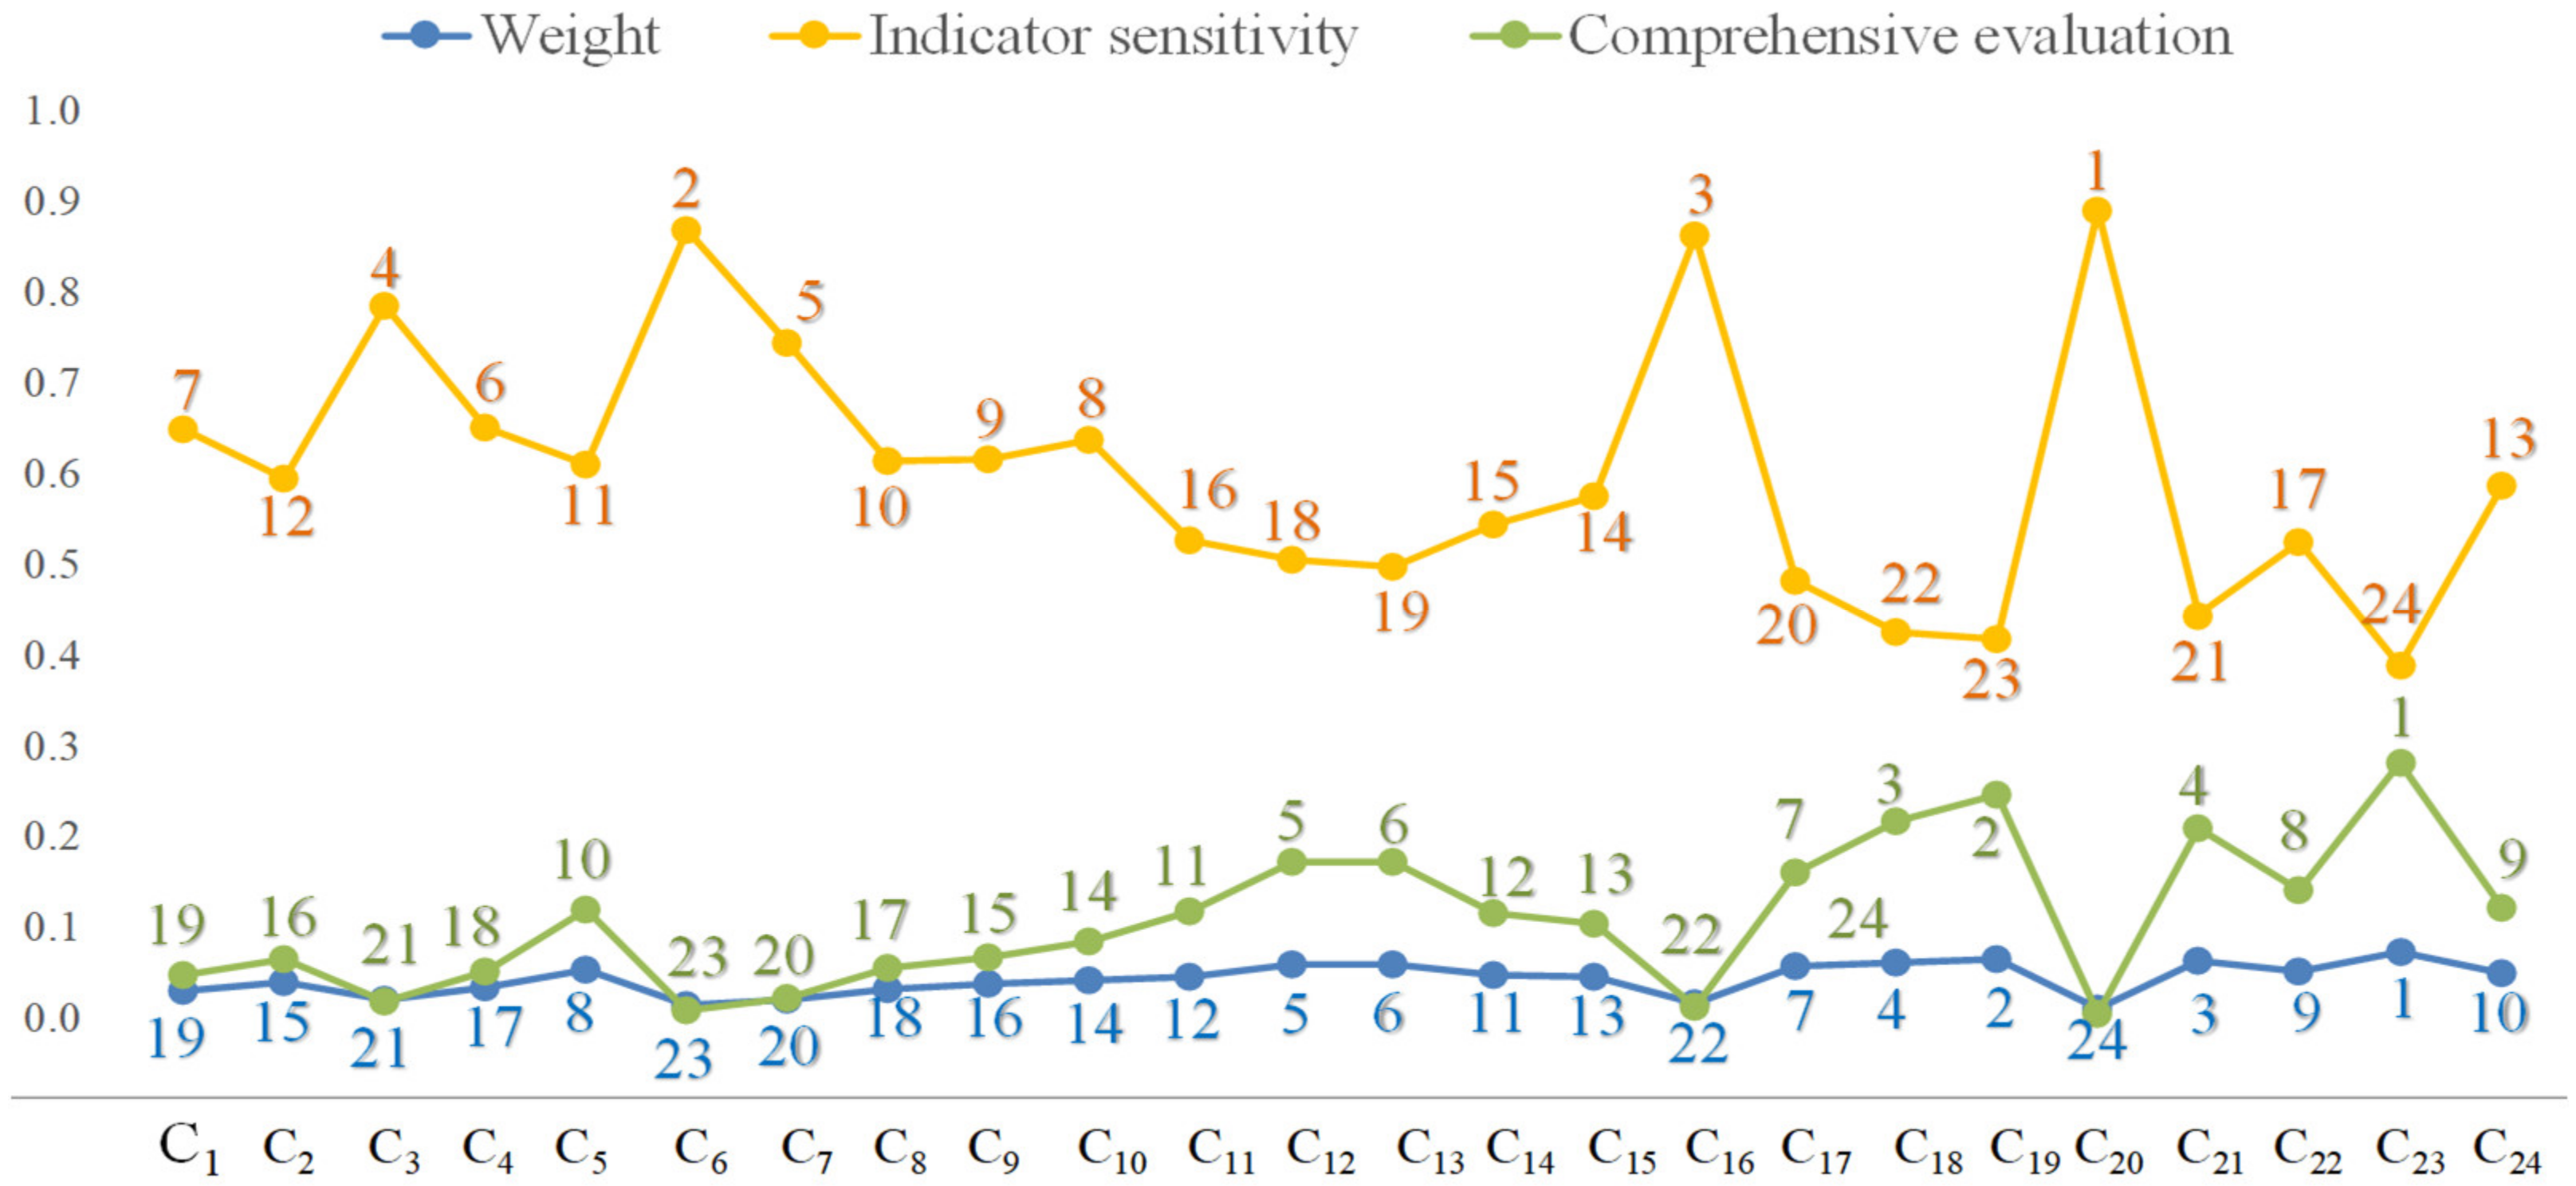
The weight, indicator sensitivity, and comprehensive evaluation value are shown in Table 3, and Figure 3 shows the change more vividly.

Table 3.
The weight, sensitivity, and comprehensive evaluation value of indicators.
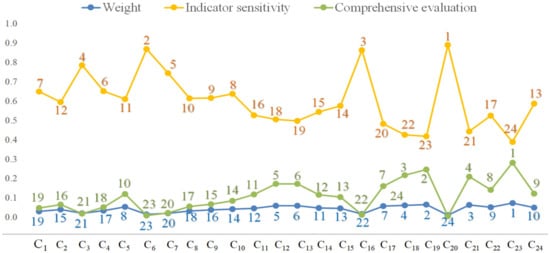
Figure 3.
The weight, sensitivity and comprehensive evaluation value of indicators. Note: The label data represents the ranking of weight value, sensitivity value, and comprehensive evaluation value, respectively.
Table 3 and Figure 3 show that the aggregated weights of environmental dimension were the best, followed by economy and society. Moreover, 12 indicator weights were below the average weight of 24 indicators. In detail, seven indicator weights of the social economy dimension were below the average weight, four indicator weights of the environmental economy were below the average weight, and one indicator weight of the environmental dimension was below the average levels. Specifically, the top five indicator weights are C23 (percentage of harmless disposal of domestic), C19 (discharged volume of SO2 per unit of GDP), C21 (industrial soot and dust emissions), C18 (discharged of wastewater per unit of GDP), and C12 (doctors Per 10,000 People). There is a gap between the weight and the corresponding comprehensive evaluation results, but the ranking is basically the same. The indicator sensitivity value is opposite to the corresponding weight and comprehensive evaluation value, and the ranking is also opposite. For example, the ranking of weight and the comprehensive evaluation value of C20 is 24, but the ranking of indicator sensitivity is 1. Specifically, the top 10 indicators of sensitivity are C20 (Investment in environmental protection as a proportion of GDP), C6 (Per capita imports and exports), C16 (Highway mileage per capita), C3 (Proportion of added value of service industry to GDP), C7 (Disposable income per capita), C4 (Per capita investment in fixed assets), C1 (Per capita GDP), C10 (Population density), C9 (Natural growth rate of population), C8 (Per capita foreign investment). Six of them are indicators of economic division, and three are indicators of the social dimension, indicating that the imbalance of economic development is still the main bottleneck restricting the sustainable development of these regions.
4.2. Sustainability Performance
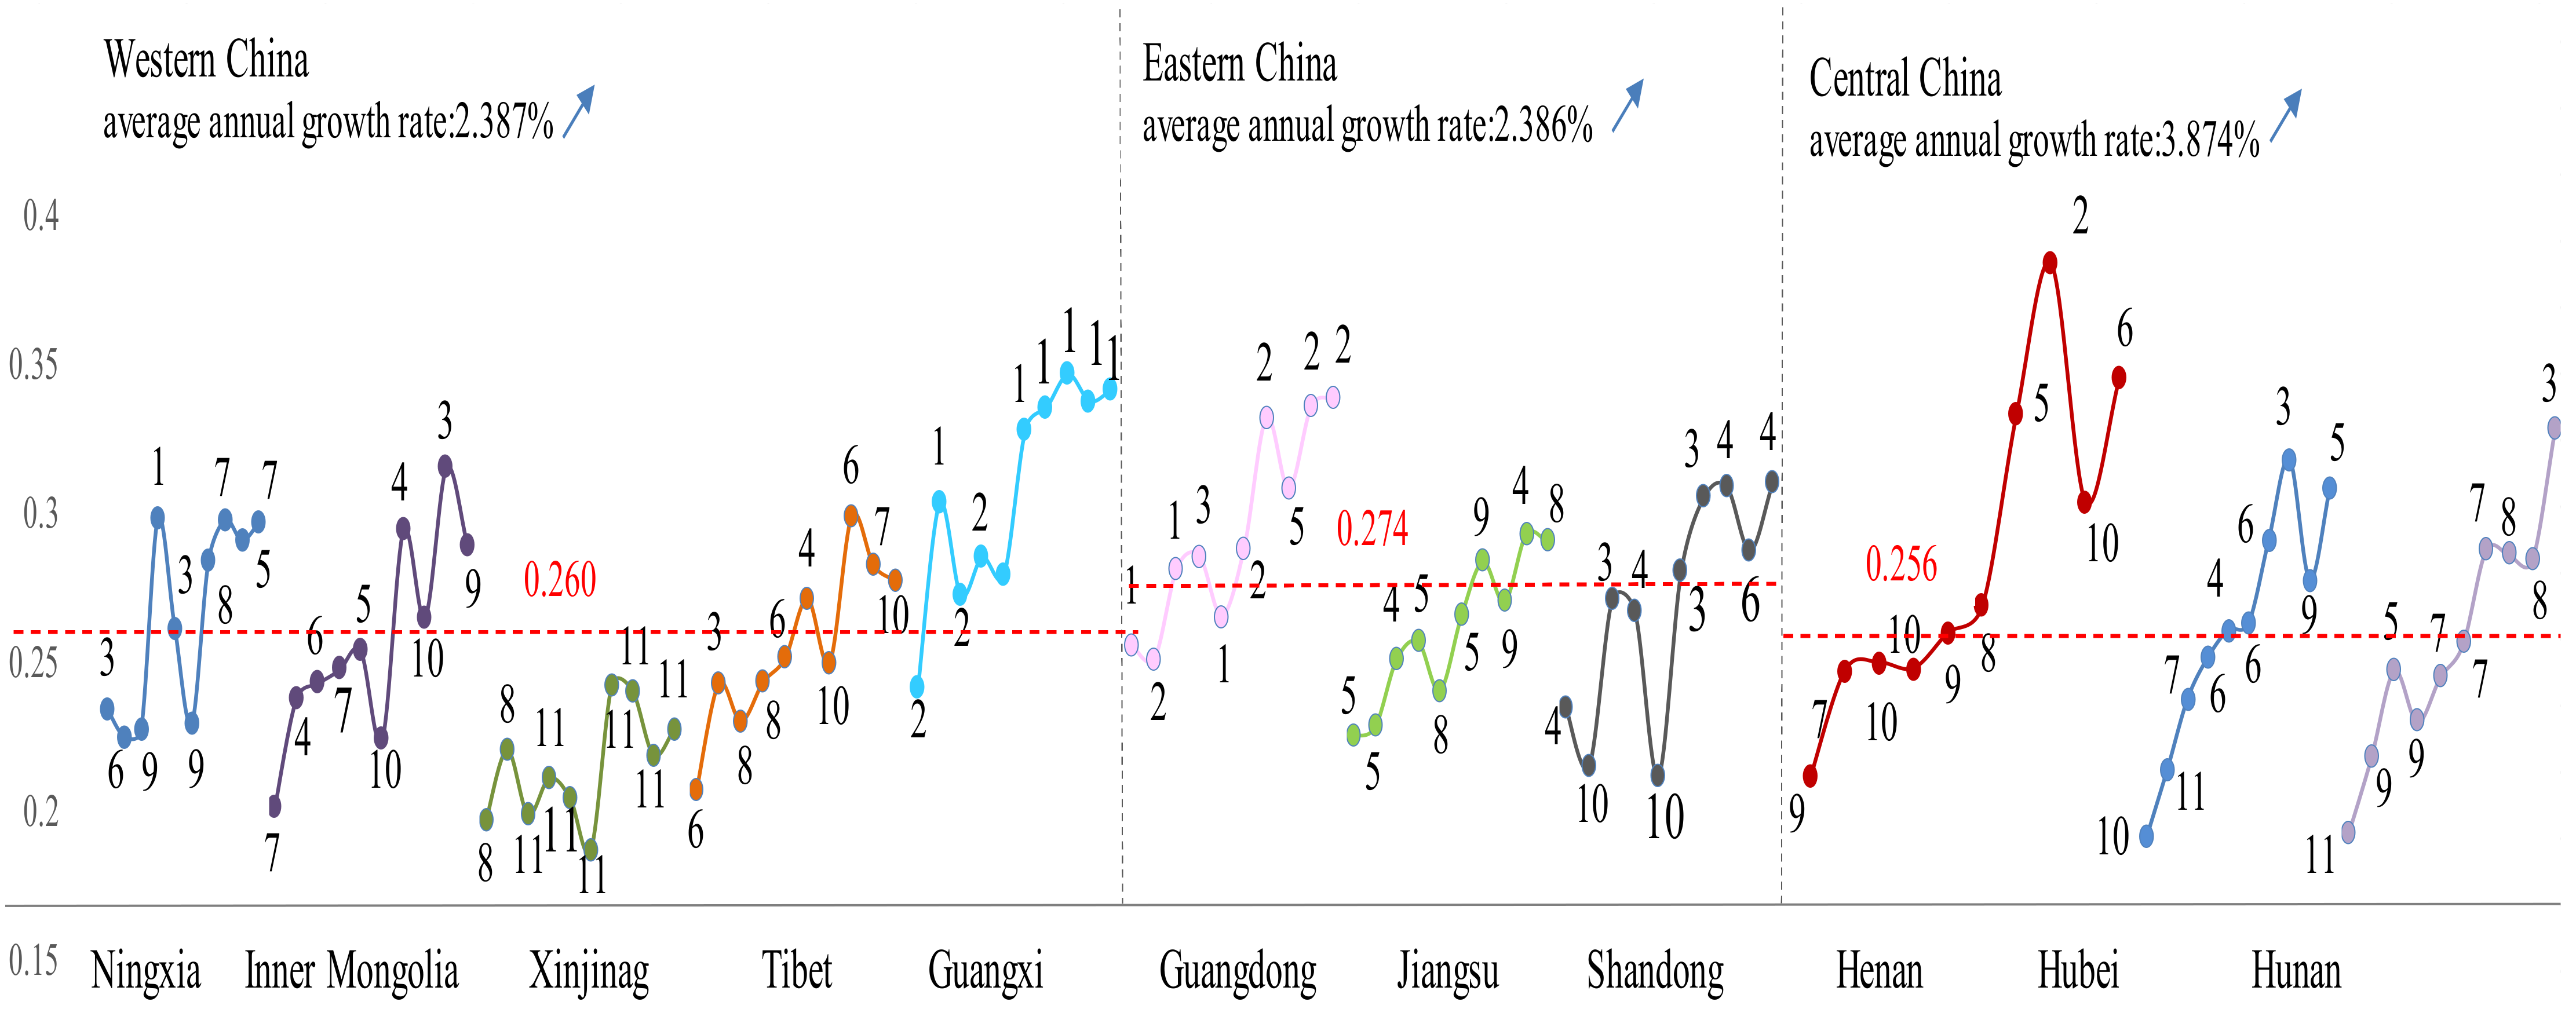
After getting the weight values, the overall state-trend sustainability performance is aggregated by Equation (10). The sustainability performances of autonomous regions and provinces in 2010–2019 are shown in Table 4. Figure 4 shows the change of the state-trend sustainability performances (also denoted as comprehensive sustainability) of autonomous regions and provinces in 2010–2019 more clearly.

Table 4.
Comprehensive sustainability performance of autonomous regions and provinces.
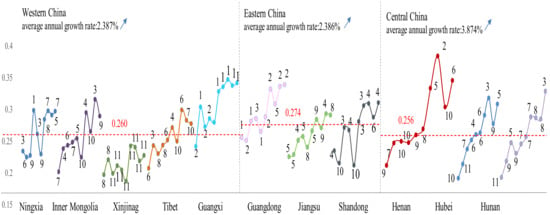
Figure 4.
Change of sustainability performance of the five Autonomous regions and six provinces in 2010–2019. Note: The values on each curve from left to right represent the rankings of the five Autonomous regions and six provinces from 2010 to 2019. The red dotted line indicates the average value of the 11 regions in 2010–2019. The label data represent the ranking of each region in each year.
Table 4 and Figure 4 show that the average comprehensive sustainability ranking is Guangxi, Ningxia, Inner Mongolia, Tibet, and Xinjiang. The average comprehensive sustainability ranking of five autonomous regions and six provinces is Guangxi, Guangdong, Shandong, Ningxia, Hubei, Jiangsu, Inner Mongolia, Tibet, Hunan, Henan, and Xinjiang. Except for Guangxi and Ningxia, other autonomous regions performed poorly in comprehensive sustainability compared with the six provinces. Particular attention should be paid to the comprehensive sustainability of Inner Mongolia, Tibet, and Xinjiang, which all ranked low in comprehensive sustainability performance for a single year. It is seen that the sustainability of most autonomous regions in the 10 years showed an increasing tendency in fluctuation. Xinjiang and Tibet fell in the rankings from 2010 to 2019, although they showed an increasing tendency for fluctuation. It is seen that the average comprehensive sustainability performance of Guangxi was the best, followed by Ningxia, Inner Mongolia, Tibet, and Xinjiang. In detail, Guangxi was the only autonomous region with a performance value of 2010 below the average comprehensive sustainability, Ningxia with four performance values below the average value, Inner Mongolia and Tibet with six performance values below the average value, and all the performance values of Xinjiang are lower than the average value. We can see that the rankings of Guangxi have barely changed in the recent 10 years. The rankings of Ningxia showed nearly the lowest ranking and also have barely changed in the year 2010–2019. The rankings of Tibet and Guangxi had a fluctuated increasing tendency. On the contrary, the rankings of Xinjiang showed a fluctuated decreasing tendency. Compared with the annual comprehensive evaluation value and ranking of the six provinces, the sustainable development of other autonomous regions is not ideal and needs to be improved urgently except for Guangxi.
From 2010 to 2019, Inner Mongolia had the most substantial development momentum and the highest comprehensive sustainability growth rate (3.031%) among the five autonomous regions, followed by Guangxi, Tibet, Ningxia, Xinjiang. The growth rate of the five autonomous regions and the six provinces is in descending order: Hunan, Hubei, Henan, Inner Mongolia, Guangxi, Tibet, Guangdong, Shandong, Jiangsu, Ningxia, and Xinjiang. It can be seen that there is a particular gap between the sustainable development growth rate of the autonomous regions and that of the other six provinces.
The average score of Ningxia (0.264), for example, is calculated by the formula of (0.234 + 0.225 +0.227 + 0.298 +0.261 +0.229+0.284+0.297+0.291+0.296)/10, and the growth rate (2.663%) is calculated by(0.296 − 0.234)/(0.234 × 10) ×100%.
In order to analyze the specific reasons for the differences in performances of autonomous regions, the following equations are used to calculate the sustainability performance of economic, social, and environmental dimensions in each year:
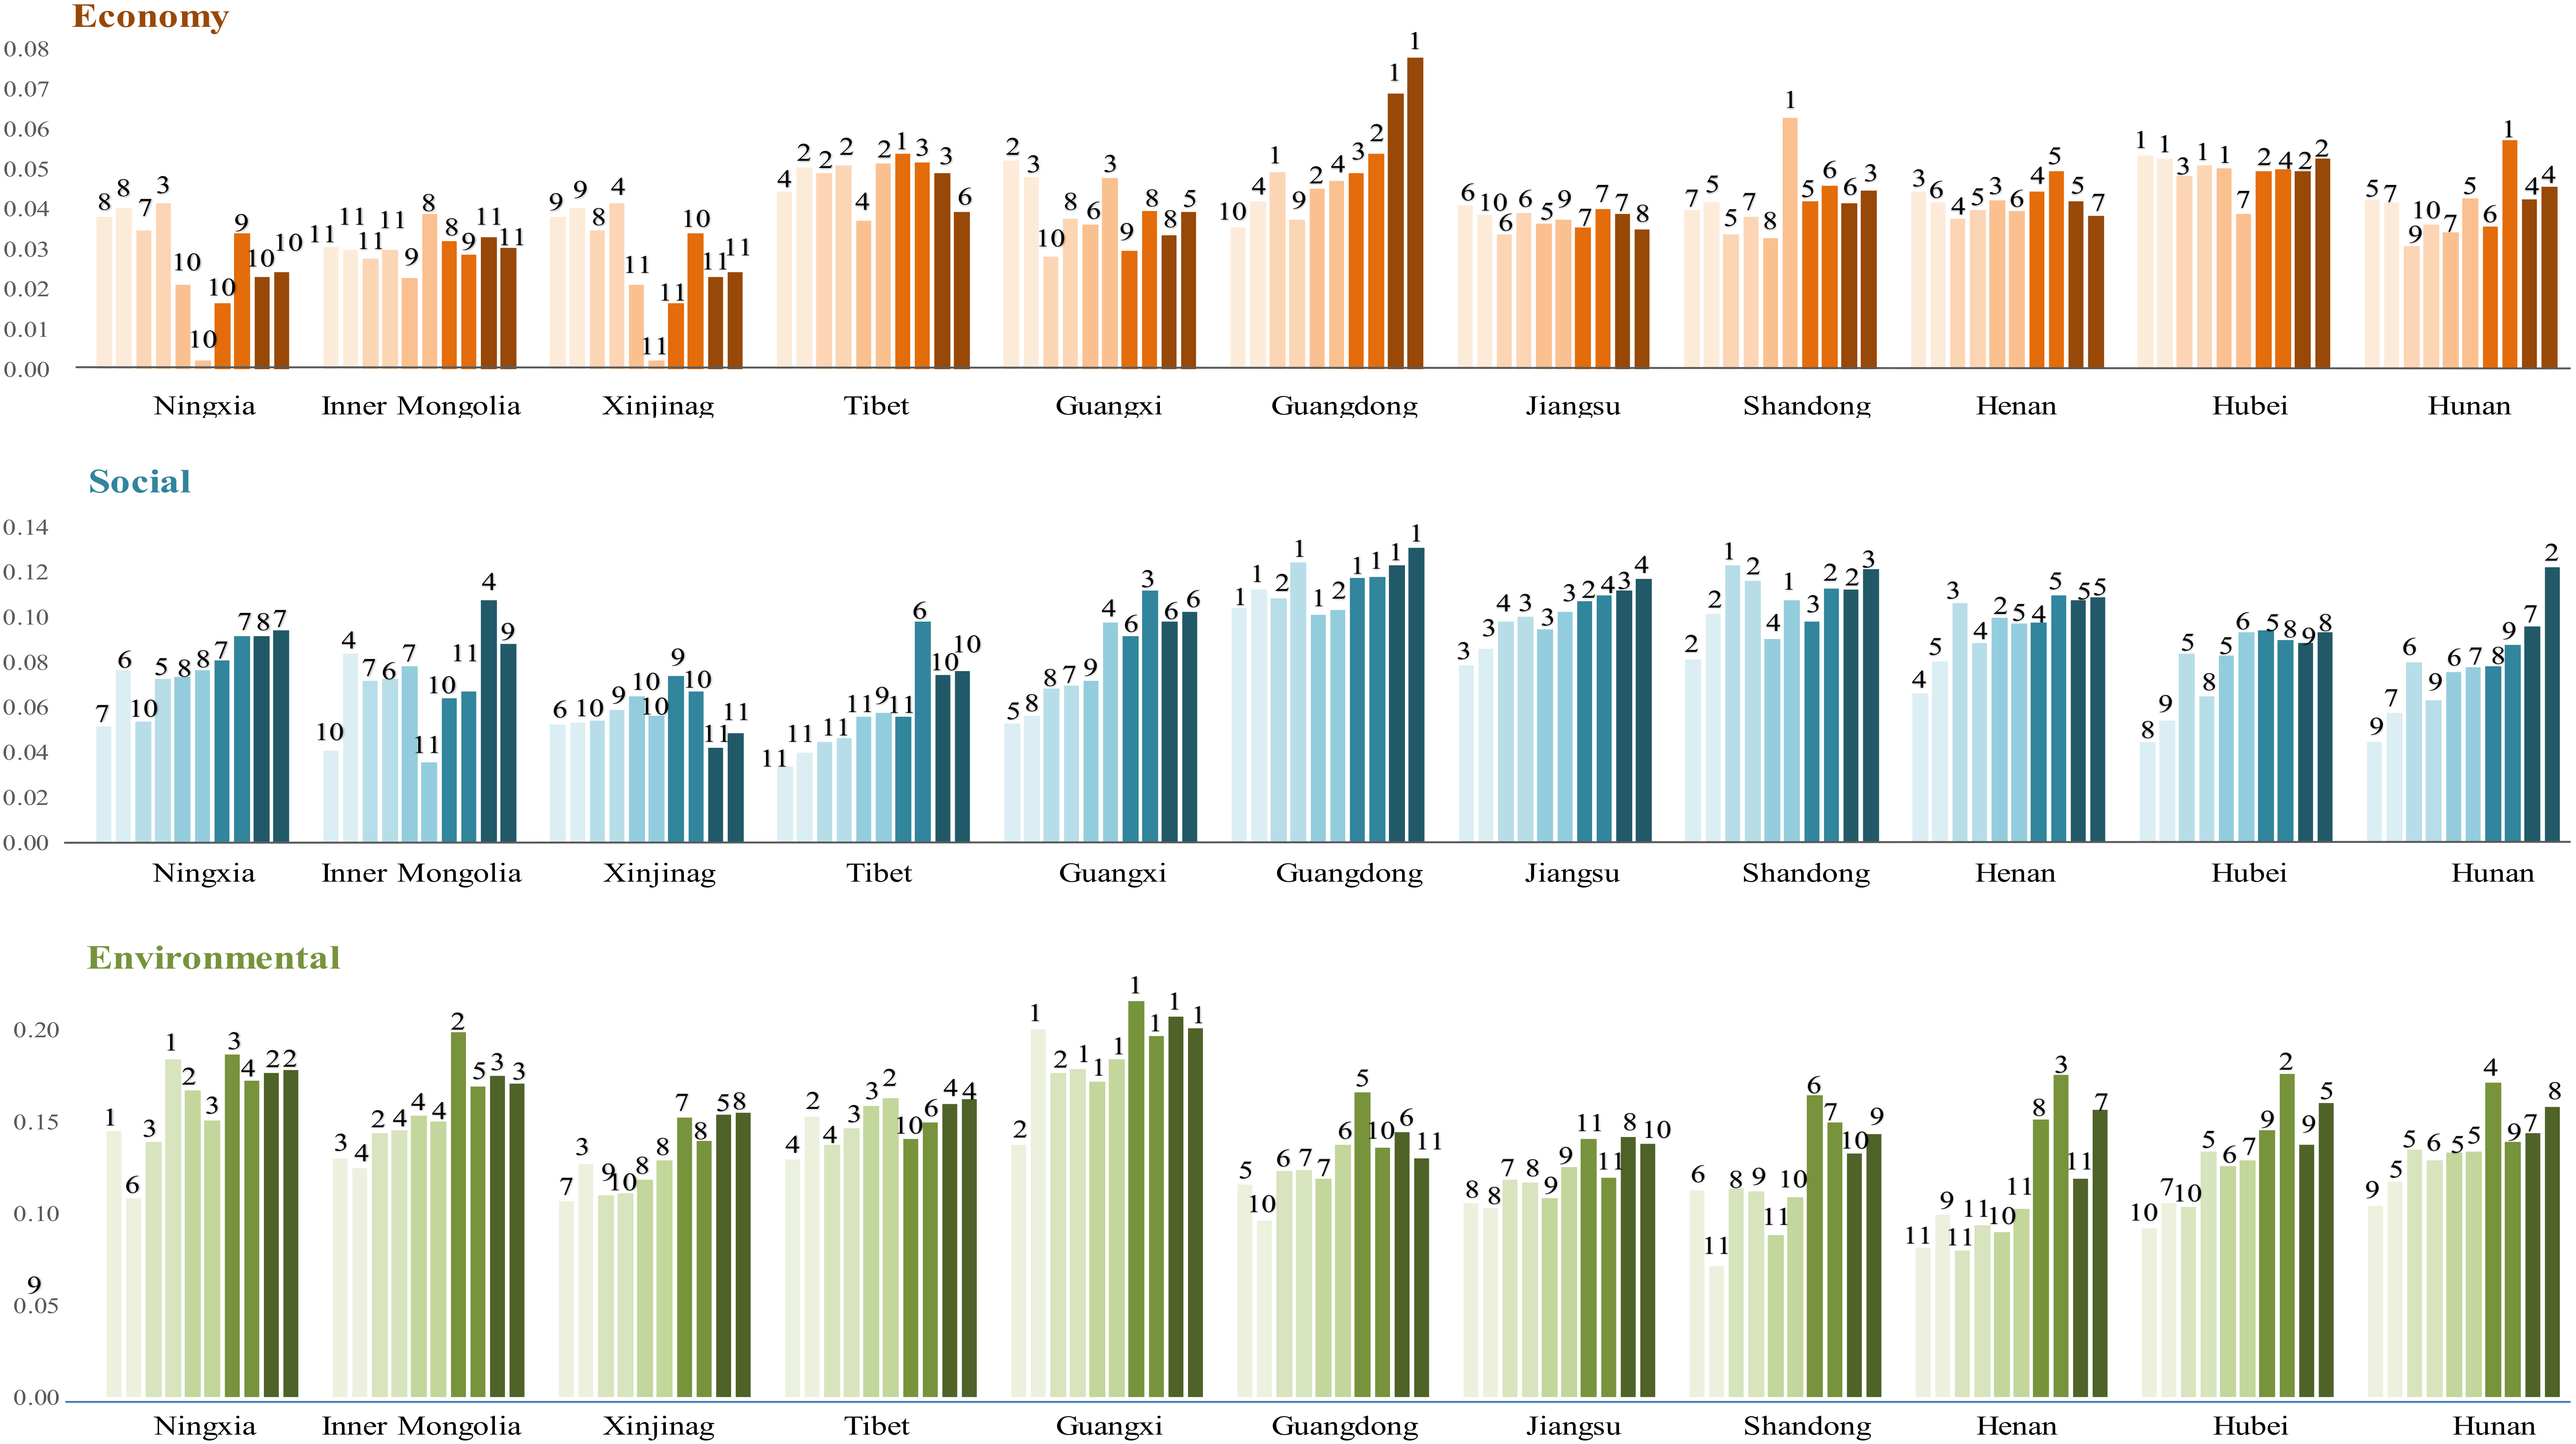
where . Figure 5 and Table 5 show the sustainability performances of the economic, social, and environmental dimensions in each autonomous region.
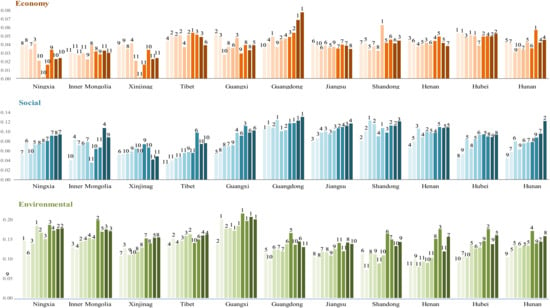
Figure 5.
The dimensional performances of the five autonomous regions and six provinces in 2010–2019 Note: The vertical axis from left to right represents the performance values from 2010 to 2019 of the three dimensions. The number marked on the bar represents the ranking of each autonomous region in different dimension.

Table 5.
Sustainability performance of autonomous regions and provinces on three dimensions.
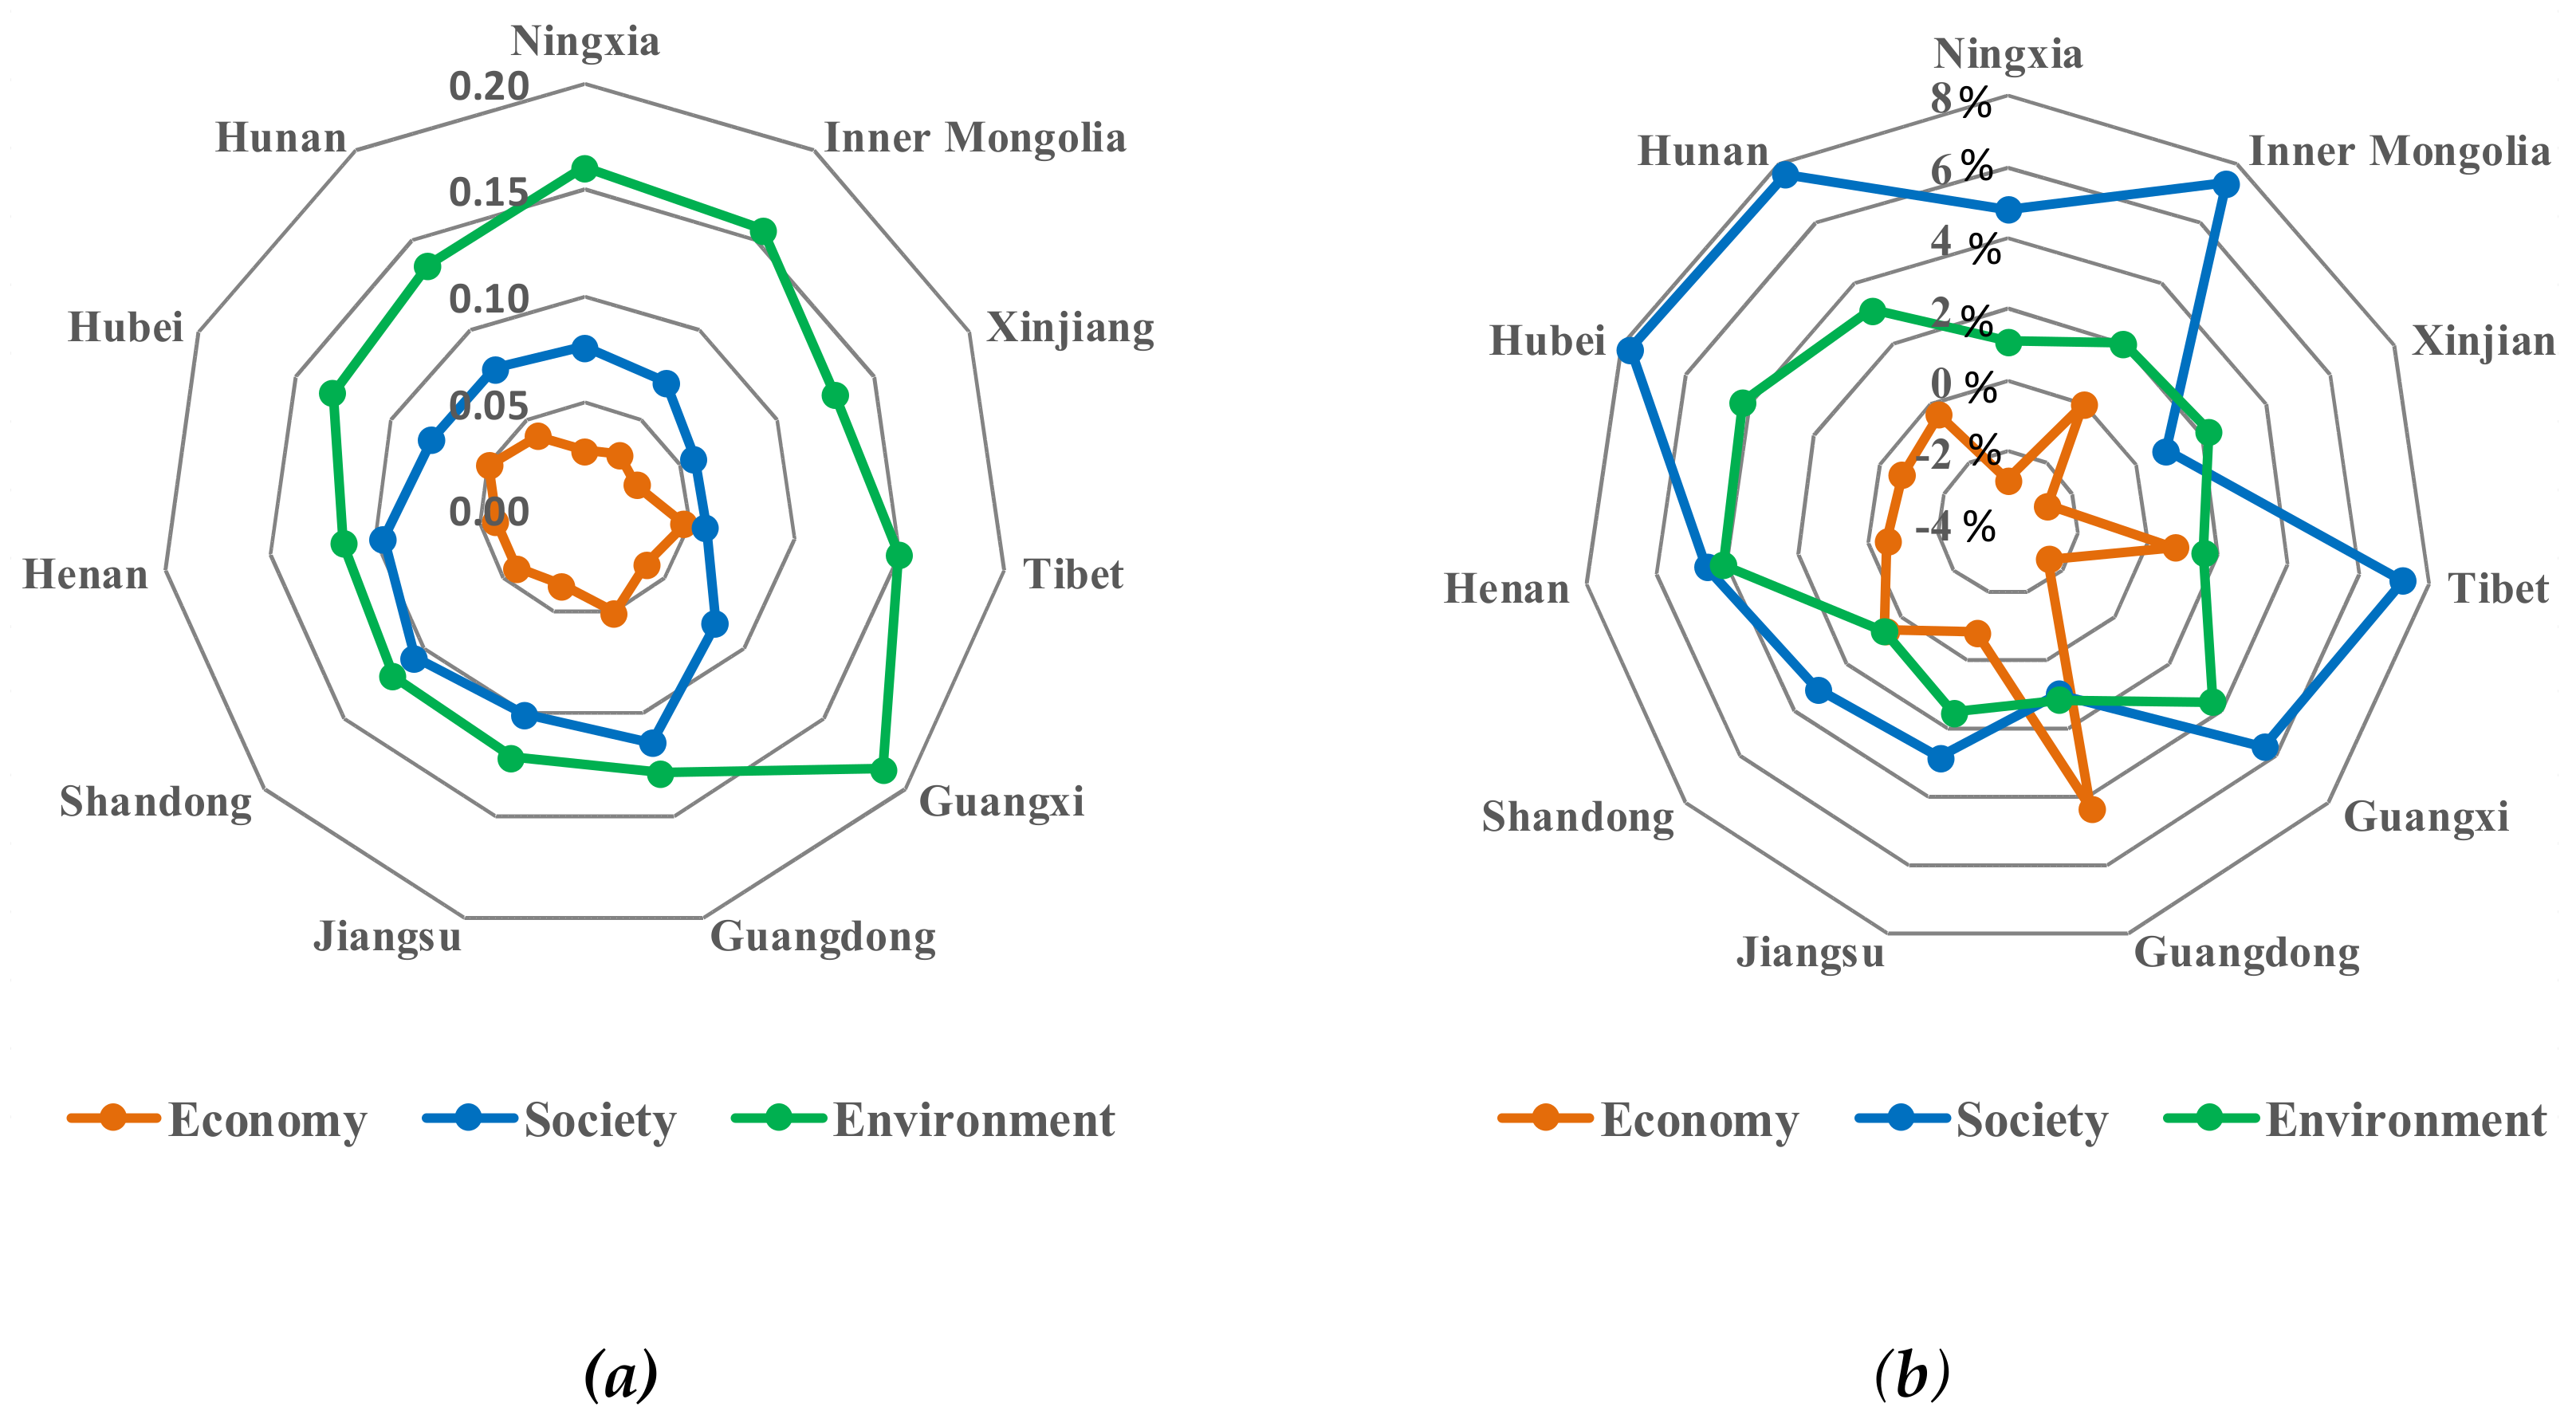
It is seen that the sustainability performances of the three dimensions were quite different. Environmental sustainability presented the best performance among the three dimensions of the autonomous regions (the proportion of environmental sustainability in comprehensive sustainability is accounting for 60.28%), followed by social sustainability (the proportion of social sustainability in comprehensive sustainability is accounting for 26.46%), and economic sustainability (the proportion of economic sustainability in comprehensive sustainability is accounting for 13.24%). The proportion of sustainability performance on three dimensions is the same as that of aggregated weight on three dimensions. It further proves that sustainability performance is simultaneously determined by the status and trend of indicators and weights. The maximum and minimum sustainability performance of the economic, social, and environmental dimensions, respectively fluctuated within the range of [0.002, 0.208], [0.033, 0.434], and [0.071, 0.892] in each year. Specifically speaking, the average economic sustainability of Tibet was the best, followed by Guangxi, Inner Mongolia, Ningxia, and Xinjiang. The average social sustainability of Guangxi was the best, followed by Ningxia Inner Mongolia, Tibet, and Xinjiang. The average environmental sustainability of Guangxi was the best, followed by Ningxia, Inner Mongolia, Tibet, and Xinjiang. Note that Xinjiang’s economic, social, and environmental sustainability score is the lowest, which should be brought to the attention of relevant authorities. The mean value of the economic dimension of five autonomous regions and six provinces is 0.039, and only Tibet’s value is higher than the mean of the five autonomous regions, while only Jiangsu’s value is lower than the mean value among the six provinces.
The mean value of the social dimension of five autonomous regions and six provinces is 0.083, and only Tibet’s value is higher than the mean value of the five autonomous regions, while Hubei and Hunan’s values are lower than the mean value among the six provinces. The mean value of the environmental dimension of five autonomous regions and six provinces is 0.083, and only Xinjiang’s value is lower than the mean of the five autonomous regions, while six provinces’ values are lower than the mean value. It is found that the sustainable development level of most
Figure 6a shows the sustainability levels, and Figure 6b shows the growth rate of the five autonomous regions and six provinces. Nearly all the autonomous regions performed best on environmental sustainability except Ningxia, but Ningxia scored higher than five of the six provinces. In contrast, they had the worst performances on economic sustainability, especially for Ningxia and Xinjiang. Therefore, improving economic sustainability is a significant challenge for the sustainable development of the autonomous regions in China. The growth rates of autonomous regions in the economic dimension are negative except for Tibet (0.75%), while four of the six provinces had negative growth rates but performed better than the autonomous regions. Inner Mongolia showed the highest growth rate of social sustainability (7.35%), followed by Tibet (7.24%), Guangxi (5.56%), Inner Mongolia (4.79%). In comparison, Xinjiang (0.90%) performed poorly in the growth development of social sustainability. The growth rate of the environmental dimension of the autonomous regions is comparable to that of the six provinces. In terms of environmental sustaina-bility, Guangxi showed the highest growth rate (3.61%), and only Ningxia (1.11%) had the lowest growth rate. The average growth rate of the autonomous regions in the environmental dimension is 2.10%, and the six provinces’ aver-age growth rate is 2.46%. The average growth rate of autonomous regions and provinces in the environmental dimension is similar.
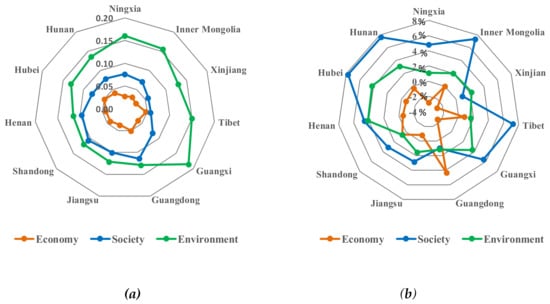
Figure 6.
Comparison of the sustainability levels of the three dimensions; (a) the sustainability levels; (b) the growth rates of sustainability levels.
Figure 6a shows the sustainability levels, and Figure 6b shows the growth rate of the five autonomous regions and six provinces. Nearly all the autonomous regions performed best on environmental sustainability except Ningxia, but Ningxia scored higher than five of the six provinces. In contrast, they had the worst performances on economic sustainability, especially for Ningxia and Xinjiang. Therefore, improving economic sustainability is a significant challenge for the sustainable development of the autonomous regions in China. The growth rates of autonomous regions in the economic dimension are negative except for Tibet (0.75%), while four of the six provinces had negative growth rates but performed better than the autonomous regions. Inner Mongolia showed the highest growth rate of social sustainability (7.35%), followed by Tibet (7.24%), Guangxi (5.56%), Inner Mongolia (4.79%). In comparison, Xinjiang (0.90%) performed poorly in the growth development of social sustainability. The growth rate of the environmental dimension of the autonomous regions is comparable to that of the six provinces. In terms of environmental sustainability, Guangxi showed the highest growth rate (3.61%), and only Ningxia (1.11%) had the lowest growth rate. The average growth rate of the autonomous regions in the environmental dimension is 2.10%, and the six provinces’ average growth rate is 2.46%. The average growth rate of autonomous regions and provinces in the environmental dimension is similar.
5. Conclusions
Sustainable development plays an essential role in promoting the long-run development of the autonomous regions in China. In this paper, the sustainable development of five autonomous regions is dynamically evaluated and compared with six provinces in central and eastern China. The evaluation results provide more prosperous references about the development status and trends of the sustainability of autonomous regions. The main innovation of this research is that the GRA-SPA method not only analyzed correlation degrees between each annual indicator and the positive ideal point of the indicators but also analyzed the same and different aspects of the indicator value relative to the grey correlation degree to extend the gap of indicators in horizontal. As a result, the indicator weights preliminary showed the overall performance of the autonomous regions. Therefore, the overall sustainability performances of the autonomous regions across different years (2010–2019) were assessed, rather than being analyzed year by year with different weights. In this case, the comparability of sustainability in different years can be improved by this approach.
The sustainability results showed that the progress of the autonomous regions’ sustainable development in China was increased slowly in 2010–2019. For example, Ningxia and Xinjiang saw the slowest growth. The prime reason is that economic sustainability has declined severely. Although Inner Mongolia presented the highest increasing trends, the growth rate value was 0.75 %. In contrast, other autonomous regions showed a negative growth trend. Regarding sustainable development in three dimensions, the economic sustainability performance of autonomous regions is not ideal, but the environmental sustainability performance is the most ideal.
6. Suggestions
Based on the above research results, economic sustainability should be improved in China’s autonomous regions to achieve the coordinated development of the three dimensions. However, it will take a long time to improve the economic sustainability in autonomous regions due to the low level of industrial development and weak infrastructure. Compared with the developed provinces in China, autonomous regions lack innovation ability and technologies, which may be why the economic development lagged. Additionally, the issues of low population growth rate and inadequate infrastructure were severe. For example, the economic basis of Guangxi was comparatively better compared to the other autonomous regions, but economic sustainable development still needs paying more attention to because of the slow growth rate. Moreover, Xinjiang and Ningxia should take action to avoid the further decline of environmental sustainability. Meanwhile, the growth rate of social sustainability is also retarded in Xinjiang. Therefore, the authorities should take practical actions to avoid further decline. This case should arouse the attention of local authorities.
In future work, comparative studies between autonomous regions and other provinces in Eastern China (such as Qinghai, Gansu, Yunnan) will be studied to discover more detailed reasons for the lower sustainability of autonomous regions. To meet the demand for expanding data collection approaches, we will further develop the weighting method by considering multi-source indicators data (such as interval numbers). Developing a more comprehensive indicator system to monitor the sustainability of the autonomous regions in China may also have attracted our interest.
Author Contributions
R.S. conceptualized the study and analyzed the data. P.Y. conducted the research and wrote the original draft. W.L. contributed to data collection. L.W. contributed to reviewing and editing the manuscript. All authors have read and agreed to the published version of the manuscript.
Funding
This research was funded by the National Natural Science Foundation of China (No.72171040, P.T.Y; No. 72171041, W.W.Li), and the Fundamental Research Funds for the Central Universities of China(No.2006013, P.T.Y; No.N2006007, W.W.Li).
Institutional Review Board Statement
Not applicable.
Informed Consent Statement
Not applicable.
Data Availability Statement
Not applicable.
Acknowledgments
We are grateful to the editor and the reviewers for their valuable comments and suggestions.
Conflicts of Interest
The authors declare no conflict of interest.
References
- CPC Central Committee and State Council. Plan for Promoting the Development of Minority Areas and Ethnic Groups with Small Populations during the 11th Five-Year Plan Period. Available online: http://www.gov.cn/zhengce/content/2008-03/28/content_6698.htm (accessed on 15 December 2007).
- CPC Central Committee and State Council. Plan for Promoting the Development of Minority Areas and Ethnic Groups with Small Populations during the 12th Five-Year Plan Period. Available online: http://www.gov.cn/zhengce/content/2012-07/20/content_6657.htm (accessed on 18 December 2012).
- CPC Central Committee and State Council. Plan for Promoting the Development of Minority Areas and Ethnic Groups with Small Populations during the 13th Five-Year Plan Period. Available online: http://www.gov.cn/zhengce/content/2017-01/24/content_5162950.htm (accessed on 24 December 2016).
- The Xinhua News Agency. The State Council Issued the 13th Five-Year Plan to Promote the Development of Ethnic Minority Areas and Ethnic Groups with Small Populations. Available online: http://www.gov.cn/xinwen/2017-01/24/content_5163017.htm (accessed on 24 January 2017).
- Li Keqiang Talks about Regional Ethnic Autonomy, Religion and Work for Overseas Chinese in His Government Work Report. Available online: http://www.gov.cn/premier/2021-03/05/content_5590466.htm (accessed on 15 April 2021).
- Brundtland, G.H.; Khalid, M. Our Common Future; Oxford University Press: Oxford, UK, 1987. [Google Scholar]
- Brown, L.R. Building a sustainable society. Sociology 1982, 19, 75–85. [Google Scholar] [CrossRef]
- Costanza, R. Ecological Economics: The Science and Management of Sustainability; Columbia University Press: New York, NY, USA, 1992. [Google Scholar]
- Costanza, R.; Patten, B.C. Defining and predicting sustainability. Ecol. Econ. 1995, 15, 193–196. [Google Scholar] [CrossRef]
- Faber, N.; Jorna, R.; Van Engelen, J. The sustainability of “sustainability”—A study into the conceptual foundations of the notion of “sustainability”. In Tools, Techniques and Approaches for Sustainability: Collected Writings in Environmental Assessment Policy and Management; World Scientific: Singapore, 2010; pp. 337–369. [Google Scholar]
- Jørgensen, A.; Herrmann, I.T.; Bjørn, A. Analysis of the link between a definition of sustainability and the life cycle methodologies. Int. J. Life Cycle Assess 2013, 18, 1440–1449. [Google Scholar] [CrossRef] [Green Version]
- Liu, Y.S. Introduction to land use and rural sustainability in China. Land Use Policy 2018, 74, 1–4. [Google Scholar] [CrossRef]
- Moore, J.E.; Mascarenhas, A.; Bain, J.; Straus, S.E. Developing a comprehensive definition of sustainability. Implement. Sci. 2017, 12, 1–8. [Google Scholar] [CrossRef] [PubMed]
- Purvis, B.; Mao, Y.; Robinson, D. Three pillars of sustainability: In search of conceptual origins. Sustain. Sci. 2019, 14, 681–695. [Google Scholar] [CrossRef] [Green Version]
- Ramos, T.; Caeiro, S. Meta-performance evaluation of sustainability indicators. Ecol. Indic. 2010, 10, 157–166. [Google Scholar] [CrossRef] [Green Version]
- Ranjbari, M.; Esfandabadi, Z.S.; Zanetti, M.C.; Scagnelli, S.D.; Siebers, P.-O.; Aghbashlo, M.; Peng, W.; Quatraro, F.; Tabatabaei, M. Three pillars of sustainability in the wake of COVID-19: A systematic review and future research agenda for sustainable development. J. Clean. Prod. 2021, 297, 126660. [Google Scholar] [CrossRef]
- Álvarez-Herranz, A.; Macedo-Ruíz, E.J.S. An evaluation of the three pillars of sustainability in cities with high Airbnb presence: A case study of the city of Madrid. Sustainability 2021, 13, 3220. [Google Scholar] [CrossRef]
- Asche, F.; Garlock, T.M.; Anderson, J.L.; Bush, S.R.; Smith, M.D.; Anderson, C.M.; Chu, J.; Garrett, K.A.; Lem, A.; Lorenzen, K.; et al. Three pillars of sustainability in fisheries. Proc. Natl. Acad. Sci. USA 2018, 115, 11221–11225. [Google Scholar] [CrossRef] [PubMed] [Green Version]
- Boussemart, J.-P.; Leleu, H.; Shen, Z.; Valdmanis, V. Performance analysis for three pillars of sustainability. J. Prod. Anal. 2020, 53, 305–320. [Google Scholar] [CrossRef]
- Heijungs, R.; Huppes, G.; Guinée, J. Life cycle assessment and sustainability analysis of products, materials and technologies. Toward a scientific framework for sustainability life cycle analysis. Polym. Degrad. Stab. 2010, 95, 422–428. [Google Scholar] [CrossRef]
- Stojčić, M.; Zavadskas, E.K.; Pamučar, D.; Stević, Ž.; Mardani, A.J.S. Application of MCDM methods in sustainability engineering: A literature review 2008–2018. Symmetry 2019, 11, 350. [Google Scholar] [CrossRef] [Green Version]
- Nardo, M.; Saisana, M.; Saltelli, A.; Tarantola, S.; Hoffmann, A.; Giovannini, E. Handbook on Constructing Composite Indicators: Methodology and User Guide; OECD: Paris, France, 2008. [Google Scholar]
- Zhou, L.; Tokos, H.; Krajnc, D.; Yang, Y. Sustainability performance evaluation in industry by composite sustainability index. Clean Technol. Environ. Policy 2012, 14, 789–803. [Google Scholar] [CrossRef]
- Chen, Y.; Li, W.; Yi, P. Evaluation of city innovation capability using the TOPSIS-based order relation method: The case of Liaoning province, China. Technol. Soc. 2020, 63, 101330. [Google Scholar] [CrossRef]
- Li, W.; Yi, P. Assessment of city sustainability—Coupling coordinated development among economy, society and environment. J. Clean. Prod. 2020, 256, 120453. [Google Scholar] [CrossRef]
- Yi, P.; Li, W.; Zhang, D. Sustainability assessment and key factors identification of first-tier cities in China. J. Clean. Prod. 2021, 281, 125369. [Google Scholar] [CrossRef]
- Sun, G.; Guan, X.; Yi, X.; Zhou, Z. Grey relational analysis between hesitant fuzzy sets with applications to pattern recognition. Expert Syst. Appl. 2018, 92, 521–532. [Google Scholar] [CrossRef]
- Tang, J.; Zhu, H.-L.; Liu, Z.; Jia, F.; Zheng, X.-X. Urban sustainability evaluation under the modified TOPSIS based on grey relational analysis. Int. J. Environ. Res. Public Health 2019, 16, 256. [Google Scholar] [CrossRef] [Green Version]
- Kuo, Y.; Yang, T.; Huang, G.-W. The use of grey relational analysis in solving multiple attribute decision-making problems. Comput. Ind. Eng. 2008, 55, 80–93. [Google Scholar] [CrossRef]
- Li, W.; Yi, P.; Zhang, D. Investigation of sustainability and key factors of Shenyang city in China using GRA and SRA methods. Sustain. Cities Soc. 2021, 68, 102796. [Google Scholar] [CrossRef]
- Chang, K.-H.; Chang, Y.-C.; Tsai, I.-T. Enhancing FMEA assessment by integrating grey relational analysis and the decision making trial and evaluation laboratory approach. Eng. Fail. Anal. 2013, 31, 211–224. [Google Scholar] [CrossRef]
- Chan, J.W.K.; Tong, T.K.L. Multi-criteria material selections and end-of-life product strategy: Grey relational analysis approach. Mater. Des. 2007, 28, 1539–1546. [Google Scholar] [CrossRef]
- Alptekin, O.; Alptekin, N.; Saraç, B. Evaluation of low carbon development of European Union countries and Turkey using grey relational analysis. Teh. Vjesn.-Tech. Gaz. 2018, 25, 1497–1505. [Google Scholar] [CrossRef] [Green Version]
- Altintas, K.; Vayvay, O.; Apak, S.; Cobanoglu, E. An extended GRA method integrated with Fuzzy AHP to construct a multidimensional index for ranking overall energy sustainability performances. Sustainability 2020, 12, 1602. [Google Scholar] [CrossRef] [Green Version]
- Kose, E.; Vural, D.; Canbulut, G. The most livable city selection in Turkey with the grey relational analysis. Grey Syst. Theory Appl. 2020, 10, 529–544. [Google Scholar] [CrossRef]
- Abid, N.; Ikram, M.; Wu, J.; Ferasso, M. Towards environmental sustainability: Exploring the nexus among ISO 14001, governance indicators and green economy in Pakistan. Sustain. Prod. Consum. 2021, 27, 653–666. [Google Scholar] [CrossRef]
- Zhang, W.; Zhang, X.; Liu, F.; Huang, Y.; Xie, Y. Evaluation of the urban low-carbon sustainable development capability based on the TOPSIS-BP neural network and grey relational analysis. Complexity 2020, 2020, 1–16. [Google Scholar] [CrossRef]
- Keqin, Z. Set pair analysis and its prelimiary application. Explor. Nat. 1994, 1, 3–47. [Google Scholar]
- Aili, Z.K.X. Set pair theory—A new theory method of non-define and its applications. Syst. Eng. 1996, 1, 003. [Google Scholar]
- Jiang, Y.-L.; Xu, C.-F.; Yao, Y.; Zhao, K.-Q. Systems information in set pair analysis and its applications. In Proceedings of the 2004 International Conference on Machine Learning and Cybernetics (IEEE Cat. No.04EX826), Shanghai, China, 26–29 August 2005; pp. 1717–1722. [Google Scholar] [CrossRef]
- Wang, W.; Jin, J.; Ding, J.; Li, Y. A new approach to water resources system assessment—Set pair analysis method. Sci. China Ser. E Technol. Sci. 2009, 52, 3017–3023. [Google Scholar] [CrossRef]
- Wang, Z.X.; Wang, H.; Wang, Q.L. Set pair analysis of sustainability comprehensive assessment in surface mining area. Opencast Min. Technol. 2010, 05, 05–0055. [Google Scholar] [CrossRef]
- Wang, Y.; Zhou, L. Assessment of the coordination ability of sustainable social-ecological systems development based on a set pair analysis: A case study in Yanchi County, China. Sustainability 2016, 8, 733. [Google Scholar] [CrossRef] [Green Version]
- Luan, W.; Lu, L.; Li, X.; Ma, C. Integrating extended fourier amplitude sensitivity test and set pair analysis for sustainable development evaluation from the view of uncertainty analysis. Sustainability 2018, 10, 2435. [Google Scholar] [CrossRef] [Green Version]
- Wen, S.H.; Wen, X.F.; An, Y. Analysis of sustainability of the dryland farming with limited irrigation based on DPSIR model in Tongxin, Ningxia Hui Autonomous Region. Res. Soil Water Conserv. 2011, 18, 231–235. [Google Scholar]
- Zhou, Y.; Yi, P.; Li, W.; Gong, C.J.S.C. Assessment of city sustainability from the perspective of multi-source data-driven. Sustain. Cities Soc. 2021, 70, 102918. [Google Scholar] [CrossRef]
- Xu, M.; Hu, W.-Q. A research on coordination between economy, society and environment in China: A case study of Jiangsu. J. Clean. Prod. 2020, 258, 120641. [Google Scholar] [CrossRef]
- Cui, X.; Fang, C.; Liu, H.; Liu, X. Assessing sustainability of urbanization by a coordinated development index for an urbanization-resources-environment complex system: A case study of Jing-Jin-Ji region, China. Ecol. Indic. 2019, 96, 383–391. [Google Scholar] [CrossRef]
- Li, Y.; Li, Y.; Zhou, Y.; Shi, Y.; Zhu, X. Investigation of a coupling model of coordination between urbanization and the environment. J. Environ. Manag. 2012, 98, 127–133. [Google Scholar] [CrossRef]
- Saaty, T.L. Group Decision Making and the AHP. In The Analytic Hierarchy Process; Springer: Berlin/Heidelberg, Germany, 1989; pp. 59–67. [Google Scholar]
- Dong, H.; Feng, Z.; Yang, Y.; Li, P.; You, Z. Dynamic assessment of ecological sustainability and the associated driving factors in Tibet and its cities. Sci. Total. Environ 2021, 759, 143552. [Google Scholar] [CrossRef]
- Han, Z.; Song, W. Spatiotemporal variations in cropland abandonment in the Guizhou–Guangxi karst mountain area, China. J. Clean. Prod. 2019, 238, 117888. [Google Scholar] [CrossRef]
- Li, D.; Wu, R. A dynamic analysis of green productivity growth for cities in Xinjiang. Sustainability 2018, 10, 515. [Google Scholar] [CrossRef] [Green Version]
- Liu, L.; Liu, J.; Zhang, Z.J.S. Environmental justice and sustainability impact assessment: In search of solutions to ethnic con-flicts caused by coal mining in Inner Mongolia, China. Sustainability 2014, 6, 8756–8774. [Google Scholar] [CrossRef] [Green Version]
- Wei, Q. Sustainability evaluation of photovoltaic poverty alleviation projects using an integrated MCDM method: A case study in Guangxi, China. J. Clean. Prod. 2021, 302, 127040. [Google Scholar] [CrossRef]
- Yi, P.; Lu, W.; Zhang, D.; Li, W. Sustainability assessment of provincial-level regions in China using composite sustainable indicator. Sustainability 2019, 11, 5289. [Google Scholar] [CrossRef] [Green Version]
Publisher’s Note: MDPI stays neutral with regard to jurisdictional claims in published maps and institutional affiliations. |
© 2021 by the authors. Licensee MDPI, Basel, Switzerland. This article is an open access article distributed under the terms and conditions of the Creative Commons Attribution (CC BY) license (https://creativecommons.org/licenses/by/4.0/).

