Article

Lost but Not Forgotten: Identifying Unmapped and Unlisted Environmental Hazards including Abandoned Mines

School of Life Sciences, University of Technology Sydney, P.O. Box 123, Sydney, NSW 2007, Australia
*
Author to whom correspondence should be addressed.
Sustainability 2021, 13(19), 11011; https://doi.org/10.3390/su131911011
Submission received: 18 June 2021 / Revised: 23 September 2021 / Accepted: 28 September 2021 / Published: 4 October 2021
(This article belongs to the Special Issue Environmental Hazards: Assessing Risk and Reducing Disaster)

Abstract

:
Environmental databases play an essential role in the management of land and communities, including mapping and monitoring environmental hazards over time (i.e., abandoned mines). Over the last century, mines have closed for many reasons, but there has been no comprehensive database of the locations of closed and abandoned mine sites kept for many regions of the world. As such, the locations of many mines have been lost from public knowledge, with no way for managers to assess the risks of land and water contamination, as well as subsidence. To address this knowledge gap, we present an integrated framework for identifying abandoned mine sites using a combination of satellite imagery, historical records, geographic evidence, and local knowledge. We tested this framework within the Newcastle, Illawarra, and Lithgow regions of NSW, Australia. We identified 61 abandoned coal mines which are currently unaccounted for in mine registries, with 56% of all mines in the Newcastle region being unmarked (N = 32), 36% in the Illawarra region (N = 22), and 20% in the Lithgow region (N = 7). These findings demonstrate that our framework has promising utility in identifying historic and unmarked environmental hazards in both national and international contexts.

1. Introduction

Environmental databases can provide a historical reference of species and conditions, often utilized to create and test models to predict future change and impacts [1,2,3,4]. Such databases play an essential role in the management of land and communities, with models now capable of predicting many important risks, from epidemiological analyses of health issues [5], species range shifts over time [3,4,6,7], assessment of bushfire severity [8] to the localized impacts of climate change [7,9]. A common goal of public databases is to accurately collect and organize large volumes of data in ways that will allow continuous updating. Ideally, this is done using open-source web-based systems which can be accessed and edited by relevant responsible stakeholders.
The use of databases is particularly important when examining issues over continuous timeframes. When databases are regularly updated with fresh and relevant information, large scale trends and patterns may become more apparent, leading to better decision-making capabilities. In this context, however, accurate information regarding particular environmental risks and degradation may be difficult to obtain. This is because records may be incomplete or absent, particularly where hazardous industrial activities may have been conducted prior to the introduction of modern approval and regulatory processes. Indeed, historic and hazardous land-use activities such as mining, gas works, smelters and the petroleum industry are a major source of land contamination and long-term ecological impairment [10,11,12,13,14]. Identifying such ‘lost’ environmental and hazardous legacies is a vital step toward remediating damaged ecosystems and mitigating impacts on public health and safety.
In the context of mining activities, countries such as the United States of America, Canada, and England all continue to experience environmental legacies as a result of mining [15,16,17,18,19,20,21,22]. While it might not be possible to determine the complete number of historical mines, several attempts have been made to collate these data, and to varying degrees display the information in databases and maps [23,24,25,26]. This is an important step in the identification and management of abandoned mines, however, the scale of the problem combined with a lack of funding has often meant producing accurate and up-to-date data, particularly on a national scale, is a significant problem. The importance of creating a national mining inventory within England and Wales was realized after privatisation of the mining sector resulted in the closure of many underground mines. As the mines were no longer actively managed, they filled with water, resulting in continued significant degradation of the nation’s waterways [27]. A study conducted for the UK Government’s Department of Environment, Food and Rural Affairs showed that abandoned mines within England and Wales may be polluting as much as 10% of the water bodies across the UK [28]. The UK coal authority provides an interactive map of mining activities across the UK [25]; however, very little information can be extracted from this map. Similarly, the Abandoned Mine Land Inventory System (AMLIS) portal is an initiative that aims to identify and remediate abandoned mines across the USA by combining the knowledge and resources of multiple levels of government, local tribes and organisations [24]. The initiative estimates that there are up to 500,000 abandoned mines throughout the country, many of which have been classified as a threat to environment and health. The US geological society is one of the partners that aims to collate the data from all departments and produce a national map. While this is a step in the right direction, currently no such map exists.
One country that has made a large-scale effort to not only identify, but also map the sites of abandoned mines is Canada. The National Orphaned and Abandoned Mines Initiative (NOAMI) is a multijurisdictional co-operative initiative among government, industry, Aboriginal traditional owners, and other associated organisations. While the program has a large scope, one of the main goals at the creation of NOAMI was to build an interactive web based national inventory, which was launched in 2015. Using the inventory, it is easy to see the impact abandoned mines have and continue to have within the country. For example, 749 places classified as abandoned sites have been classified as a potential threat to human health, and/or the environment. There are a further 6434 sites which are classified as unlikely or unable to impact human health or the environment [29]. Risk to human health covers risk of injury and or long-term sickness caused by accessing mine sites. Unstable ground, uncapped mining portables or the presence of gases, contaminated waters, and soils are all examples of triggers that may lead a site being classified as a potential threat using the NOAMI system.
Here, we present a framework for identifying unmapped and unlisted hazardous environmental legacies. The success of overseas programs such as NOAMI has relied heavily on government support and funding. We believe the easy to apply nature of this method may minimize the volume of resources which are currently needed to direct programs so large. Our approach integrates information from a diverse range of sources including government databases, local industry and historical publications, community records, personal accounts, as well as satellite imagery to spatially map environmental legacies that have until now been unlisted. Importantly, this approach has general applicability and could be applied to any type of industry that has left a legacy of currently unidentified environmental hazards. In the present study, we test the utility of our approach by indetifying hazardous environmental legacies resulting from a long history of coal mining in the Sydney Basin of eastern Australia. In previous times, collecting information of this nature concerning the spatial distribution of coal mines was not always of the highest priority. Indeed, prior to the worldwide tightening of mining industry standards, information about not only conditions of mines, but also locations of mines were rarely collected or centralized for easy access. This research sets out not only to identify missing mine sites, but also explore the importance of doing so by examining the legacy impacts of throughout the study area.
A framework such as this is a valuable land management tool, not only for Australian lands, but for all countries impacted by historical hazardous industries. The Sydney basin provides a unique opportunity to test this framework by examining the effects of coal mining in its various forms, as a variety of operational, recently closed, and abandoned underground coal mines are scattered across the basin. This research aims to i) present an integrated framework for identifying environmental hazards; ii) to test this framework within coal mining hot spots within the Sydney basin, and iii) to create examples of up-to-date maps. Using a multi-disciplinary approach, data collected using the new framework will be spatially mapped and compared to existing data on government databases. We aim to report likely raw materials on sites, site condition, and the potential ecological risks posed by the previously unidentified mines. The overarching goal of this framework is to provide an integrated yet simple, best-practice approach for environmental hazard identification that can be readily adapted for other purposes.

2. Materials and Methods
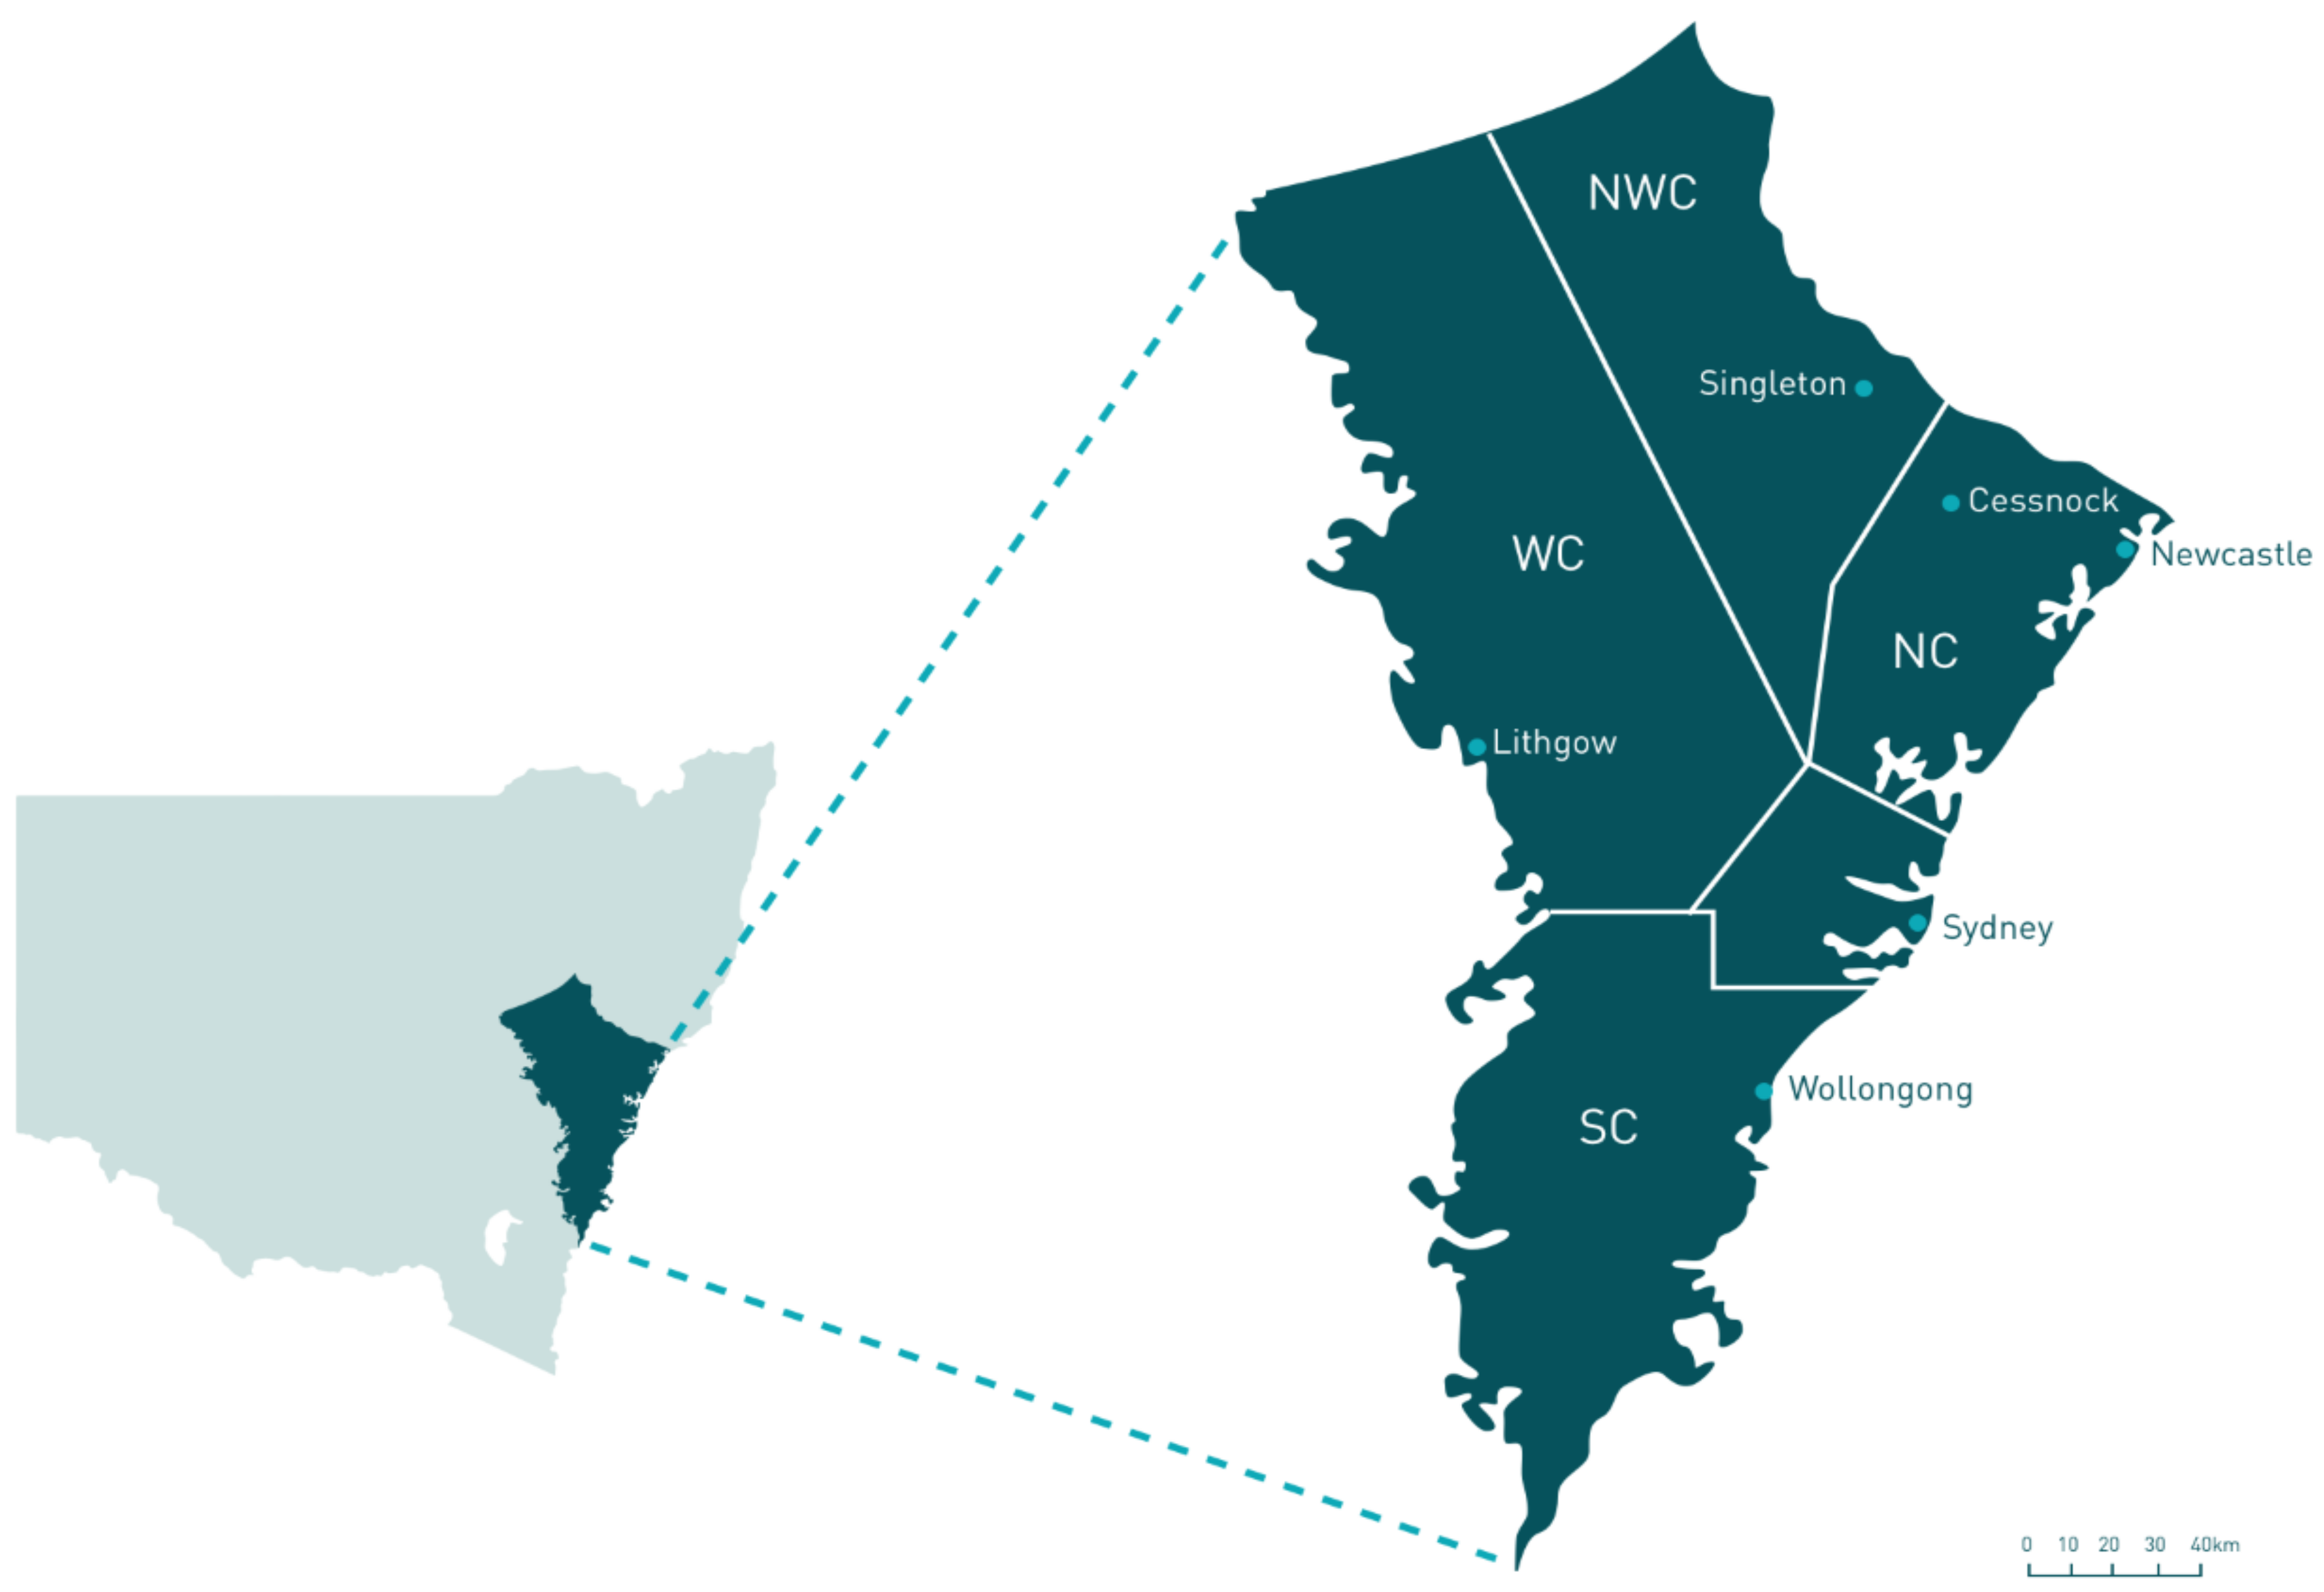
2.1. Study Regions

The heavy focus on mining in Australia is currently estimated to have resulted in as many as 55,000 abandoned mines scattered around the country [30]. In the State of New South Wales (NSW) in eastern Australia alone, there are currently estimated to be as many as 600 abandoned mines, with 112 situated on Crown land [31]. Furthermore, seven of these sites are currently considered to be high risk to both human health and the environment [32]. This problem is exacerbated by the lack of information regarding location and condition of many abandoned mines, with NSW lacking a sufficient database of relevant information [30]. Many of these sites have seen very little or no rehabilitation, resulting in large scale degradation of the surrounding landscape, which will likely continue into the future.
Of the states and territories across Australia, the Derelict Mines Program is run by NSW Planning and Environment and has the least up to date system in place, with no current mapping system available. While Queensland and Western Australia appear to be creating strong and transparent derelict and abandoned mines programs, very little has been done on a national scale. All states are independent of each other, and only one site, run by Geoscience Australia, has tried to provide a nation inventory with The Australian Mines Atlas. While this page is a fair source of information, many abandoned mines are not included within the atlas. The specific reasons for the inaccuracies are unclear; however, with the technologies now available, there is little reason why a comprehensive map comprising all mines and mining activities in Australia is not possible. One of the key objectives of the mines atlas is to provide an up to date, detailed site-specific information for mining sites within Australia [33]. While they may be providing this service for operational and recently closed mines, the information coming from the site is not sufficient when mapping the location of many historical operations.
Located on the east coast of Australia, the Sydney Basin is an area of Permian-Triassic sedimentary rock ranging from Batemans Bay in the South to Newcastle in the north. The Sydney Basin covers an area of 64,000 km2, and contains one the largest black coal reserves in the country. The Sydney Basin is divided into 4 smaller sub regional coalfields: the Northern Coalfield, around the city of Newcastle (NC); the North-Western Coalfield, centred around the Hunter Valley (NWC); the Western Coalfield, beginning at Lithgow (WC); and the Southern Coalfield, covering the Illawarra region (SC) (Figure 1). Presently, the largest production of mined materials comes from the North-Western Coalfield, with many active surface mining operations. As the aim of this research was to focus on ceased mining operations, the NWC was not included in this study.

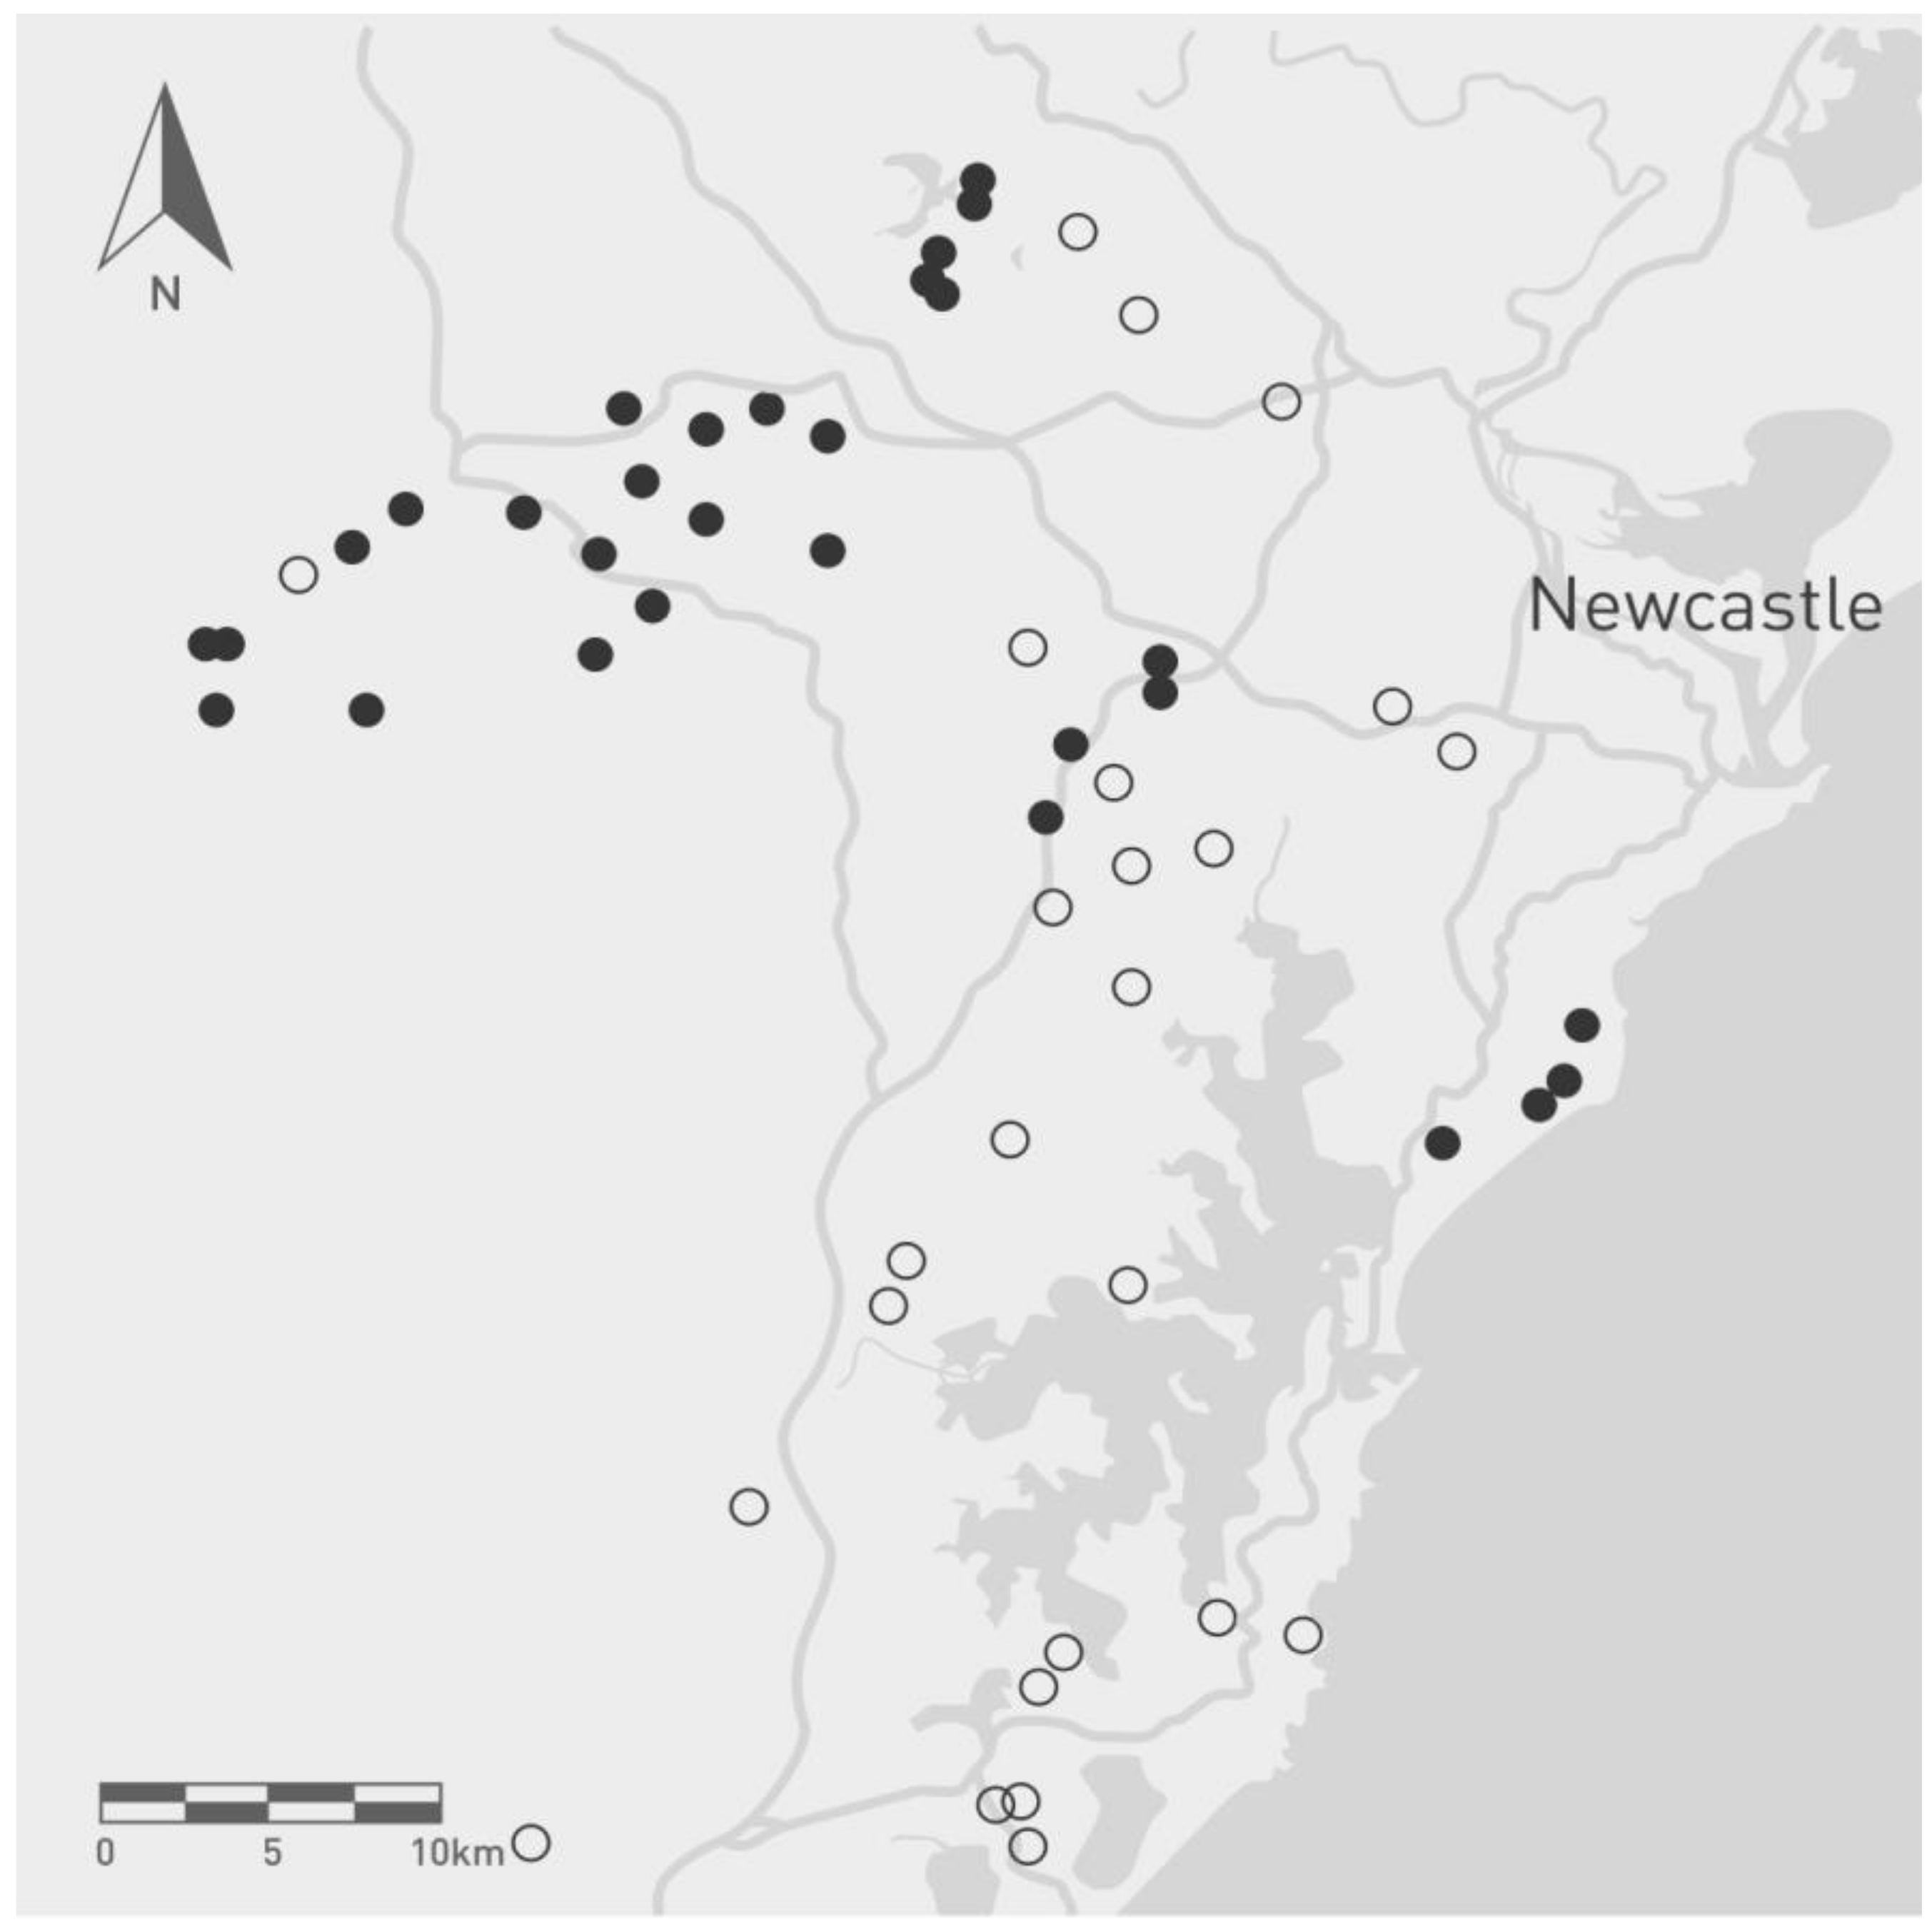
2.1.1. Sub-Region 1: Northern Coalfield (NC)

Now consisting of primarily vineyards and other agricultural industry, the Northern Coalfield was once subjected to heavy underground coal extraction. Located 200 km from Sydney and close to the coastal town of Newcastle, this area relied on the shallow, sulphur-rich coal reserves common in the area. At the peak of production in 1925, the industry employed more than 10,000 workers and produced a large amount of exportable coal [34]. Currently, 2000 people from the area are employed within the mining industry, however no new mines are planned as the focus shifts towards the north-western and western coalfields [35].

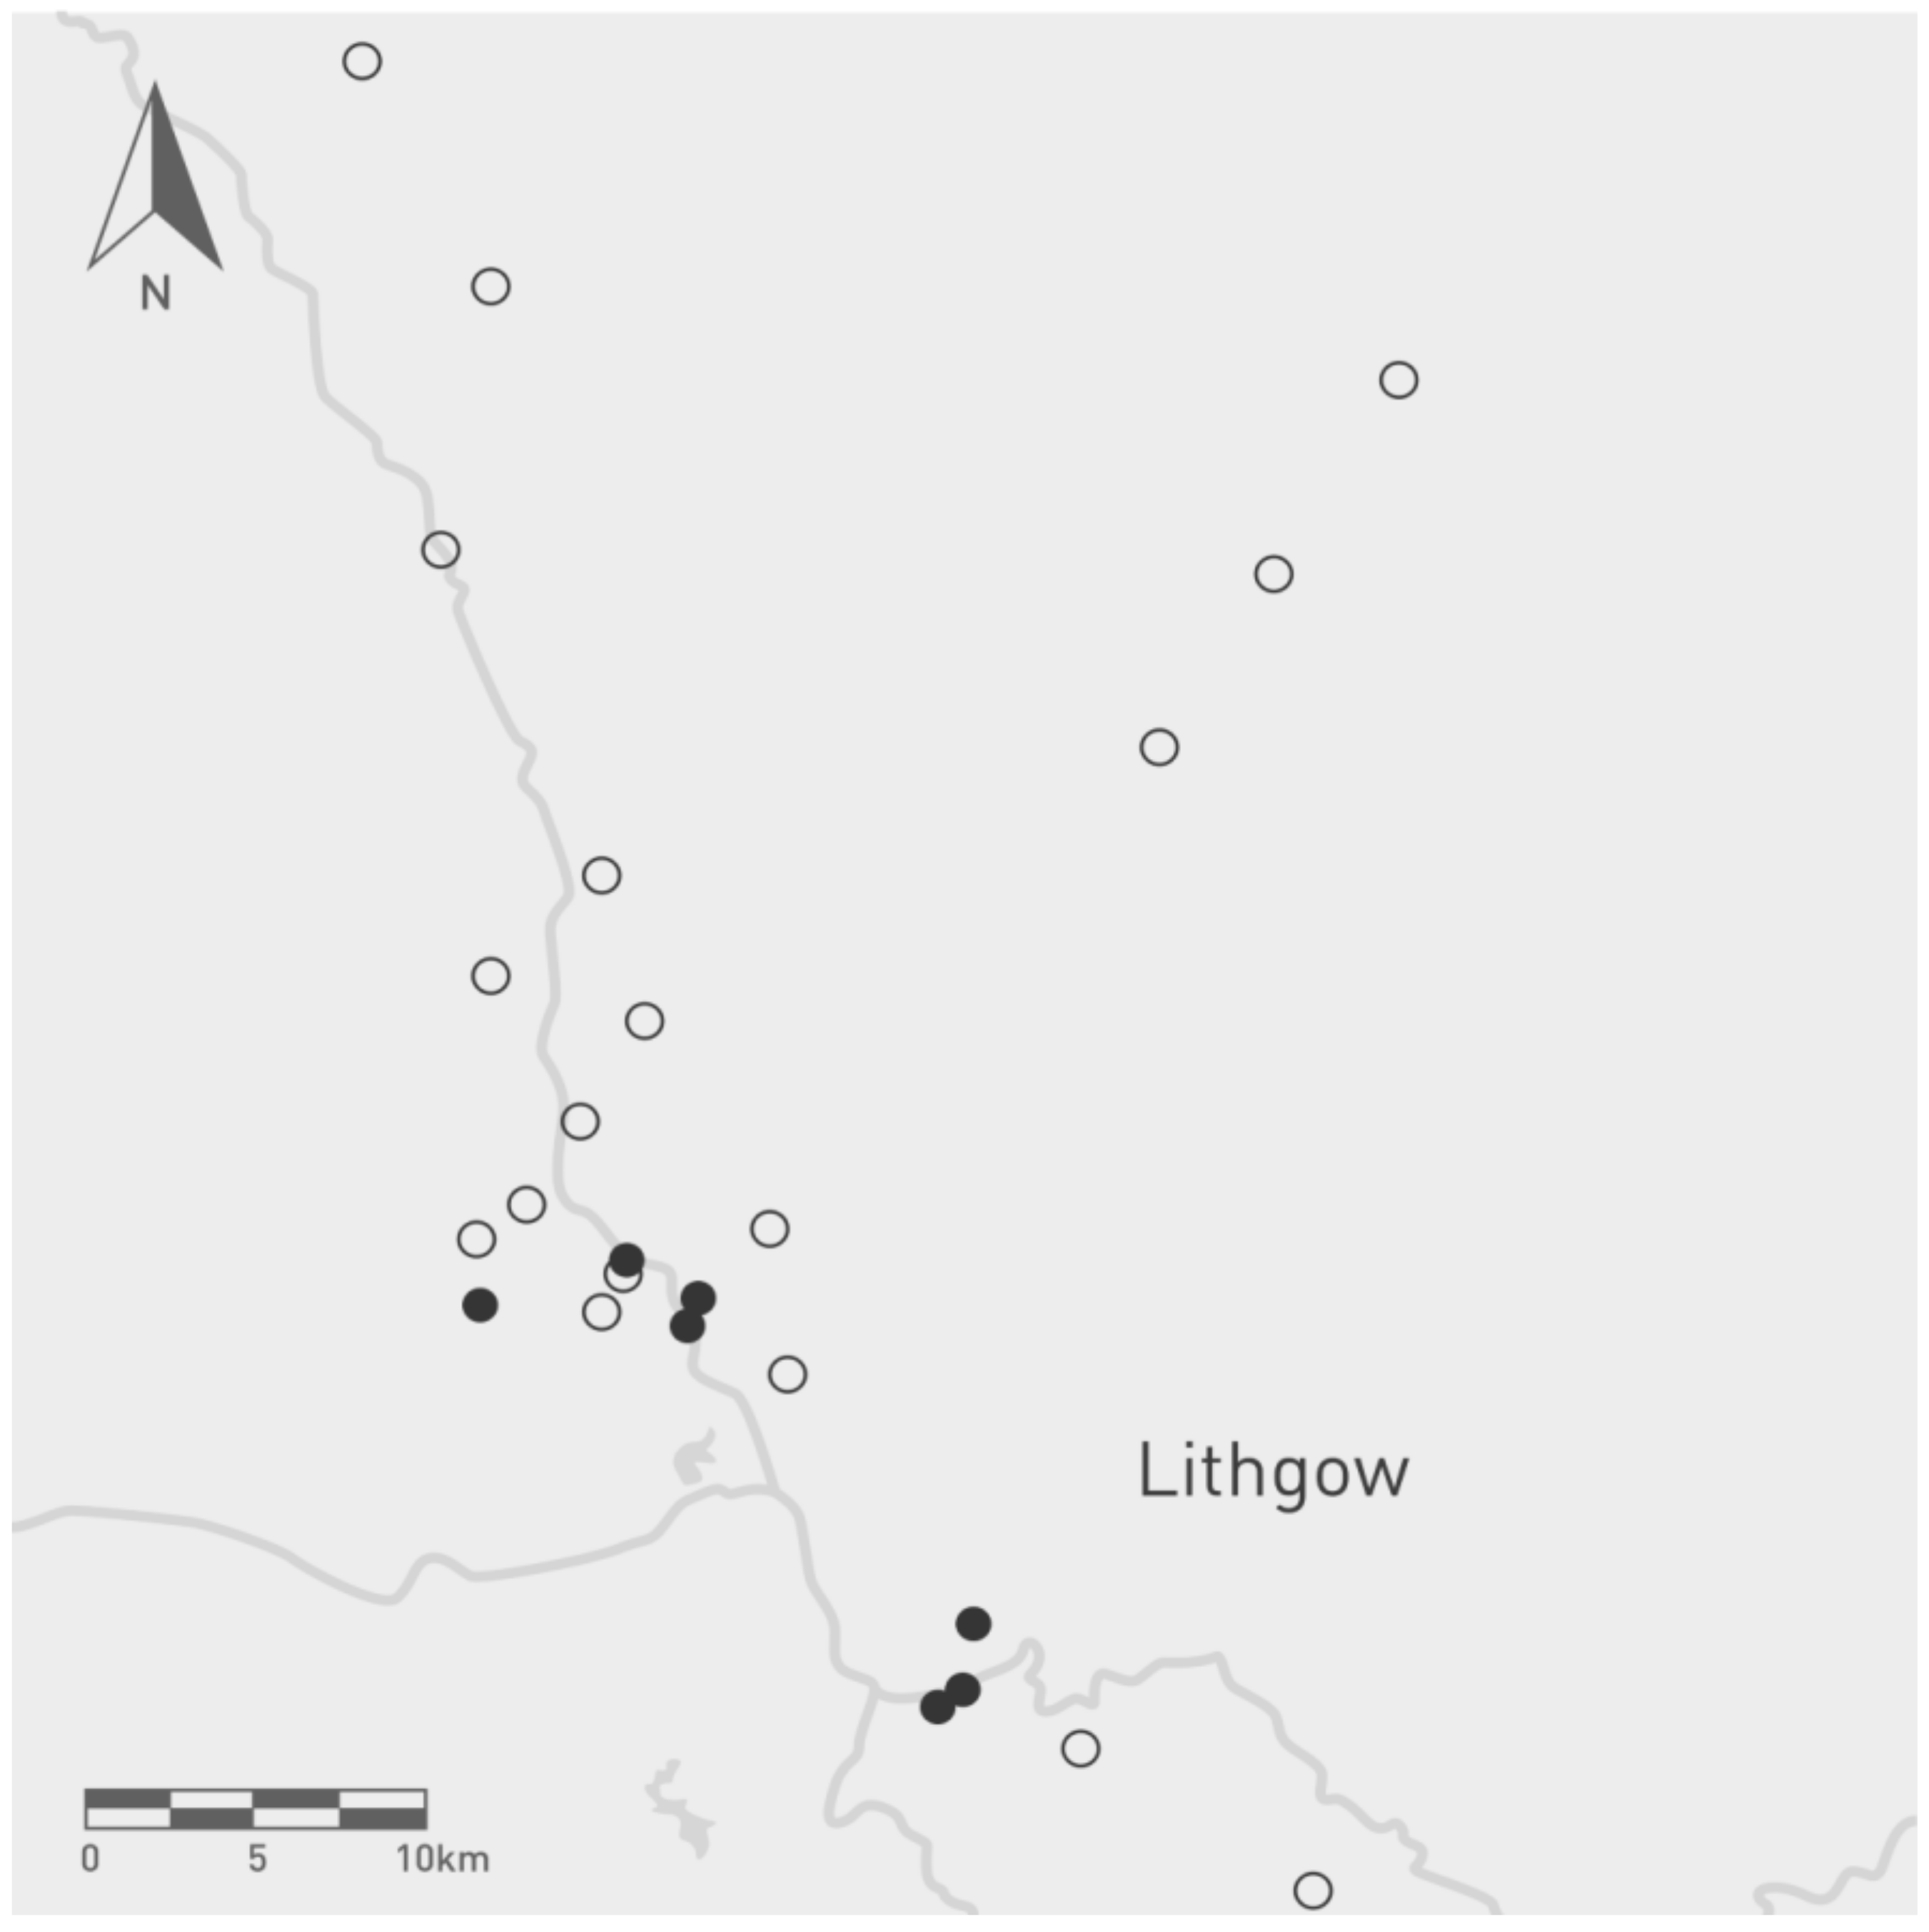
2.1.2. Sub-Region 2: Western Coalfield (WC)

The Western Coalfield begins approximately 100 km west of Sydney CBD and holds a high level or national and international importance. A large proportion of the coal reserve sits beneath The Greater Blue Mountains World Heritage Area (GBMWHA), which comprises the largest area of undisturbed, protected bushland in Australia. This area is also home to range or protected, threatened and endemic flora and fauna [36]. Of similar importance are the water production values within the area, with the majority of the Sydney city catchment falling within the western coalfield. While operations have slowed within the coalfield region, a mixture of underground and surface mining operations are still in production.

2.1.3. Sub-Region 3: Southern Coalfield (SC)

The Southern Coalfield is found within the Illawarra region 50 km south of Sydney. The area is considered a biodiversity hotspot, with a large amount of unique local flora and fauna [36]. The high biodiversity in this area is attributed to the steep rise from the coastal plane to a plateau which creates a rainforest environment rarely found in the Sydney area [36]. While the ecological importance is well known, the area is also a major coal mining region in NSW, with a large number of underground operations.

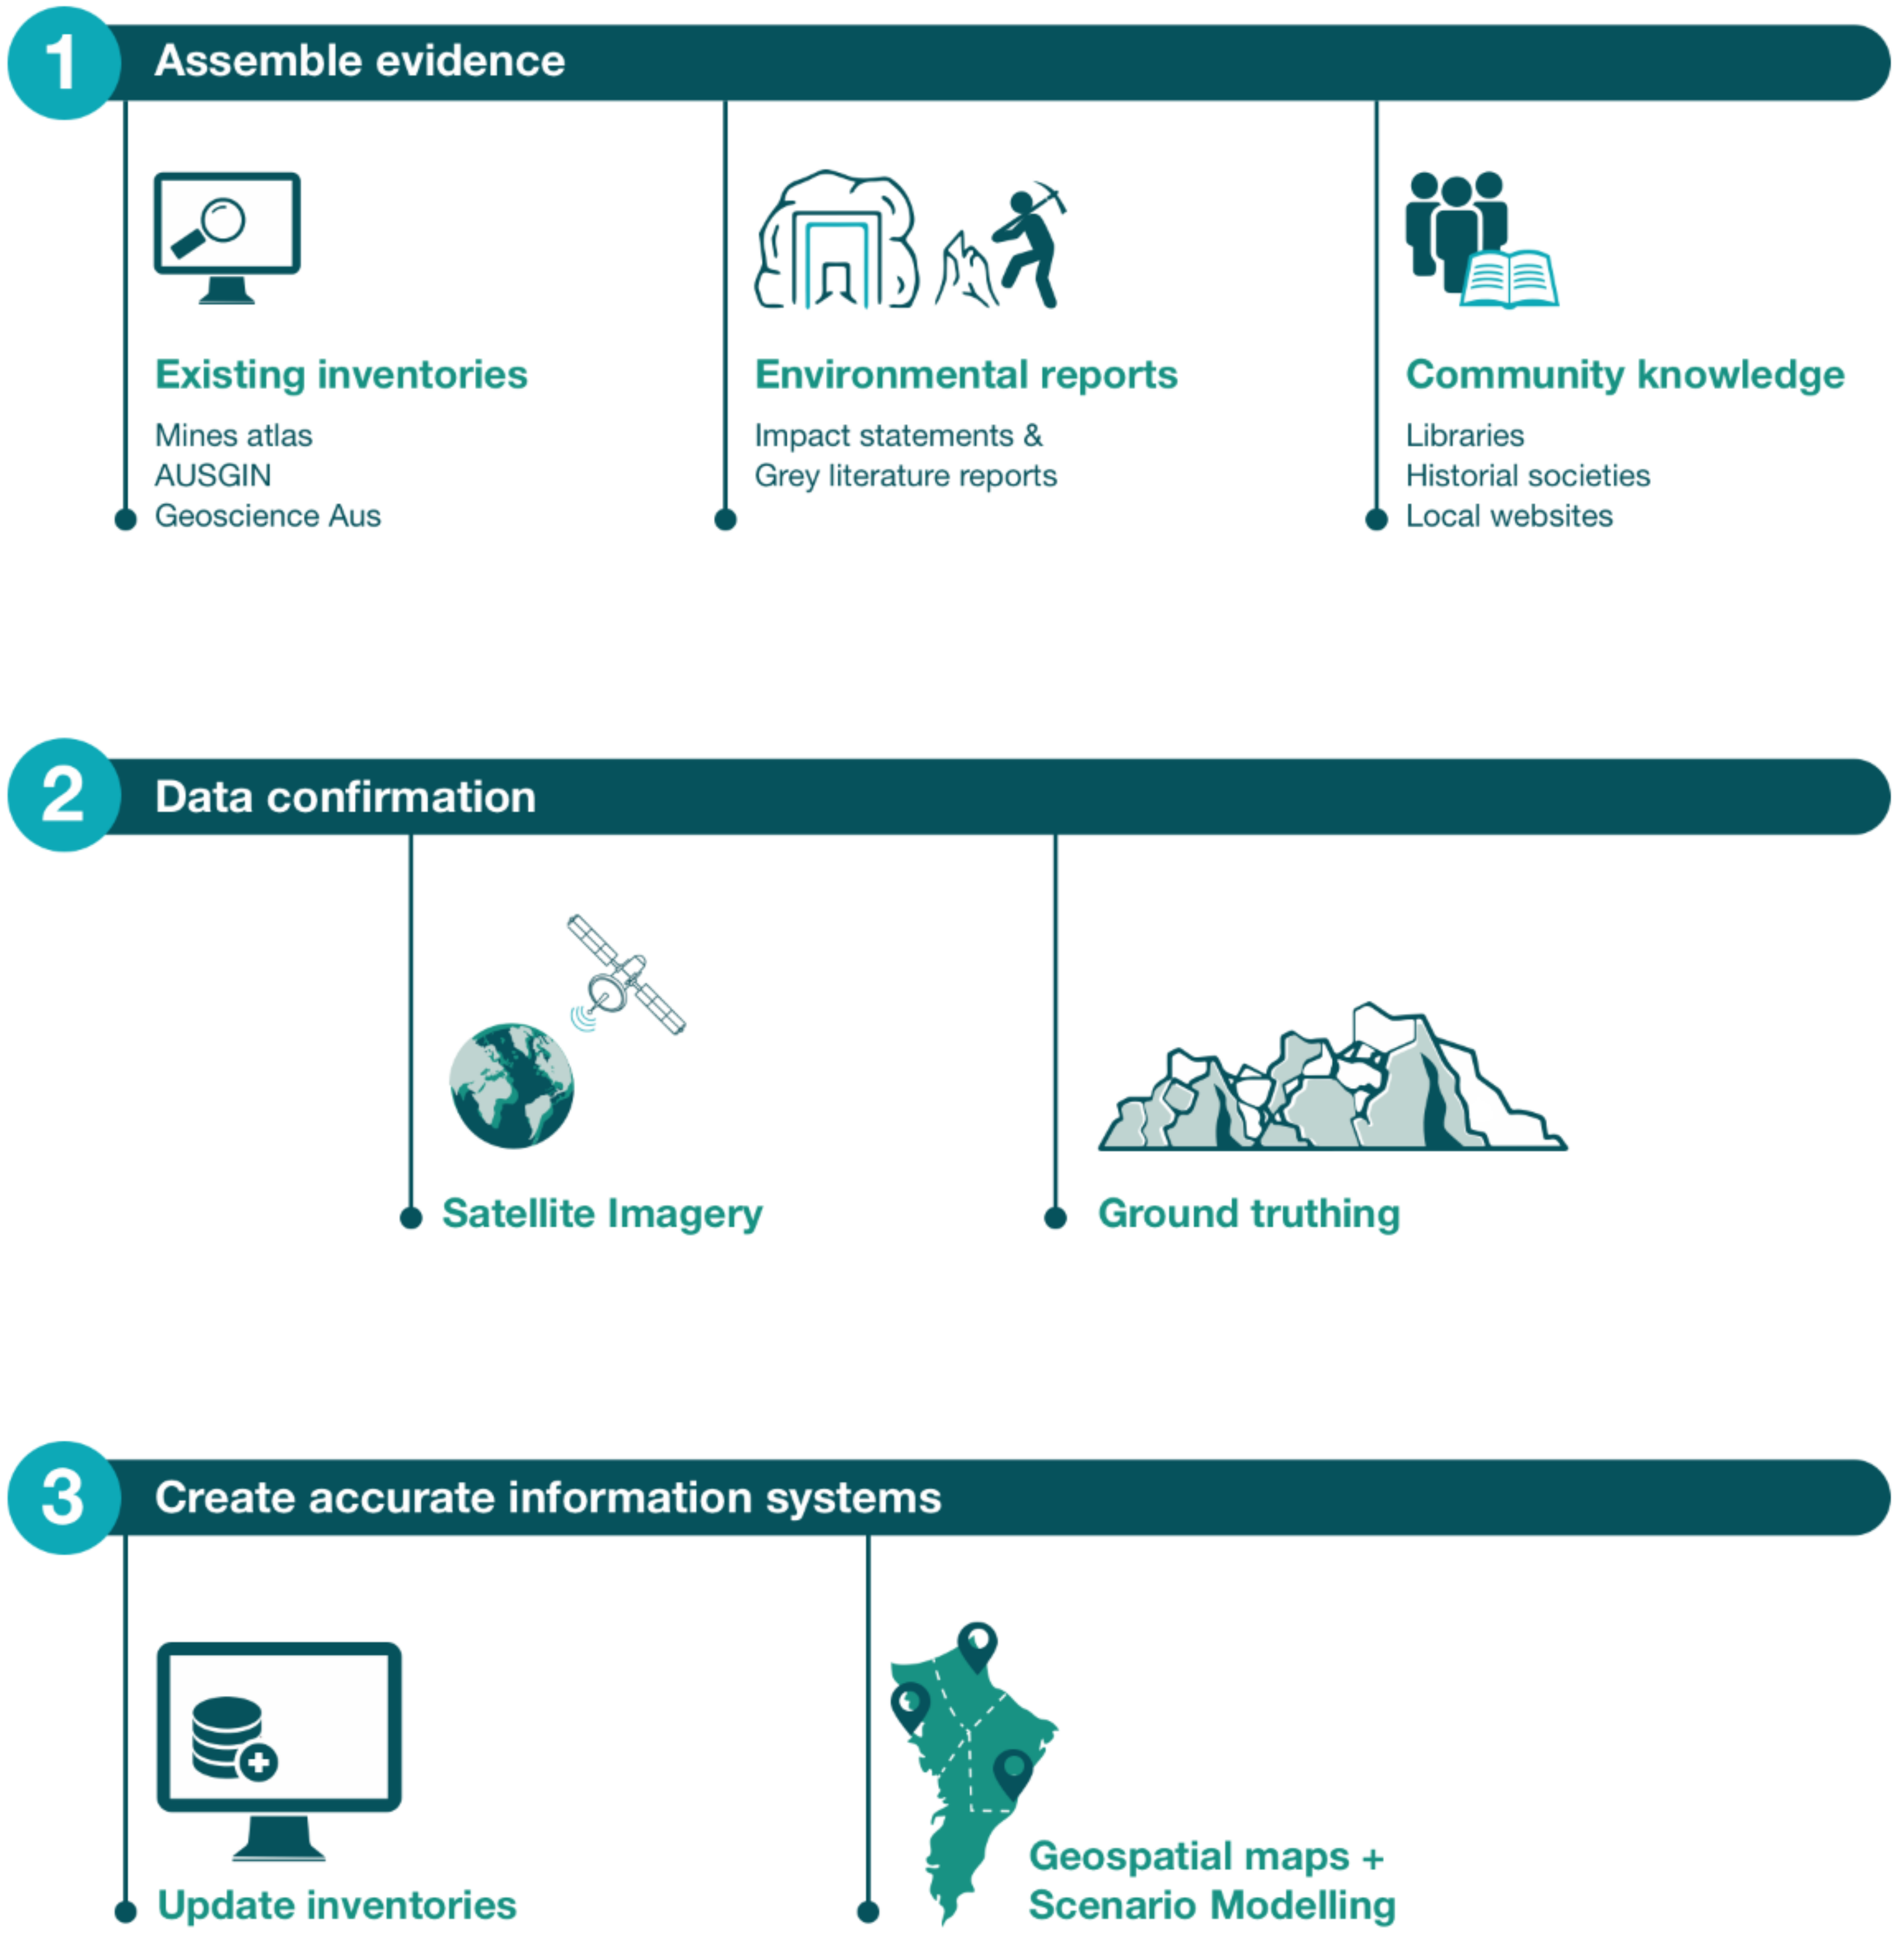
2.2. Framework for Identifying Unlisted and Unmarked Mines

The southern, western and northern parts of the Sydney Basin were examined independently of each other in an attempt to quantify the numbers and locations of all coal mining operations, both historical and currently active. To do this, we present a 3-step process to recover all possible information about previous mining operations within the designated areas (Figure 2). Underground coal mines currently listed on available databases are hereby referred to as marked mines, while mines found through implementation of this framework are referred to as unmarked mines.

2.2.1. Step 1. Assemble Evidence

Search of Government Databases and Existing Inventories

The first step was to consult all available government data relating to location of coal mines of all operational status. These data were collected primarily from local and state government reports and websites. For all areas, marked mines were identified using the government website “Australian Mines Atlas” and “Australian Geoscience Information Network (AUSGIN)”. These digital tools provided a base of knowledge for each designated area. From here, all other government data sourced from areas such as the Subsidence Board, NSW Minerals Council, local area council, and Office of Environment and Heritage were examined.

Examination of Historical Publications from Local Industries

The next step of the process was then to look into the local industries operating within the area. Large companies such as Broken Hill Propriety Ltd. (BHP), Glencore, Peabody Energy, Wollongong Coal, and Coal and Allied were all used to collected information about the current mining operations of my sample areas. All of these operators provide reasonably detailed information regarding current operations, future planning, history, and rehabilitation records of previous projects.

Investigation of Local Knowledge via Community Records and Personal Accounts

The third and often most fruitful step comes from collecting local knowledge. Here, a range of different stake holders were engaged with, including historians, environmental groups, libraries, newspapers and universities. All of these different groups and organisations provided access to a range of resources including websites, journals, grey literature, reports and books. For each of the three study sites, this step is where the majority of previously unknown sites were located. Two areas of local knowledge in particular stood out against the others: the environmental groups following mining pollution events; and the historians documenting the building of industry within communities. We found many environmental groups had significant local knowledge and were good at engaging media to get their message of mine pollution out into the community. Similarly, as coal mining and their associated rail once played a large part in building of these areas, the detail included in many of these books, websites, and reports was invaluable.

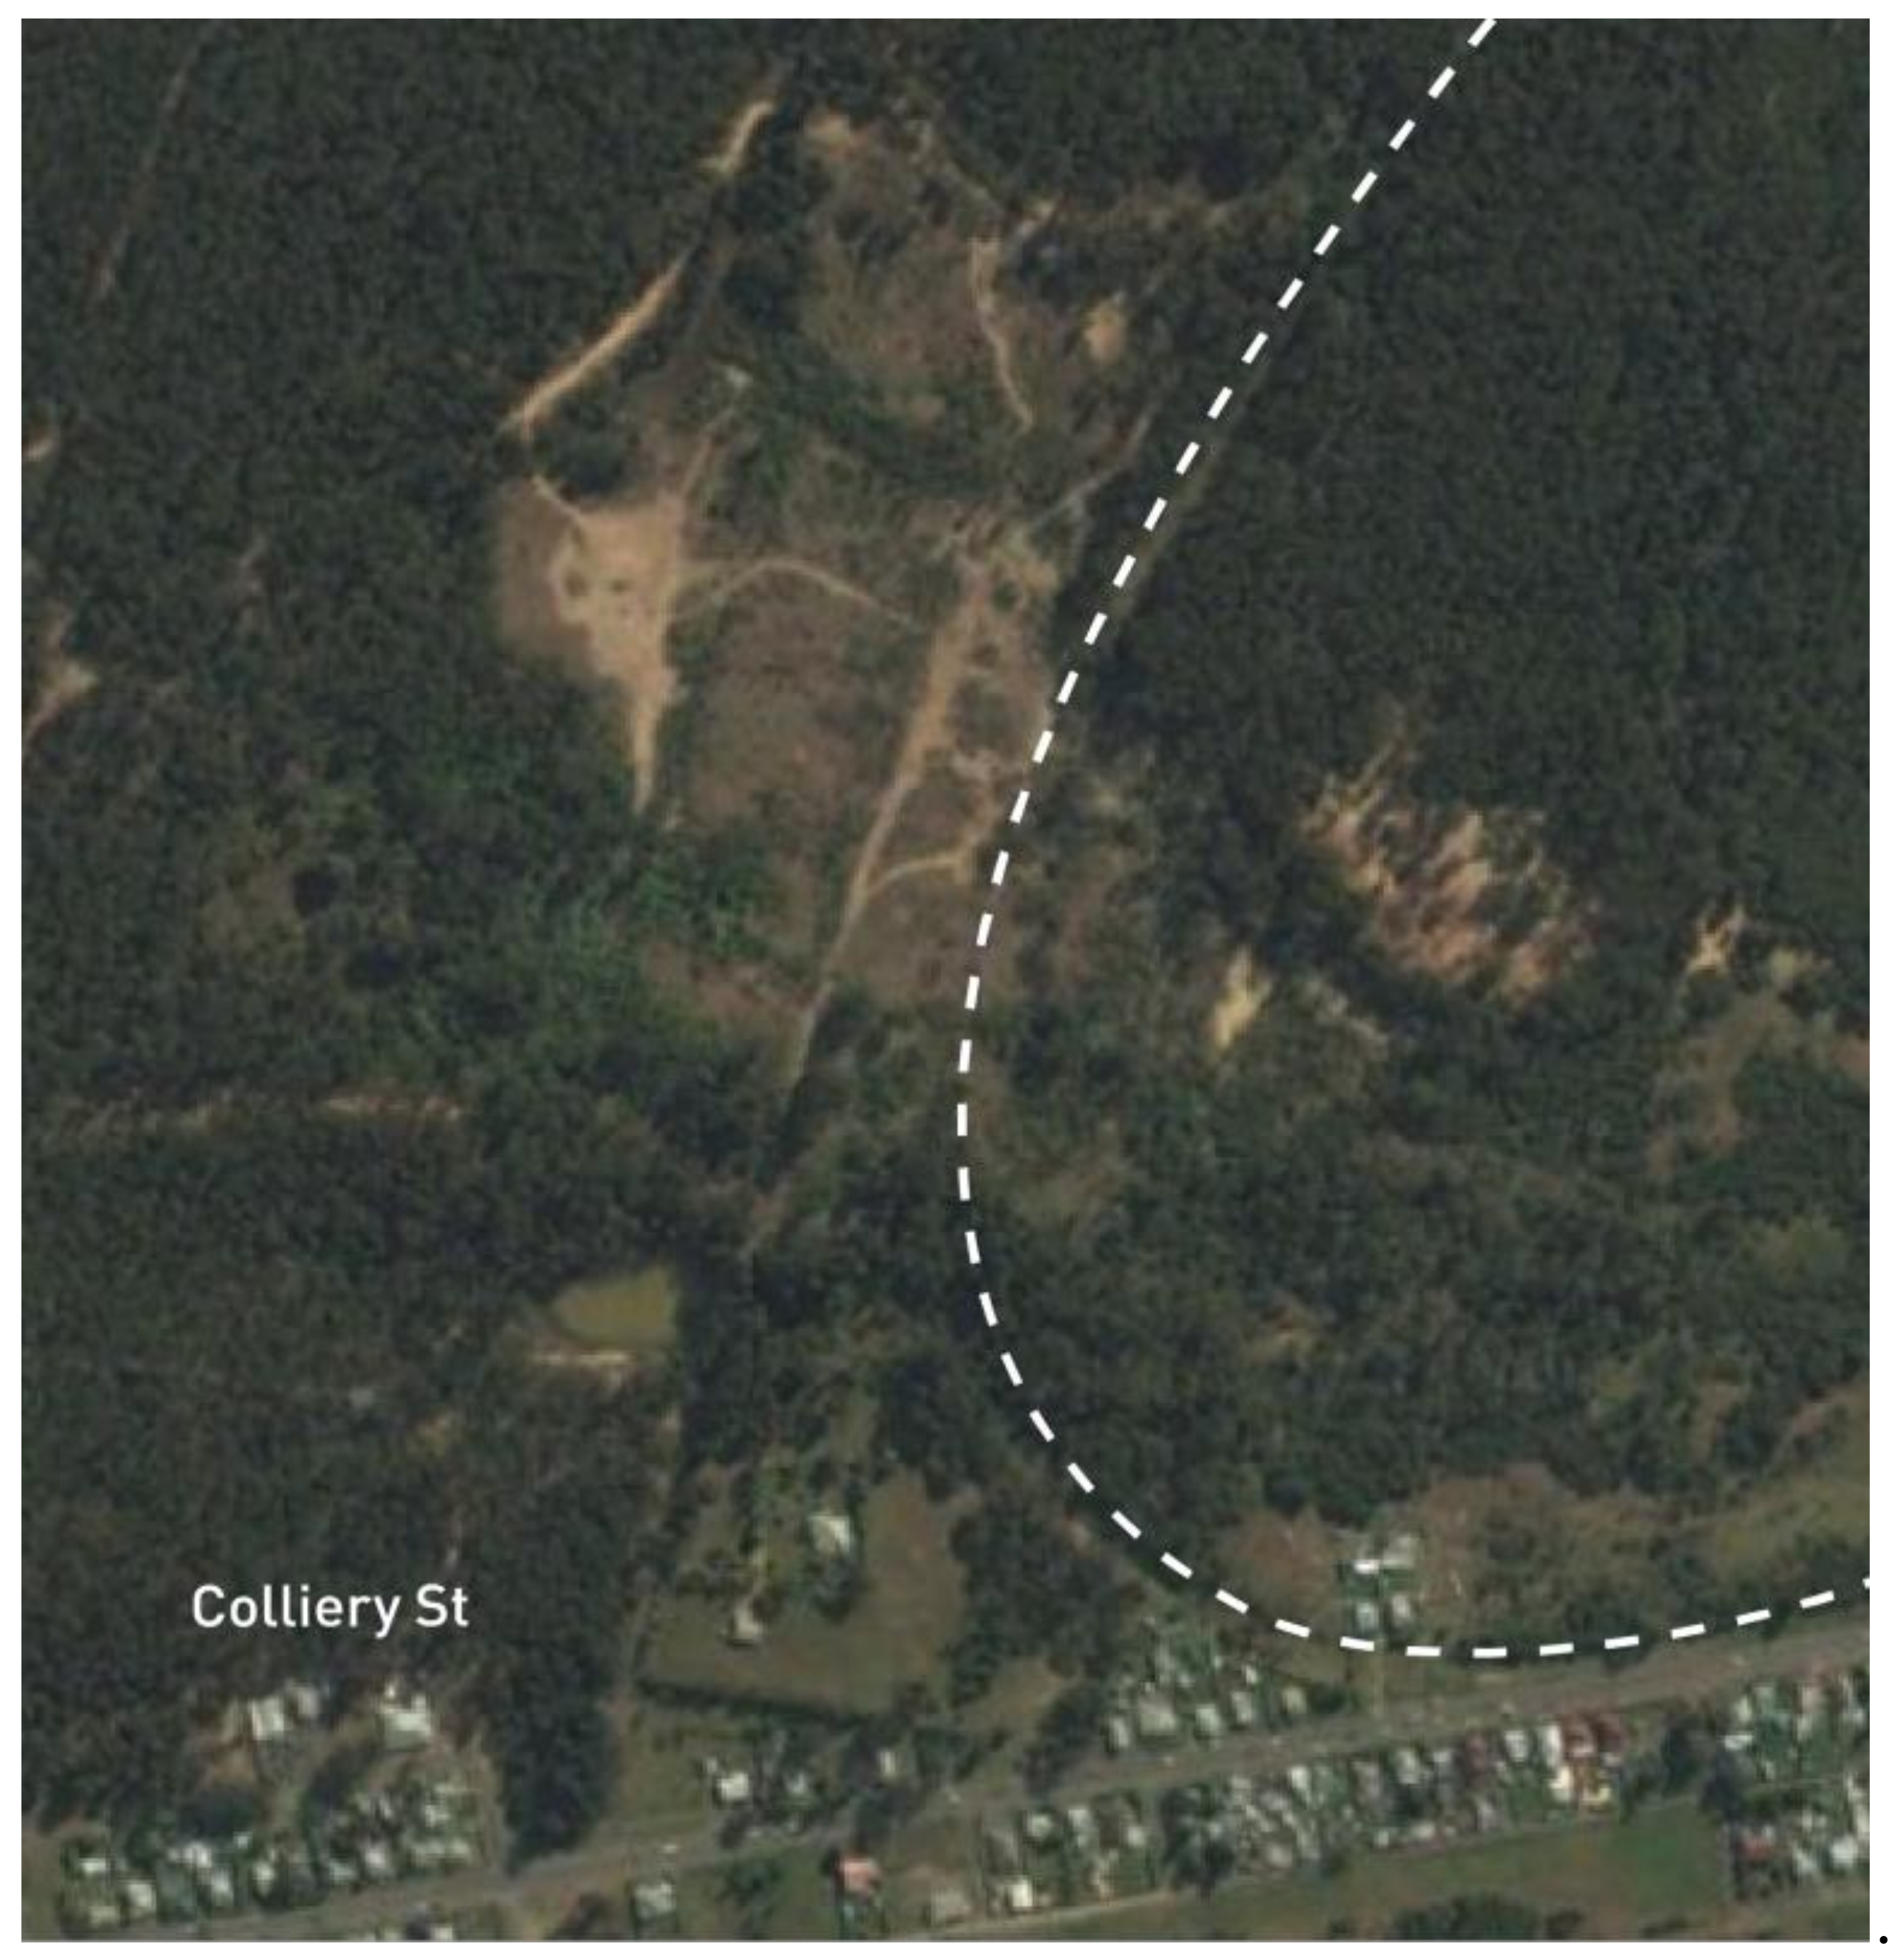
2.2.2. Step 2. Data Confirmation

A mixture of satellite imaging and ground truthing was used to identify the exact location of the mines listed. Image analysis followed a similar method to [37] where images from the most recent cloud free day were sourced from Google Earth Pro, version 9.142.0.1 CNES Airbus satellite. All images examined at a scale of 100 m with eye altitude of 1600 m. Much of the information came with coordinates or a general location, however these were often found to be inaccurate following satellite map analysis. The exact locations of many of the historical mine sites were found through examining maps and satellite images of the focal regions. A range of particular markers were identified, with common markers including the presence of equipment, capped mine entry points, unusual water bodies, and the visible presence of coal chitter piles (Figure 3). Other markers include nearby streets named after mining-related activities (e.g., Colliery St), and long, linear ‘scars’ in the landscape left behind by old railway lines (Figure 4) and cement covered portals all further helped to identify the exact location of many long-closed mining operations with a high degree of certainty.

2.2.3. Step 3. Establish Accurate Information Systems
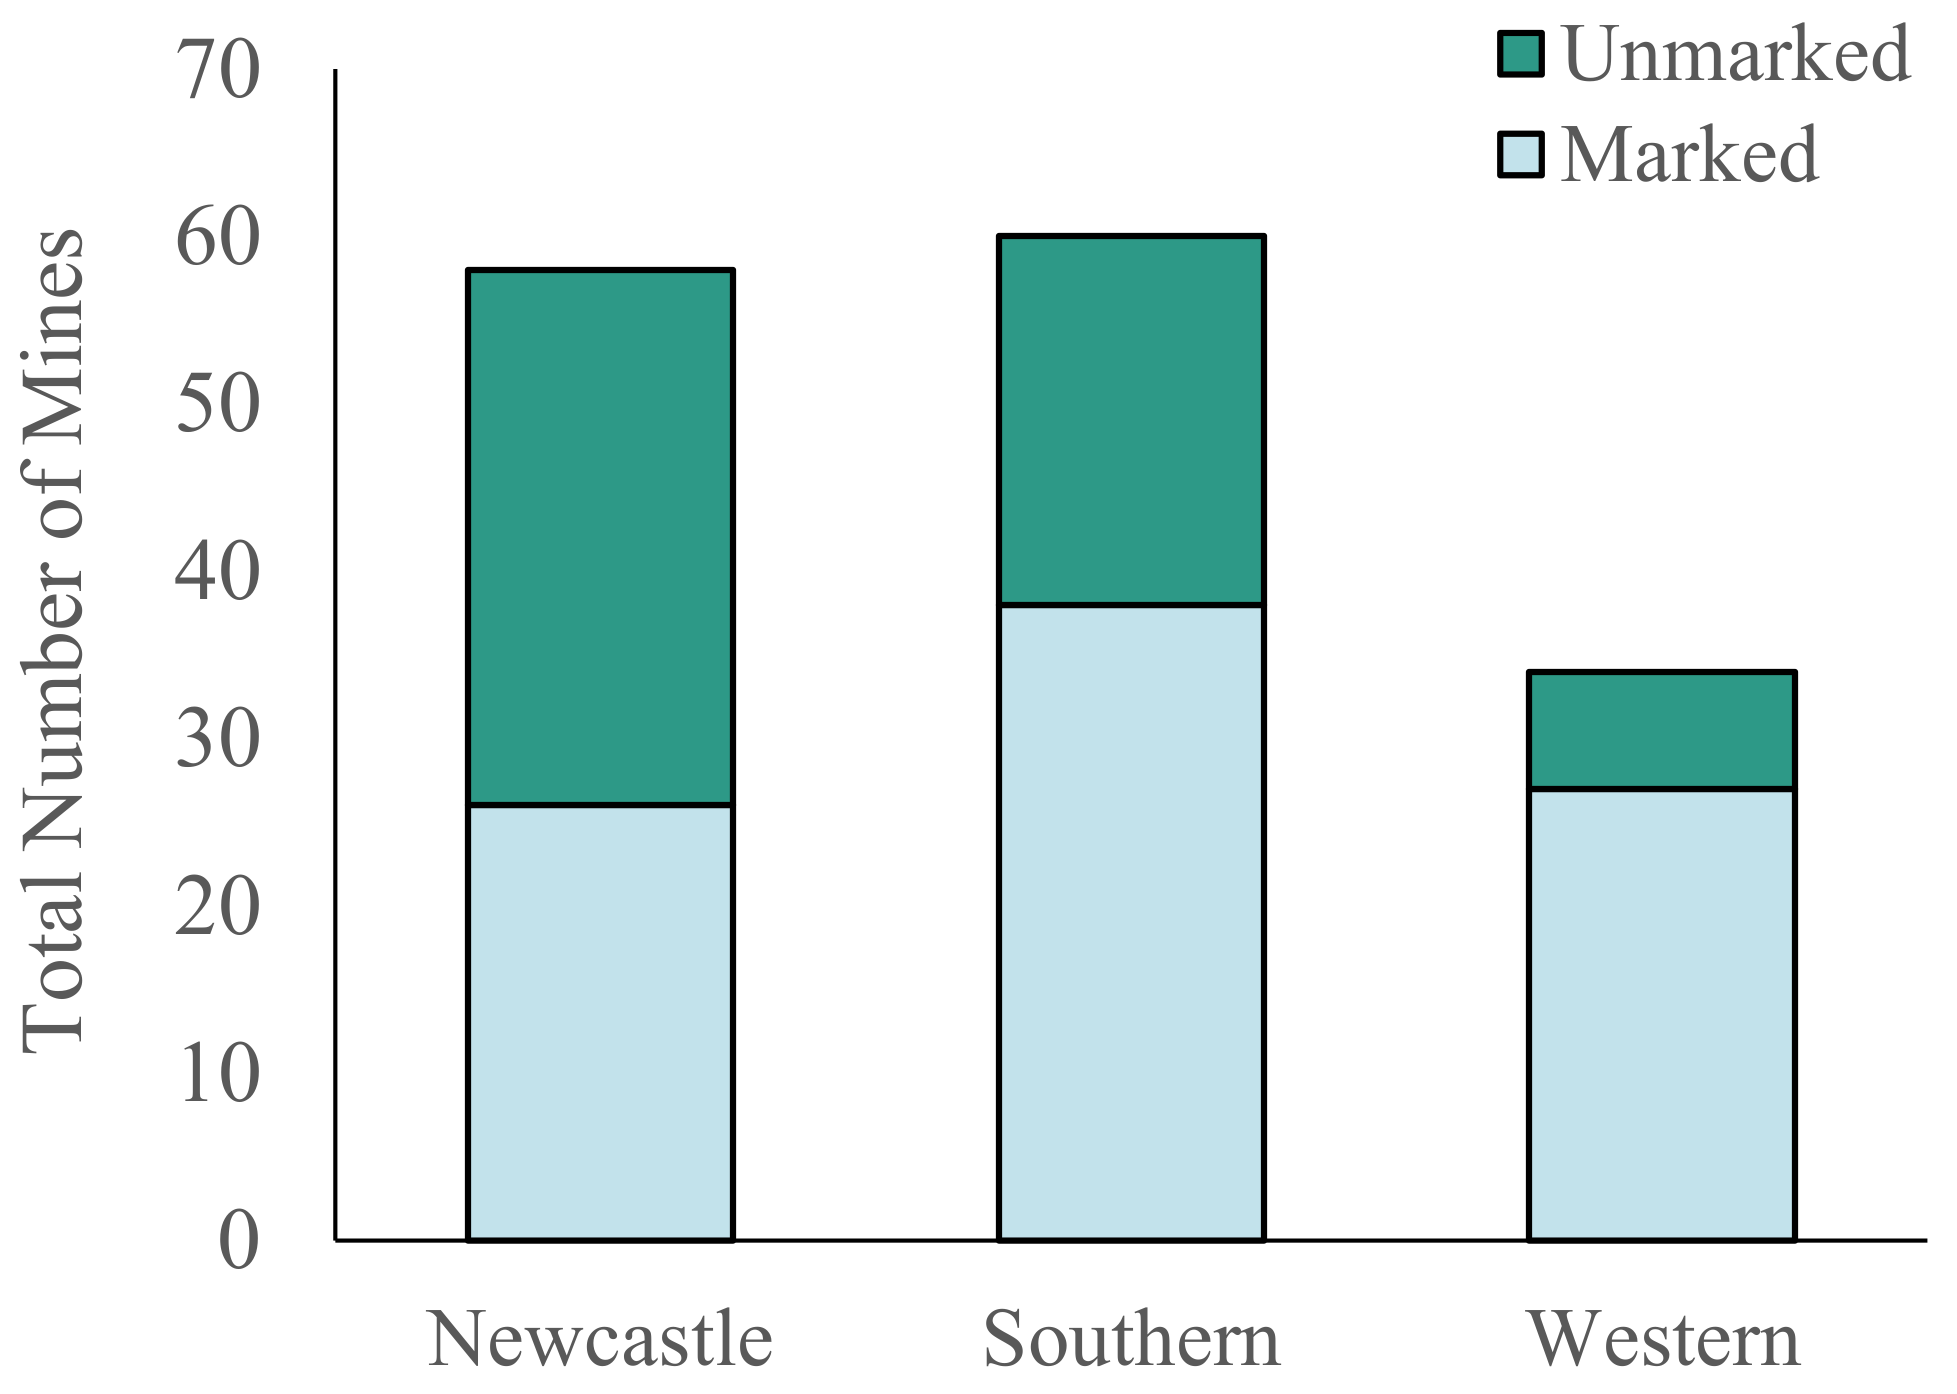
The final step of this project is to collate newly discovered site data into an accessible information system to provide more information for the public and a higher degree of certainty regarding the data. After the creation of up-to-date maps and information systems, merging of existing and discovered mine sites provides the most reliable estimation of the presence of underground coal mines within the regions examined. For the purposes of this project, three new maps of each region were generated, showing existing and discovered mines and GPS coordinates of the most likely portal locations for each mine were also provided based on visual evidence, along with the last known names for each mine and the dates each mine was closed (i.e., if known).

3. Results

A total of 90 marked mines were located and identified using the framework (Appendix A). After comprehensive enquiries investigating published information and local knowledge, a total of 61 unmarked mines were discovered (Figure 5).
Unmarked mines comprise a large proportion of total mines within each of the three examined regions. The NC holds the highest proportion of unmarked mines, with a total of 56% of all mines in the area being unmarked (n = 32) compared to marked (n = 25) (Figure 6). Following this is the SC, with 36% of all known mines in the area being unmarked (n = 22) compared to marked (n = 38) (Figure 7). Lastly, the WC contains 20% more unmarked mines (n = 7) than are listed on the public inventory (n = 27) (Figure 8).
A large proportion on historic or abandoned mines are currently unmarked within the NC (Figure 6). The region of Kurri has a particularly high density of unmarked mine sites, with many of these positioned within close proximity to major rivers, or tributaries. Similarly, the SC (Figure 7) sees a large number of unmarked mines in close proximity to marked ones. Due to the topography of the area, the majority of mine entries and pit top structures are situated in a line running along the Illawarra escarpment. The vast majority of unmarked mines in the SC region are situated within 10 km of the coast. Due to the steep topography and high rainfall, mining run-off terminates directly into the Indian Ocean.
Unmarked mines in the WC (Figure 8) are situated close to major rivers and tributaries feeding the World Heritage listed Blue Mountains National Park and one of Sydney’s largest drinking water reservoirs. Through the comprehensive search of records and documents of mining in NSW,44 instances of dates when the unmarked mines were permanently closed for operations were also found. Collating data on the closure of unmarked mines reveals an apparent pattern of increasing closure rates from the 1800s onwards (Figure 9). In both regions combined, only two mine closures went unmarked after the 1960–1989 period, with both mines located in the SC. No data were found relating to unmarked mine closures in the WC.
The National Pollution Inventory 2016–2017 was used to further investigate the likelihood of contamination risk from abandoned mines (Figure 9). Based on this model for Australia, the vast quantity of contamination for each of the six heavy metals are still confined to the original mine sites. This indicates abandoned, un-remediated mines have the potential for heavy metal leaching under fluctuating environmental conditions (e.g., weathering, erosion, floods, land subsidence).

4. Discussion

Analysing the temporal patterns in mine closures within the region reveals peak closure patterns for the districts; Both the SC and NC had the highest closures of mines not found on government databases within the period between 1960 and 1990 (Figure 9). This time period aligns with the introduction of the Environment Planning and Assessment Act (1979) which required operators of mines and other hazardous industries to implement a range of different site remediation measures while operating and post-closure [38]. This act, combined with mines becoming less profitable or exhausting coal reserves, may have pushed many operators to close before they were legislatively obliged to rehabilitate. Based on combined satellite and historical evidence, it appears that the main objective when closing a mine was to fill or cap the portals, remove any pit top structures, and cover the area with available fill. This resulted in a number of abandoned sites which have struggled to recover any resemblance to the surrounding unmined references sites. Early closure in the face of a tightening regulatory environment and subsequent inadequate remediation is likely to a feature common to many historic hazardous industries. While laws and regulations now require the responsible party to rehabilitate these sites, the companies which owned them in many cases no longer in exist, making the enforcement of remedial works next to impossible.
While more than 50 years have passed since the beginning of the peak closure period of underground mining operations in the Illawarra and Newcastle regions, many sites still display visible signs of degradation, with very little to no native vegetation established on many of sites (Figure 3). The lack of vegetation re-establishment is likely compounded by several factors, including over compacting of soil, lack of nutrients, low pH, erosion, run-off from contaminated mine workings, and heavy metal contamination [10,39,40,41,42]. Data taken from the National Pollution Inventory 2016–2017 indicate that coal mining contributed thousands of kilograms of zinc, manganese, lead, nickel, and copper into the environment. Interestingly, the pollution inventory classifies heavy metal contamination into two different categories: Emissions or transfers. Emissions are the uncontrolled, unintentional release of HMs into the environment; where transfers are the moving and storing of contaminants into tailings dams or other storage areas [43]. The latter is by far the greatest contributor of heavy metals into the environment, making up more than 98% of total contamination (Figure 10). While it is a positive that these are not being freely released into the environment, it does lead to the question of what happens to these post-mine closure.
Metals such as Mn, Fe, Zn, Ni, Cu, Cr, and Pb are common examples of what may remain on sites post-mining, left to move freely through natural cycles of wind and water erosion [14,44,45,46,47]. In the areas of NC and SC, rainfall induced erosion of the surface poses a major problem, with contaminated water free to move into local rivers and streams [40]. The Neath Colliery site is one such example. The soil on the site has distinctive yellow colouring, which follows the water erosion marks. With very little vegetation present, the yellowing of the soil follows the erosion tracks made by rain and subsequent run-off. Furthermore, it appears that the underground workings are now full of water, and constant seep issues red and orange water onto the surface of the site [48,49]. The yellowing of the soil and deep red and orange of the water are indicative of acid mine drainage [50]. The pollution on this site is significant and post any rainfall event contamination likely move freely into the nearby Swamp Creek. While a problem, the Neath Colliery is just one of eleven unmarked sites situated close to Swamp Creek alone.
Contaminated runoff may also be a significant problem within the Illawarra region due to its broadly steep topography, excessive annual rainfall, and close proximity to high density housing, and environmentally sensitive areas. The surface operations of all current and historic mines in the area are situated alone the high plateau of the Illawarra escarpment, and area which spans altitudes from sea level to over 500 m [51]. This combined with an average annual rainfall of 1100 mm [52] results in high levels of storm water runoff travelling through a range of sensitive areas before terminating in the Pacific Ocean. With 22 mine sites unmarked, the questions of proper site remediation post closure are surely valid. Without knowledge of the previous site contamination above, heavy metals may be causing a range of environmental issues. Water sampling conducted within the SC and WC has identified significant impacts caused by intentional and unintentional water releases [53]. Studies measuring the impacts of coal mining on river health have commonly shown increases in Al, Zn, Fe, Cu, As, Mn, Pb, and Ni [49,54,55]. The excessive levels of these contaminants lead to reductions in macroinvertebrate species richness and abundance [13,54]. These studies also stated that this effect continued for as much as 22 km downstream of the initial sampling point. In the context of the Illawarra region, contamination from unmarked mine sites may be causing a range of problems to local communities, and sensitive terrestrial and aquatic environments.
The practice of marking all mine sites will result in a more successful and detailed form of mine site monitoring; however, the current practice of marking sites with singular points may not be detailed enough to constitute and best practice approach to displaying all necessary information. While sufficient for open cut operations, using a singular point to identify underground operations—which often span for kilometres in several directions—can lead to problems, in particular regarding post-closure remediation works. By moving away from the point-based locator, and towards a polygon style system, stakeholders may receive a more correct representation of all possible impacts cause by underground developments. All current mines show the extent of their underground operations as a polygon within their environmental assessment plans. The polygons in these maps give the viewer a more accurate idea of the possible impacts and extend of underground operations.
The tightening of mining regulations has resulted in easy public access to newer site maps; however, plans of older mines were found to be much harder to locate during this investigation. We found that the majority of the unmarked mines did not have any publicly available site maps. The Work Health and Safety (Mines) Act 2013, states that for the safety of all workers accurate plans of mines must be retained and the blueprint of all historic mining activities in the area must be sought out to prevent mining accidents. This indicates that these plans are on record but currently difficult for the public and the scientific community to access.
Although mining operators maintain detailed maps of underground workings, these maps are seldom released to the public. Due to the extent of underground mining activities, and the potential for environmental contamination and subsidence beyond the marked portal point, it is suggested that public inventories of mine sites be revised to include area polygons reflecting the mine’s actual footprint below-ground, rather than single points at the portal entry point, to improve the accuracy of assessing risks. The Canyon Colliery in the Blue Mountains NP is marked as a single point on all relevant databases and has seen a level of site remediation since its closure in 1995. While this is a positive step for land management, the lack of information regarding the underground workings of the mine has been shown to be problematic for monitoring contamination originating from the old mine. Situated 3.5 km east of the mine, and well into the NP, two old drainage shafts constantly leak acidic water into Jinki and Dalpura Creeks, which are both tributaries of the Grose River [12]. Zinc levels coming from the Dalpura drain site have increased by more than 3000% when compared to the upper reaches of the river, with a value of 388 ppb. This value is well in excess of the ANZECC trigger value of 8 ppb, and should be a main focus of the Canyon Collieries site remediation [56]. This is just one example of how marking mine sites as a polygon, rather than a point, will increase mining land use transparency and also improve site monitoring, contaminant risk assessment, and the land management and remediation outcomes for mining companies in Australia.
By applying the site discovery method described to regions of interest, it is possible to comprise a more correct database of hazardous industry operations and areas of likely environmental impact, both past and present. This provides a critical resource for land managers who seek, to identify and rectify the impacts of environmental hazards. This should be a priority step for government on local, state, and national levels. Furthermore, it is suggested that current descriptive information on the location of mines and other hazards should be updated to map sites as polygons reflecting the entire operation’s footprint. This will lead to more accurate impact representation, as well as better remediation outcomes in the land management sector.

5. Limitations

This study developed and tested a framework for discovering lost environmental hazards using the study area of NSW. The framework was tested in three different regions of NSW using one type of mine (i.e., below-ground coal) and does not include assessing and mapping the below-ground workings or on-ground measurements of contamination or subsidence risk. The ‘confirmation’ of the sites within this paper indicates presence rather than extent, and further on-ground analysis is required to accurately assess the extent of each mine.

6. Conclusions

Unmarked environmental hazards, such as abandoned mines, pose serious risks to the environment and communities. Identifying such hazards is particularly difficult where industries historically ceased operations prior to the introduction of regulatory standards. Difficulties in identifying abandoned hazardous activities may be overcome using a combination of satellite imagery, historical records, geographic evidence and local knowledge. A framework applying this approach was successful in identifying 61 abandoned coal mines in three coalfields in NSW Australia. Identifying previously unmarked environmental hazards is critical for understanding current and future risks for landowners, traditional custodians and governments alike.

Author Contributions

Conceptualization, K.P.Y., B.R.M. and M.L.M.; Data curation, K.P.Y.; Formal analysis, K.P.Y. and B.R.M.; Investigation, K.P.Y.; Methodology, K.P.Y.; Supervision, B.R.M. and M.L.M.; Validation, K.P.Y. and M.L.M.; Visualization, K.P.Y.; Writing—original draft, K.P.Y., B.R.M., L.J.M. and M.L.M.; Writing—review and editing, K.P.Y., B.R.M., L.J.M. and M.L.M. All authors have read and agreed to the published version of the manuscript.

Funding

This research was funded by an Australian Research Training Program Scholarship.

Institutional Review Board Statement

Not applicable.

Data Availability Statement

Data are contained within the article and Appendix A.

Acknowledgments

Authors would like to thank Grace Chambers for assistance with data visualisation and map creation.

Conflicts of Interest

The authors declare no conflict of interest.

Appendix A

Table A1. Coordinates and year of closure for the unmarked mines in the Southern Coalfield.
MineLongitudeLatitudeYear Closed
Austinmer Extended150.93163−34.296571904
Blackball150.89704−34.344711884
Brokers Nose150.88073−34.367241947
Bulli Main150.94851−34.27991967
Dombarton150.79524−34.453351905
Excelsior no 1.150.90854−34.308841914
Excelsior no. 2150.91283−34.304161857
Hales150.89412−34.342011910
Haywards Block150.82374−34.444291952
Huntley150.72589−34.50089Unknown
Kemira150.85945−34.40804Unknown
Model150.89429−34.340451909
Mount Kembla150.82477−34.418521861
Mt Pleasant 1150.86168−34.398831886
Mt Pleasant 2150.86391−34.38339Unknown
North Illawarra No. 2 and 3150.92657−34.30203Unknown
Owens Balgownie150.86357−34.38467Unknown
Port Kembla No. 2/Nebo150.82099−34.44741975
South Bellambi150.88485−34.361851912
South Clifton150.96402−34.2634Unknown
South Kembla/Wongawilli150.78563−34.462691967
Tom Thumb150.83473−34.408041904
Table A2. Coordinates and year of closure for the unmarked mines in the Newcastle Coalfield.
MineLongitudeLatitudeYear Closed
Hebburn No 1 Colliery151.45572−32.820451958
Pelaw Main151.47537−32.827581955
Hebburn No 2 Colliery151.43661−32.851361972
Aberdare Main151.37871−32.848111961
Aberdare South151.40081−32.888811927
Ayrfield No 1 Colliery151.50986−32.785261933
Ayrfield No 2 Colliery151.51036−32.788081928
Ayrfield No 3 Colliery151.34948−32.67392Unknown
Bellbird Colliery151.32291−32.859021976
Abermain No 2 Colliery151.40191−32.860831964
Abermain No 3 Colliery151.41408−32.840031960
Cessnock No 1 Colliery151.32705−32.905221964
Cessnock No 2 Colliery151.33973−32.848731955
East Greta No 1 Colliery151.52305−32.760861929
East Greta No 2 Colliery151.52318−32.757251929
Elrington Colliery151.41887−32.875711962
Glen Ayr Colliery151.51086−32.7781930
Greta Colliery151.38516−32.677361931
Hebburn No 2 Tunnel151.43629−32.826011908
Maitland Main Colliery151.27915−32.885171972
Millfield Greta Colliery151.27537−32.885381955
Neath Colliery151.40925−32.820661961
Stanford Main No 2 Colliery151.27907−32.904181961
Richmond Vale Main Colliery151.47468−32.860231967
Seaham No 2 Colliery151.55334−32.913081945
Seaham Colliery151.58216−32.891691932
Killingworth Colliery151.54505−32.93312Unknown
West Wallsend151.58172−32.89896Unknown
John Darling151.6743−33.0251Unknown
Burwood151.705−33.0141982
Dudley151.7188−32.99141944
Lambton Colliery151.711−33.00811936
Table A3. Coordinates for the unmarked mines in the Western Coalfield.
MineLongitudeLatitudeYear Closed
Cal Colliery150.0804−33.3745Unknown
Commonwealth Colliery150.078−33.38Unknown
Wallerawang Colliery150.0575−33.3643Unknown
Irondale Colliery150.0119−33.3772Unknown
State Coal Mine150.168477−33.46306Unknown
Lithgow Valley Colliery150.155398−33.48591Unknown
Eskbank Colliery150.1618−33.48129Unknown

References

  1. Goldewijk, K.K. Estimating global land use change over the past 300 years: The HYDE Database. Glob. Biogeochem. Cycles 2001, 15, 417–433. [Google Scholar] [CrossRef]
  2. Kattge, J.; Díaz, S.; Lavorel, S.; Prentice, I.C.; Leadley, P.; Bönisch, G.; Garnier, E.; Westoby, M.; Reich, P.; Wright, S.J.; et al. TRY—A global database of plant traits. Glob. Chang. Biol. 2011, 17, 2905–2935. [Google Scholar] [CrossRef]
  3. Walther, G.-R. Community and ecosystem responses to recent climate change. Philos. Trans. R. Soc. B Biol. Sci. 2010, 365, 2019–2024. [Google Scholar] [CrossRef] [PubMed]
  4. Walther, G.-R.; Post, E.; Convey, P.; Menzel, A.; Parmesan, C.; Beebee, T.J.C.; Fromentin, J.-M.; Hoegh-Guldberg, O.; Bairlein, F. Ecological responses to recent climate change. Nature 2002, 416, 389–395. [Google Scholar] [CrossRef]
  5. Jones, K.; Patel, N.; Levy, M.; Storeygard, A.; Balk, D.; Gittleman, J.L.; Daszak, P. Global trends in emerging infectious diseases. Nat. Cell Biol. 2008, 451, 990–993. [Google Scholar] [CrossRef] [PubMed]
  6. Chen, I.-C.; Hill, J.K.; Ohlemuller, R.; Roy, D.; Thomas, C.D. Rapid Range Shifts of Species Associated with High Levels of Climate Warming. Science 2011, 333, 1024–1026. [Google Scholar] [CrossRef] [PubMed]
  7. Thomas, C.D.; Cameron, A.; Green, R.E.; Bakkenes, M.; Beaumont, L.J.; Collingham, Y.C.; Erasmus, B.; de Siqueira, M.F.; Grainger, A.; Hannah, L.; et al. Extinction risk from climate change. Nature 2004, 427, 145–148. [Google Scholar] [CrossRef] [PubMed]
  8. Dutta, R.; Das, A.; Aryal, J. Big data integration shows Australian bush-fire frequency is increasing significantly. R. Soc. Open Sci. 2016, 3, 150241. [Google Scholar] [CrossRef] [PubMed] [Green Version]
  9. Benard, M.F. Warmer winters reduce frog fecundity and shift breeding phenology, which consequently alters larval development and metamorphic timing. Glob. Chang. Biol. 2014, 21, 1058–1065. [Google Scholar] [CrossRef]
  10. Lamb, D.; Erskine, P.D.; Fletcher, A. Widening gap between expectations and practice in Australian minesite rehabilitation. Ecol. Manag. Restor. 2015, 16, 186–195. [Google Scholar] [CrossRef]
  11. Peterson, C.H.; Rice, S.D.; Short, J.W.; Esler, D.; Bodkin, J.L.; Ballachey, B.E.; Irons, D.B. Long-Term Ecosystem Response to the Exxon Valdez Oil Spill. Science 2003, 302, 2082–2086. [Google Scholar] [CrossRef] [PubMed] [Green Version]
  12. Wright, I.A. Coal mine ‘dewatering’of saline wastewater into NSW streams and rivers: A growing headache for water pollution regulators. In Proceedings of the 6th Australian Stream Management Conference, Managing for Extremes, Canberra, ACT, Australia, 6–8 February 2012. [Google Scholar]
  13. Wright, I.A.; Belmer, N.; Davies, P. Coal Mine Water Pollution and Ecological Impairment of One of Australia’s Most ‘Protected’ High Conservation-Value Rivers. Water Air Soil Pollut. 2017, 228, 90. [Google Scholar] [CrossRef]
  14. Wright, I.A.; Paciuszkiewicz, K.; Belmer, N. Increased Water Pollution after Closure of Australia’s Longest Operating Underground Coal Mine: A 13-Month Study of Mine Drainage, Water Chemistry and River Ecology. Water Air Soil Pollut. 2018, 229, 55. [Google Scholar] [CrossRef]
  15. Alpers, C.N.; Yee, J.L.; Ackerman, J.; Orlando, J.L.; Slotton, D.G.; Marvin-DiPasquale, M.C. Prediction of fish and sediment mercury in streams using landscape variables and historical mining. Sci. Total Environ. 2016, 571, 364–379. [Google Scholar] [CrossRef]
  16. Armitage, P.D.; Bowes, M.J.; Vincent, H.M. Long-term changes in macroinvertebrate communities of a heavy metal polluted stream: The river Nent (Cumbria, UK) after 28 years. River Res. Appl. 2007, 23, 997–1015. [Google Scholar] [CrossRef]
  17. Bromstad, M.J.; Wrye, L.A.; Jamieson, H.E. The characterization, mobility, and persistence of roaster-derived arsenic in soils at Giant Mine, NWT. Appl. Geochem. 2017, 82, 102–118. [Google Scholar] [CrossRef]
  18. Cherry, D.; Currie, R.; Soucek, D.; Latimer, H.; Trent, G. An integrative assessment of a watershed impacted by abandoned mined land discharges. Environ. Pollut. 2000, 111, 377–388. [Google Scholar] [CrossRef]
  19. Fields, S. The earth's open wounds: Abandoned and orphaned mines. Environ. Health Perspect. 2003, 111, A154–A161. [Google Scholar] [CrossRef] [Green Version]
  20. Mayes, W.; Johnston, D.; Potter, H.; Jarvis, A. A national strategy for identification, prioritisation and management of pollution from abandoned non-coal mine sites in England and Wales. I.: Methodology development and initial results. Sci. Total Environ. 2009, 407, 5435–5447. [Google Scholar] [CrossRef]
  21. Azcue, J.M.; Nriagu, J.O. Impact of abandoned mine tailings on the arsenic concentrations in Moira Lake, Ontario. J. Geochem. Explor. 1995, 52, 81–89. [Google Scholar] [CrossRef]
  22. Thienpont, J.R.; Korosi, J.B.; Hargan, K.; Williams, T.; Eickmeyer, D.C.; Kimpe, L.E.; Palmer, M.J.; Smol, J.; Blais, J. Multi-trophic level response to extreme metal contamination from gold mining in a subarctic lake. Proc. R. Soc. B Boil. Sci. 2016, 283, 20161125. [Google Scholar] [CrossRef] [PubMed]
  23. EPA. Cleaning Up the Nation’s Waste Sites: Markets and Technology Trends; United States Environmental Protection Agency: Washington, D.C., USA, 2004.
  24. OSMRE. Abandoned Mine Land Inventory System. 2019. Available online: https://www.osmre.gov/programs/amlis.shtm (accessed on 1 November 2019).
  25. TCA. The Coal Authority-Interactive Map. 2019. Available online: https://mapapps2.bgs.ac.uk/coalauthority/home.html (accessed on 1 December 2019).
  26. USGS. Mineral Resources Data System (MRDS). 2011. Available online: https://mrdata.usgs.gov/mrds/ (accessed on 18 December 2019).
  27. Johnston, D.; Potter, H.; Jones, C.; Rolley, S.; Watson, I.; Pritchard, J. Abandoned Mines and the Water Environment in the UK. In Sercuring the Future and 8th International Conference on Acid Rock Drainage (ICARD); International Network for Acid Prevention: Skellefteå, Sweden, 26 June.
  28. Jarvis, A.P.; Johnston, D.; Mayes, W.M.; Potter, H.A.B. Application of a New methodology for Assessing the Priorities for Abandoned Mine Water Pollution Remediation at a National Scale: Results and Implications from a Study across England and Wales. In Proceedings of the 10th International Mine Water Association Congress: Mine Water and the Environment, Ostrava, Czech Republic, 2–5 June 2008; Rapantova, N., Hrkal, Z., Eds.; VSB-Tech. Univ. Ostrava: Ostrava, Czech Republic, 2008. [Google Scholar]
  29. NOAMI. 2018. Available online: https://www.abandoned-mines.org/en/ (accessed on 1 October 2019).
  30. Unger, C.; Lechner, A.M.; Glenn, V.; Edraki, M.; Mulligan, D.R.; Mapping and prioritising rehabilitation of abandoned mines in Australia. Proc. Life—Mine conference; Brisbane, Australia; pp. 259–266. Available online: https://www.researchgate.net/profile/Corinne-Unger/publication/233824122_Mapping_impacts_and_prioritising_rehabilitation_of_Abandoned_Mines_at_a_national_level_in_Australia/links/547d02ea0cf2cfe203c1ffd6/Mapping-impacts-and-prioritising-rehabilitation-of-Abandoned-Mines-at-a-national-level-in-Australia.pdf (accessed on 1 October 2019).
  31. Grant, H. Managing Contaminated Sites: Environment Protection Authority, Department of Trade and Investment, Regional Infrastructure and Services; Audit Office of New South Wales: Sydney, NSW, Australia, 2014. [Google Scholar]
  32. Auditor-General, NSW. New South Wales Auditor-General’s Report Performance Audit—Managing Contaminated Sites; Audit Office of New South Wales: Sydney, NSW, Australia, 2011.
  33. GA. Australian Mines Atlas. Geoscience Australia. 2017. Available online: http://www.australianminesatlas.gov.au/ (accessed on 1 September 2019).
  34. John, D. History of the Greta Coal Measures. Available online: http://pandora.nla.gov.au/pan/100781/20090610-1630/hosting.collectionsaustralia.net/newcastle/greta/frames.html (accessed on 20 September 2019).
  35. Jenny, R. Cessnock Local Government Area Economic Development Strategy; Cessnock City Council: Cessnock, NSW, Australia, 2014. [Google Scholar]
  36. NPWS. Illawarra Escarpment State Conservation Area—Draft Plan of Management; Natioanal Parks and Wildlife Service NSW: Illawarra, NSW, Australia, 2011. [Google Scholar]
  37. Werner, T.T.; Mudd, G.M.; Schipper, A.M.; Huijbregts, M.A.; Taneja, L.; Northey, S.A. Global-scale remote sensing of mine areas and analysis of factors explaining their extent. Glob. Environ. Chang. 2019, 60, 102007. [Google Scholar] [CrossRef]
  38. NSW Government. 1979. Available online: http://www.legislation.nsw.gov.au/view/whole/html/inforce/current/act-1979-203 (accessed on 9 June 2019).
  39. Weng, Z.; Mudd, G.M.; Martin, T.; Boyle, C.A. Pollutant loads from coal mining in Australia: Discerning trends from the National Pollutant Inventory (NPI). Environ. Sci. Policy 2012, 19-20, 78–89. [Google Scholar] [CrossRef]
  40. Dang, Z.; Liu, C.; Haigh, M.J. Mobility of heavy metals associated with the natural weathering of coal mine spoils. Environ. Pollut. 2001, 118, 419–426. [Google Scholar] [CrossRef]
  41. Maddocks, G.; Lin, C.; McConchie, D. Field scale remediation of mine wastes at an abandoned gold mine, Australia II: Effects on plant growth and groundwater. Environ. Earth Sci. 2008, 57, 987–996. [Google Scholar] [CrossRef]
  42. Hu, Z.; Fu, Y.; Xiao, W.; Zhao, Y.; Wei, T. Ecological restoration plan for abandoned underground coal mine site in Eastern China. Int. J. Mining Reclam. Environ. 2014, 29, 316–330. [Google Scholar] [CrossRef]
  43. NPI. National Pollution Inventory. 2017. Available online: http://www.npi.gov.au/ (accessed on 30 January 2018).
  44. Dudka, S.; Adriano, D.C. Environmental Impacts of Metal Ore Mining and Processing: A Review. J. Environ. Qual. 1997, 26, 590–602. [Google Scholar] [CrossRef]
  45. Bhuiyan, M.A.; Parvez, L.; Islam, M.; Dampare, S.B.; Suzuki, S. Heavy metal pollution of coal mine-affected agricultural soils in the northern part of Bangladesh. J. Hazard. Mater. 2010, 173, 384–392. [Google Scholar] [CrossRef]
  46. Li, Z.; Ma, Z.; van der Kuijp, T.J.; Yuan, Z.; Huang, L. A review of soil heavy metal pollution from mines in China: Pollution and health risk assessment. Sci. Total Environ. 2014, 468-469, 843–853. [Google Scholar] [CrossRef]
  47. Schaider, L.A.; Senn, D.; Brabander, D.; McCarthy, K.D.; Shine, J.P. Characterization of Zinc, Lead, and Cadmium in Mine Waste: Implications for Transport, Exposure, and Bioavailability. Environ. Sci. Technol. 2007, 41, 4164–4171. [Google Scholar] [CrossRef]
  48. Bell, F.G.; Stacey, T.R.; Genske, D.D. Mining subsidence and its effect on the environment: Some differing examples. Environ. Earth Sci. 2000, 40, 135–152. [Google Scholar] [CrossRef]
  49. Mokhov, A.V. Mine water drainage from flooded coal mines. Dokl. Earth Sci. 2011, 438, 733–735. [Google Scholar] [CrossRef]
  50. Ali, A.; Strezov, V.; Davies, P.; Wright, I. Environmental impact of coal mining and coal seam gas production on surface water quality in the Sydney basin, Australia. Environ. Monit. Assess. 2017, 189, 408. [Google Scholar] [CrossRef] [PubMed]
  51. Ashcroft, M.B.; Chisholm, L.A.; French, K.O. The effect of exposure on landscape scale soil surface temperatures and species distribution models. Landsc. Ecol. 2007, 23, 211–225. [Google Scholar] [CrossRef] [Green Version]
  52. BOM. Monthly Rainfall Bellambi AWS. 2018. Available online: http://www.bom.gov.au/jsp/ncc/cdio/weatherData/av?p_nccObsCode=139&p_display_type=dataFile&p_startYear=&p_c=&p_stn_num=068228 (accessed on 20 June 2018).
  53. Price, P.; Wright, I.A. Water Quality Impact from the Discharge of Coal Mine Wastes to Receiving Streams: Comparison of Impacts from an Active Mine with a Closed Mine. Water Air Soil Pollut. 2016, 227, 155. [Google Scholar] [CrossRef]
  54. Belmer, N.; Tippler, C.; Davies, P.J.; Wright, I.A. Impact of a coal mine waste discharge on water quality and aquatic ecosystems in the Blue Mountains World Heritage Area. In Proceedings of the 7th Australian Stream Management Conference, Townsville, QLD, Australia, 27–30 July 2014. [Google Scholar]
  55. Wright, I.A.; Ryan, M.M. Impact of mining and industrial pollution on stream macroinvertebrates: Importance of taxonomic resolution, water geochemistry and EPT indices for impact detection. Hydrobiologia 2016, 772, 103–115. [Google Scholar] [CrossRef]
  56. ANZECC. Australian and New Zealand Guidelines for Fresh and Marine Water Quality; Australian and New Zealand Environment and Conservation Council and Agriculture and Resource Management Council of Australia and New Zealand: Canberra, ACT, Australia, 2000; pp. 1–103.
Figure 1. State maps of NSW with insert highlighting the 4 regional coalfields examined in this study.
Sustainability 13 11011 g001
Figure 2. The framework for discovering abandoned and unregistered mines for addition into current databases.
Sustainability 13 11011 g002
Figure 3. Satellite imagery taken from latest version of Google Earth Pro showing (a) North Cliff Colliery, (b) Canyon Colliery, (c) Neath Colliery, (d) Abermain No. 2 Colliery. Yellow line indicates each mines surface footprint.
Sustainability 13 11011 g003
Figure 4. Satellite imagery of Neath Colliery with annotations displaying the locations of the original train line (- -) and nearby Colliery St.
Sustainability 13 11011 g004
Figure 5. Number of mines marked on the government databases and the unmarked mines identified for each coalfield region in the Sydney basin.
Sustainability 13 11011 g005
Figure 6. Marked mines (⚫) and unmarked mines (〇) of the Newcastle Coalfields.
Sustainability 13 11011 g006
Figure 7. Marked mines (⚫) and unmarked mines (〇) of the Southern Coalfields.
Sustainability 13 11011 g007
Figure 8. Marked mines (⚫) and unmarked mines (〇) of the Western Coalfields.
Sustainability 13 11011 g008
Figure 9. Closures of unmarked mines in Newcastle and Southern Coalfields across time.
Sustainability 13 11011 g009
Figure 10. Heavy metal contamination from NSW coal mines 2016–2017 (From NPI 2017 [43]).
Sustainability 13 11011 g010
Publisher’s Note: MDPI stays neutral with regard to jurisdictional claims in published maps and institutional affiliations.

