1. Introduction
Historically, the residential structure in Latin American cities has been an inverse relationship between income levels and distance to the city center. Under this configuration, location decisions exerted by higher-income classes have shaped cities’ distribution, and residential areas were sharply separated by socioeconomic classes [
1]. Santiago, Chile’s metropolitan area, is an exceptional case that revealed this particular situation in the 1960s. At this time, higher-income socioeconomic groups enjoyed better urban services, accessibility to commercial activities, and a free pollution environment. By contrast, working classes were excluded from the city center to peripherical areas, in housing previously occupied by former middle-income groups, with several urban problems such as overcrowding and low-quality sanitary facilities [
1]. Over time, the geographical agglomeration of inhabitants by socioeconomic classes or residential segregation was intensified and exacerbated by the military rule in the 1970s. This authoritarian government assumed a subsidiary role in the housing market and forced public housing projects to the urban fringes [
2]. Scarpaci, Infante, and Gaete (1988) [
3] found evidence that the transition from a traditional welfare state to a laissez-faire economy undermined the state’s role in housing markets, and the state planned residential segregation as social and political control. Additionally, the drastic reduction of public expenditures motivated the introduction of private urban planners who started to lead Chilean cities’ urban development. The return to democracy in the 1990s did not change the subsidiary role of government and perpetuated residential segregation in Santiago’s Metropolitan Area. According to Rodríguez and Arriagada (2004) [
4], Santiago’s socioeconomic residential segregation is particularly intense compared to other urban agglomerations in Latin America. Although this problem is mentioned several times in housing planning policies or urban policies, in practice, there have not yet existed direct public policies concerned with reducing residential segregation.
Residential segregation—understood as the unequal distribution of incomes across communities—has received remarkable attention from the literature due to several social, geographical, and political consequences in individuals’ life trajectories. As Cheshire (2006) [
5] notes, residential segregation is the spatial articulation of income inequality in society, and he argues that neighborhoods are more polarized in cities when incomes are unequally distributed. However, the stratification of socioeconomic groups in the space may not only be observed in the distinction between economic classes across neighborhoods. Additionally, segregated groups live in different local jurisdictions that differ in fiscal and administrative capacities and provide local public services. Consequently, the differences between socioeconomic status across neighborhoods might reinforce disparities in local public service provision against the most impoverished population. Theoretically, two different perspectives might potentially explain these tendencies. On the one hand, Tiebout (1956) [
6] argues that individuals with a higher willingness-to-pay choose communities that provide higher-quality local public services. Thus, this situation generates a virtuous circle for the wealthiest local governments because these can increase their capacity to attract high-income individuals. In this way, residential segregation emerges as a natural consequence of market forces, generating an unequal distribution of local public services across communities, and reinforcing the relationship between housing prices and local public services [
7,
8]. On the other hand, the Social Stratification Government Inequality thesis (SSGI) refutes these arguments and establishes that the political incorporation by class and status in the society is an important institutional mechanism to create and perpetuate inequalities among residents [
9]. In this approach, residential segregation arises due to the maximum control exerted by affluent groups over scarce resources to maintain homogeneity into communities. Therefore, an unequal system of relationships into the urban housing market can create several negative consequences in the accessibility to housing projects, better neighborhoods, and local public services.
Drawing on a rich cross-sectional dataset that contains housing prices by blocks and the computation of accessibility measures to different local public services such as schools, transportation, urban parks, kindergartens, hospitals, fire and police stations, and cultural infrastructure, this paper addresses the relationship between accessibility to local public services and residential segregation patterns in the Metropolitan Area of Santiago (MR), Chile. Using the accessibility index proposed by Li et al. (2015) [
7], I explore how local public services distribution is equitable among social groups, using housing prices as a proxy of individual incomes. This index measures the spatial accessibility to local services, considering the number of services and the geographical distances between households and local public services. The distribution of accessibility for each local service considered in this analysis is evaluated using the Quantile Regression Model (QRM) and Multivariate Local Indicators of Spatial Association (Multivariate LISA). QRM has the advantage of analyzing the influence of determinants on the dependent variable at any point in its distribution. In this paper, I use the mean of housing prices by blocks to determine how it can affect each local service’s distribution of accessibility. Finally, I compare the distribution of local public services supply across different quantile groups to detect whether the distribution is equitable among different income groups. Although that QRM offers an interesting way to analyze the conditional distribution of accessibility indicators, it is not sufficient to relate the spatial distribution of local public services with residents’ social-economic status. This element is crucial when analyzing how residential sorting by housing prices is associated with local public services’ spatial distribution. For this reason, I use Bivariate LISA analysis to obtain a better representation of this association, complementing previous results with the spatial distribution of residents and local service infrastructure.
The remainder of this paper is organized as follows.
Section 2 describes essential elements to relate accessibility to local public services with residential segregation.
Section 3 describes the case and the data.
Section 4 describes the empirical strategy used.
Section 5 shows and discusses the main results. The last section concludes.
2. The Relationship between Residential Segregation and the Provision of Local Public Services
Residential segregation has been a phenomenon widely studied by the empirical literature due to the negative consequences that it would generate on individual’s lives, especially on the low-income population. Residential segregation, understood as the same social class individuals’ (socioeconomic, ethnic, or religious) grouping in specific geographical areas, can generate differences in living standards within cities as well as exacerbate poverty concentration and the isolation of the most disadvantaged neighborhoods [
4,
10]. Furthermore, residential segregation might negatively affect the most impoverished individuals’ access to educational services, labor markets, security, or social networks. For instance, the spatial mismatch hypothesis suggests that residential segregation reduces employment opportunities, and living in more impoverished neighborhoods reduces residents’ labor participation due to the physical constraints between their homes and workplaces as well as by their limited access to labor market information [
11,
12]. However, the link between residential segregation and the spatial distribution of public services has received less attention. This aspect is critical considering the transformation that large cities have undergone according to their accelerated growth and the influence of various social-political processes that may alter their design and public services distribution. The spatial distribution of public services, which in practice should be available to low-income groups, are fundamental to improve the life quality of inhabitants in cities, guaranteeing equal opportunities in access to educational services, health services, or transportation, which are directly related to reducing income inequality [
13,
14]. Considering the increments in travel times and the scarcity of public goods and services in cities, the distribution of public goods and services might undergo large variations in space and consequently limit market access for residents located in the urban fringes. Assuming that places become more attractive as their endowment of urban services improves, this might lead to high-income residents clustering in exclusive locations within the city, further exacerbating residential segregation levels in cities.
Additionally, to support arguments presented previously, the debate about the link between residential segregation and the city’s dotation still has not reached a clear consensus regarding understanding how this phenomenon is related to spatial disparities in the dotation of local public services [
8]. However, two different theoretical perspectives can help to figure out some exciting trends to disentangle this relationship. The first theoretical framework comes from the public choice theory proposed by Tiebout (1956) [
6] and emphasizes local government’s efficiency to provide local public services. This theory states that people choose to live in places where there exists a match between their preferences for local public services and their willingness to pay for these services. Therefore, local government actions are dedicated to attracting higher-income individuals to increase their revenues and compete with other communities to attract and retain affluent people and businesses. As a result, a virtuous circle is created in favor of more affluent municipalities because they can offer high-quality services to attract high-income groups [
12]. In this way, the manifestation of residential segregation is a natural consequence of housing market responses to local government differences in local public services provision. Furthermore, Tiebout (1956) [
6] noted that local government fragmentations can improve efficiency in providing local public services due to the competition between local governments. This fact might also improve local governments’ fiscal discipline who maximize their budgets to offer service packages, because citizens choose their locations by comparing one local government’s financial performance with others, excluding the most inefficient ones [
15].
A substantial body of criticism against these arguments about the benefits in efficiency that emerge from local governments’ fragmentation given residential decisions is presented in the Social Stratification Government Inequality thesis (SSGI) [
9,
16]. Under this context, which concerns more equity than efficiency issues, urban problems arise from the differences in the urban residents’ accessibility to scarce economic, social, and political resources. Political incorporation by class and status plays an essential role in creating and perpetuating inequalities among communities. Residential segregation arises from the mismatch between needs and fiscal capacities in local governments, where affluent groups exert maximum control over scarce resources. Local governments establish exclusionary zoning, building codes, and other regulations to increase housing costs and excluding low-income groups from community limits. Residential location is an essential resource in the urban stratification system because decisions about where to live are not only based on citizens’ local public services preferences. These decisions are related to residents’ desires to live in communities with similar incomes or socioeconomic characteristics. Finally, the poor are isolated in local governments with limited fiscal capacities because segregation by class and socioeconomic status can separate fiscal resources from needs.
Regardless of these different perspectives, the relationship between residential segregation and accessibility to local public services has not yet been fully explored in cases that differ from the US metropolitan areas. For example, Sun, Fu, and Zheng (2016) [
14] showed, for Chinese cities, that disparities in the provision of local public services may emerge from the influence of residential market responses on income sorting. Therefore, this fact generates an unequal distribution of local public services across residential locations. For these authors, improving the accessibility to local public services is a useful tool to increase individuals’ opportunities to reach better job options, neighborhoods, education, or medical facilities. Furthermore, individuals might match their needs correctly with the actual provision of local public services and reduce residential segregation and spatial income inequality [
14]. Moreover, Li et al. (2015) [
7] showed, for Shanghai, that jurisdiction and fiscal autonomy of local governments influence distributional patterns of local public service provision. Their results suggest that local governments might play a vital role in shaping public service provision patterns by addressing the negative consequences generated from residential clustering and public service inequalities. For these authors, fragmentation between local governments does not just mean fewer options for affordable housing. Additionally, it implies limited access to local public services or a “double-disadvantage” with a negative impact on the well-being of low-income individuals [
7].
3. Case of Study and Data
To undertake this analysis, I use the Metropolitan Area of Santiago (MR), Chile. This area is the most populated and densest region of the country, with an area of 15,403 square kilometers and a population projected at 7,399,042 (Instituto Nacional de Estadísticas (INE)). Administratively, this region has 14 provinces and 52 municipalities, and the nation’s capital is there. In the MR, social and economic activities are highly concentrated; more than 40 percent of the Chilean population live in the MR. This remarkable fact determines the high attractiveness power the MR exerts over other regions. For instance, the best Chilean universities are located in the MR, motivating more talented students to migrate from other regions to the MR to access universities with more prestige and international recognition. By 2005, 47 percent of Chilean students were enrolled in universities of the MR, capturing more than 35 percent of the highest SAT scores of the country [
17].
Despite these critical differences between the MR and the rest of the country, it is still possible to find differences in living standards within municipalities. According to the quality life index scores computed by the Center of Urban Studies of the Catholic University of Chile (PUC) [
18] for Chilean cities, only eight communes located in the MR have a higher quality of life than the national average, which means that 20.5 percent of inhabitants are living in communities with high-quality amenities. In contrast, 12 communes that concentrate 35.9 percent of the population are communities with medium-quality amenities, and 20 communes with 43.6 percent of the population are communities that offer low-quality amenities. The result evidences a high inequality in terms of urban life quality, with 64.6 percent of the MR’s inhabitants living in places with low mobility and connectivity, and 43.6 percent living in communities with low housing quality [
18]. These arguments reinforce the importance of studying how equitable is the accessibility to local public services, and not only because it is a prominent component of quality of life. Accessibility can also be recognized as a significant source of people’s real income, especially for the most impoverished population, who must receive more benefits from local public services [
19]. Public policies must help low-income individuals overcome physical and financial barriers to increase their opportunities to access better job options or better neighborhoods.
Two critical decisions are considered to understand the relationship between residential segregation and accessibility to local public services. First, I need to identify an indicator to reflect residential segregation. According to previous studies, residential segregation is analyzed using housing prices as a proxy for individuals’ socioeconomic status within communities. I do not have a complete profile of the individual’s needs for local public services by location, but housing prices can be used to identify sectors with people economically more vulnerable. It implies that people living in low-income communities might demand more local public facilities because their incomes are insufficient for them to use their private counterparts. In this paper, I use fiscal property prices computed by the internal revenue service (Servicio de Impuestos Internos (SII)) for the first semester of 2017. These property values are computed considering some physical housing characteristics such as property land, build area, age, and use. From this dataset, I extract the mean of housing prices for blocks, which is the finer geographical scale used for the Chilean case in the absence of daily housing transactions information. As Cortés and Iturra (2019) [
20] note, fiscal property values positively correlate with housing rental prices; thus, it is possible to ensure this measure’s reliability as a proxy for housing values.
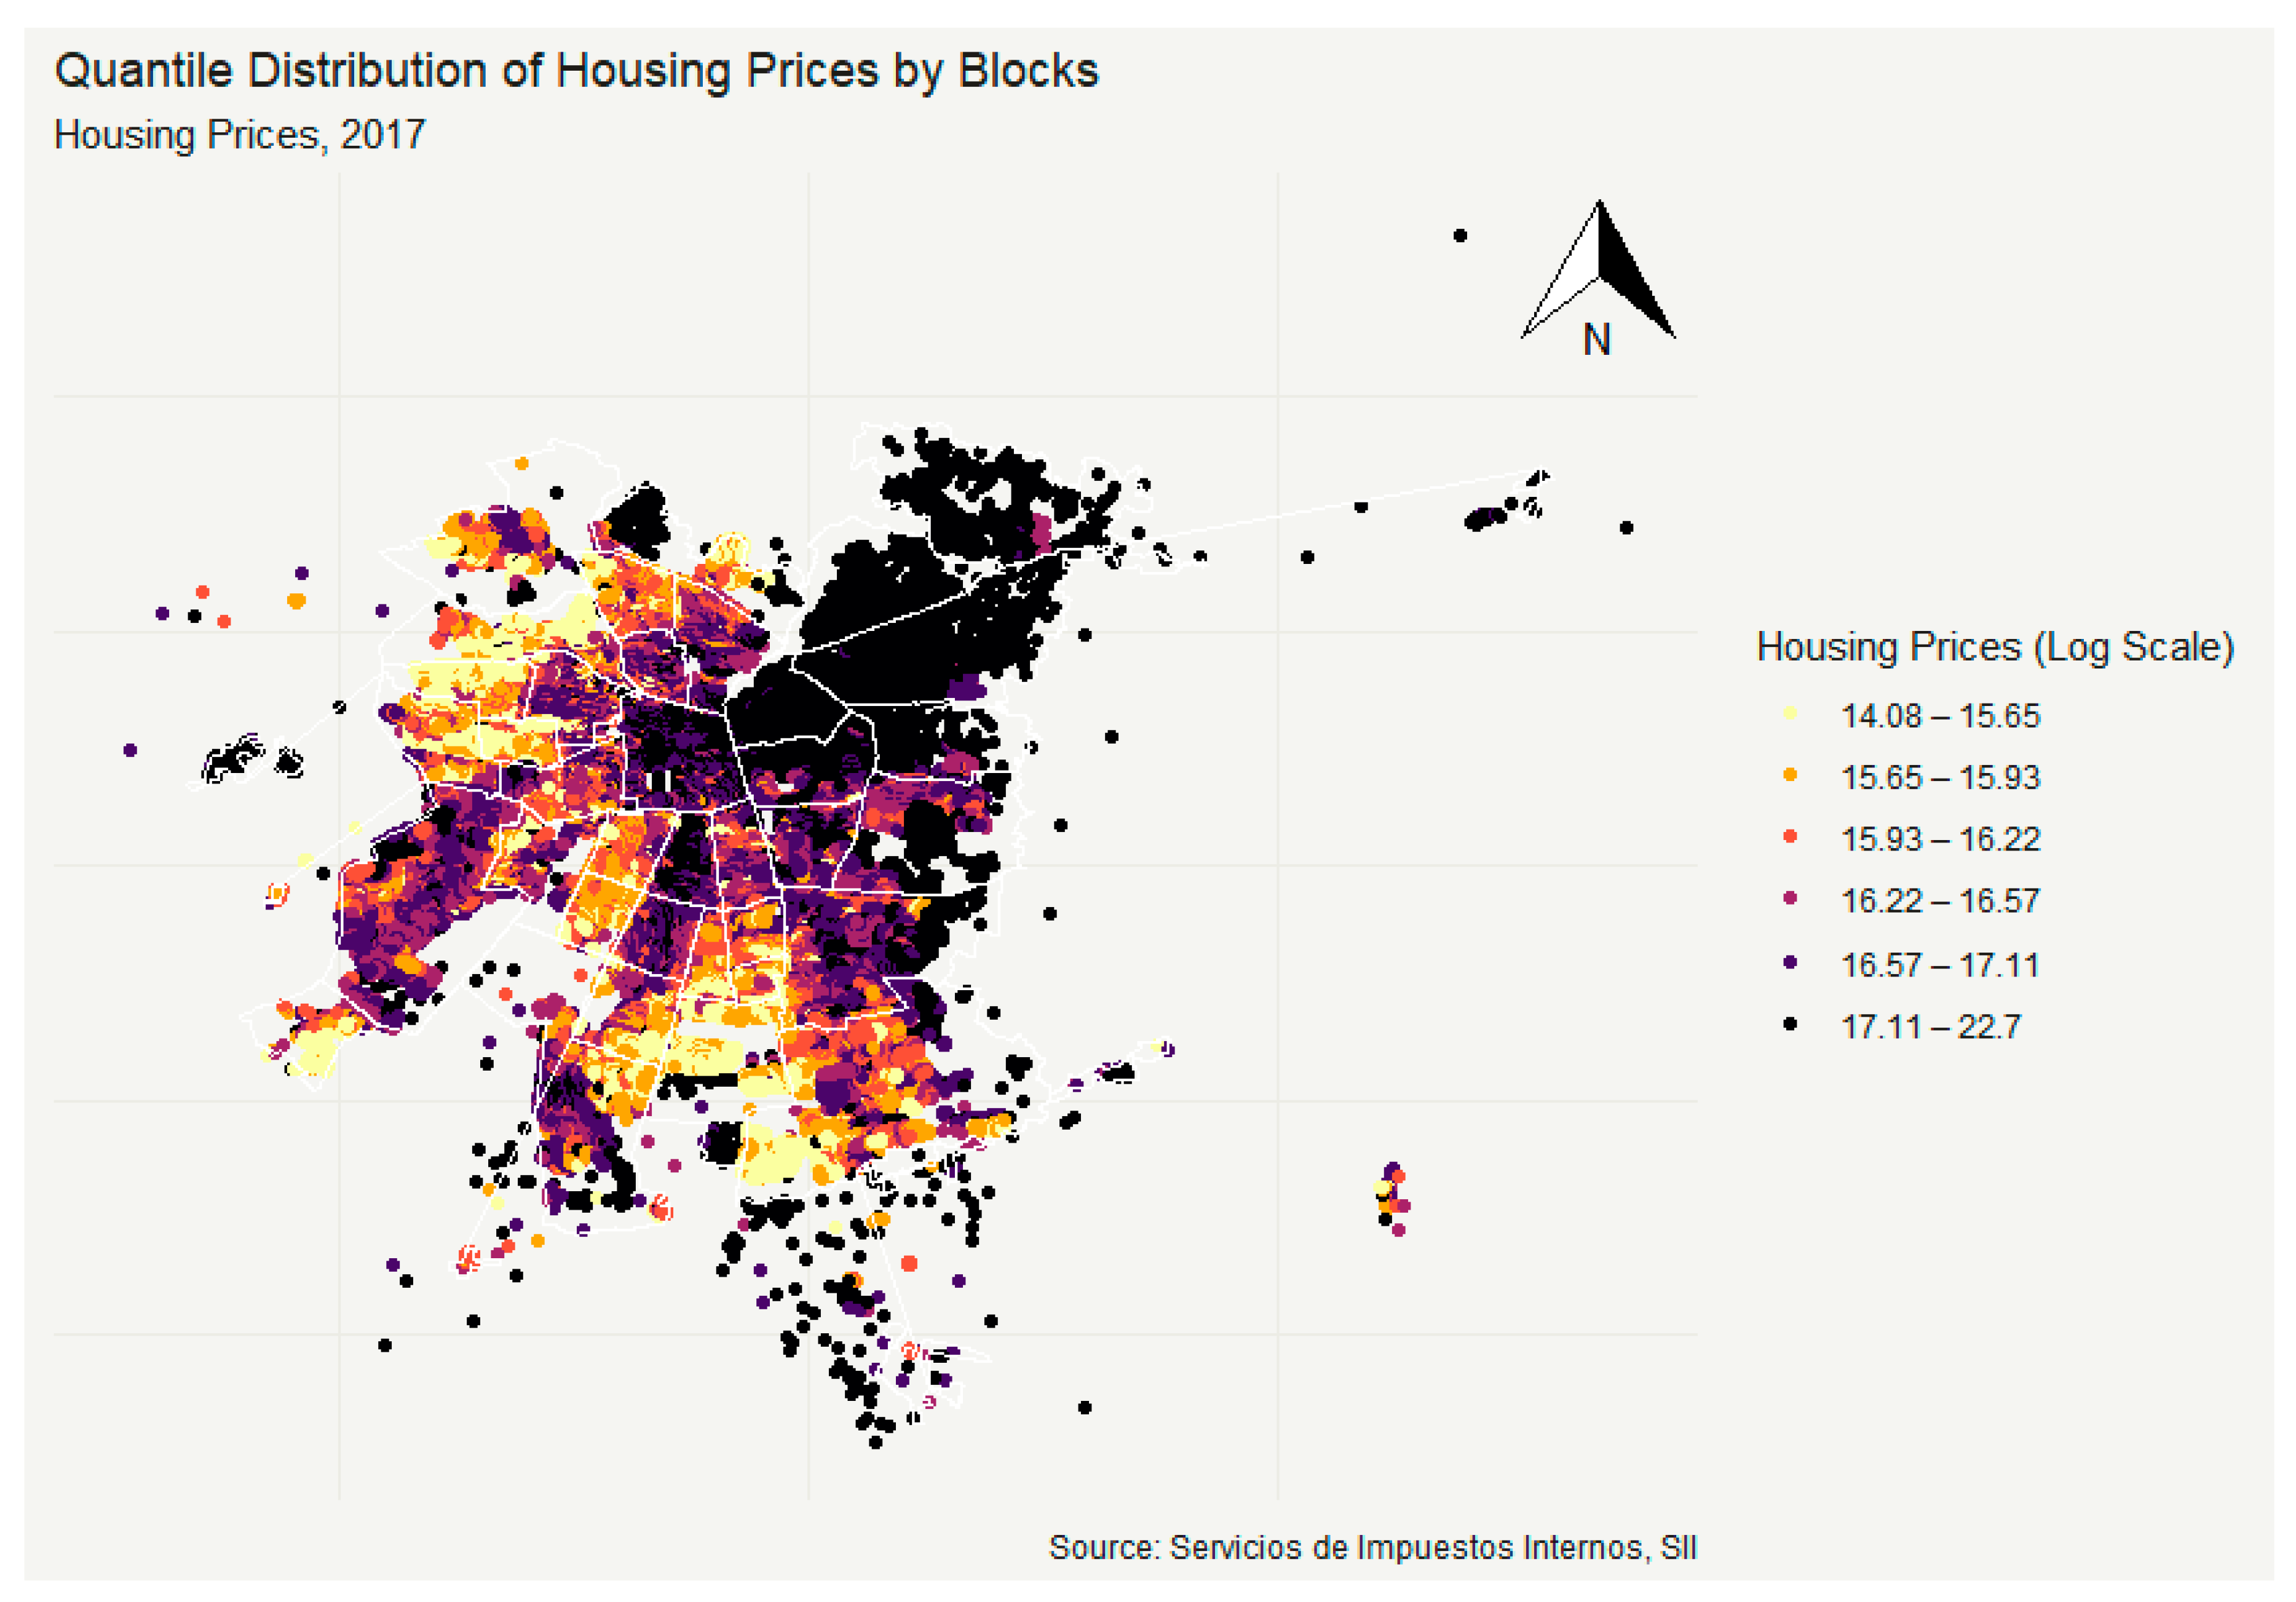
Figure 1 shows the spatial distribution of housing values by blocks using quantiles to identify possible residential clustering. Here, it is possible to identify two different clusters that contain more than 61 percent of all housings in the MR. However, 60 percent of houses are in places with lower housing values around lower-priced communities in the north-west and southern part of the MR. The spatial distribution of housing is relatively segregated and localized in the MR’s peripheral locations, reflecting the Chilean housing policies implemented from the 1970s. For instance, social housing was constructed on the fringes of urban areas because of lower land prices, and the state holds significant land proportions. The actual distribution of social housing in the MR can reflect this situation because 80.7 percent of affordable housing units are in peripheral municipalities [
21].
On the other hand, I analyze local public services’ spatial equity distribution using accessibility measures to schools, hospitals, parks, kindergartens, transportation, fire and police stations, and cultural equipment. These services have been used in several applications due to the critical contribution that public provision makes in the redistribution of income and quality of life [
22] (See, for example: [
8,
13,
16,
19,
23,
24,
25,
26,
27,
28,
29,
30,
31,
32,
33,
34,
35,
36]). For the Latin American case, a similar package of local services has been used by Powell and Sanguinetti (2010) [
37] to measure urban neighborhoods’ quality of life. In their research, these authors emphasize the importance of including urban public goods because policymakers must make appropriate decisions about the provision and distribution of these limited urban resources for improving the quality of life. The Chilean political constitution also declares this package to be a fundamental human right commonly managed by central and local governments (Local Government Act Nº 18.695). The information about these local public services, which come from different sources, is summarized in
Table 1.
4. Empirical Strategy
The empirical strategy used in this paper is twofold. To perform this analysis, I first need to compute an accessibility index to every local public service listed in
Table 1. The literature has not reached a clear consensus about the definition and formulation of accessibility; thus, this concept is not easy to quantify and generally depends on the empirical studies’ objectives [
38]. However, any index’s choice is critical because it will affect the representation of the spatial pattern of accessibility and the conclusions about spatial disparities [
23]. This decision must also be motivated by the different degrees of operationalization, interpretability, the communicability of each approach, and their computational costs because these measures are highly demanding in time and data [
38] (Vandenbulcke, Steenberghen, and Thomas (2009) [
38] provide an interesting discussion about different approaches for accessibility measures). Once I evaluated these issues, this study used the index proposed by Li et al. (2015) [
7], which can be classified as an infrastructure-based measure to analyze residents’ accessibility to local public services. This measure is selected because it is possible to include critical elements for accessibility, such as the range of activities individuals can reach in different locations and the degree of attractiveness of local public services, measured using different observable characteristics. The spatial accessibility distribution of local public services can also be represented using geographical distances. Finally, this indicator can be easily interpreted and partially reflects individuals’ financial and social costs for accessing urban infrastructure considering cities’ polarization due to housing market structure [
8]. Second, to analyze whether the distribution of local public services’ accessibility is equitable among income groups, I use the Quantile Regression Model (QRM) to study how housing prices can affect each local service’s distribution of accessibility. The results computed from this approach are complemented by Multivariate Local Indicators of Spatial Association (Bivariate LISA) to provide the spatial representation of this relationship. Although QRM offers an interesting way to study the relationship between accessibility to local public services and housing prices, it is impossible to observe this relationship’s spatial heterogeneity. This aspect is critical, considering the residential segregation patterns observed in the spatial distribution of housing prices in the MR. It is clear for the Chilean case that social status is closely related to the location inside cities [
39]. This key fact motivates incorporating the cities’ polarization, taking into account how these differences among social income groups might also be reflected and exacerbated by the unequal spatial accessibility to local public services.
The information provided by both methodologies contributes essential insights concerning the consequences of spatial development in urban areas, primarily due to Chile’s housing market liberalization from the 1970s. Incorporating private suppliers in the provision of local urban services generated several changes in the city configuration. Therefore, local governments need better information to deal with the spatial disparities of the local services’ provision, establishing a particular emphasis on the efficient allocation of these according to residents’ needs to reach a more sustainable development of communities. The next subsections describe in detail the methodology used to perform the analysis.
4.1. Index of Spatial Accessibility to Local Public Services
It is not possible to find in the literature a consensus about how to measure the accessibility to local public services; in this paper, I adopt the index proposed by Li et al. (2015) [
7]. This index aims to measure the spatial accessibility to local public services by considering the number of local public services and linear distances between blocks and destinations. This index is given by:
where
is the number of services located in a buffering area,
is the geographical distance from the ith local service to the community,
is the total buffering distance based on walk-access buffers to local public services, and
is defined as a constant to keep
stable within a reasonable boundary. For example, to compute the spatial accessibility to schools for a block, first, I need to identify the schools located in a buffering area. In this case, it is defined as a circle with a center located in a block and a radius of 2 km [
7]. The block’s accessibility to one school is computed by
. This procedure is repeated for every school located inside the buffer. The sum of each school access by block corresponds to the accessibility of all the schools in each block. This index has two important advantages. First, this measure captures the number of services that a resident can reach within a feasible distance radius. Second, its computation and interpretability involve fewer complexes than other indicators, such as utility-based or person-based measures. Thus, this accessibility measure correctly reflects how many services are available for residents and how separated these are from residents.
Table 1 summarizes the criteria used for computing spatial accessibility to other local public services, which differ in the buffering areas used according to each local service’s characteristics.
4.2. Quantile Regression Model (QRM)
Classical Linear Regression (LR) is generally the standard procedure for measuring the average of the relationship between a set of covariates to a response variable. In particular, this method computes conditional mean functions, but it does not consider the full conditional distributional properties of the outcome variable, and therefore LR only provides a partial picture of it. An alternative method to consider these critical properties is the Quantile Regression Model (QRM), which is based on the minimization of weighted absolute deviation and computes conditional quantile functions. This model helps to analyze the full distributional properties of a response variable by computing a conditional median function. This means that the method can be applied to explain the influence of determinant variables at any point in the dependent variable’s distribution. In this application, quantile regression can help to analyze how housing prices by block affect the distribution of each indicator of accessibility to local public services. By doing so, I study this relationship using the accessibility to local public service as a dependent variable; meanwhile, the explanatory variable is the mean of housing prices by block. Moreover, I include some control variables such as the share of exempted housing from property taxes by block and a housing quality index computed by the SII to characterize residents’ socio-economic conditions.
Table 2 summarizes the descriptive analysis of the variables used in the analysis.
Similar to the computation mechanism used in LR, the QRM minimizes the weighted sum of absolute residuals. In this case, consider a sample of
observations. Denote
as a
vector of the accessibility index, and
is a vector of the
matrix with
explanatory variables (in this case, housing prices, share of exempted housing from property taxes, and housing quality index). Then, the minimization problem of a quantile regression is written as:
where
is the vector of coefficient estimates and
is the quantile to be estimated. Additionally, the nth observation’s weight
is defined as:
If
, otherwise:
For instance, if , the criterion is minimized when 75 percent of residuals are negative. Then, quantile regression indicates how explanatory variables such as housing values by block influence the accessibility measure to any local public service at the 75th percentile of the conditional accessibility distribution. Standard errors of the coefficient are estimated using bootstrapping; therefore, standard errors are less sensitive to typical econometric problems such as truncation, outliers, heteroscedasticity, and unobserved heterogeneity.
4.3. Bi-Variate LISA
Although QRM shows how residents’ socio-economic conditions can affect the distribution of accessibility, this method cannot reflect whether housing price clustering is associated with the provision of local public services. This element is crucial to understand whether local public services’ spatial distribution is related to residential segregation patterns. The simplest form to identify spatial clustering is using local indicators of spatial association (LISA). LISA denotes to what extent similar values are clustered around an observation based on the concept of local Moran’s I. This spatial statistic is a univariate indicator. However, LISA can be extended to study the spatial association of two variables as well. In this paper, I introduce the Bi-variate LISA to study the association between housing prices and accessibility to local public services. This statistic shows the degree of linear association, which can be positive or negative between one variable in a given location and the average of another variable in neighborhood communities. I seek to study the linear association between housing prices by block concerning the accessibility average to local public services in this approach. Bi-variable LISA is computed as follows:
where
represents the housing price in the block
, and
is the accessibility to a local public service in block
, respectively. Furthermore,
and
are the average values of both variables; meanwhile,
and
are their variances. Finally,
Wij is the spatial weight matrix defined as a binary matrix, where a neighbor set for each observation is identified with non-zero elements for neighbors and zero for others.
This indicator’s interpretation establishes that a positive association suggests a similar spatial clustering of both variables, and negative relations assume the opposite result. Consequently, this measure provides a clear picture to understand how the spatial association between residential segregation and the provision of local public services is working by defining four distinctive groups: high housing prices and high accessibility to local public services, low housing prices and low accessibility to local public services, high housing prices and low accessibility to local public services, and low housing prices and high accessibility to local public services.
5. Results and Discussion
In this section, I show the main results of the analysis performed via the QRM. The dependent variable is the accessibility index computed for every local public service considered in the analysis, and explanatory variables are the mean of housing prices by block and control variables regarding the socioeconomic characteristics of housing (The Tables that summarize results from the QRM are available by request (Supplementary Material)). Due to space and word limitations, I analyze the mean of housing prices by block on the accessibility index computed for every local public service.
Figure 2 shows the panels that support the coefficient behavior related to housing prices. With these quantile charts, it is possible to examine the quantile estimator at certain conditional quantiles, permitting quantifying the variations of the conditional distribution of the accessibility indicator for each local public service, conditioned on housing values prices (The x-axis is the conditional quantile and the y-axis represents the coefficient distribution associated with housing prices. These quantile charts also include the 95% confidence intervals). As the language of the discussion concerns the conditional distribution, I always refer to the conditional mean or specific conditional quantiles. In this way, the block’s higher (lower) accessibility indexes are located at higher (lower) positions in the conditional accessibility index distribution, conditioned on the mean of housing prices by block. Regarding local public services, we should expect that, on most of them, their accessibilities increase when housing prices decrease. However, this behavior differs in local public services located in the MR. For instance, housing prices based on accessibility to public schools are negative, but they are less negative for the lowest and highest-income quantile groups. In this sense, a U-shaped coefficient behavior is found (panel 1). This implies that middle-income groups are receiving more benefits because they have more access to local public schools than other income groups. Panel 2 shows the same analysis for public schools but only considers those with higher national standardized SIMCE tests (more than 250 points) (SIMCE is a national standardized test used to measure the quality of education across students. This system aims to improve Chilean education’s quality and equity by reporting information about student performances and the learning environment). The behavior observed for this group is the same as the full sample of schools, where middle-income groups are receiving more access to better schools.
According to the analysis, it is possible to observe the distribution of high-quality educational public services by income groups. In this way, middle-income and high-income groups have better access to high-quality public schools than lower-income groups. This shape is likely caused by the influence of housing prices on the access to semi-private schools observed in panels 3 and 4. Considering that semi-private schools have better performances in quality terms than public schools, this analysis reveals that high-quality educational services are still more concentrated and closer to higher-income groups. This implies that disadvantaged individuals face more difficulties in accessing public schools than more affluent individuals because the latter can compensate for their lower access to these schools by increasing their access to private schools. In panel 5 and 6, I find a positive relationship between housing prices and accessibility to private schools. Consequently, higher-income groups prefer private schools, and low-income groups are excluded from these services.
Panels 7 and 8 show the quantile coefficients’ behavior for the accessibility to public transportation: bus and subway stations. In this case, I find a U-shape in the accessibility to buses following the same pattern as public schools; lower and higher income groups are suffering a lack of accessibility for these services. In particular, two facts might explain this shape. First, most low-income and high-income households are located on the outskirts of the MR, and both groups could be suffering problems concerning the insufficient route coverage that exists outside the city’s central areas. However, only wealthy families have higher probabilities of possessing cars, which allows them to benefit from highway systems. Higher-income groups can switch from public transportation to private vehicles, overcoming the commuting constraints that disadvantaged individuals must handle to accessing central areas. Additionally, medium-income groups have more access to subway stations. From this analysis, I can confirm that housing location is still relevant in determining access to local public services; subway stations are mainly designed to connect the central areas of the MR, where commercial activities are located. Considering that housing prices also respond to these kinds of activities, we expect high access to subway stations due to high housing prices.
Panels 9 and 10 show a different behavior regarding accessibility to urban public parks. In panel 9, it is possible to observe a similar effect of housing prices on urban public parks. In terms of supply, urban public parks’ distribution is more equitable between income groups than other local public services. However, if I consider only urban public parks with a surface over 5750 square meters, the behavior of coefficients by quantile follows the same pattern as private services (e.g., private schools). This surface represents the mean of green area size at the MR. Therefore, accessibility to larger urban parks is still determined by housing prices because the access is higher when housing prices are higher, reflecting their unequal distribution regarding the most impoverished population. The current Chilean regulation of urban areas can offer a possible explanation; it does not define a minimum size for a park, but only the obligation of using a percentage of urbanized land to build parks. In this way, developers can assign small proportions of land to urban parks because it is impossible to build more affordable housing and, therefore, small green areas proliferate without considering the population density of locations (Reyes and Figueroa, 2010) [
40]. Consequently, the provision of urban parks is unequal and insufficient across neighborhoods with few large parks concentrated and closer to high-income groups.
The remaining local public services, such as kindergartens, hospitals, fire and police stations, and cultural equipment, follow the same U-shape pattern as other local public services. The behavior of coefficients is available in panels 11 to 15. In this sense, lower-income and higher-income quantiles are still receiving less access to kindergartens, hospitals, and fire and police stations, respectively. Culture services are the exception because they present a fairer distribution between income groups. Moreover, I do not find significant coefficients for middle-income and higher-income groups and reflect that incomes do not affect access to cultural services. Finally, I can conclude that income groups are still determinants of the accessibility to local public services, with significant differences. In this case, middle-income groups are receiving higher proportions of local public services than others. This detail converts to residents’ location being a relevant element for the shaping of local public services’ spatial distribution. Notwithstanding, these results cannot reflect if housing price clustering is associated with local public services.
To overcome this problem, I use Bi-Variate LISA to determine whether the spatial distribution of income groups is also related to the spatial distribution of local public services.
Figure 3 depicts the main results obtained from this analysis. The LISA statistic shows that more than 50 percent of communities are clustered. Moreover, I observe a systematic concentration of higher levels of accessibility to local public services in the MR center and northeast areas. Meanwhile, groups with insufficient levels of accessibility are mainly located in other areas of the MR. For instance, LISA for public schools evidences this behavior (panels 1 and 2). Higher levels of accessibility are at the center, and groups with lower levels of accessibility are located in the eastern areas and some areas of the western part of the MR. Notably, in the eastern area, it is possible to identify two groups: lower-housing prices with lower accessibility and higher-housing prices with lower accessibility levels. These results confirm previous results where high-income and low-income groups are suffering substantial disparities in access to public schools, with both groups mainly located in the MR’s eastern area. However, public schools’ spatial distribution with better performances in SIMCE is still unequal, particularly in deprived communities. High-income groups located in the center and northeast areas of the MR are receiving higher levels of accessibility to better schools, where there are also high-housing prices.
On the contrary, low-income groups located in the MR’s southern areas suffer significant disparities in accessing high-quality public schools. This situation determines that lower-income groups are excluded from these services, which reduces their probabilities for accessing better education opportunities than households located in the center and northeast areas. Considering that high-income groups are more likely to choose the private version of schools characterized by high-quality performances, these results confirm that residential segregation patterns are reinforced by low accessibility levels to public schools, excluding the most deprived communities from high-quality public services. This situation reveals that the urban space in MR is not only segmented by the stratification of communities. Additionally, the unequal distribution of accessibility levels can exacerbate this shape, with relevant differences in terms of well-being or capitalizations of public services into housing prices.
Figure 3, panels 5 and 6 show the bi-variate LISA for private schools, where high-income groups are receiving more high-quality services than low-income groups.
A similar spatial distribution is also observed for urban parks. Panel 9 shows that high-income groups receive higher levels of accessibility to public urban parks than lower-income groups located in the MR’s southern areas. Larger parks exacerbate this situation (panel 10). Higher levels of accessibility to urban parks are available to high-income areas, and lower-income groups located in the northwest and southern part of the MR are marginalized from these types of urban parks. Finally, LISA maps for other local public services, such as transportation, kindergartens, healthcare centers, fire stations, police stations, and culture infrastructure, confirm that lower-income groups receive fewer proportions of local public services. These groups are located mainly in the southern and northwest areas of the MR. This evidence supports the idea that residents’ location is strongly associated with local public services’ spatial distribution patterns, which might have significant consequences in migration decisions exerted by individuals. In this case, residential segregation patterns are marked and exacerbated by the unequal distribution of local public services across the MR. This implies low access for the most impoverished population by excluding them from enjoying better living standards or opportunities to have access to essential services such as schools, hospitals, or transportation.
Furthermore, these results reveal the historical roots of residential segregation patterns that characterize Latin American urban areas. Scholars agree that Latin American cities have experimented an accelerated urbanization process without dealing adequately with diverse urban problems such as crime, poverty, the deficit of public housing, and the lack of public services [
20]. In the Chilean case, residential segregation patterns are particularly more intense than other Latin American urban areas [
4], which was exacerbated by the liberalization of the housing market in the 1970s. This remarkable fact produced several changes in the cities’ configuration, leaving market forces to define land prices. Private urban planners’ inclusion facilitated the emergence of significant disparities across communities, which resulted in the notorious division between rich and poor within cities [
39]. The MR’s polarization due to deregulation of the housing market has also weakened the State’s normative role as an urban planner, facilitating gated communities with exclusive urban facilities and separate security systems serving high-income groups [
21]. As Tiebout (1956) [
6] predicted, market forces have generated an unequal distribution of local public services among communities because now the provision of these urban facilities is considered an efficiency problem rather than an equity issue. Therefore, high-income local governments with upper and middle classes have more opportunities to provide high-quality local services because higher amounts of local taxes can be collected from these social groups. This situation permits them to respond faster to local demands from affluent groups, providing and attracting more high-income individuals to preserve social status.
Conversely, lower accessibility to local public services experienced by low-income groups located at the MR periphery also coincides with the state’s social housing projects implemented during the 1970s. The main objective of these policies was reducing the public housing deficits and increasing housing ownership by implementing different subsidies, which were mainly concentrated on households with incomes below US
$400 per month [
2]. Despite these public policies successfully reducing housing deficits, new neighborhoods were relocated in places far from the city’s center and within communities with higher poverty levels and social problems such as crime or drug abuse. As Borsdorf et al. (1989) [
21] highlighted, this “new poverty” emerged due to the absence of a precise spatial dimension of public policies to include low-income residents into the urban system, reinforcing social segregation patterns and dramatically reducing the living standards of the most impoverished population. This situation also has significant economic implications for the hosting municipalities of social housing projects because social housing units do not pay local taxes. Thus, these local governments have been facing more income restrictions for the provision of local public services. Deficits in terms of quantity and quality in local public services can also be found in poorer municipalities because they also face higher demand for these services. As local public facilities are not sufficient, households must assume commuting costs or overcome budget restrictions for accessing more and better local public services or private urban facilities. Finally, these results reveal that local governments could play an essential role in shaping local public services’ spatial distribution into the MR, revealing the need to implement a more flexible institutional framework to deal with the unequal allocation of scarce urban resources in the MR.
6. Conclusions
The study of the relationship between local public services and residential segregation takes on a vital significance when it is considered to be the social manifestation of spatial income inequality. It means that the unequal distribution of income across communities can also be observed in the unequal distribution of local public services, which are fundamental rights that everyone must receive from central governments. However, this relationship is still relatively unexplored by the empirical literature, especially in cases that differ from the US context. This paper wants to build a bridge between both concepts by analyzing the accessibility to local public services and residential segregation patterns for the Metropolitan Region of Santiago, Chile (MR). In this paper, I studied how the spatial accessibility to local public services is equitably distributed among different social and economic groups. To accomplish this objective, I used an accessibility index based on physical distances, quantile regression methods, and multivariate local indices of spatial association (LISA) to understand how housing prices by blocks can determine the accessibility to essential local public services such as schools, transportation, hospitals, parks, fire stations, police stations, and culture infrastructure.
The results suggest that accessibility to local public services has an unequal distribution between housing units and economic classes. However, these differences significantly affect lower-income groups, who are suffering significant deficits in accessing local public services. Geographically, lower accessibility levels are at the periphery of the MR, where poor municipalities and housing social projects are located. This situation has important implications for lower-income residents and local governments. On the one hand, these neighborhoods are in places with low land prices and are far from core areas, resulting in social problems such as crime and drug abuse due to their exclusion from urban systems. Therefore, the location of social housing projects at the MR fringes could increase residential segregation patterns with negative consequences for the most impoverished living standards. Local governments are also suffering severe budget deficits, limiting their provision of local public services, due to the high number of housing units exempted from local taxes that exist in their communities. Their budgets are insufficient to satisfy the high demand for local public services, which can be observed in the insufficient infrastructure and low-quality performances. Under this scenario, poor residents suffer a “double-disadvantage” due to their social exclusion from urban centers and their limited accessibility to local public services. I found evidence confirming that social housing public policies could cause insufficient accessibility levels, which reinforces residential segregation that the most impoverished population must assume. Even if the most affluent residents also face lower levels of accessibility to public services, they still keep more advantages concerning other social groups.
Overall, these findings have important public policy implications, especially for local governments, because they can play an essential role in shaping the spatial accessibility to local public services. In this vein, disparities in local public services provision are strongly associated with the concentration of municipal incomes across the MR. Moreover, this unequal pattern also reduces the most impoverished population’s opportunities to access more and better local public services concentrated in places with higher-income residents. With this in mind, these results are significant and could be utilized to incorporate the spatial dimension into the design of public policies to allocate efficiently scarce resources such as local public services, according to individuals’ requirements. On the other hand, these results confirm that housing prices’ higher residential stratification levels are also strongly associated with local public services’ unequal spatial distribution. In particular, these results show how the supply of local public services might be motivated by the spatial sorting of individuals across communities, reflecting, in part, their desire for local amenities [
20]. For instance, Mendez and Gayo (2019) [
41] introduce a stimulating discussion about how residential and school choices are intimately related, recognizing that both decisions are unequally distributed across the Chilean population. Consequently, upper and middle classes choose places of residence by considering the opportunities that schools offer to children for developing social capital and, in this way, to reproduce and preserve social class positions [
41]. This last statement can also be extended to other local services, with upper and middle classes continuously seeking to enjoy particular urban amenities and high-quality infrastructure. Therefore, wealthier local governments have more opportunities to attract high-income individuals willing to pay more local taxes to access high-quality local public services. As a result, these municipalities can generate a virtuous circle that permits more local taxes by reinforcing the relationship between public services and housing values. On the contrary, lower-income groups residing in communities with lower local revenues have fewer possibilities to improve their living standards because they are marginalized and excluded from high-quality local public services. Although I do not seek to explain the causal relationship between the spatial distribution of local public services and residential segregation patterns, I recognize that local governments could play an essential role in addressing these problems by reducing severe differences observed in the MR. Due to the liberalization of the housing market experimented in Chile from the 1970s onwards, local governments, as the main providers of local public services, need a more flexible institutional framework to respond quickly to residents’ needs, similar to private suppliers of urban amenities. The introduction of private suppliers in the housing market has generated several changes in city configurations, creating more polarized cities with a notorious difference between rich and poor [
39]. Thus, this situation emphasizes the relevant role that local governments can exert in allocating scarce resources across communities to improve low-income individuals’ living standards. Further research about how local government revenues and institutional restrictions affect local response capacity in the resolution of these problems could be addressed to obtain a better understating of this stylized fact.


