Abstract
Waste is increasingly used as a renewable resource. Industrial symbiosis is an innovative concept for more efficient use of waste streams within industrial complexes, with the aim of reducing the overall environmental impact of the complex. Industrial symbiosis plays a more important role in promoting green economic growth and building low-carbon cities. Based on the ecological theoretical framework, combined with Waste Flow Analysis (WFA), the material flow analysis (MFA) and production matrix methods were used as the core to construct the Industrial Symbiosis System Waste Flow Metabolism Analysis (ISSWFMA) model. In addition, taking the “Jinchang Model” as an example, a typical case selected by the National Development and Reform Commission of China’s regional circular economy development model, we conducted a refined quantitative study on the flow and metabolism of waste flow in the regional industrial symbiosis system at the City-Region level using the circulation degree index. The following conclusions were obtained from the study: The ISSWFMA model can better describe the flow and metabolism of waste streams in the industrial symbiosis system at the City-Region Level and can provide data and methods for storage management. As the internal industrial chain and the correlation between various departments continuously improved, the Circulation Index (CI) of solid waste, wastewater, and exhaust gas in the industrial symbiosis system of Jinchang City showed an overall increasing trend, the degree of recycling was continuously increasing, the industrial symbiosis ability was continuously enhanced, and the system structure was more complete. At the same time, based on the analysis of different wastes, the industrial symbiosis is developed at different stages; based on the analysis of solid wastes, the industrial symbiosis ability of Jinchang’s Industrial Symbiosis System has strengthened and accelerated the fastest from 2005 to 2010; based on the analysis of wastewater, the industrial symbiosis ability of the system strengthened slowly during the whole study period; and based on the analysis of exhaust gas, the industrial symbiosis ability of the system continued to strengthen rapidly during the whole study period. Finally, on the basis of further discussion on the selection of waste recycling paths, we proposed to give full play to the role of market mechanisms, and to build recycling areas and ecological areas by strengthening industrial symbiosis and its derived urban symbiosis to achieve the goals of natural resource conservation, ecological environment protection, and harmonious coexistence between human and nature.
1. Introduction
As the global sustainable development process advances, the requirements of environmental laws and regulations continue to increase, the cost of waste disposal is increasing, the technological level of the human socio-economic system continuously increases, and the understanding of the potential value of waste is enhanced [1]. Waste is no longer considered to be “valueless”. Instead, it is gradually being used by humans as a substitute for resources [2,3], and its resource utilization has become an innovative approach for waste management and green design [4,5,6]. It is predicted that in the next 30 years, the raw materials provided by global waste recycling will increase from about 30% to 80% [7]. Waste recovery, recycling, and final disposal are the sink of waste management. However, from the perspective of sustainable development of “green” and “low-carbon”, the current contribution of the recycling industry to the development of a recycling-oriented society is still limited. Therefore, it is urgent to establish a more complete waste recycling system and effective management tools [8]. As an innovative concept for waste recycling, industrial symbiosis has promoted green economic growth and improved resource efficiency [9,10], and has been adopted by the European Union’s “Leading Resource Efficiency Initiative” as a recommended method for obtaining resource efficiency. In the past 15 years, governments in China at all levels have adopted policies, fiscal measures, and legislation to vigorously promote the development of waste recycling and industrial symbiosis, thereby transforming the linear economy mode into a more circular economy mode [11]. On this basis, in order to promote the sustainable development of resources, environment, and economy, it is of great significance to study the flow and metabolic process of waste in the industrial symbiosis system, and quantitatively analyze the role of reduction, recycling, and resource utilization on the development of industrial ecology and the improvement of environmental pressure.
Waste flow is type of material flow, in which recycling and final disposal are also considered [12]. The waste flow analysis method mainly analyzes the waste flow and flow direction, and pays attention to the resource treatment after the product is discarded. In the waste flow analysis method, the input of the substance is waste rather than raw materials, and the output is also a recycled product [13]. At present, waste flow analysis focuses on three flows (element flow, material flow, and product flow) and five levels (corporate waste, departmental waste, regional waste, national waste, and global waste). Analysis methods mainly include substance flow analysis (SFA), material flow analysis (MFA), and statistical research for analyzing material streams (STREAMS). For example, Melo [14], Beers [15], Davis [16], Zhang [17], Yue [18], Chen [19], and others have studied the metabolism of scrap metals using elemental flow analysis or material flow analysis methods. Byström [20], Joosten [21], Hekkert [22], Bacha [23], and others adopted the STREAMS analysis method and multivariate regression model to study the flow of wastepaper and wood waste. In addition, many scholars have set a series of indicators including waste recovery rate and waste recycling rate to reflect the degree and efficiency of waste recycling in the economic system. For example, Hagen [24] and Berglund [25] analyzed the influencing factors of waste recycling rate, including regional policies, geographic/demographic variables, and socioeconomic and environmental quality. Byström [26] used the environmental load unit index (ELU-index) to describe the load on the environment caused by waste discharge and the use of non-renewable resources. Yamashita [27] established the Circulation Index (CI), which used the pre-consumption Circulation Index and the post-consumption Circulation Index to measure the quality and usage time of resources, respectively. Brown [28] proposed to use unit entropy to measure the circulation ability.
At the same time, because the goal of constructing a regional waste management system is to maximize the economic and environmental benefits of waste treatment, input–output analysis methods have widely been used in waste measurement analysis. Leontief proposed the environmental input–output pollution reduction model in 1970 [29,30], which quantitatively analyzed waste reduction activities and the relationship between traditional product production departments and waste treatment departments. Since then, many scholars have improved the structure of the environmental input–output table according to different research needs. Hubacek and Giljum [31] proposed a method of adding waste emissions to the material use part of the physical input–output table (PIOT). Suh [32] also proposed to add waste items to PIOT, but Suh used waste as negative input items in the material supply part. Hoekstra [33] compared the basic physical input–output table, the extended physical input–output table, and the complete physical input–output table, and then supplemented and proposed the complete physical input–output table. In the field of environmental input–output analysis based on mixed input–output tables, Leontief pointed the inconsistency between the three assumptions of the environmental input–output pollution reduction model and the actual situation (For example, landfill is a treatment method that can be adopted for all solid wastes, while kitchen waste can be treated in various ways such as incineration, biogas production, landfill, etc.). Nakamura [34] proposed the waste input–output (WIO) model to solve the management problem of waste life cycle.
However, most of the above studies focused on the flow and metabolism of a single waste such as wastepaper and scrap metal in a certain enterprise or park, lacking refined quantitative research on the waste flow in the City-Region Level regional industrial symbiosis system [35]. Therefore, in this study, under the theoretical framework of material metabolism and industrial ecology, the “Jinchang Model”, a typical case selected by the National Development and Reform Commission of China’s regional circular economy development model, was used as the research object. Based on the element flow proposed by Wang et al. [36], we combined flow analysis (WFA) and waste metabolism input–output analysis (WMIOA) to construct the industrial symbiosis system waste flow metabolism analysis (ISSWFMA). In addition, the Circulation Index was used to accurately characterize the waste flow and metabolism process in the Jinchang industrial symbiosis system from 2005 to 2019, thereby expanding the research method of waste flow at the City-Region level, and providing a decision-making foundation for the government and enterprises on the refined management of the industrial ecosystem.
2. Studied Cases
Jinchang City is located at 101°04′35″–102°43′40″ east longitude and 37°47′10″–39°00′30″ north latitude. It is located in Northwest China and is a typical mineral resource city. The city has more than 50 types of discovered mineral deposits. Among them, the production of nickel, cobalt, and platinum group precious metals accounts for more than 90% of the national total, thus the city is well-known as the “China Nickel Capital”. Jinchang City is China’s largest nickel and cobalt production base, the smelting center of platinum group precious metals, and one of the three major bases for comprehensive utilization of resources in China. Since 1978, Jinchang City has focused on terminal management to solve the problem of comprehensive utilization of mineral resources. From 1990 to 2005, Jinchang laid special emphasis on the development of non-ferrous metal deep processing industries, focused on solving the problem of resource utilization of sulfur dioxide, and promoted the development of chemical industry dominated by sulfide-based resources, thereby initially forming an industrial symbiosis system. Since 2006, the first circular economy development plan in Gansu Province, “Jinchang City Circular Economy Development Plan (2006–2020)”, has been compiled and implemented. The circular economy was developed from three systems, i.e., circular industry, circular agriculture, and circular society. The pilot work with enterprises as the focus and parks as carriers was carried out. On the basis of principal industries such as nickel and cobalt, through the construction of a resource recycling industry system, the industrial ecological chain dominated by energy chemical industry, sulfide industry, chlor-alkali chemical industry, and coal chemical industry was formed, such as “copper nickel sulfide mining-roughing-refining-nickel copper cobalt rolling and new materials”, “smelting exhaust gas-sulfur dioxide-sulfuric acid-sulfide industry”, “caustic soda-chlorine-PVC-calcium carbide slag-cement”, etc. This has promoted the development of circular economy from enterprise to the industrial and regional level, and has gradually transformed from the development relying on single resource to a multiple resource-based urban industrial symbiosis system. The transformation is called the “Jinchang Model” (Figure 1). In 2008, the National Development and Reform Commission designated Jinchang as a national new material and high-tech industrial base. In 2010, the Ministry of Industry and Information Technology designated Jinchang as a national demonstration base for new industrialization industries. Especially, in 2011, Jinchang was selected by the National Development and Reform Commission (NDRC) as one of the 60 typical cases of regional circular economy and was promoted nationwide.
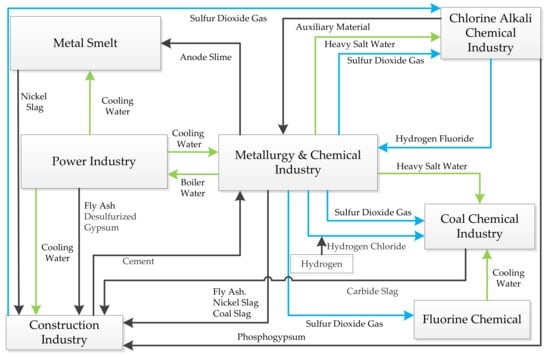
Figure 1.
The industrial symbiosis system of Jinchang.
In Figure 1, the green, blue, and black lines represent the recycling processes of wastewater, exhaust gas, and solid waste, respectively. The waste heat resources were fully recovered to produce steam, and the heating system generated heat and power simultaneously. SO2 was used to produce solid sulfur, liquid sulfur dioxide, sodium sulfite, and other sulfuric acid products. Using wastewater recycling systems and underground mine wastewater reuse systems, as well as constructing the two-level wastewater treatment stations, the recycling of mineral processing water within the plant was strengthened. Mine wastewater was used for mines, plant greening, and production, and refining wastewater was treated to recycling the valuable metals. Through the tailings filling test, the beneficiation tailings were used in underground filling. The tailings and waste agricultural mulch are used to make composite templates, well covers, and well rings, replacing steel templates and cast iron well covers. The supporting facilities for dry and wet fly ash production, storage, and utilization were built, and fly ash was used to replace part of the cement for underground filling. Moreover, a production line of underground filling partition walls using slag production was built, and the filling partition walls built with cinder bricks were used to replace the original wooden filling partition walls, which promoted the comprehensive utilization of fly ash and boiler slag.
3. Materials and Methods
3.1. Methodology: Production Matrix
The production matrix is a quantitative representation of the conserved flows over a given time (i.e., instantaneous flows) in a system [37]. Given a physical system, the production matrix represents observations of that physical system that are mathematically dissected using flow analysis. In its most general form, P is a square 5n∗5n matrix, as shown in Table 1.

Table 1.
Production matrix P.
Where n is the number of processes (the processes are denoted by Hk). An element pij of P is a flow from the element associated with Column j to the element associated with Row i.
Then P is divided into several submatrices, as shown in Equation (1).
The notation used in Table 1 is as follows:
- Hk = a Process k, k = 1, …, n; is regarded as a node in graphical models,
- zi0 = inflow (mass or energy per unit time) to Process i from outside the system,
- y0j = outflow (mass or energy per unit time) from Process j to outside the system,
- fij = flow (mass or energy per unit time) from Process j to Process i, and
- xk = time derivative of state xk of Process k,
where
Positive state derivatives, k+, represent an increase in the size of accumulations, whereas negative state derivatives, k−, represent a decrease. The state derivatives are represented in such a way that all k− are modeled as inflows (increasing flow at a process by decreasing a stock size), whereas all k+ are modeled as outflows (decreasing flow at a process by diverting flows to storage).
The modeling of negative and positive state derivatives is apparent in the equations for throughflow as inflows and outflows. Throughflow Tk of Hk is defined as the “rate of energy or material flow through Process k” [38]. As shown in in Equations (4) and (5), throughflow is mathematically defined as either the sum of each row in P21 and P22 or the sum of each column in P22 and P32.
In Equation (4), all inflows to a process are summed (inflows from other processes, from outside the system, and from decreasing stock sizes), whereas in Equation (5), all outflows from a process are summed. According to the law of conservation of mass, the two expressions, must be equal. Tk and P represent the abstraction of a physical system of flows that is modeled in input–output flow analysis; that is, they are the observations of a physical system to which the input–output mathematics are applied.
After defining P, the mathematical analysis of input and output can be introduced into the operation. First, it is necessary to analyze the material flow between the two departments, i.e., fij. Then qij* is introduced to show the proportion of fij in the flux Ti of Sector i.
Substituting Equation (6) into Equation (5), Tk can be expressed as
In Equation (7), the first part on the right side of the equation is used to represent the total flow from the department of Hj into other departments in the system. After linear transformation, Equation (7) can be transformed into the matrix in Equation (8). In the equation, Q*22 is the matrix form of q*ij and serves as a sub-matrix of the instantaneous inflow matrix Q*.
In Equation (8), and are the diagonal matrices, and the element qij* of Q* is the ratio of each element pij in the production matrix P to the flux Ti of Hi. The structure of the Q* is as follows:
By shifting the term, Equation (8) can be re-expressed as
Multiply both sides of Equation (10) by (E − Q*22) −1, the following equation can be obtained:
Therefore, N*22 can be defined as follows:
Similarly, N*22 also exists as a block sub-matrix of N*. The general form of N* is
Hannon [39] referred to the matrix of N* as the “structure” of the ecosystem because it represented the direct and indirect flow between the various sectors that construct the entire system. Patten et al. [40] considered N* to be a closure transitive matrix, in which all direct and indirect dependent paths were included. Szyrmer and Ulanowicz [41] gave a further description of N*, as shown in the following equation:
where the identity matrix E represents all the initial flows of the system, Q* represents the first-level direct flow between the sub-wholes within the system, (Q*) k represents the k-th level flow path in the system, and matrix N* means all direct and indirect flows in the system.
After defining N*, in order to more intuitively reflect the recycling efficiency of substances in the system, the input–output index is introduced to the analysis. The departmental flux Tk has been defined in previous sections, and the total system throughflows (TST) is introduced here, which represents the total material “throughflow” in the system and calculates the amount of material flowing through each department each time.
Path length indicates the number of processes visited by a flow. Each inflow zk0 has an individual path length (ZPLk), representing the average number of processes visited by material entering via zk0 before leaving the system. Similarly, each outflow y0k has an individual path length (YPLk), representing the average number of processes visited by material before leaving as y0i. Each of these measures is calculated using the central submatrices of the inflow and outflow transitive closure matrices ZPLk and YPLk.
The average path length of an entire system, PL, is the sum of either the inflow or outflow PLs weighted by the relative size of each inflow or outflow, respectively. A simpler mathematical expression for PL, however, is simply TST divided by the sum of inflows, as shown in Equation (18).
where
A system that is highly interconnected with material feedback loops would have a higher PL than a similar system without any material feedback. For a system containing a given number of processes, the shortest PL possible is attained with linear flows, that is, flows proceeding from one process to the next without any feedback. PL, then, is an indirect measure of flow cycling, but it does not measure cycling directly. Two other metrics are developed for that purpose.
Based on the preceding quote, REk can be formulated as a function of elements from either transitive closure matrix as follows:
Furthermore, the amount of cycled flows in the system can be defined as follows:
A Circulation Index (CI) for a flow system is defined as the percent of the cycled TST (TSTc).
By calculating the Circulation Index, it is possible to gain a direct understanding of the material flow and utilization within the system, and thus understand the interrelationship of various departments in the system.
3.2. Model: ISSWFMA
The core and essence of industrial symbiosis is the use of one enterprise’s waste as another enterprise’s raw material. Based on the element flow proposed by Wang et al. [36], we combined WFA and WMIOA to establish the ISSWFMA model (Figure 2), and the production matrix was used to clarify the flow and recycling of waste in the Jinchang Industrial Symbiosis System. Among them, the system boundary referred to the industrial boundary involving the generation and utilization of waste resources in the industrial symbiosis system, and the time period was one year.
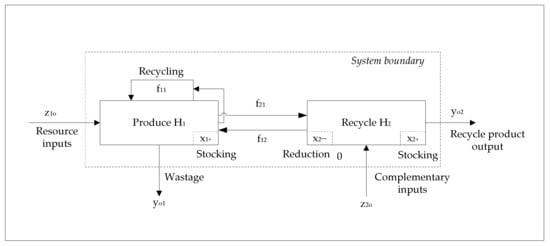
Figure 2.
Industrial symbiosis system waste flow metabolism analysis model.
The symbiosis system is simplified into two sectors, i.e., the waste generation sector (H1) and the waste utilization sector (H2). Strictly speaking, waste can be generated in any department of the system. In this study, the waste generation department refers to the department that produces mainly reusable waste resources, and the reuse department refers to the department that further processes and utilizes waste resources. The production of carbon dioxide exhaust gas is not considered within this analysis due to lack of data.
f represents the flow of waste within the system. Among them, f21 refers to the amount of waste that flows from H1 to H2, that is, the flow of reprocessed main waste. f12 refers to the amount of waste that flows from H2 to H1 in various forms after treatment, and f11 refers to the recycling of waste by the waste generation department, such as reprocessing of waste scraps, etc.
x1+ and x2+ represent the stocks of H1 and H2, respectively, that is, the amount that was generated but not processed or consumed in the current year. x1+ can also further indicate the amount that is internally consumed, but not transferred to the utilization department. x2+ means the inventory reduction of H2. As the waste disposal capacity increases, the utilization department will consume the inventory of previous years, leading to the reduction of inventory.
y01 represents the loss in the transfer and waste utilization process of H1, and y02 represents the amount of output from H2 due to waste reuse. It is assumed that the losses in H2 flow to H1 through f12, and are implicitly included in y01.
The part z10 that enters H1 externally is called resource input, including inputs for inefficient production (excluding external inputs to produce main products) and other inputs related to waste generation. The part z20 that enters the utilization sector H2 externally is called supplementary input, mainly including the supplemented resources introduced from outside during the reproduction using waste resources.
3.3. Data Sources
Research data were mainly obtained from the “2006–2020 Jinchang Statistical Yearbook” and “China City Statistical Yearbook”, as well as field research data from metallurgical, nonferrous, and chemical enterprises in Jinchang City.
4. Results
Using the above method and model, the three waste streams including solid waste, wastewater, and exhaust gas in the Jinchang industrial symbiosis system were analyzed with data from four phases, i.e., 2005, 2010, 2015, and 2019. In addition, by calculating the circulation index, we accurately and quantitatively characterized the flow and metabolism of the three waste streams in the system. The results are as follows.
4.1. Solid Waste Metabolism
4.1.1. Analysis of the Source and Flow of Solid Waste
The solid waste generation department (H1) mainly refers to mines, smelters, chemical plants, power plants, etc., and the utilization department (H2) mainly refers to enterprises that use solid waste as a resource. The solid waste sources in the industrial symbiosis system of Jinchang City mainly include mining tailings, washing waste residue, calcium carbide slag, and fly ash, among which mining tailings have the largest amount. The waste flowing to the utilization department (H2) mainly includes tailings, smelting slag, and fly ash. After the secondary treatment of mining tailings, a concentrate is used for smelting, and the rest is used for landfill. After the available resources in the washing solid waste are re-developed, the products are diverted to the outside of the system, and the remaining solid waste is used for mine landfill. Meanwhile, the fly ash and other products are directly used to produce building materials.
From Table 2, in 2005, 2010, and 2015, y02 and f21 continue to increase, and x2+ gradually decreases, indicating that the amount of flow from H1 to H2 is increasing, the processing capacity of H2 is improving, and H2 even begins to use the reserves. y02 also shows that H2’s ability to treat waste and provide products to the outside continues to increase. In 2015, the external input begins to decrease, and the amount of internal flow suddenly increases. In 2019, the external input is increased compared with 2015, and the internal flow is decreased; however, from the perspective of the overall system, the external input and the internal flow is increased, indicating that in 2015 and 2019, Jinchang’s waste utilization has less dependence on the outside, and the recycling capacity of solid waste has reached a higher level. As technology advances, the waste generation department has a higher processing capacity for its own waste, so f11 continues to increase, and y01 shows a decreasing trend.
Table 2.
The production and utilization of solid waste in the industrial symbiosis system of Jinchang City.
4.1.2. Solid Waste Circulation Flow Diagrams
From Figure 3, in 2005, the industrial symbiosis system of Jinchang City is in its infancy, the flow of solid waste resources in a single form, the production capacity of the utilization department is insufficient, and the processing capacity for tailings is incapable. From the perspective of the entire symbiosis system, the amount of waste flowing from H1 into H2 is 4.2105 million tons, and the amount returning from H2 is 1.994 million tons. Both flowing and returning flows have very small amounts, and the inventory of the H2 sector is large, which is 2.43 million tons. The entire system also requires more external input (Figure 3). In 2010, the flow of solid waste resources is optimized, and the production of the utilization department is improved. The processing capacity for the tailings which have the largest amount of solid waste is still insufficient. Compared with 2005, the output of H2 sector, y02, is increased by 87.5%, the external input z20 is decreased by 60.5%, and the inventory x2+ is decreased by 1.37 million tons, indicating the ability to reuse the solid waste resources in the system is increasing. In 2015, with the commissioning of circular economy projects such as 15,000 tons/day tailings reprocessing and 400,000 tons of soil amendments, the capacity to recycle waste is significantly increased, and the inventory continuously decreases. For the production sector H1, the treatment of tailings achieves a breakthrough, and the H1 stock is better utilized. Compared with 2005, the capacity to recycle solid waste is dramatically improved in 2019, and the inventory is reduced by 4.6 million tons, indicating that the overall tailings processing capacity is improving. Compared with 2005, 2010, and 2015, the amount of solid waste flowing from H1 into H2 in 2019 is significantly increased. For H1 sector, the amount of waste residue is decreased, and the amount of recycling is also increased, indicating that H1’s waste treatment capacity and recycling level is significantly improved.
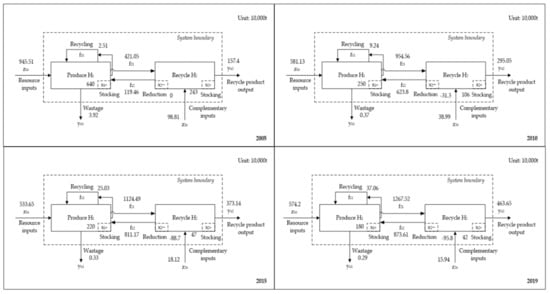
Figure 3.
Solid waste circulation flow diagrams of the Jinchang industrial symbiosis system in 2005, 2010, 2015, and 2019.
4.2. Wastewater Metabolism
4.2.1. Analysis of Wastewater Source and Flow
Wastewater sources include general industrial wastewater, smelting water, mine water, etc. The utilization department mainly refers to sewage treatment plants. After the sewage is produced in the symbiosis system, it directly enters the sewage treatment plant. The treated wastewater is recycled and reused, mainly in the form of mineral processing, tailings treatment, brine extraction, and greening agricultural water. The external output of the system is primarily the extraction of sodium chloride from heavy salt water. The self-circulation part of H1 department mainly comes from mine water backfilling.
According to the results in Table 3, from 2005 to 2019, in the industrial symbiosis system of Jinchang City, the wastewater resource input, reused product output, internal flow, and internal inventory show an increasing trend, indicating that the industrial, smelting, and mining departments of Jinchang City have an increasing dependence on external resources, and the insufficient wastewater treatment capacity leads to an increased stock of wastewater. However, the recycling capacity of wastewater in production departments such as industry, smelting, and mining and sewage treatment plants is continuously improving, and the output of products is also increasing.
Table 3.
Production and utilization of wastewater from an industrial symbiosis system in Jinchang City.
4.2.2. Wastewater Circulation Flow Diagrams
From Figure 4, in 2005, the industrial symbiosis system in Jinchang City already contains a relatively complete sewage treatment system, which can basically achieve zero discharge of sewage. However, due to the limitation of the production scale and wastewater treatment capacity, the treatment volume and flow volume are small. In 2010, the industrial symbiosis system in Jinchang City is basically complete. Due to the increase in production, the flow of wastewater treatment increases, which is reflected by a net increase of 23.62 million tons of H1 inflow and a net increase of 28.14 million tons of H2 return. Compared with 2005, the ability of H1 to reuse its own waste is increased by 91.4%. Compared with 2010, the wastewater treatment volume in 2015 continues to increase, and the input and exchange volume is increased. The resource input z10 is increased by 8.24 million tons, the amount of wastewater flowing from H1 to H2 is increased by 13.06 million tons, the H2 return is increased by 7.67 million tons, and H1′s ability to reuse its own waste is increased by 40.3%. In 2019, both y02 and f21 are increasing, indicating that the amount of flow from H1 to H2 is increasing, and the processing capacity of H2 is increasing. The internal flow in 2019 is increasing, indicating the ability to use wastewater is continuously improving. The external input and the stocks of H1 and H2 departments are increasing, which shows that the wastewater treatment of Jinchang City still heavily relies on external input and the treatment capacity needs to be further improved.
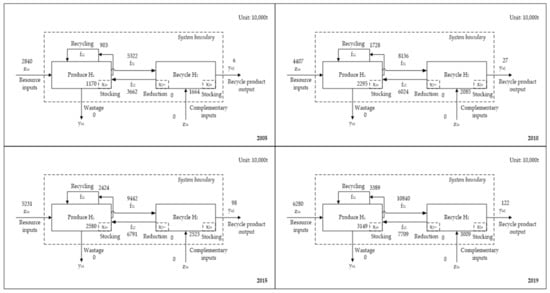
Figure 4.
Wastewater circulation flow diagrams of the Jinchang industrial symbiosis system in 2005, 2010, 2015, and 2019.
4.3. Exhaust Gas Metabolism
4.3.1. Analysis of Exhaust Gas Source and Flow
The sources of exhaust gas mainly include SO2, NO2, calcium carbide tail gas, and intermediate product gases such as hydrogen, chlorine, acetylene, coke oven gas, and ammonia, which are mainly derived from ore smelting, cogeneration, coal chemical industry, and other industrial processes. In the model, H1 mainly refers to the department that produces exhaust gas and intermediate product gas, and H2 mainly refers to the department that uses intermediate products and exhaust gas as resources. The reuse of the resulting intermediate products is considered internal consumption. When the external resource input enters the system, most of it flows to the utilization department through f21, some gas (such as coke oven gas) can be recycled, and coke oven gas is the main reserve of the H1 department. The unused part is discharged after being processed, which is the loss, y01. In the processing and utilization department, a large amount of external supplementary input is introduced while the gas is utilized, and most of the inflowing gas is processed into various products out of the symbiosis system. The inventory x2+ is mainly the retention of chlorine, that is, the generated chlorine cannot be completely consumed and treated as inventory. In the utilization stage, intermediate products required to produce H1 may be produced. The intermediate products are dominated by calcium carbide tail gas, which flows from sector H2 into H1.
According to the results in Table 4, from 2005 to 2019, both y02 and f21 are increased, and the flow from H1 to H2 is increased by a net increase of 6,432,600 tons. The processing capacity of H2 is increased, x2+ has a downward trend, and the change in the amount of external input is large. Compared with 2005, the resource input z10 in 2019 has a net increase of 8.8031 million tons, indicating that the recycling of exhaust gas is highly dependent on external input. For the self-recycling of waste, f11 continues to increase, indicating that with the advancement of technology, the waste generation department has a relatively high capacity to treat its own waste.
Table 4.
Production and utilization of exhaust gas from industrial symbiosis system in Jinchang City. Unit: 10,000 tons.
4.3.2. Exhaust Gas Circulation Flow Diagrams
From Figure 5, in 2005, the utilization mode of exhaust gas from the coal chemical industry in Jinchang City has been initially established, and the processing capacity for hydrogen sulphide and nitrogen oxides in the smelting industries has been increased. However, due to its infancy, there is insufficient capacity to treat the exhaust gas, the processing and reprocessing capabilities are relatively weak, and the degree of symbiosis is relatively weak, thus the gas metabolism is similar to a linear production model. From In 2010, the exhaust gas utilization mode of the industrial symbiosis system in Jinchang City is almost perfect, especially the recovery of sulfur dioxide and the large-scale intensive use of acetylene, calcium carbide tail gas, coke oven gas, etc. Exhaust gas flows orderly in the system and is efficiently used as resources. The resource input and output are rapidly increased, and the amount of inter-departmental flow is also significantly greater than 2005. Compared with 2008, the exhaust gas utilization structure in the industrial symbiosis system of Jinchang City in 2015 does not have significant change. The output of calcium carbide tail gas and coke oven gas continues to increase. However, the related downstream industries are still in the construction period. The output is small, and the exhaust gas utilization capacity is insufficient, which leads to the accumulation of inventory in H1. Compared with 2010, the resource input is rapidly increased by 37.7%, but the reutilization output is only increased by 21.4%. Since the supporting construction in downstream industries is not synchronized, the H2 sector′s inventory also accumulates. In 2019, both resource input and reuse output increase, which reduces the inventory of utilization departments to a certain extent. However, the downstream industries related to calcium carbide tail gas and coke oven gas still need to be further improved, leading to an increasing trend of inventory in H1 sector.
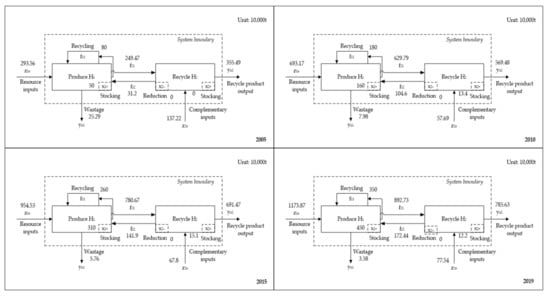
Figure 5.
Exhaust gas circulation flow diagrams of Jinchang industrial symbiosis system in 2005, 2010, 2015, and 2019.
4.4. Analysis of Waste Stream Circulation
From Figure 6, during the study period, the CI index of solid waste, wastewater, and exhaust gas in the industrial symbiosis system of Jinchang City has an overall upward trend. The result indicates that with the improvement of the co-production chain in the industrial symbiosis system, the correlation between various departments is continuously increasing, the degree of recycling of wastes is continuously increasing, the ability of industrial symbiosis is continuously enhanced, and the industrial symbiosis system has a more complete structure. This is consistent with the essential connotation of industrial symbiosis. Compared with general industrial agglomeration or industrial clusters, the essential difference of industrial symbiosis is that the waste of upstream companies is used as raw materials for downstream companies, thus achieving “win-win” of resource conservation and environmental protection.
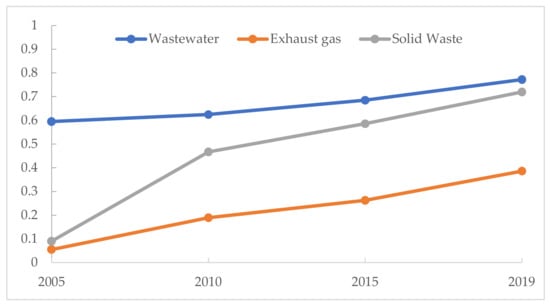
Figure 6.
Waste flow Circulation Index (CI) index trend of the Jinchang industrial symbiosis system.
Due to the differences in the development foundations of the industrial symbiosis system and the different priorities of the industrial symbiosis system in different development periods, for different waste metabolism, although the industrial symbiosis ability has the same overall trend, it is at a development stage for different types of wastes. Based on the analysis of solid waste, the industrial symbiosis ability of the system has the fastest improvement from 2005 to 2010. Based on the analysis of wastewater, the industrial symbiosis ability of the system is slowly strengthened during the entire study period. Based on the analysis of exhaust gas, the industry symbiosis ability continues to rapidly increase throughout the study period.
5. Conclusions and Discussions
This paper accurately and quantitatively described the flow and recycling processes of waste in the industrial symbiosis system by constructing the ISSWFMA model with the material flow analysis and production matrix analysis methods as the core and Jinchang model as the case. The following conclusions can be obtained from the results: The model can better describe the waste flow and waste metabolism in the City-Region Level industrial symbiosis system, and can provide data and method to support waste management. During the research period, with the continuous improvement of the industrial chain and the continuous enhancement of the correlation between various departments, the CI index of solid waste, wastewater, and exhaust gas in the industrial symbiosis system of Jinchang City has an overall increasing trend, the degree of recycling is constantly increasing, the ability of industrial symbiosis is continuously enhanced, and the system structure is becoming more complete. At the same time, based on the analysis of different wastes, the industrial symbiosis ability is at different development stages for different types of wastes. The analysis based on solid waste shows that the system has the fastest improvement in the industrial symbiosis ability from 2005 to 2010. The conclusion obtained from wastewater analysis is that during the entire study period, the industrial symbiosis ability in the system is gradually strengthened. From the exhaust gas analysis, the industrial symbiosis ability in the system continues to increase rapidly throughout the study period.
The ISSWFMA model expands the application scope and depth of the EW-MFA method and the traditional input–output method to a certain extent. However, this model is a static model, and the waste material metabolism process of the national and regional economic systems is a complex giant system and has non-linear and dynamic characteristics. Considering the difficulties in statistics and collection of waste-related data, as well as the lack of studies on the quantitative evaluation and analysis of waste material metabolism patterns for various social, economic, and environmental factors, the model constructed in this study attempted to simplify the complex system in the simulation. However, the further development of models is still necessary to incorporate the complex characteristics of these systems, such as introducing an external area that provides raw materials, products, and wastes for the industrial symbiosis system, that is, the “outer area” [35].
China’s waste recycling system has the characteristics of huge waste resources, low waste recycling level, and low waste utilization efficiency. These problems lead to serious waste loss in the recycling system. From the perspective of the technical structure of China’s waste recycling system, recycled waste occupies a dominant position, followed by waste landfill, while the energy recovery and reuse account for a very low proportion [12]. However, there is huge potential for waste reduction, recycling and reuse in the future. In the context of industrialization and globalization, the local solid waste generation in China will continue to increase in the next 20–25 years. However, under the high environmental target scenario, this growth trend may also be reversed by the promotion of waste reduction technologies. The implementation of cleaner production and circular economy development strategies centered on industrial structure adjustment and technological upgrading will have a significant impact on the material metabolism model of the waste recycling system in the future [42].
In conclusion, with the increasing attention to resources and the environment, more waste has been recycled as a new resource. Industrial symbiosis and its derived urban symbiosis [43] are the ultimate and most innovative approaches to accomplish waste recycling and will play a more important role in promoting green economic growth and building low-carbon cities. Meanwhile, the government and scholars should pay more attention to and study the City-Region Level’s industrial symbiosis theory so as to better tap the value of waste recycling, improve the efficiency of waste recycling, give full play to the role of market mechanisms, and build circular regions [44]. Then each subject in the region can form a process of resource complementary interaction, symbiosis, and mutual benefit, the unity and coordination of the units in the region can be strengthened, and an ecological area can be further formed [45] to achieve the goal of saving natural resources, protecting the ecological environment, and harmonious coexistence between man and nature.
Author Contributions
Conceptualization, C.L. and X.C.; methodology, C.L.; formal analysis, X.P. and J.M.; investigation, C.L., J.P., and X.C.; writing—original draft preparation, C.L.; writing—review and editing, C.L. and B.X. All authors have read and agreed to the published version of the manuscript.
Funding
This research was funded by National Natural Science Foundation of China (41701142, 41971166), National Social Science Foundation/Projects of Marxist theoretical research and construction (2020MYB070), and Fundamental Research Funds for the Central Universities (2020jbkyjc002).
Institutional Review Board Statement
Not applicable.
Informed Consent Statement
Not applicable.
Data Availability Statement
Restrictions apply to the availability of these data. Data was obtained from Jinchang Municipal People’s Government, Gansu, China, and are available from the authors with the permission of Jinchang Municipal People’s Government, Gansu, China.
Conflicts of Interest
The authors declare no conflict of interest.
References
- Van, S.; Stegeman, J.A.; Ekins, P. Limited climate benefits of global recycling of pulp and paper. Nat. Sustain. 2020, 1–8. [Google Scholar] [CrossRef]
- Xie, X.; Qin, S.; Gou, Z.; Yi, M. Can Green Building Promote Pro-Environmental Behaviours? The Psychological Model and Design Strategy. Sustainability 2020, 12, 7714. [Google Scholar] [CrossRef]
- Lu, C.; Ji, W.; Liu, Z.; Dong, S.; Xue, B. Synergistic Evaluation and Constraint Factor Analysis on Urban Industrial Ecosystems of Traditional Industrial Area in China. Complexity 2020, 2020, 1–16. [Google Scholar]
- Huang, J.; Zhao, R.; Huang, T.; Wang, X.; Tseng, M.-L. Sustainable Municipal Solid Waste Disposal in the Belt and Road Initiative: A Preliminary Proposal for Chengdu City. Sustainability 2018, 10, 1147. [Google Scholar] [CrossRef]
- Lu, C.; Xue, B.; Lu, C.; Wang, T.; Zhang, Z.; Ren, W. Sustainability Investigation of Resource-Based Cities in Northeastern China. Sustainability 2016, 8, 1058. [Google Scholar] [CrossRef]
- Lu, W. Waste Recycling System Material Metabolism Analysis Model and Its Application. Ph.D. Thesis, Tsinghua University, Beijing, China, 2010. [Google Scholar]
- Liu, G.; Lu, S.; Li, X. Literature Review on Industrial Symbiosis: The Perspective from Synergy Operation of Recycling. Manag. Rev. 2014, 26, 149–160. [Google Scholar]
- Xue, B.; Chen, X.; Geng, Y.; Guo, X.; Lu, C.; Zhang, Z.; Lu, C. Survey of officials’ awareness on circular economy development in China: Based on municipal and county level. Resour. Conserv. Recycl. 2010, 54, 1296–1302. [Google Scholar] [CrossRef]
- Chen, X.; Fujita, T.; Ohnishi, S.; Fujii, M. The Impact of Scale, Recycling Boundary, and Type of Waste on Symbiosis and Recycling. J. Ind. Ecol. 2012, 16, 129–131. [Google Scholar] [CrossRef]
- Zhao, R.; Liu, Y.; Zhang, N.; Huang, T. An optimization model for green supply chain management by using a big data analytic approach. J. Clean. Prod. 2017, 142, 1085–1097. [Google Scholar] [CrossRef]
- Mathews, J.A.; Tan, H. Circular economy: Lessons from China. Nature 2016, 531, 440–442. [Google Scholar] [CrossRef]
- Lu, W.; Zhang, T. Research and Prospects of Waste Recycling. Environ. Sci. Manag. 2010, 35, 129–139. [Google Scholar]
- Gao, H.; Dai, T. Metabolism framework on recycling system construction of municipal solid waste. Recycl. Resour. Circ. Econ. 2014, 7, 9–14. [Google Scholar]
- Joosten, L.A.J.; Hekkert, M.P.; Worrell, E. Assessment of the plastic flows in The Netherlands using STREAMS. Resour. Conserv. Recycl. 2000, 30, 135–161. [Google Scholar] [CrossRef]
- Melo, M.T. Statistical analysis of metal scrap generation: The case of aluminum in Germany. Resour. Conserv. Recycl. 1999, 26, 91–113. [Google Scholar] [CrossRef]
- Van Beers, D.; Graedel, T.E. The magnitude and spatial distribution of in-use copper stocks in Cape Town, South Africa: Research article. S. Afr. J. Sci. 2003, 99, 61–69. [Google Scholar]
- Zhang, J. Studying on Zinc Cycle and Regeneration Index of Depreciated Zinc Products in China. Ph.D. Thesis, Northeastern University, Boston, MA, USA, 2007. [Google Scholar]
- Byström, S.; Lönnstedt, L. Waste paper usage and fiber flow in Western Europe. Resour. Conserv. Recycl. 1995, 15, 111–121. [Google Scholar] [CrossRef]
- Joosten, L.A.J.; Hekkert, M.P.; Worrell, E.; Worrell, E.; Turkenburg, W. STREAMS: A new method for analyzing material flows through society. Resour. Conserv. Recycl. 1999, 27, 249–266. [Google Scholar] [CrossRef]
- Hekkert, M.P.; Joosten, L.A.J.; Worrell, E. Analysis of the paper and wood flow in The Netherlands. Resour. Conserv. Recycl. 2000, 30, 29–48. [Google Scholar] [CrossRef]
- Patel, M.K.; Jochem, E.; Radgen, P.; Worrell, E. Plastics streams in Germany—An analysis of production, consumption and waste generation. Resour. Conserv. Recycl. 1998, 24, 191–215. [Google Scholar] [CrossRef]
- Peralta, G.L.; Fontanos, P.M. E-waste issues and measures in the Philippines. J. Mater. Cycles Waste Manag. 2006, 8, 34–39. [Google Scholar] [CrossRef]
- Lu, Z.; Yue, Q. Two Methods and Applications of Substance Flow Analysis. Resour. Recycl. 2006, 2, 27–28. [Google Scholar]
- Hage, O.; Söderholm, P. An econometric analysis of regional differences in household waste collection: The case of plastic packaging waste in Sweden. Waste Manag. 2008, 28, 1720–1731. [Google Scholar] [CrossRef]
- Berglund, C.; Söderholm, P. Complementing Empirical Evidence on Global Recycling and Trade of Waste Paper. World Dev. 2003, 31, 743–754. [Google Scholar] [CrossRef]
- Byström, S.; Lönnstedt, L. Paper recycling: A discussion of methodological approaches. Resour. Conserv. Recycl. 2000, 28, 55–65. [Google Scholar] [CrossRef]
- Yamashita, H.; Kishino, H.; Hanyu, K.; Hayashi, C.; Abe, K. Circulation indices: New tools for analyzing the structure of material cascades. Resour. Conserv. Recycl. 2000, 28, 85–104. [Google Scholar] [CrossRef]
- Brown, M.T.; Buranakarn, V. Emergy indices and ratios for sustainable material cycles and recycle options. Resour. Conserv. Recycl. 2003, 38, 1–22. [Google Scholar] [CrossRef]
- Leontief, W. Environmental repercussions and the economic structure: An input output approach. Rev. Econ. Stat. 1970, 52, 262–271. [Google Scholar] [CrossRef]
- Leontief, W.; Ford, D. Air pollution and the economic structure: Empirical results of input-output computations. In Input-Output Techniques: Proceedings of the Fifth International Conference on Input-Output Techniques, Geneva, Switzerland, January 1971; Bródy, A., Cater, A.P., Eds.; North-Holland Publ. Co: Amsterdam, The Netherlands, 1972; pp. 9–30. [Google Scholar]
- Hubacek, K.; Giljum, S. Applying physical input–output analysis to estimate land appropriation (ecological footprints) of international trade activities. Ecol. Econ. 2003, 44, 137–151. [Google Scholar] [CrossRef]
- Suh, S. A note on the calculus for physical input–output analysis and its application to land appropriation of international trade activities. Ecol. Econ. 2004, 48, 9–17. [Google Scholar] [CrossRef]
- Hoekstra, R.; van den Bergh, J.C.J.M. Constructing physical input–output tables for environmental modeling and accounting: Framework and illustrations. Ecol. Econ. 2006, 59, 375–393. [Google Scholar] [CrossRef]
- Nakamura, S. The Waste Input-Output Approach to Materials Flow Analysis. J. Ind. Ecol. 2007, 11, 50–63. [Google Scholar] [CrossRef]
- Lu, C. Study on System Evolution and Symbiosis Effects of Industrial Symbiosis-Case of Jinchang. Ph.D. Thesis, Lanzhou University, Lanzhou, China, 2013. [Google Scholar]
- Wang, T.; Daniel, B.M.; Graedel, T.E. Forging the anthropogenic iron cycle. Environ. Technol. Sci. 2007, 41, 5120–5129. [Google Scholar] [CrossRef] [PubMed]
- Bailey, R.; Allen, J.K.; Bras, B. Applying Ecological Input-Output Flow Analysis to Material Flows in Industrial Systems: Part I: Tracing Flows. J. Ind. Ecol. 2008, 8, 45–68. [Google Scholar] [CrossRef]
- Finn, J.T. Flow Analysis: A Method for Tracing Flows through Ecosystem Models. Ph.D. Thesis, University of Georgia, Athens, GA, USA, 1977. [Google Scholar]
- Hannon, B. The structure of eco-systems. J. Theor. Biol. 1973, 41, 535–546. [Google Scholar] [CrossRef]
- Patten, C.; Bosserman, R.; Finn, J.; Cale, W. Propagation of Cause in Ecosystems; Academic Press: New York, NY, USA, 1976. [Google Scholar]
- Szyrmer, J.; Ulanowicz, R.E. Total flows in ecosystems. Ecol. Model. 1987, 35, 123–136. [Google Scholar] [CrossRef]
- Laybourn, P.; Lombardi, D.R. Industrial Symbiosis in European Policy. J. Ind. Ecol. 2012, 16, 11–12. [Google Scholar] [CrossRef]
- Fujii, M.; Fujita, T.; Dong, L.; Lu, C.P.; Geng, Y.; Behera, S.K.; Park, H.-S.; Chiu, A.S.F. Possibility of developing low-carbon industries through urban symbiosis in Asian cities. J. Clean. Prod. 2016, 114, 376–386. [Google Scholar] [CrossRef]
- Adriaanse, A.; Bringezu, S.; Hammond, A.; Moriguchi, Y.; Rodenburg, E.; Rogich, D.; Schütz, H. Resource Flows—The Material Basis of Industrial Economics; World Resources Institute: Washington, DC, USA, 1997. [Google Scholar]
- Brunner, P.H.; Baccini, P. Regional materials management and environmental protection. Waste Manag. Res. 1992, 10, 203–212. [Google Scholar] [CrossRef]


Publisher’s Note: MDPI stays neutral with regard to jurisdictional claims in published maps and institutional affiliations. |
© 2021 by the authors. Licensee MDPI, Basel, Switzerland. This article is an open access article distributed under the terms and conditions of the Creative Commons Attribution (CC BY) license (http://creativecommons.org/licenses/by/4.0/).