Abstract
Faults in electrical facilities may cause severe damages, such as the electrocution of maintenance personnel, which could be fatal, or a power outage. To detect electrical faults safely, electricians disconnect the power or use heavy equipment during the procedure, thereby interrupting the power supply and wasting time and money. Therefore, detecting faults with remote approaches has become important in the sustainable maintenance of electrical facilities. With technological advances, methodologies for machine diagnostics have evolved from manual procedures to vibration-based signal analysis. Although vibration-based prognostics have shown fine results, various limitations remain, such as the necessity of direct contact, inability to detect heat deterioration, contamination with noise signals, and high computation costs. For sustainable and reliable operation, an infrared thermal (IRT) image detection method is proposed in this work. The IRT image technique is used in various engineering fields for diagnosis because of its non-contact, safe, and highly reliable heat detection technology. To explore the possibility of using the IRT image-based fault detection approach, object detection algorithms (Faster R-CNN; Faster Region-based Convolutional Neural Network, YOLOv3; You Only Look Once version 3) are trained using 16,843 IRT images from power distribution facilities. A thermal camera expert from Korea Hydro & Nuclear Power Corporation (KHNP) takes pictures of the facilities regarding various conditions, such as the background of the image, surface status of the objects, and weather conditions. The detected objects are diagnosed through a thermal intensity area analysis (TIAA). The faster R-CNN approach shows better accuracy, with a 63.9% mean average precision (mAP) compared with a 49.4% mAP for YOLOv3. Hence, in this study, the Faster R-CNN model is selected for remote fault detection in electrical facilities.
1. Introduction
In electric power systems, minor cracks or loose connections between sockets deteriorate energy efficiency and generate unexpected heat in the system. A gradual increase in the heat can melt circuits and sheaths, causing a fire [1]. Unexpected component faults may cause failure of the entire system and casualties. From 2014 to 2018, the Korea Electric Power Corporation (KEPCO) spent USD 1.2 billion on fault inspection, and this budget has increased annually [2]. In the case of accidents related to electrical work, from 2000 to 2010, severe injuries and deaths accounted for 61.9% of all industrial injuries in Korea [3]. The KEPCO continues to increase transmission circuit and distribution, hereby the budget for the maintenance of these facilities is also increasing [2]. Each year, USD 105 million (on average) was spent on maintenance during 2008 to 2017 in Korea [2]. More and more resources are required each year and the rate of cost and resource consumption is increasing rapidly. In order to maintain power systems sustainably, KEPCO developed a reliability centered maintenance system. This technical note presents a safe and efficient fault detection approach for expanding the system by using an infrared thermal (IRT) based Convolutional Neural Network (CNN) model.
Experts in machine maintenance have developed a variety of fault diagnosis methods to manage the maintenance and reliability of electrical facilities in a sustainable manner [4,5]. Various signals have been analyzed for the fault diagnosis of mechanical facilities, including vibration, electric current, and acoustic emission [6]. Among these signals, vibration-based diagnostic methods are the most intensively studied because they can directly represent the dynamic behavior of rotating machines [7,8,9]. However, vibration-based diagnostic methods have many shortcomings and constraints, such as the necessity of contact-type detection, inability to detect heat deterioration, contamination with noise signals, and high computation costs [10,11]. Vibration signals include a large amount of noise from many environmental factors, such as temperature and electromagnetic inference [6]. To capture the correct frequency, classifying the noise and analyzing its cause requires high computation costs, which may require super computers [12]. Although many methods have been proposed to remove the noise from vibration signals, the noise may include fault information, thereby degrading the fault diagnosis performance [11,13,14].
Recently, an infrared thermal (IRT) image-based diagnostic method has become an alternative to vibration-based diagnosis for sustainable machine health monitoring systems. In the field of rotating machinery, IRT-based diagnostic methods have been applied to detect faults in rotating machinery, considering temperature energy signals as useful sources for pre-diagnostic analysis in mechanical facilities [15,16,17]. Lim et al. [18] proposed a fault diagnosis method using IRT images along with the support vector machine algorithm to identify machinery faults. Janssens et al. [19] developed an IRT-based fault diagnosis method for machinery using a discrete wavelet transform, a feature selection tool with classifiers. IRT technology is suitable for non-contact fault diagnosis by detecting deterioration problems of power distribution facilities. The main parts of the facilities, such as the current transformer, lightning arrestor, insulator, and cut-out switch, are electric components that may generate irregular heat without mechanical vibrations. Therefore, an IRT analysis has a vast range of applications, including fault diagnosis for electrical and mechanical system maintenance. This note presents the capability of CNN model usage in fault diagnosis approaches by detecting electric components and heat from 16,843 IR images.
A thermal camera is used to measure invisible infrared energy. The camera detects the relative strength of infrared energy emitted from an object. Infrared energy is part of a spectrum with wavelengths long enough to be invisible to the human eye. The thermal camera expresses the difference in infrared energy as different intensities in gray value scale or color differences by a color pallet selection of the camera function. The commonly used thermal cameras are designed to detect particular wavelength ranges: short-wave infrared, medium-wave infrared, and long-wave infrared [20]. The FLIR T660 model (FLIR Systems, Wilsonville, U.S.) used in this research detects long-wave infrared. In order to measure the correct temperature values of the target, industrial level thermal cameras, such as FLIR T660, have additional calibration functions that remove noise from radiation and weather conditions (humidity, atmospheric temperature, etc.). A typical thermal camera cannot measure accurate temperature values by providing only relative difference in intensity of radiation energy [21]. In this research, the thermal camera expert from Korea Hydro & Nuclear Power Corporation (KHNP) used FLIR T660, which has a variety of control functions, for measuring the accurate temperature of targets.
To detect faults or monitor the system intelligently, deep learning algorithms are required to search for and extract an object with the corresponding temperature across a large number of IRT images. A deep learning algorithm allows the extraction of features automatically, while most industries using IRT images manually search for faults with a small number of datasets (Mahalanobis distance, relied algorithms, etc.) [22,23]. CNN is an effective deep learning algorithm that automatically extracts the features of raw image data. This algorithm can extract features directly from images, avoiding the loss of information that may be important for diagnosing a machine [24].
The methodology proposed in this note enables the detection of defective facilities through IRT image analysis via deep learning object detection algorithms. To select a proper CNN algorithm for detecting an object using temperature, this note compares several image processing models that are widely used in the engineering field.
The rest of this research is organized as follows. In Section 2, the theoretical background of Faster Region-based Convolutional Neural Network (Faster R-CNN) and You Only Look Once version 3 (YOLOv3) is reviewed. In Section 3, the steps of the proposed intelligent fault-detection model are presented. In Section 4, the proposed method is used to classify the types of power transmission facilities. Finally, Section 5 concludes the note. By measuring the performance of the proposed model through experimentation, IRT images and deep learning-based object detection models are verified to be effective diagnostic methodologies for sustainable machine maintenance.
2. Background
A fully connected layer based neural network planes RGB image data in a single dimension. The original coordinates from RGB image data are removed during the dimension transformation. The coordinates provide feature information of an object to the neural network algorithm, hereby removing coordinates causes the algorithm to not recognize the object.
However, CNN maintains the coordinates during the dimension transformation process by using a filter which condenses the spatial information of the original image. The filter transmits the condensed information to each dimension. Therefore, the algorithm is able to extract the features from the input image by integrating information from the entire dimensions—convolution layer process. The number and size of the filter determine the number and size of the transformed dimensions, respectively. The user of CNN selects the size of a filter as 3 × 3 or 5 × 5 (a rule of thumb in the field of CNN). For each point on the image, a recognition score is calculated for feature extraction via filter convolution operation. In order to clarify the feature, CNN integrates each convolutional layer into a feature map.
In order to detect the object automatically, CNN based deep learning algorithms are employed in this research. The object detection model employs CNN models in order to indicate specific targets from the feature maps. The CNN used in object detection is called “backbone CNN” or “shared CNN.” The object detection model learns feature maps (output from the backbone CNN) by classifying each object and predicting the coordinates of the objects with regression models.
2.1. Faster R-CNN
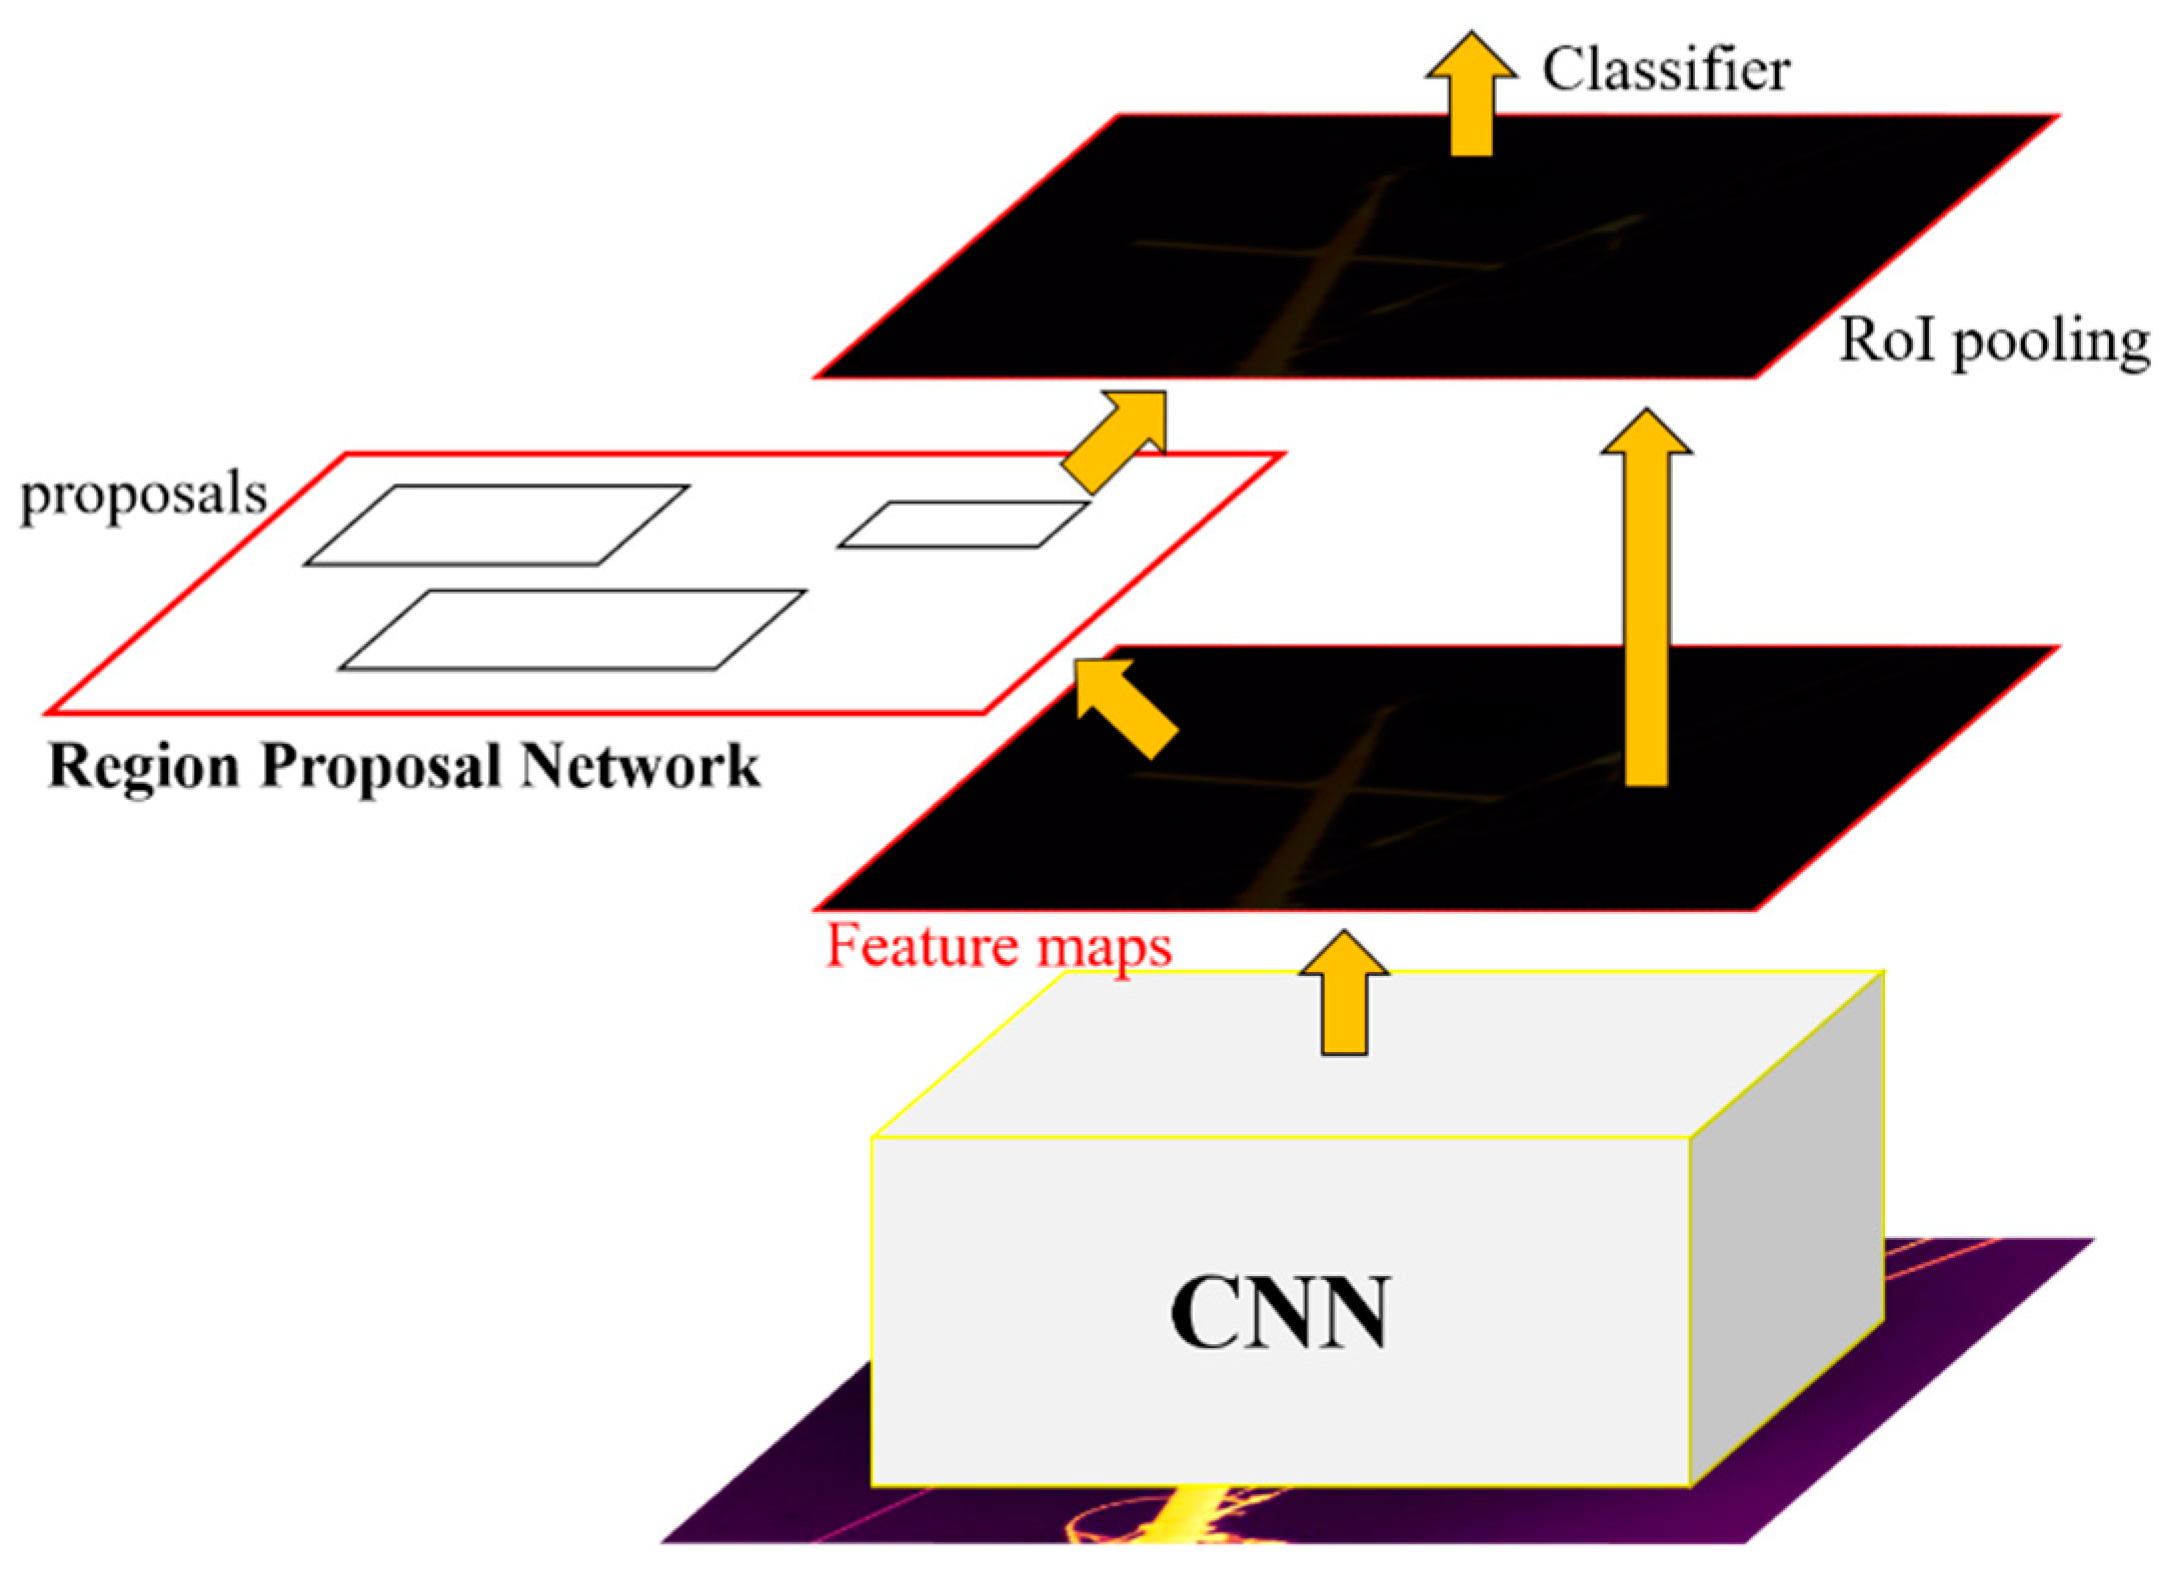
Currently, Faster R-CNN shows the best performance across multiple affiliate algorithms of Fast R-CNN [25,26]. Fast R-CNN uses a selective search for generating regions of interest (ROIs) from input images. The selective search shows high accuracy in candidate area extraction, but it requires a lot of computational effort during the process. In the stage of generating the ROI, Faster R-CNN provides a concurrent processing that is composed of a region proposal network (RPN) and a CNN convolution map [27]. The RPN receives the feature map of the CNN. The network operation is performed by the sliding window method over these feature maps. At each window, it generates k anchors of different shapes and sizes. Anchors are boundary boxes of given images that are composed of three different shapes and sizes (k ≤ 9). For each anchor, RPN predicts two things. The first is the probability that an anchor is an object, and the second is the bounding box coordinate. The structure of Faster R-CNN is shown in Figure 1.
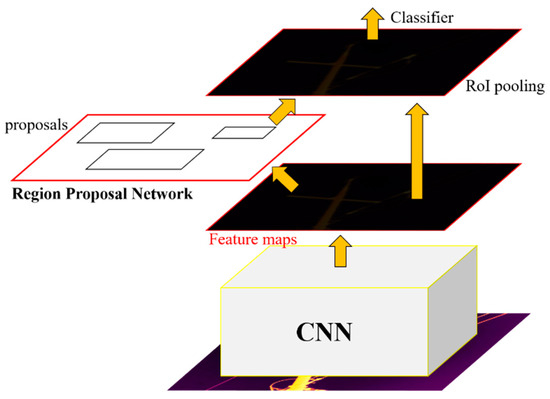
Figure 1.
Model flow of Faster Region-based Convolutional Neural Network (Faster R-CNN).
Faster R-CNN extracts ROI faster than the previous Fast R-CNN by replacing selective search with RPN [28].
2.2. YOLOv3
YOLOv3 detects objects by exploring the feature with a single stage neural network. However, the models presented in the previous Section 2.1 are dual stage neural networks, hereby slower than YOLOv3. This object detection model employs a logistic classifier as a multi-label classification to calculate the likeliness of the object having a specific label [29]. For the classification loss, YOLOv3 uses the binary cross-entropy loss for each label, instead of the general mean square error used in the previous versions (YOLOv1, YOLOv2) [30,31]. YOLOv3 divides an input image into the grid and uses bounding box prediction approaches to extract ROI. It associates the objectness score one to the anchor, which overlaps a ground truth object more than other anchors. The model ignores the anchors that overlap the ground truth object by more than a chosen threshold. Therefore, this model assigns one anchor to each ground truth object. YOLOv3 predicts boxes at three different scales and then extracts features from those scales. The prediction result of the network is a 3-d tensor that encodes a bounding box, an objectness score, and prediction over classes. This is why the tensor dimensions at the final step are different from those in previous versions. Finally, YOLOv3 uses a new CNN feature extractor named Darknet-53. It is a 53-layer CNN that uses a skip connection network inspired by ResNet. It also uses 3 × 3 and 1 × 1 convolutional layers. It has shown state-of-the-art accuracy, but with fewer floating point operations and better speed than previous versions [28].
3. Methods
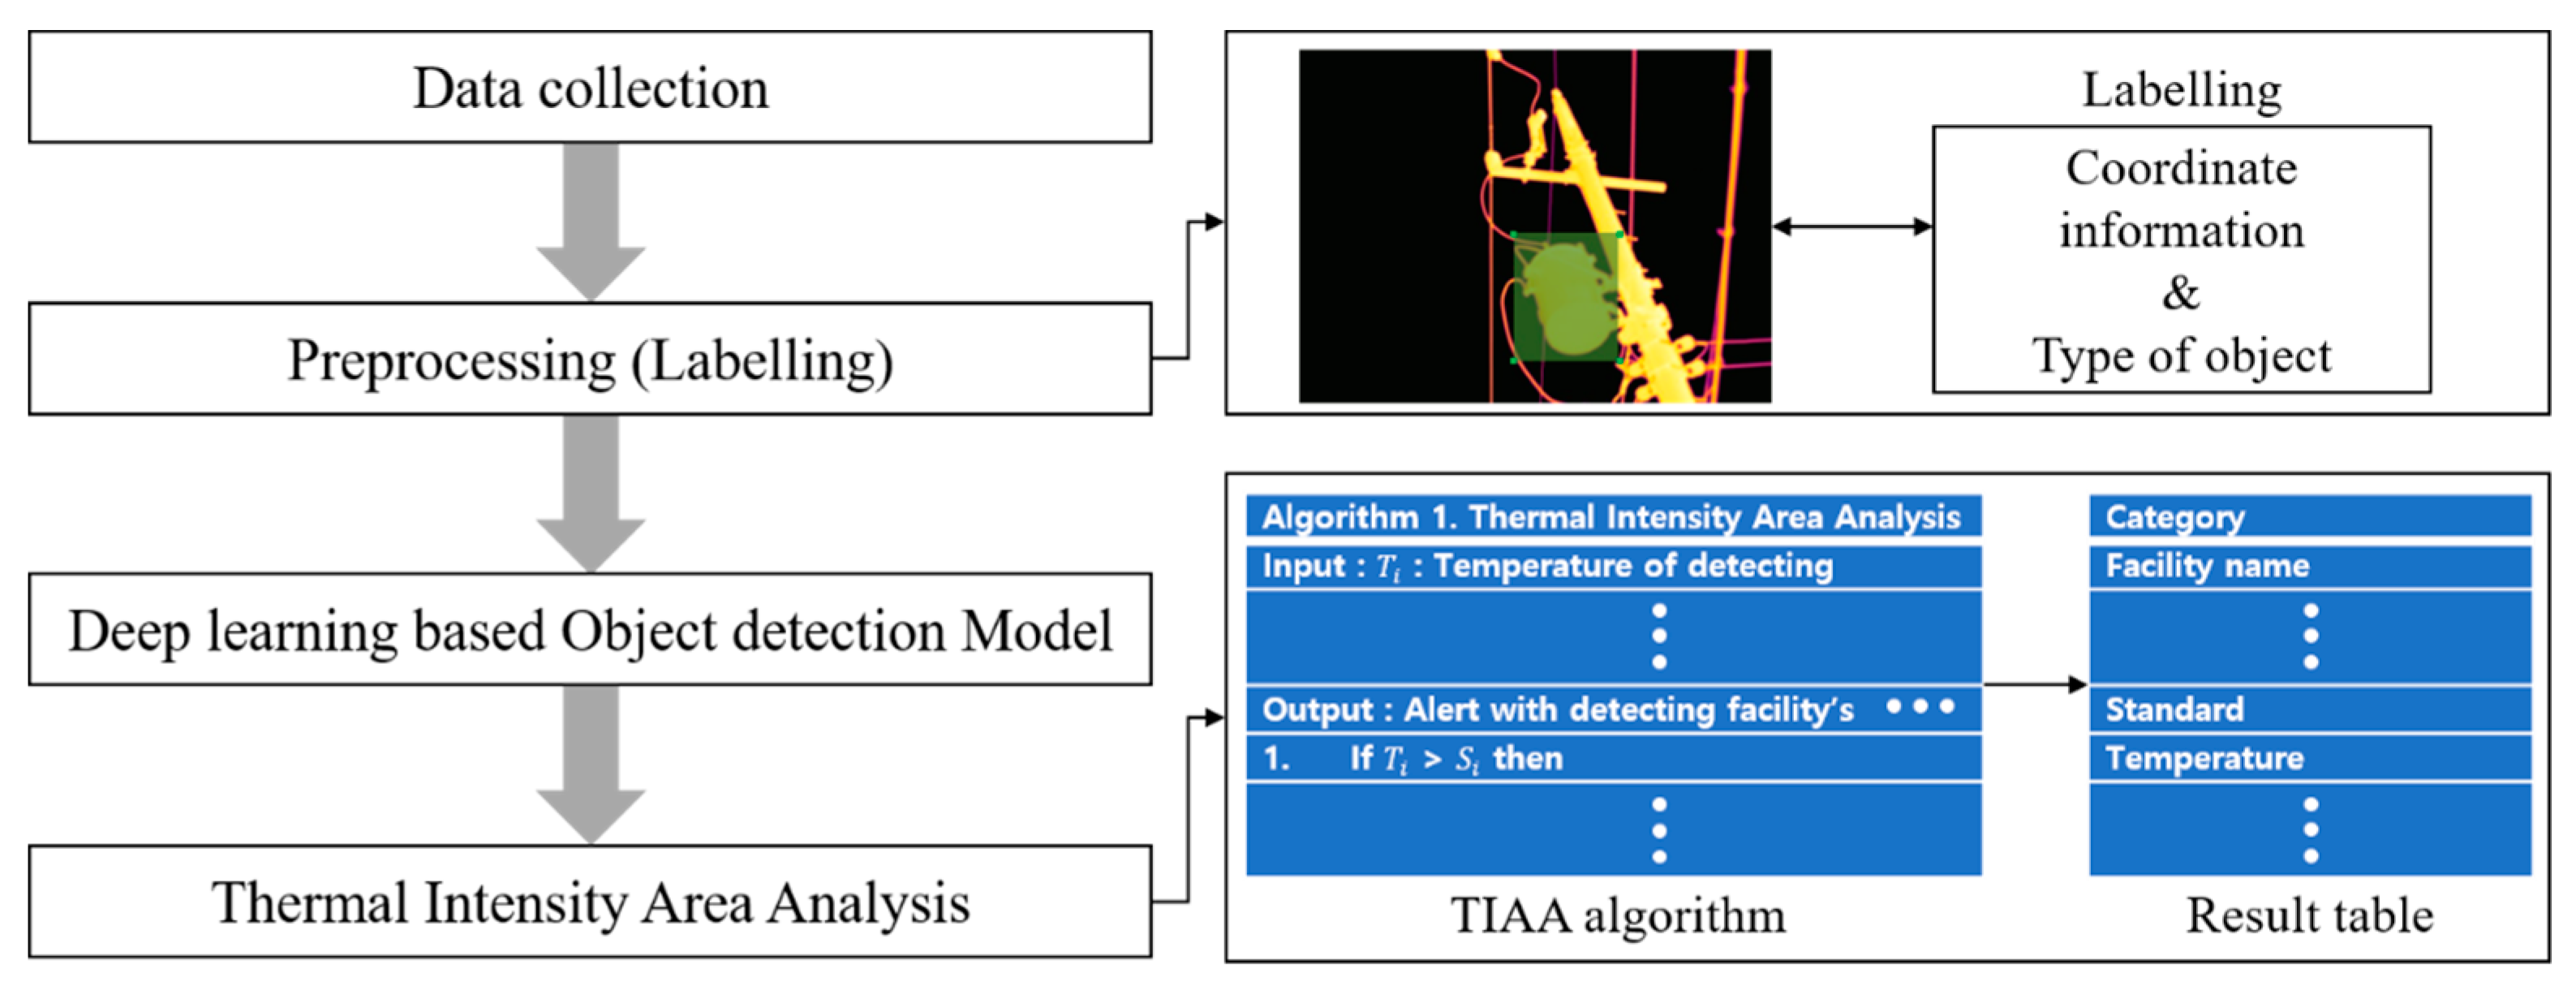
In this section, an intelligent fault detection system is proposed for diagnosing mechanical facilities via IRT images and deep learning-based object detection algorithms. This system consists of three stages; Figure 2 is a schematic of the system.
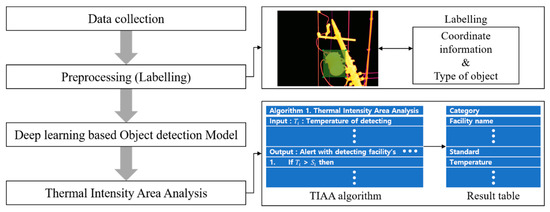
Figure 2.
Main frame of experiment.
3.1. Data Collection and Preprocessing
In order to collect accurate temperature from objects by using a thermal camera, various conditions such as the background of the image, surface status of the objects, weather conditions, and thermocouple should be considered while acquiring IRT images [32]. In the preprocessing stage, a labeling process is performed to train object detection models. The label of an image includes an object’s bounding box coordinate information and the type of object for each image. FLIR T660 provides the original image of the target and thermal data of every pixel in the IR image also (Figure 3). In this experiment, RGB represented IR images are employed to train the deep learning algorithm. Once the algorithm detects the objects, then the methodology matches the thermal data to corresponding coordinates.

Figure 3.
(a) An object’s original image, (b) a RGB representation of IR image, (c) thermal data of every pixel.
3.2. Object Detection
In this study, Faster R-CNN and YOLOv3 were trained with the same IRT images and compared. Algorithms in the R-CNN series have traditionally shown fine performance in object detection, and the YOLO series models reduce detection time with simple and efficient approaches [28]. The object detection model plays a key role in intelligent fault detection systems. This study examines whether they are applicable as a methodology for diagnosing mechanical facilities using IRT images. Similar to the existing model of R-CNN series, Faster R-CNN initially processes the entire input image, later divides the proposal and maintains regional proposals, finally pooling the ROI. In addition, it selects an RPN to expedite the processing of proposals. YOLO initially divides the entire image and processes it later using CNN. Furthermore, YOLO completely skips both sliding windows and regional proposal steps and directly divides the input image into grids. It predicts the object for each grid cell and identifies the location and size of the objects through the bounding box. These two models were trained and compared using IRT images, and the specific models are as follows [28].
3.2.1. Structure of Faster R-CNN
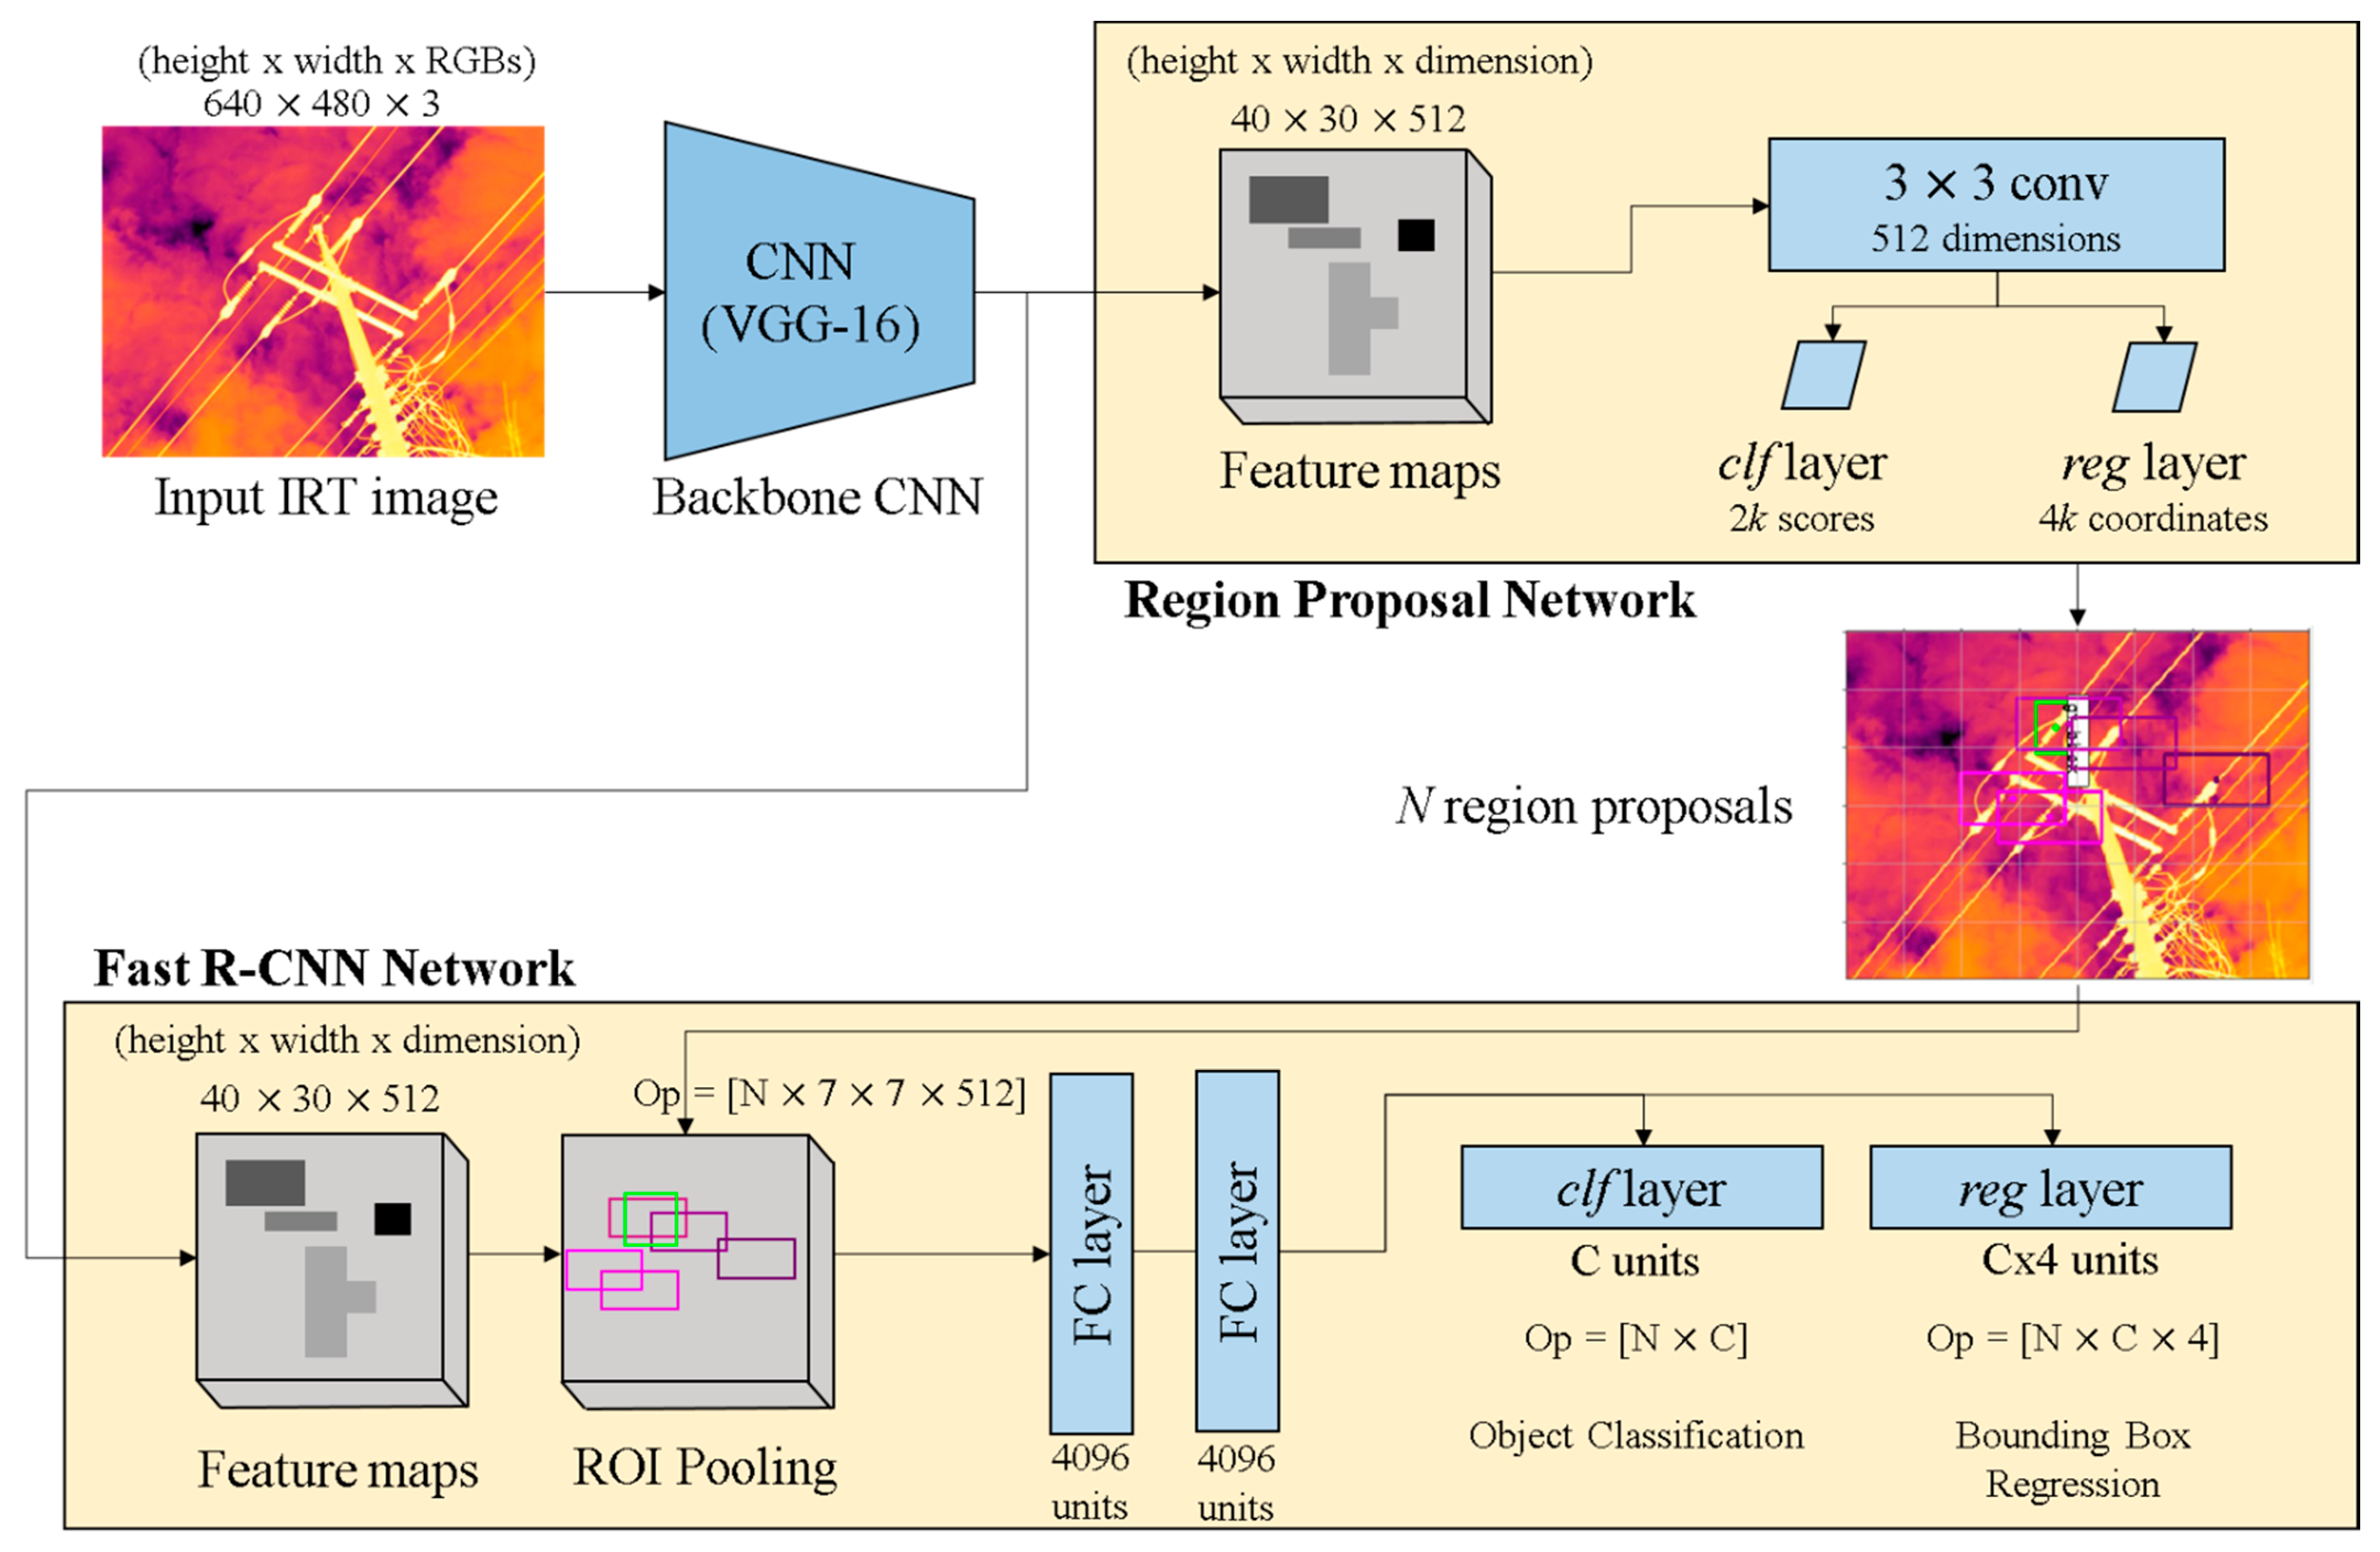
To process the input IRT image with Faster R-CNN, there are two stages that need to be performed (Figure 4). The architecture of the Faster R-CNN detection pipeline is shown in Figure 4. The input IRT image with a size of 640 (width) × 480 (height) × 3 (RGBs) is first passed through the backbone CNN to obtain the feature map. A CNN applies VGG-16 (very deep convolutional networks for large-scale image recognition), which is easy to accumulate in layers. Faster R-CNN creates a computational advantage by sharing the weights of the feature map from the backbone CNN with the RPN and Fast R-CNN networks as the detector network [33]. The output features of the backbone CNN depend on the stride of the backbone network. The VGG-16 network has a stride of 16; therefore, the feature map is output with a size of 40 (width) × 30 (height) × 512 (dimension). The RPN produces N region proposals (Figure 5). The region proposals pool features from the backbone feature map: ROI pooling layer. This layer divides the features from the region proposal into sub-windows and performs a pooling operation in each of these sub-windows. This brings out fixed-size output features of size N × 7 × 7 × 512, where N is the number of region proposals. These output features are reflected in the fully connected layer (FC layer), the classification layer (clf layer) with Softmax, and the bounding-box regression layer (reg layer), respectively, in the Fast R-CNN network (Figure 4). The classification layer with Softmax produces the probability values of each ROI belonging to categories. The bounding-box regression layer output is used to set the coordinates of the bounding box. The classification layer in the Fast R-CNN network has C units for each class in the detection task. Each class has an individual regressor with four parameters, hereby corresponding to C × 4 output units in the regression layer.
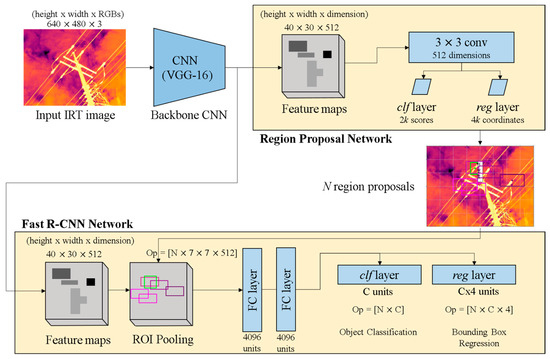
Figure 4.
Architecture of Faster R-CNN detection pipeline.
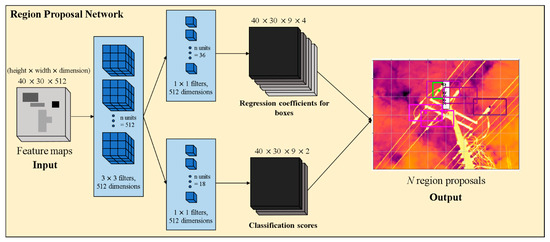
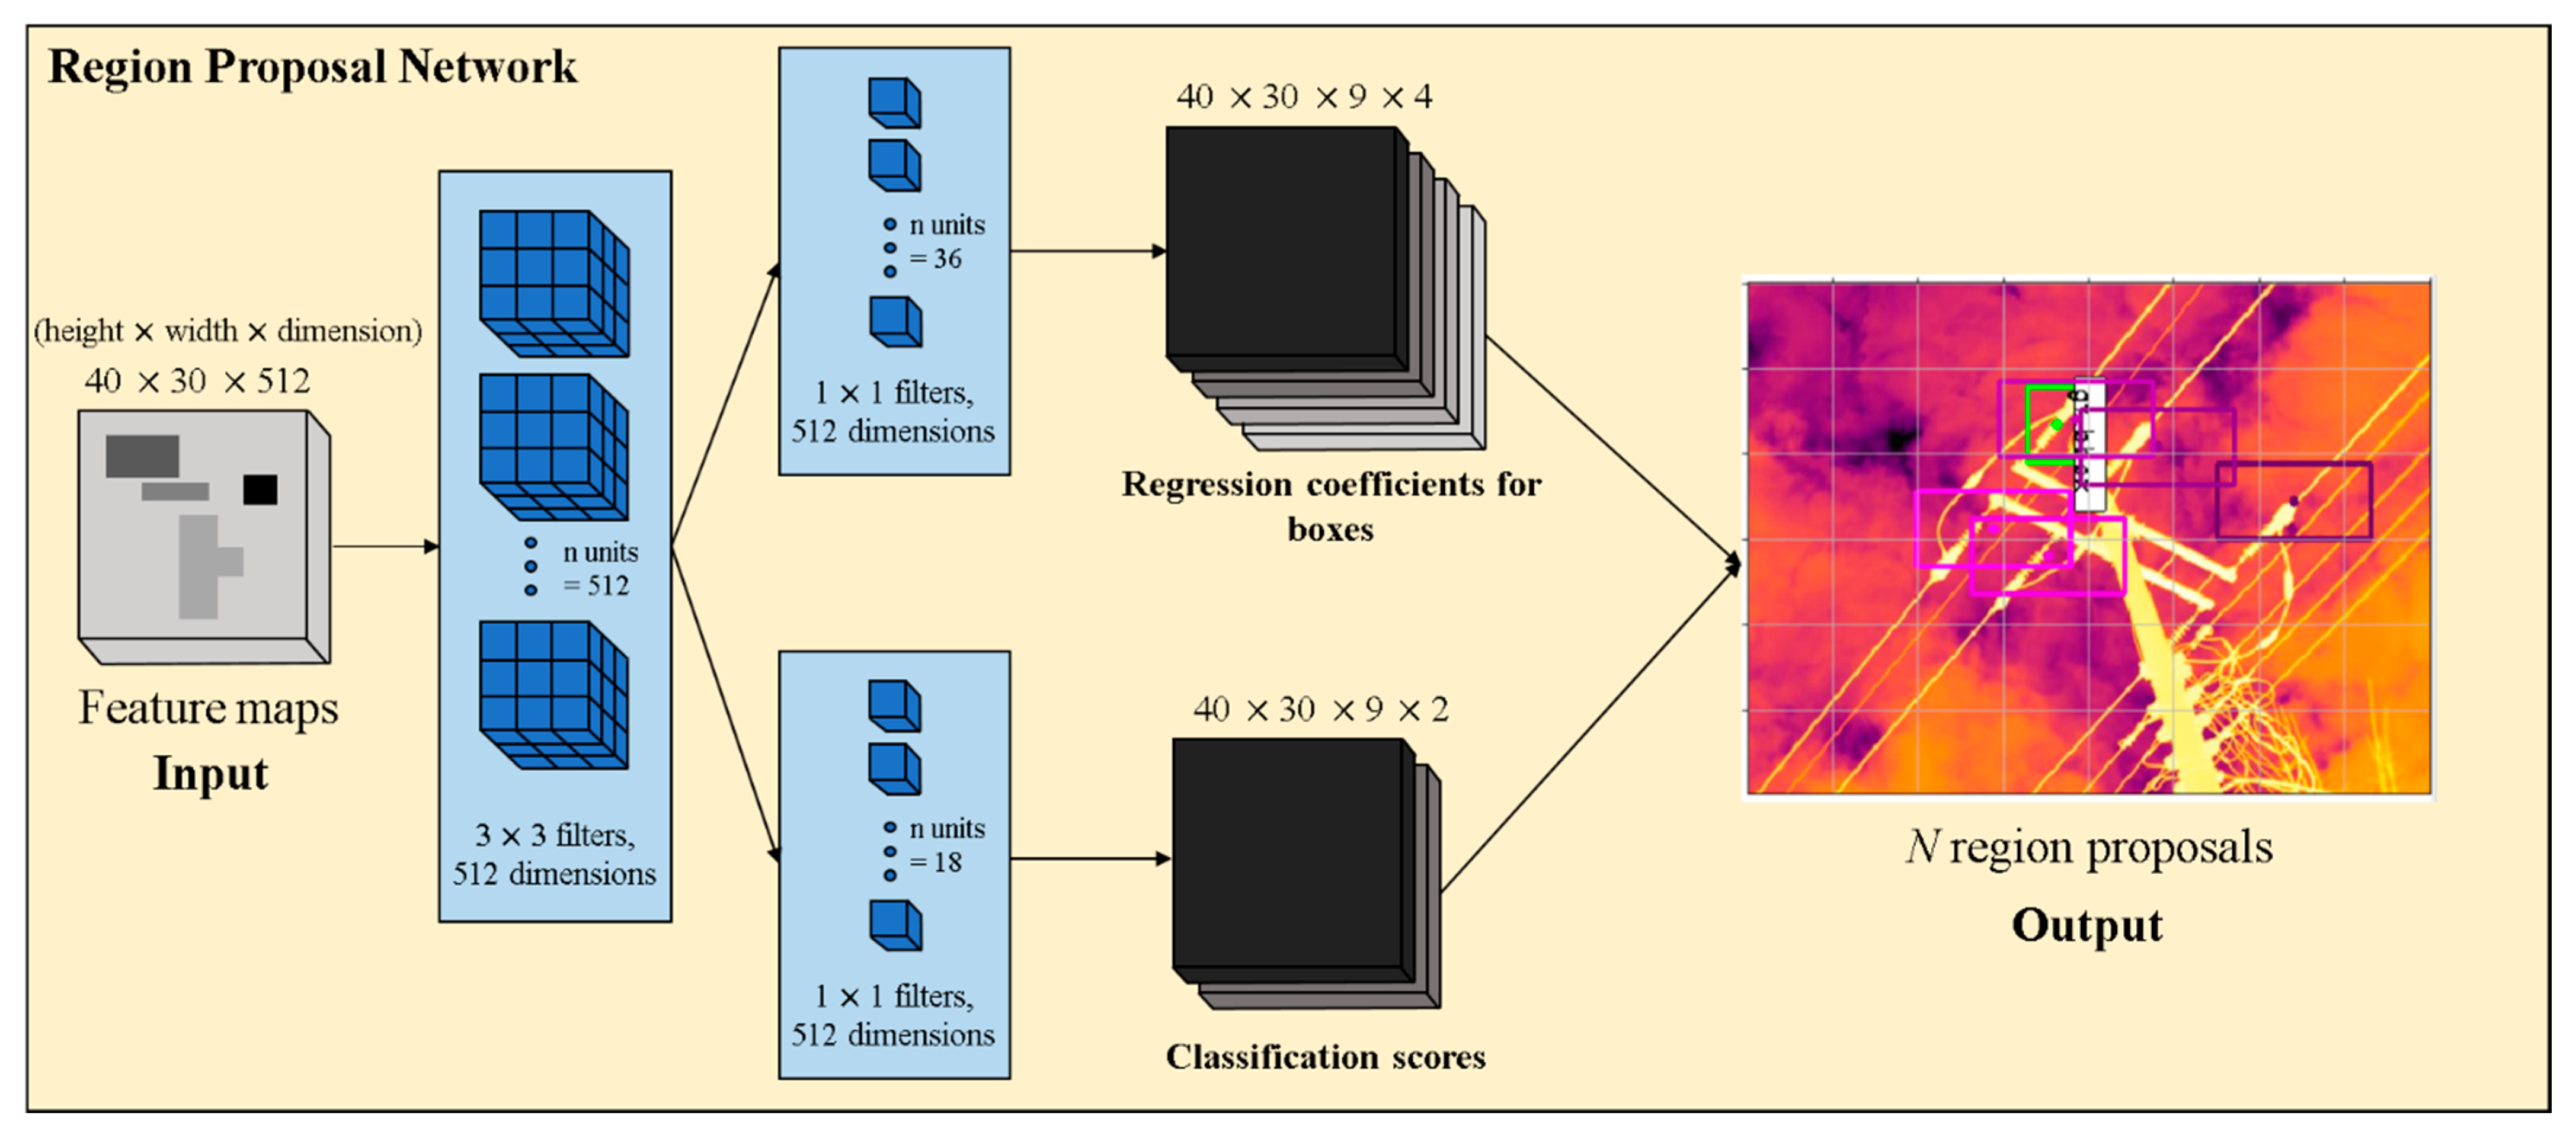
Figure 5.
Architecture of the Region Proposal Network (RPN).
Finally, the output of the Faster R-CNN is the four coordinates of the boxes and the probability that the objects in that IRT image are of a particular class. In the overall structure, the detector network and ROI pooling training are the same as in the previous version of Fast R-CNN. The architecture of the Faster R-CNN detection pipeline is shown in Figure 4.
3.2.2. Region Proposal Network (RPN)
An RPN takes a feature map as input and outputs a set of rectangular region proposals and objectness scores. The architecture of the RPN is shown in Figure 5. In order to generate region proposals, the RPN slides a network over the feature map output by the VGG-16. This network is fully connected to a 3 × 3 spatial window of the input feature map. Each sliding window is mapped to a lower-dimensional vector (512-d for VGG-16). This vector is inserted into each box-regression layer and a classification layer, respectively. ReLUs (Rectified Linear Unit) are applied to the output of the 3 × 3 convolutional layer. At each sliding window, the network predicts k region proposals. Therefore, the box-regression layer has 4k outputs encoding the coordinates of k boxes, and the classification layer has 2k output scores on an object or not-object. The k proposals are parameterized connections to k reference boxes, which are called anchors. Each anchor is centered at the sliding window. The anchor is related to three scales (8, 16, 32) and three aspect ratios (0.5, 1.0, 2.0), hereby resulting in k = 9. For a feature map of size W × H, the RPN predicts W × H × k anchors. In this experiment, 40 × 30 × 9 anchors were created for each feature map. The 36 units in the box-regression layer give an output of size 40 × 30 × 9 × 4 (Figure 5). This output is used to give the four regression coefficients of each of the nine anchors for every point in the backbone feature map of size 40 × 30. These regression coefficients are employed to improve the coordinates of the anchors that include objects. The 18 units in the classification layer give an output of size 40 × 30 × 9 × 2 (Figure 5). The output is used to predict the probability that each point is in the backbone feature map.
In order to train the generation of region proposals, the RPN assigns each anchor a binary class that represents whether it is an object or not-object. To assign an anchor a positive label, the following conditions must be satisfied:
- (i)
- The anchors with the highest IoU (Intersection-over-Union) overlap with a ground-truth box.
- (ii)
- An anchor that has an IoU overlap greater than 0.7 with any ground-truth box.
An anchor is labeled negative if its IoU with all the ground-truth boxes is less than 0.3. Anchors between 0.3 and 0.7 do not contribute to RPN training. On the basis of these conditions, the RPN is trained to minimize the following loss function:
In this loss function, i is the index of an anchor. Table 1 presents the variables of the loss function. The outputs of the classification layer and regression layer consist of and , respectively. The terms and in the regression loss are calculated as:
where x and y correspond to the two coordinates of the center of the box, and h and w correspond to the height and width of the box, respectively. The variable x is for the predicted box, and is for the anchor, for y, w, and h. This is the boundary box regression process for the ground-truth box close to the anchor.

Table 1.
Variables and explanations in the RPN loss function.
3.2.3. Structure of YOLOv3
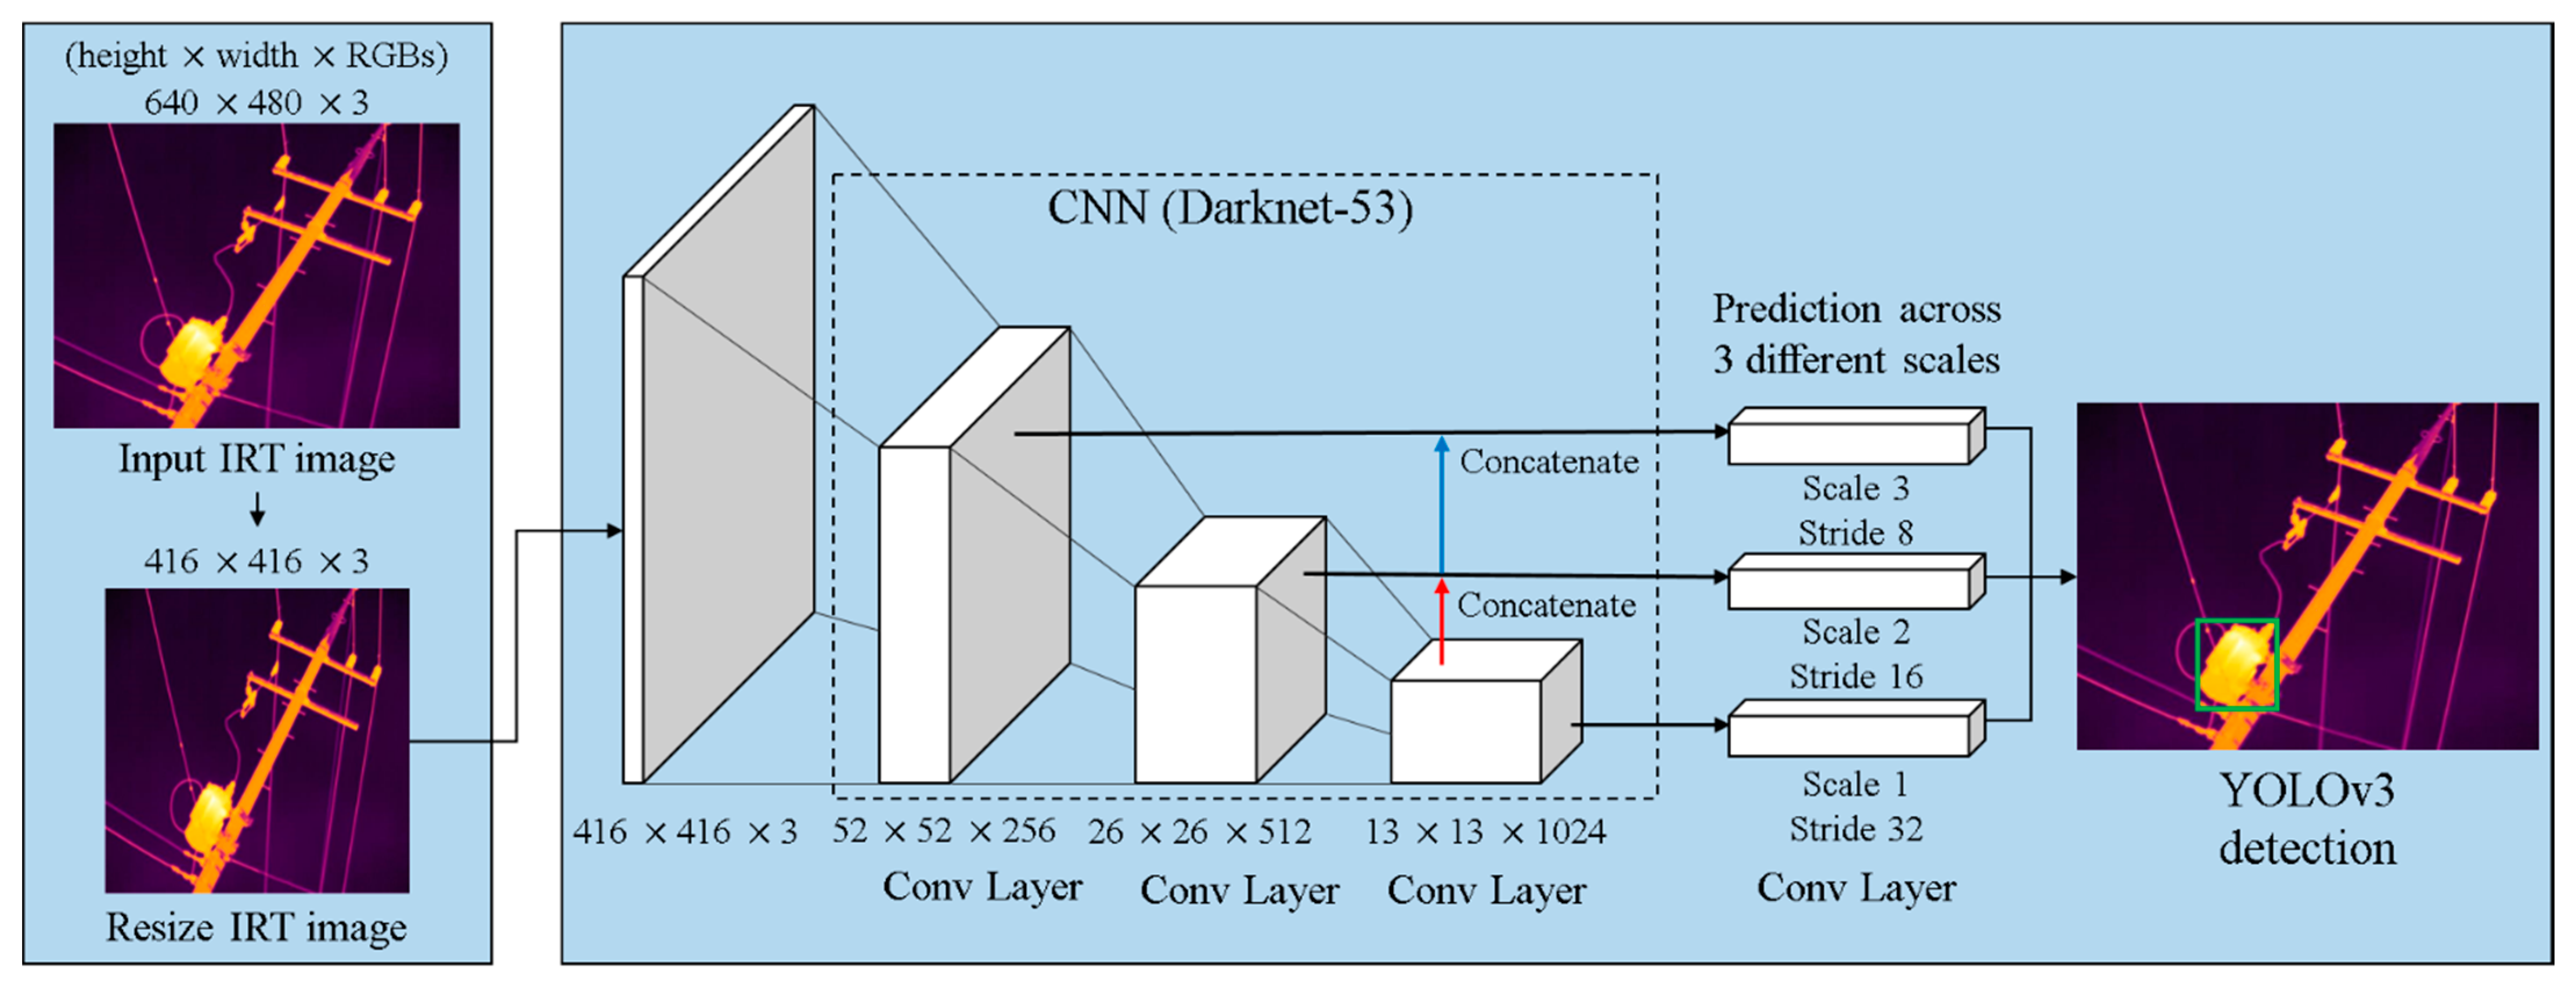
YOLOv3 consists of a backbone network (Darknet-53) and detection layers (YOLO layers). The architecture of YOLOv3 is shown in Figure 6. Darknet-53 is primarily composed of a series of convolutional layers with dimensions of 3 × 3 and 1 × 1, with a total of 53 layers. Each convolution layer is followed by a batch normalization layer and Leaky ReLU. The network also adopts residual blocks as the basic components. Each residual block (residual in Figure 6) consists of a 3 × 3 and 1 × 1 convolutional layer pair with a shortcut connection for every layer. Finally, the IRT image is transformed into a feature map with a size of 13 × 13.
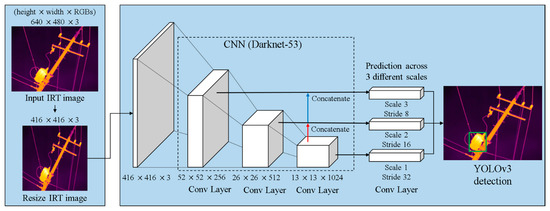
Figure 6.
Architecture of You Only Look Once version 3 (YOLOv3).
In this note, the original IRT image is resized to a scale of 416 × 416 pixels with the RGB colors. YOLOv3 adopts a multi-scale prediction similar to a feature pyramid network (FPN); the initial output size of 416 × 416 downsizes to 208 × 208, then 104 × 104, until it reaches 13 × 13 (Figure 6). In order to make predictions on a multiple-scale feature map, YOLOv3 needs to acquire image features at different scales, which greatly improves the detection of objects. The final three feature maps are formed by combining three feature maps with sizes of 52 × 52, 26 × 26, and 13 × 13. The feature map is transmitted to the three adjacent scales using up-sampling twice. As a result, each cell at each feature map predicts three bounding boxes. For each bounding box, the YOLOv3 network predicts x, y corresponding to the two coordinates of the center of the box, h and w corresponding to the height and width of the box, respectively, and c and p representing the confidence and category probabilities, respectively.
3.2.4. Training of YOLOv3
YOLOv3 divides the input IRT image into S × S grids. This grid is responsible for detecting the object. Each grid outputs B prediction bounding boxes, including the coordinates of the center point, width, height, and prediction confidence. As described in the previous Section 2.2, YOLOv3 combines anchors and multi-scale ideas to assign multiple anchors to each scale feature map according to the height and width of the anchors. The model calculates the IoU of anchors to each ground truth and assigns the ground-truth to the feature map of the anchor. When performing box regression training, backpropagation calculates the predicted anchor close to the ground-truth box. Since the YOLOv3 network is an end-to-end network, the whole process applies a sum-square error for the loss calculation. The loss function of YOLOv3 consists of coordinate error, IoU error, and classification error. YOLOv3 is trained to minimize the following loss function:
with the assumption that:
The BCE function is the binary cross-entropy loss function, which is employed to calculate each coordinate error and classification error by allocating variables coordinates (x, y) and confidence (c), respectively. The value calculated using the SF function is the scaling factor. Assuming the above, each loss in YOLOv3 is as follows:
where () represent the center coordinates, width, height, confidence, and category probability of the ground-truth box, respectively. The variables without the asterisk are predicted for the bounding box. The variable (Equation (8)) represents if the object appears in cell i and (Equations (6) and (7)) indicates that the jth bounding box predictor in cell i is responsible for that prediction. (Equation (7)) represents that there are no targets in this bounding box. In this experiment, is set to 0.5, thereby indicating that the width and height errors are less effective than the errors of the center coordinates () in Equation (6). The coordinate error is calculated only when the grid predicts an object. In Equation (7), in the IoU error is set to 0.5 to reduce the effect of the weight of the grid that does not include objects. As a result, the YOLO layer on each scale outputs N × N × [3 × (4 + 1 + C)], where N is the scale of the layer and C is the number of classes. The three YOLO layers have N values of 32, 16, and 8, respectively.
3.3. Thermal Intensity Area Analysis
In order to measure the temperatures of electrical facilities via IRT, the subject’s emissivity needs to be identified. Errors may occur if the subject from the IRT image is analyzed with the basic set up of thermal cameras (i.e., emissivity with 0.95). Since the emissivity of the subject is the measure of its ability to radiate infrared energy, the value of emissivity tends to vary from one material to another. Therefore, the methodology in this note compensates each emissivity of the components (current transformer, lightning arrestor, insulator, and cut-out switch) in IRT images with values (Table 2) from the previous studies and experiments with KHNP [34,35]. The surface of the current transformer is made of steel plates. The housing material of both lightning arrester and insulator is made with polymeric rubbers. The emissivity of materials used in electrical facilities is shown in Table 2 [34,35]. Since the surfaces of some components are oxidized, this research employs different emissivity values for each oxidized material, respectively. The components are also made up with different materials, hereby attaching T-type(omega) thermocouple on the test subjects to calibrate temperature difference between the thermal camera and direct surface temperature measurement. In order to calibrate the deviation of temperature error, KHNP examined the temperature measurement with multiple materials regarding the thermocouple. The thermocouple is compared with a small blackbody measurement system.

Table 2.
Emissivity values for electrical facilities [34,35].
A deep learning-based object detection model identifies the area that contains the object from the IRT image. By employing the model, the electrical facility in the IRT image is detected automatically for the fault detection process. In this technical note, thermal intensity area analysis (TIAA) is presented to determine the defects in a facility by analyzing specific areas. TIAA determines whether a facility has failed based on meta information of IRT images, type of facility, and standard specifications of the International Electrotechnical Commission (IEC) for the facility. The main purpose of TIAA is to provide a warning about the potential risks in the facility by comparing detected temperatures and the maximum temperatures of the facility, which can be obtained from the IEC or manufacturers’ manuals. Therefore, it is difficult to diagnose the faults in detail. However, examining each electrical facility requires many resources, such as time and manpower. The manual process requires tools, electricians, and sometimes causes actual risks to humans. The methodology presented in this note prevents these factors by detecting and analyzing potential faults remotely and automatically (Algorithm 1).
| Algorithm 1. Thermal Intensity Area Analysis (TIAA) |
| Input:: Temperature of detecting facility i |
| Conditions (Emissivity , Air temperature , Relative humidity , Thermocouple) |
| of facility i |
| : Standard temperature of facility i |
| Output: Alert with detecting facility’s conditions |
| 1. If > then |
| 2. Alert TIAA System |
| 3. Provide conditions () of facility i |
4. Experimental Results
The PC used to evaluate the performance of the system proposed in this technical note is an Intel Core i7-7700HQ CPU (Santa Clara, CA, USA) with 16 GB of RAM and an NVIDIA GeForce GTX 1070 GPU (Santa Clara, CA, USA). The development environment was implemented using Python, Keras, and Tensorflow. The thermal camera used in the experiment is a T660 model from FLIR.
4.1. Data Collection and Preprocessing
In this study, 16,843 IRT images with resolutions of 640 × 480 were collected to verify the intelligent fault detection system. The IRT image data were collected in a single snapshot under various environments and seasonal conditions. The IRT image data were all composed of power transmission facilities, and there was a difference in backgrounds caused by shadows and luminance differences over time during IRT image acquisition. Since the reflective temperature from the surrounding of the component may influence its actual temperature, the KHNP expert used the sky as a background for the images to reduce the impact of the environment (i.e., trees, land, buildings, etc.). Four component types, i.e., current transformer (CT), lightning arrestor (LA), insulator (INS), and cut-out switch (COS), were selected as components causing failure resulting from deterioration in power transmission facilities (Figure 7). Labeling the collected IRT images, a total of 93,315 objects were detected, with 2841 CTs, 11,439 LAs, 72,242 INSs, and 6793 COSs. The IRT image data were separated into training sets and test sets at a ratio of 8:2.

Figure 7.
IRT images of Current Transformer (CT), Lightning Arrestor (LA), Insulator (INS), and Cut-Out Switch (COS).
4.2. Object Detection Model Training and Evaluation
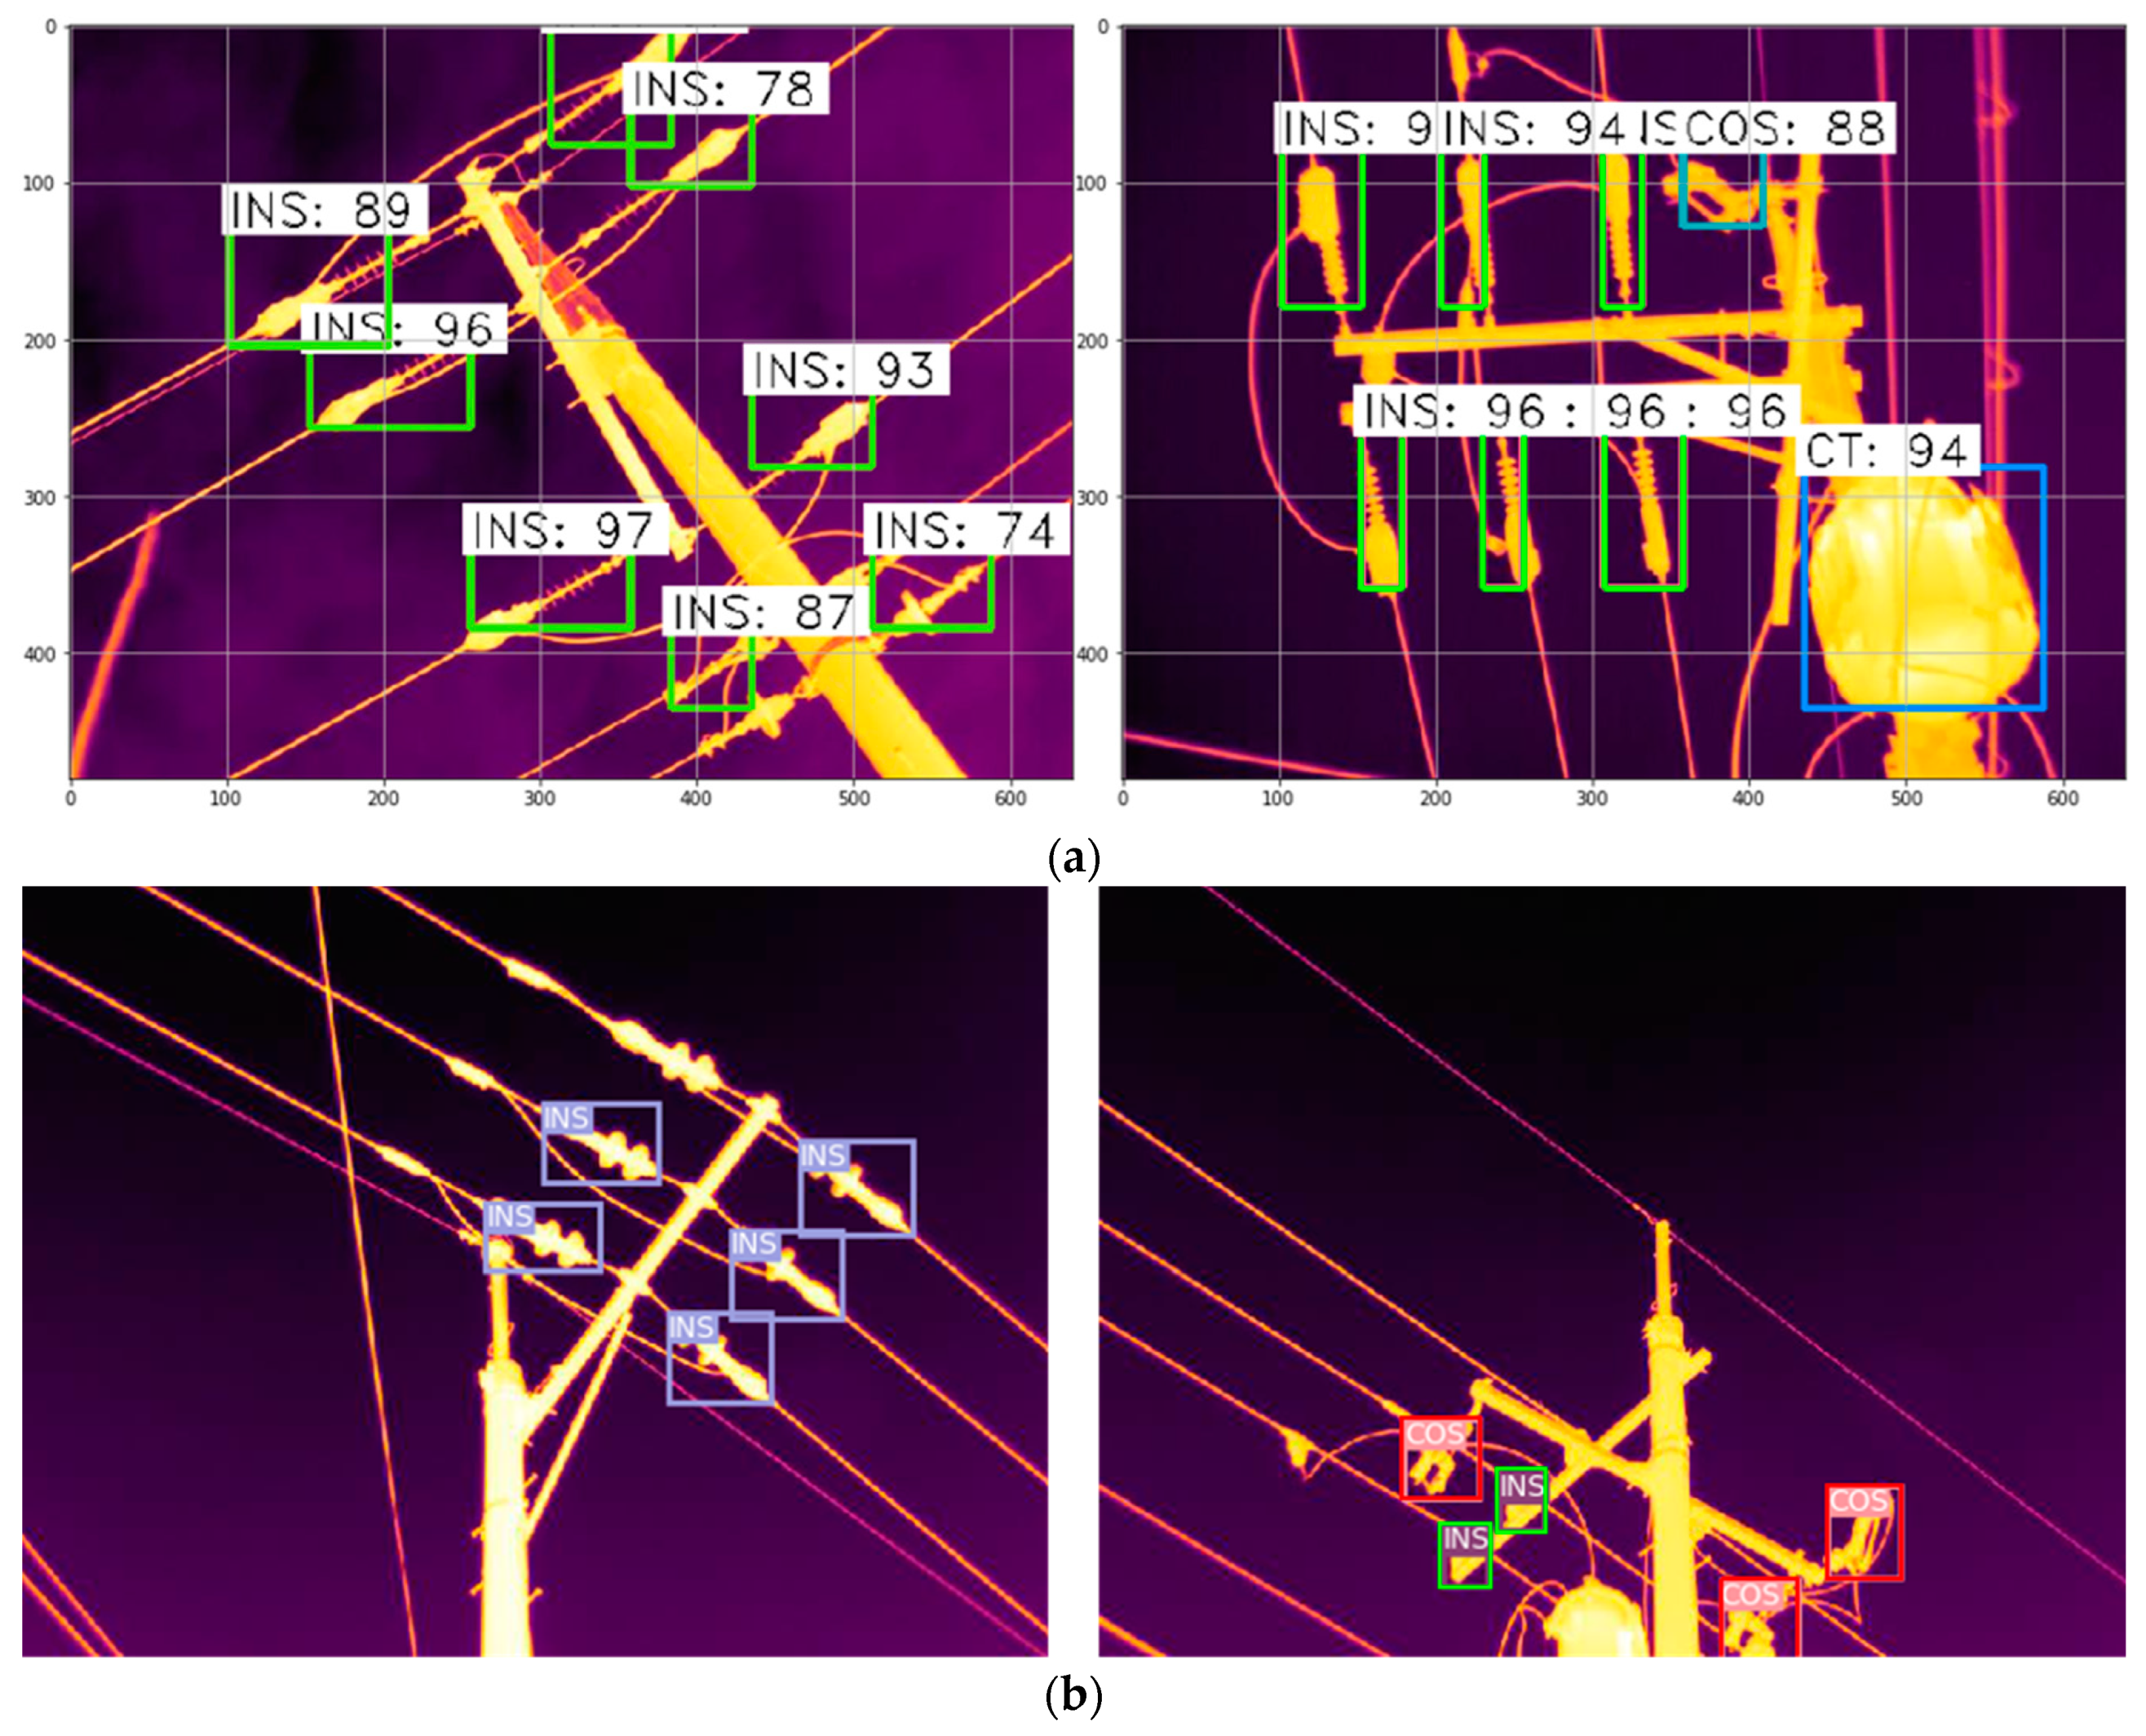
Object detection models were trained using the collected power transmission IRT images. The two models, Faster R-CNN and YOLOv3, were trained and verified with the same IRT images. Examples of detection results for both models are shown in Figure 8. Faster R-CNN recognizes the objects with identification probabilities and boxes as shown in Figure 8a. For instance, the blue square with CT:94 (bottom right) in the second picture of Figure 8a describes that the object in the box is 94% likely to be a current transformer (CT: 94).
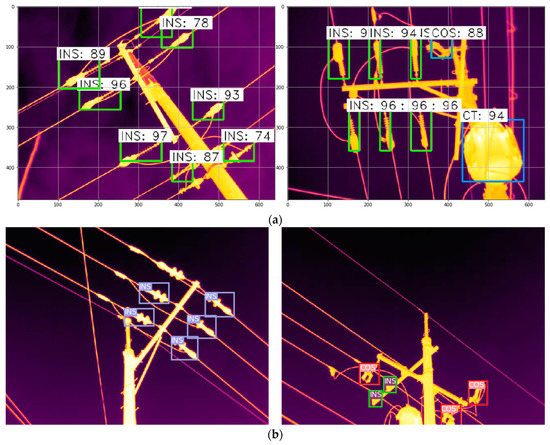
Figure 8.
(a) Detection results for Faster R-CNN and (b) detection results for YOLOv3.
Frame per second (FPS) and mean average precision (mAP) were used to measure the performance of the object detection models. It is difficult to compare performance with the simple overarching values of precision and recall with trade-off relationships. Therefore, the average precision (AP) was calculated for each class to evaluate the model. Most of the performance of object detection and image classification models in computer vision is evaluated by AP. If there are multiple classes of objects, the performance of the model is evaluated by combining all APs per class and dividing them by the number of classes, which is called mAP. In this study, the detection accuracy of each object detection model, Faster R-CNN and YOLOv3, was compared using mAP.
While mAP is used as an indicator of accuracy, FPS is an indicator of the image processing speed of the models. Object detection models not only increase accuracy, but also attempt to increase the speed to reach real-time [36]. Therefore, speed is a significant indicator of the performance of the object detection model. FPS is usually used to indicate how many images per second are processable when expressing the speed of a model. Accuracy is easy to compare for each methodology, but speed depends on the size of the image and hardware, so only relative comparisons are possible. In this experiment, two models were trained using the same hardware and IRT image data. A table of performance indicators for the models is shown in Table 3.

Table 3.
Evaluation metrics for Faster R-CNN and YOLOv3.
In this study, Faster R-CNN showed better performance with respect to AP than YOLOv3, while the FPS for each model showed the opposite results. The methodology proposed in this research focuses on accuracy rather than speed because that is its main purpose. Because TIAA focuses on early fault detection, which may not instantly lead to urgent circumstances, image processing speed is a less important factor than precision. Therefore, the Faster R-CNN is employed for TIAA. However, encouraging FPS without losing precision advances the current model. This research is a pilot study for exploring the possibility of using IRT image-based object detection models in the actual field.
4.3. Thermal Intensity Area Analysis
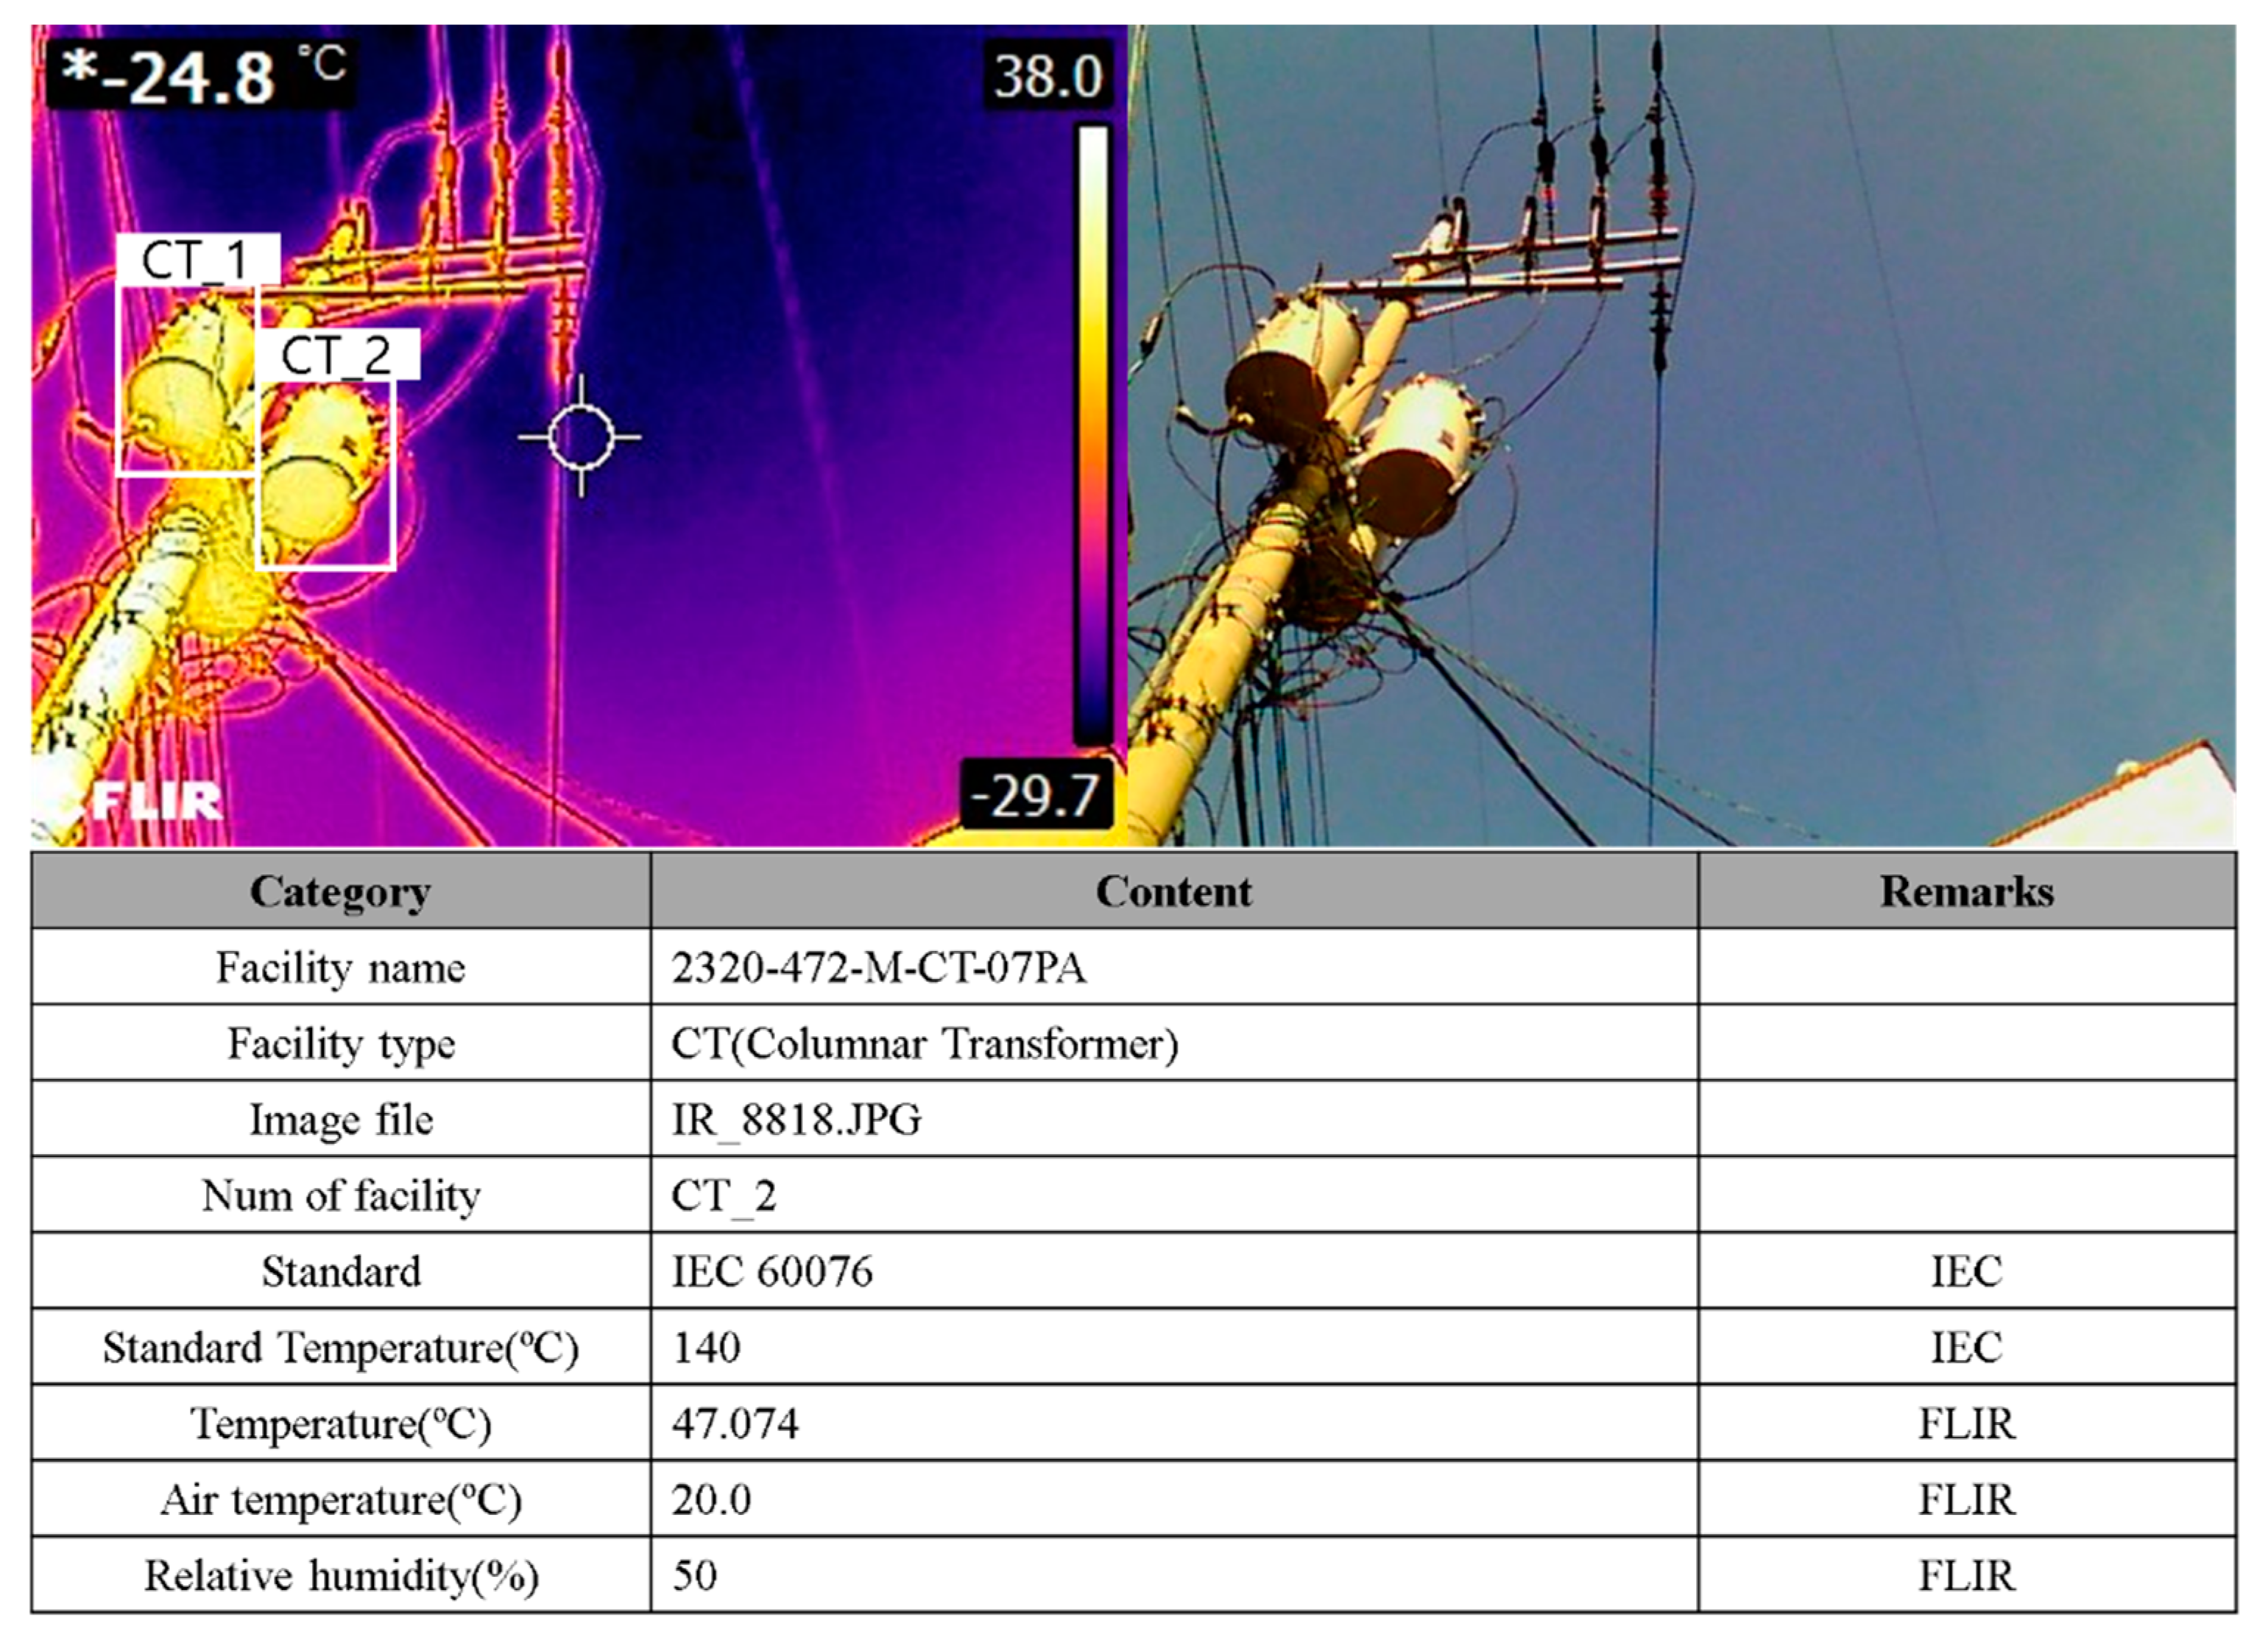
As described in Section 3, the IRT image and deep learning-based object detection models were tested for applicability to diagnostic methods. The TIAA proposed in this note presents meta information of IRT images and IEC standards as the basis for facility diagnosis. In this experiment, IRT images were obtained using FLIR T660. TIAA shows the following information from the processed IRT images of the facility: facility name, facility type, IRT image file name, number of facilities within image, IEC standard for the facility, maximum temperature, emissivity, air temperature, and relative humidity. An example of the results of the TIAA is shown in Figure 9.
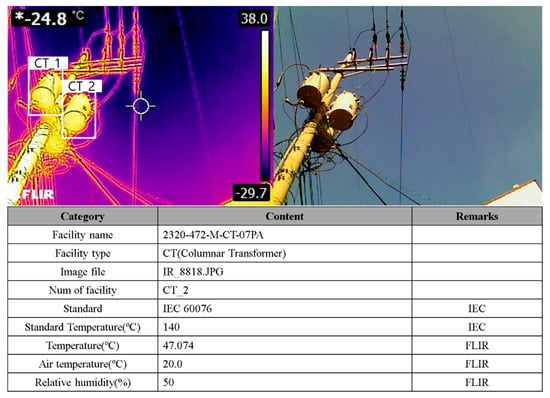
Figure 9.
Thermal Intensity Area Analysis (TIAA) model.
5. Conclusions
In this technical note, an intelligent fault detection system using IRT images and a deep learning-based object detection model is proposed for sustainable machine maintenance. Currently, various faults from electrical facilities are diagnosed via vibration analysis. Although vibration-based diagnostics show outstanding results, limitations still remain. Some parts of the electrical facilities do not cause any vibration. However, these parts may emit heat instead of vibrations because of their nature, i.e., pure electric components. Vibration analysis requires direct contact with the facilities, while some parts are difficult to attach to the system for various physical reasons. This traditional analysis also requires huge computation power for the denoising process to extract signals from vibration data. Because of its nature, detecting deterioration is almost impossible. Therefore, this study proposes TIAA as an alternative or complementary methodology for diagnosing deterioration caused by irregular rotation (mechanical reasons) or irregular power (electrical reasons). Acquiring IRT images of the facility is a remote process that allows measuring the temperature of the facility and its surrounding conditions, such as humidity, air temperature, and emissivity, thereby providing electricians with various datasets, other than simple vibration data, in a safe manner. This technical note presents a safe and efficient fault detection approach for maintaining power systems sustainably.
To extract objects from IRT images of a power transmission facility, each deep learning-based object detection model (Faster R-CNN and YOLOv3) was trained with 16,843 IRT images, which contained 93,315 objects (2841 CTs, 11,439 LAs, 72,242 INSs, and 6793 COSs). The IRT image data were separated into training sets and test sets at a ratio of 8:2. The results of the experiment for detecting four components of the power transmission facility showed mAP values of 63.9% for Faster R-CNN and 49.4% for YOLOv3. Conversely, YOLOv3 (FPS = 33) had a higher FPS value than the Faster R-CNN (FPS = 8), which indicates that the image processing speed of YOLOv3 is faster than Faster R-CNN. Based on the results, Faster R-CNN showed better performance with respect to AP than YOLO v3 did, while the FPS for each model showed the opposite results. Te methodology proposed in this research focuses on accuracy, as TIAA is used for early fault detection for sustainable operation, which may not lead to urgent issues. Therefore, Faster R-CNN was selected and trained for TIAA. This research is a pilot study for analyzing the possibility of using IRT image-based object detection models in the actual field; therefore, encouraging FPS without losing precision advances the methodology proposed in this note. The facilities’ surface and operating conditions may vary the emissivity. The correlation between oxidized surface and the emissivity values of materials will be examined for further research. Each variation of voltage and current may influence the emissivity of the facilities, respectively. In order to improve the accuracy of TIAA, further studies with KHNP will explore the variation trend analysis for each factor.
Author Contributions
Idea and Conceptualization, J.S.K., S.W.K., experimentation, J.S.K., K.N.C., writing and drawing, S.W.K., K.N.C., revision and correction, S.W.K., K.N.C. All authors have read and agreed to the published version of the manuscript.
Funding
This research was funded by INHA University.
Institutional Review Board Statement
Not applicable.
Informed Consent Statement
Not applicable.
Data Availability Statement
Not applicable.
Acknowledgments
Joo-Hyung Kim, Department of Mechanical Engineering INHA University.
Conflicts of Interest
The authors declare no conflict of interest.
References
- Doshi, D.A.; Khedkar, K.B.; Raut, N.T.; Kharde, S.R. Real Time Fault Failure Detection in Power Distribution Line Using Power Line Communication. Int. J. Eng. Sci. 2016, 6, 4834–4837. [Google Scholar] [CrossRef]
- KEPCO. Statistics of Electric Power in KOREA. In Korea Electric Power Corporation Annual Report; KEPCO: Naju-si, Korea, 2018; p. 88. [Google Scholar]
- Choi, S.D.; Hyun, S.Y.; Han, H.J.; Shin, W.C. The Assessment of the Risk Index of Live-line Works on Distribution Line by the Accident Analysis. J. Korean Soci. Saf. 2011, 26, 8–14. [Google Scholar]
- Zaporozhets, A.A.; Eremenko, V.S.; Serhiienko, R.V.; Ivanov, S.A. Development of an Intelligent System for Diagnosing the Technical Condition of the Heat Power Equipment. In Proceedings of the 2018 IEEE 13th International Scientific and Technical Conference on Computer Sciences and Information Technologies (CSIT), Lviv, Ukraine, 11–14 September 2018; Volume 1, pp. 48–51. [Google Scholar] [CrossRef]
- Lu, Z.M.; Liu, Q.; Jin, T.; Liu, Y.X.; Han, Y.; Bai, Y. Research on Thermal Fault Detection Technology of Power Equipment Based on Infrared Image Analysis. In Proceedings of the 2018 IEEE 3rd Advanced Information Technology, Electronic and Automation Control Conference (IAEAC), Chongqing, China, 12–14 October 2018; pp. 2567–2571. [Google Scholar] [CrossRef]
- Li, Y.; Xi Gu, J.; Zhen, D.; Xu, M.; Ball, A. An Evaluation of Gearbox Condition Monitoring Using Infrared Thermal Images Applied with Convolutional Neural Networks. Sensors 2019, 19, 2205. [Google Scholar] [CrossRef] [PubMed]
- Lu, S.; Zhou, P.; Wang, X.; Liu, Y.; Liu, F.; Zhao, J. Condition Monitoring and Fault Diagnosis of Motor Bearings Using Undersampled Vibration Signals from a Wireless Sensor Network. J. Sound Vib. 2018, 414, 81–96. [Google Scholar] [CrossRef]
- Wang, T.; Han, Q.; Chu, F.; Feng, Z. Vibration Based Condition Monitoring and Fault Diagnosis of Wind Turbine Planetary Gearbox: A Review. Mech. Syst. Signal Process. 2019, 126, 662–685. [Google Scholar] [CrossRef]
- Song, L.; Wang, H.; Chen, P. Vibration-Based Intelligent Fault Diagnosis for Roller Bearings in Low-Speed Rotating Machinery. IEEE Trans. Instrum. Meas. 2018, 67, 1887–1899. [Google Scholar] [CrossRef]
- Li, Y.; Yang, Y.; Wang, X.; Liu, B.; Liang, X. Early Fault Diagnosis of Rolling Bearings Based on Hierarchical Symbol Dynamic Entropy and Binary Tree Support Vector Machine. J. Sound Vib. 2018, 428, 72–86. [Google Scholar] [CrossRef]
- Jia, Z.; Liu, Z.; Vong, C.M.; Pecht, M. A Rotating Machinery Fault Diagnosis Method Based on Feature Learning of Thermal Images. IEEE Access 2019, 7, 12348–12359. [Google Scholar] [CrossRef]
- Ewins, D.J. Exciting Vibrations: The Role of Testing in an Era of Supercomputers and Uncertainties. Meccanica 2016, 51, 3241–3258. [Google Scholar] [CrossRef]
- Antoni, J.; Randall, R.B. Unsupervised Noise Cancellation for Vibration Signals: Part I-Evaluation of Adaptive Algorithms. Mech. Syst. Signal Process. 2004, 18, 89–101. [Google Scholar] [CrossRef]
- Antoni, J.; Randall, R.B. Unsupervised Noise Cancellation for Vibration Signals: Part II-A Novel Frequency-Domain Algorithm. Mech. Syst. Signal Process. 2004, 18, 103–117. [Google Scholar] [CrossRef]
- Wang, B.; Dong, M.; Ren, M.; Wu, Z.; Guo, C.; Zhuang, T.; Pischler, O.; Xie, J. Automatic Fault Diagnosis of Infrared Insulator Images Based on Image Instance Segmentation and Temperature Analysis. IEEE Trans. Instrum. Meas. 2020, 69, 5345–5355. [Google Scholar] [CrossRef]
- Choudhary, A.; Goyal, D.; Shimi, S.L.; Akula, A. Condition Monitoring and Fault Diagnosis of Induction Motors: A Review. Arch. Comput. Methods Eng. 2019, 26, 1221–1238. [Google Scholar] [CrossRef]
- Yan, X.; Wang, S.; Liu, X.; Han, Y.; Duan, Y.; Li, Q. Infrared Image Segment and Fault Location for Power Equipment. J. Phys. Conf. Ser. 2019, 1302, 032022. [Google Scholar] [CrossRef]
- Lim, G.M.; Bae, D.M.; Kim, J.H. Fault Diagnosis of Rotating Machine by Thermography Method on Support Vector Machine. J. Mech. Sci. Technol. 2014, 28, 2947–2952. [Google Scholar] [CrossRef]
- Janssens, O.; Schulz, R.; Slavkovikj, V.; Stockman, K.; Loccufier, M.; Van De Walle, R.; Van Hoecke, S. Thermal Image Based Fault Diagnosis for Rotating Machinery. Infrared Phys. Technol. 2015, 73, 78–87. [Google Scholar] [CrossRef]
- Choudhary, A.; Shimi, S.L.; Akula, A. Bearing Fault Diagnosis of Induction Motor Using Thermal Imaging. In Proceedings of the 2018 International Conference on Computing, Power and Communication Technologies (GUCON), Greater Noida, Uttar Pradesh, India, 28–29 September 2019; pp. 950–955. [Google Scholar] [CrossRef]
- FLIR. Thermal Imaging Guidebook for Industrial Applications; FLIR: Wilsonvile, OR, USA, 2011. [Google Scholar]
- Jia, F.; Lei, Y.; Guo, L.; Lin, J.; Xing, S. A Neural Network Constructed by Deep Learning Technique and Its Application to Intelligent Fault Diagnosis of Machines. Neurocomputing 2018, 272, 619–628. [Google Scholar] [CrossRef]
- Liu, R.; Yang, B.; Zio, E.; Chen, X. Artificial Intelligence for Fault Diagnosis of Rotating Machinery: A Review. Mech. Syst. Signal Process. 2018, 108, 33–47. [Google Scholar] [CrossRef]
- Han, T.; Liu, C.; Yang, W.; Jiang, D. A Novel Adversarial Learning Framework in Deep Convolutional Neural Network for Intelligent Diagnosis of Mechanical Faults. Knowl.-Based Syst. 2019, 165, 474–487. [Google Scholar] [CrossRef]
- Zhang, L.; Lin, L.; Liang, X.; He, K. Is Faster R-CNN Doing Well for Pedestrian Detection? In Lecture Notes in Computer Science; Springer Science + Business Media: Berlin/Heidelberg, Germany, 2016; Volume 9906, pp. 443–457. [Google Scholar] [CrossRef]
- Jiang, H.; Learned-Miller, E. Face Detection with the Faster R-CNN. In Proceedings of the 2017 12th IEEE International Conference on Automatic Face & Gesture Recognition (FG 2017), Washington, DC, USA, 30 May–3 June 2017; pp. 650–657. [Google Scholar] [CrossRef]
- Wallach, B. Developing. In A World Made for Money: Economy, Geography, and the Way We Live Today; University of Nebraska Press: Lincoln, NE, USA, 2017; pp. 241–294. ISBN 9780803298965. [Google Scholar] [CrossRef]
- Du, J. Understanding of Object Detection Based on CNN Family and YOLO. J. Phys. Conf. Ser. 2018, 1004, 012029. [Google Scholar] [CrossRef]
- Redmon, J.; Farhadi, A. YOLOv3: An Incremental Improvement. arXiv 2018, arXiv:1804.02767. [Google Scholar]
- Redmon, J.; Divvala, S.; Girshick, R.; Farhadi, A. You Only Look Once: Unified, Real-Time Object Detection. In Proceedings of the 2016 IEEE Conference on Computer Vision and Pattern Recognition (CVPR), Las Vegas, NV, USA, 27–30 June 2016; pp. 779–788. [Google Scholar] [CrossRef]
- Redmon, J.; Farhadi, A. YOLO9000: Better, Faster, Stronger. In Proceedings of the 2017 IEEE Conference on Computer Vision and Pattern Recognition (CVPR), Honolulu, HI, USA, 21–26 July 2017; pp. 6517–6525. [Google Scholar] [CrossRef]
- Zhu, X.; Vondrick, C.; Ramanan, D.; Fowlkes, C.C. Do We Need More Training Data or Better Models for Object Detection? In Proceedings of the British Machine Vision Conference, Surrey, UK, 3–7 September 2012; pp. 80.1–80.11. [Google Scholar] [CrossRef]
- Zhao, Z.; Zhen, Z.; Zhang, L.; Qi, Y.; Kong, Y.; Zhang, K. Insulator Detection Method in Inspection Image Based on Improved Faster R-CNn. Energies 2019, 12, 1204. [Google Scholar] [CrossRef]
- Mady, I.; Attia, A. Infrared thermography and distribution system maintenance in alexandria electricity distribution company. In Proceedings of the 21st International Conference on Electricity Distribution, Frankfurt, Germany, 8 June 2011; pp. 6–9. [Google Scholar]
- Marvin, L. Considerations in Measuring Arrester Surface Temperature, INMR. 2019. Available online: https://www.inmr.com/considerations-measuring-arrester-surface-temperature/ (accessed on 7 September 2019).
- Perez, H.; Tah, J.H.M.; Mosavi, A. Deep Learning for Detecting Building Defects Using Convlutional Neural Networks. Sensors 2019, 19, 3556. [Google Scholar] [CrossRef] [PubMed]
Publisher’s Note: MDPI stays neutral with regard to jurisdictional claims in published maps and institutional affiliations. |
© 2021 by the authors. Licensee MDPI, Basel, Switzerland. This article is an open access article distributed under the terms and conditions of the Creative Commons Attribution (CC BY) license (http://creativecommons.org/licenses/by/4.0/).

