Abstract
This paper presents an artificial neural network (ANN) model that simulates user’s choice of electric or internal combustion engine automotive vehicles based on basic vehicle attributes (purchase price, range, operating cost, taxes due to emissions, time to refuel/recharge and vehicle price depreciation), with the objective of analyzing user behavior and creating a model that can be used to support policymaking. The ANN was trained using stated preference data from a survey carried out in six European countries, taking into account petrol, diesel and battery electric automotive vehicle attributes. Model results show that the electric vehicle parameters (especially purchase cost, range and recharge times), as well as the purchase cost of internal combustion engine vehicles, have the most influence on consumers’ vehicle choices. A graphical interface was created for the model, to make it easier to understand the interactions between different attributes and their impacts on consumer choices and thus help policy decisions.
1. Introduction
Automotive electric vehicles (EVs) have been constantly gaining popularity among the general public, as well as governments and policymakers. They are considered an attractive road transport alternative that could reduce the environmental impacts of personal transportation [1,2]. Even though they have great potential in decarbonization and emissions reduction, their widespread adoption and consumer perception are still quite restricted [3]. EV sales represented 9.9% of the total car sales in Europe in the third quarter of 2020, with a strong growth mainly due to the introduction of incentives by governments, in response to the COVID-19 crisis, which benefited buyers of electric cars [4]. This is a large growth compared to previous years; e.g., they constituted only 2% of the market share between 2010 and 2017 [5].
There can be several reasons for this slow uptake. Firstly, electric vehicles require behavioral and attitude changes from the users. They require longer recharge times for their batteries (when compared to refueling time for internal combustion engine vehicles), and the current battery capacity leads to a shorter driving range. Additionally, their lower technology maturity, combined with restricted sales, means that their purchase costs can be much higher than the purchase cost of internal combustion engine (ICE) vehicles [6]. Therefore, better understanding user preferences related to EVs can lead to more effective and efficient policymaking. In this context, the aim of this article is to present a consumer choice model that takes these factors into consideration, based on artificial neural networks (ANNs), with the purpose of facilitating analysis and aid in policymaking.
1.1. Vehicle Type Choice
A common way of analyzing users’ attitudes and preferences towards automotive EVs (and their attributes) can be carried out by creating consumer choice models that can describe the preference of users and estimate the probability of a given product being chosen. For the case of EVs, user preferences towards certain types of vehicles, internal combustion engine or EV, can be mapped to their characteristics (price, driving range, time to refuel/recharge, etc.). Some well-known methods used to describe users’ choices are discrete choice and logit models. In [7], a mixed multinomial logit model was created, based on survey data, to analyze the consumer preferences towards EVs, related to the electricity mix, showing that EV users prefer a renewable energy mix. Similarly, survey data was used to create a mixed logit model in [8], using data from South Korea [9] to analyze user propensity towards autonomous vehicles, concluding that users are still reluctant to use such a vehicle, with cost being an important factor. Consumer preferences for electric vehicles is a widely studied topic in the literature, with the objective of understanding the influential factors and obstacles for wide adoption [10] and also with the objective of forecasting sales [11,12].
When available, historical data, such as past sales and demographic data are used for the modelling. However, for the case of vehicle type choice, where past sales for EVs are not significant, survey data can be used instead, to understand users and their preferences and to model future sales patterns [13]. Such type of data represents a good candidate for use with ANNs, which can model more arbitrary functions, as well as nonlinear dependencies, as long as there is enough data for training.
1.2. Neural Networks
In this study, we apply artificial neural networks (ANNs) to model users’ vehicle type choice, based on a stated preference study. ANNs are mathematical models which are inspired by the biological neural networks that are a part of animal brains. These systems can be trained to carry out specific operations by being given examples. They can be quite versatile and useful when modelling complex systems with different internal interactions and unknown structure, when a reasonable amount of data describing the system is available. There are various ANN types and architectures, suited for different applications [14]. For regression problems, the most suitable ANN is the feedforward neural network.
Such a methodology has been applied in the past in consumer choice and behavior analysis. In [15], the authors investigate the use of neural networks to model and analyze user behavior with respect to low carbon heat generation sources (bioenergy, solar and geothermal), concluding that the ANN is capable of accurately forecasting consumer choice of low carbon heat generation sources. In [16] ANNs are used to predict consumer behavior related to user bank deposits, based on personal characteristics, with the conclusion that ANNs can be superior in classification tasks, when compared with classical discriminant analysis. Moreover, similar studies have been carried out in the mobility sector, such as in [17], where traveler behavior is investigated using ANNs. The authors generate synthetic data to successfully train an ANN which can model decision rule heterogeneity, highlighting that to better understand the model, it is necessary to study the decision-making mechanisms behind ANNs. In [18], neural networks are used to successfully model user pattern behavior in bike-sharing stations, and in [19], neural networks are used to enhance a discrete choice model of user transport mode choice by using an ANN to generate the coefficient related to part of a utility function, improving the model accuracy.
ANNs can also be used to assess consumer’s opinions through text analysis. In [20], the authors apply a recurrent neural network architecture, using long short-term memory elements to analyze Chinese consumers’ preferences towards EVs. Similarly, in [21], the authors use recurrent neural networks and convolutional neural networks to assess Indian consumer sentiments towards EVs.
Overall, the methodology can be quite promising to model user behavior and choice, with less data processing and feature selection necessary, with cases in which the ANNs can outperform the statistical models [22,23]. Moreover, differently from other methods, no assumption is made about the distribution of responses, and the ANNs can also account for panel effects [24]. Therefore, it can be considered as a useful means to model vehicle choice behavior, as well as to assess and better understand user behavior and what motivates people to purchase a certain type of vehicle.
1.3. Policy Context
The policy context for mobility, emissions reduction and climate neutral mobility is an important topic in the European Union (EU) [25]. A good overview of different documents and references is available in [5]; among those is the European Strategy for Low-Emission Mobility [26], where the need to reduce emissions in the transport sector by moving towards zero-emission vehicles is highlighted, and the Strategic Transport Research and Innovation Agenda (STRIA), which includes a roadmap exclusively on transport electrification. There are also cases where models are used in the context of policymaking and assessment. In [27], the impact of CO2 restrictions taking into account an energy efficient scenario is investigated, while in [28] the effect of fuel consumption and CO2 emissions labeling is studied, with policy recommendations. Different types of models for electro-mobility are discussed in [29], as well as their use in assessing policy implications.
There can be, nonetheless, gaps on how to effectively use and apply models for policies. Due to the existence of multiple complex variable interactions, understanding and interpreting the data and the model is not always easy. Moreover, the diversity of factors poses an additional complexity for policymakers, as it is unlikely that all factors can be tackled at once. For instance, in the case of EVs, it is necessary to understand not only which are the current barriers and facilitators to be considered [30,31], but also how they can contribute to a faster adoption of EVs. It is therefore expected that a better understanding of user preferences for EVs can lead to better, more effective and more suited policies. For this purpose, this paper proposes an interactive tool based on the ANN model as a means of making such a model more accessible to non-expert stakeholders.
2. Methodology
2.1. Data Processing
This article makes use of data from a stated preference survey carried out in 2017 to understand the factors that influence users’ car type choice in Europe. Such a study is reported in [32], where the generation of the survey is thoroughly explained, along with its structure and objectives. There were in total more than 1200 respondents from six European countries—France (200), Germany (200), Italy (248), Poland (200), Spain (200) and the United Kingdom (200). A more comprehensive analysis of this survey is carried out in [33], where multinomial and nested logit discrete choice models are used to analyze the results.
The survey had as an objective to obtain people’s preferences regarding electric vehicles, and it covered socio-economic characteristics, car ownership and travel patterns and had two stated preference experiments, where the respondents were asked to choose between multiple scenarios. This paper uses results from a stated preference experiment, where respondents were given scenarios with 3 vehicle types (diesel, petrol and EV) and different vehicle characteristics:
- purchase price (EUR);
- operating cost per km (EUR cent/km);
- emission daily charges (daily fee paid for circulating in restricted urban areas) (EUR/day);
- vehicle devaluation (value after 3 years) (EUR);
- driving range on full tank/charge (km);
- refuel or recharge time (minutes).
The attributes had specific values, originating from a predefined set of numbers assigned for each them, generating multiple distinct scenarios (586 in total). Each respondent was presented a scenario and was asked to choose which vehicle they were inclined to purchase. This process was carried out 4 times for each respondent, with each scenario being responded to multiple times by different respondents (for a total of 4992 responses). For the ANN model, the number of different scenarios (and not the total number of responses) is important, as each scenario will constitute one data point. The dataset had to be processed to convert the responses into scenarios—for each response, a value of 1 was attributed if the EV was chosen, and a value of 0 was attributed if the ICE vehicle was chosen. The average of all the responses (for a given scenario) was then calculated for use as output to the ANN as a fraction of users choosing EV, with the input being the 6 scenario attributes. For example, if for a given scenario 3 respondents chose ICE vehicles and 2 respondents opted for the EV, the fraction of users choosing EV for that scenario would be 0.4.
From the 586 scenarios, 283 had the fraction of users choosing EV equal to 0 (only ICE vehicles chosen for all responses) and 25 scenarios had the fraction of users choosing EV equal to 1 (all the respondents opted for EVs). For the remaining 278 scenarios, the values were between 0 and 1 (with an average of 0.35), meaning that only part of the respondents chose EVs for those scenarios.
Table 1 shows an example of a scenario (with petrol, diesel and battery electric vehicles) with the numerical values for all the attributes.

Table 1.
Example of stated preference question. Based on [33] with data from [32].
Table 2 shows the minimum and maximum values for each of the attributes for the petrol, diesel and battery electric vehicles. In this way, it is possible to understand the range assigned for each of the parameters.
Table 2.
Minimum and maximum values for each attribute.
2.2. Neural Network Model
Based on the survey responses, a neural network was proposed, with the objective of creating a model that would represent the respondents’ answers. Given as input the features of the vehicles, the model should have as output the fraction of users purchasing a battery electric vehicle (BEV) in alternative to ICE vehicles. In this case, the fraction of users choosing a BEV is calculated for each unique scenario, based on the number of respondents who answered positively with respect to intentions of purchasing a BEV, related to the specific scenarios. For this reason, the vehicle type choice is posed as a regression problem, with outputs that can range from 0 to 1. Figure 1 shows a basic scheme of the desired inputs and output of the neural network. The model has 18 inputs in total, corresponding to the purchase price, operational cost, low emission incentive/tax, vehicle value after 3 years, driving range and charge/refuel time for petrol, diesel and battery electric vehicles and a single output related to the fraction of users purchasing a BEV.
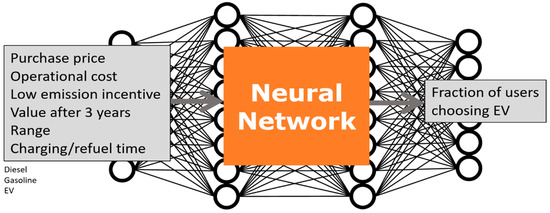
Figure 1.
Scheme of neural network model.
Furthermore, a neural network structure must be defined to be able to properly model the respondents’ opinions. The choice of the right structure is crucial to obtain the proper results to represent users’ decision-making, which is not a straightforward task and relies a lot on experience and trial and error. Different topologies and structures were tested, with varying number of hidden layers, activation functions and number of neurons per layer. The number of neurons was chosen based on an iterative procedure, starting from a lower number of neurons and evaluating the performance of the ANN. Rectified linear unit (ReLu) activation functions were used [34], and the output layer employed the sigmoid activation function, while batch normalization and dropout layers (with 0.3 dropout rate) were used to improve training performance. The neural network was trained using backpropagation using the Adam [35] optimizer (with 0.01 learning rate) and the loss function being mean absolute error (MAE) [36]. The neural network was implemented using the Keras library [37].
Figure 2 shows the overall structure of the neural network.
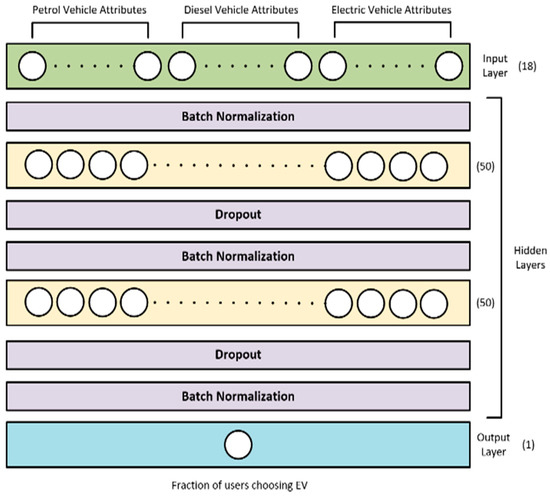
Figure 2.
Neural network structure.
One important step when training a neural network is to take care that the model does not overfit. Overfitting occurs when the model is trained in such a way that it can replicate well the data that was used for the training, but it is not able to generalize to different values that were not used for training. Two procedures that are well-known tools that can be used to avoid overfitting are dropouts and batch normalization. Moreover, it is good practice not to use the full dataset for training of the neural network, and instead to use part of it to validate the trained model throughout the training steps (usually called epochs). The first set (train data) is used in the optimization procedure, while the second set (validation data) is used to calculate the loss function.
In this way, one can compare the accuracy of the model using exclusively the train and the validation data, and when they start to diverge, it can be concluded that the model is starting to overfit (and therefore training should be stopped).
The accuracy of the ANN is compared against a baseline Random Forest (RF) model [38]. This method can be very accurate with small datasets, while also being robust against overfitting. However, when applied to regression problems, Random Forests have the limitation that they cannot extrapolate the range of values of the data used in training, and they also do not interpolate two adjacent input values. This makes the RF model unsuitable for use in the interactive tool, where extrapolation to a full range of inputs is necessary, and highlights the benefits of applying an ANN.
Furthermore, the model can go through an additional testing procedure to visualize its capacity to generalize. The model has been trained with discrete values (e.g., for the scenario generation, the ICE vehicle purchase prices were selected between 3 fixed values, while the EV purchase prices were selected between 8 values), and its capacity to predict outputs from inputs different than those discrete values is essential for a proper model. For this purpose, a sensitivity analysis was carried out, where the model was tested with different and continuously varying inputs.
3. Results and Discussion
3.1. Model Verification
After training, the model accuracy should first be verified, to test its performance. For this purpose, a third set of data was used to verify the model accuracy, the test dataset. The total split between training, validation and test sets was 80-10-10 percent. The training data were used for the training routine, the validation data were used for the indicator of performance (loss function), both during training, and the test data were used during the verification procedure.
The model verification was carried out using the mean absolute error (MAE) as indicator, since it was the loss function used for the training. Equation (1) shows the MAE formulation (y is the actual number from the dataset, is the output from the model and N is the number of samples from the dataset):
Figure 3 shows the model loss for different verification steps for the training of the ANN. Figure 3a,b show the training and validation losses as the training progressed. After some epochs, the losses started to diverge, meaning that the model was starting to overfit. Therefore, early stopping at that stage was carried out. The final model used for the analysis in the next sections was the one obtained in epoch 23. Moreover, Figure 3c shows the losses relative to the number of neurons in each layer, for values between 5 and 100. As can be seen, the training and validation losses have a minimum at 50 neurons, leading to the choice of the number of neurons for the final model. Finally, Figure 3d shows the losses for multiple ANNs with the same structure, but with different random starting weights. This analysis is meant to aid in understanding the robustness of the ANN structure. It is visible that the losses oscillate between 0.15 and 0.16, which is compatible with the training values.
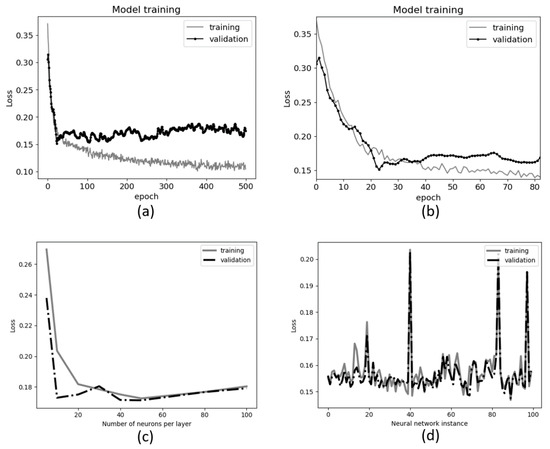
Figure 3.
Training of neural network model: (a) model loss progression for 500 epochs; (b) zoom in to minimum validation loss; (c) training and validation loss relative to number of neurons per layer; and (d) training and validation loss for multiple instances of the artificial neural network (ANN) with different random starting weights.
Furthermore, Table 3 shows the mean absolute error and MAE standard deviation comparison between the train, validation and test data for the neural network and for the Random Forest baseline model. Both ANN and RF models have a similar performance, with Random Forest having a lower error for the test data, demonstrating its higher robustness to overfitting. The higher variance shows that the error comes mainly from very high differences between the actual values from the survey and the predicted values from the model. A further analysis of the results showed that there were cases where the neural network was predicting the opposite value than the actual data, which are also the data points leading to high error. These cases are believed to be outliers in the dataset and will be discussed in the next sections.
Table 3.
Comparison between train, validation and test data indicators for model verification.
3.2. Sensitivity Analysis
An additional model verification was done by applying a sensitivity analysis, generating variations to one or more input parameters and analyzing the output. For this purpose, an initial set of base input values was chosen. These values were chosen in such a way as to obtain an output close to 0.35 (the average value of the nonzero non-unitary responses), to give enough freedom in the sensitivity analysis variations. Table 4 shows the base values used for this analysis.
Table 4.
Input parameters used for testing ANN model. Based on [32].
Initially, the analysis was carried out by varying the input parameters in ±20% and observing the changes in the output. Figure 4a shows the analysis for the 10 most relevant inputs: petrol and diesel vehicle purchase costs, operating costs and range; and BEV purchase costs, operating costs, range and recharge time. The most sensitive parameter was the BEV purchase cost, with inverse sensitivity (a positive change in the input leads to a negative change in the output and vice versa). Figure 4b shows the sensitivity analysis for the BEV purchase price for a range from 5000 to 50,000 Euro.
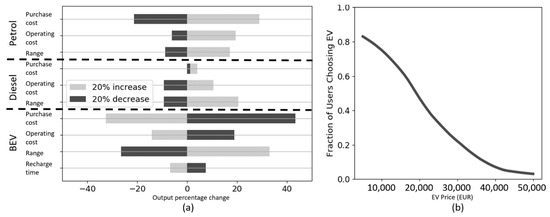
Figure 4.
Sensitivity analysis—(a) ±20% variation on 10 most relevant inputs and (b) nonlinear curve for sensitivity related to BEV purchase price.
The resulting graph shows an s-curve, which can be typical of such models. The presence of this nonlinear behavior means that it is important to analyze not only individual sensitivity but also the interaction between inputs.
For this reason, a dual sensitivity analysis was carried out for the ANN, evaluating the changes in the s-curve from Figure 4b according to variations in other parameters. The evaluation of the input parameters will be shown for: EV driving range, EV charging time, petrol vehicle purchase cost, diesel vehicle purchase cost, petrol vehicle operating costs and diesel vehicle operating costs. The range of the parameters was chosen in such a way as to extrapolate the values shown on Table 2, in such a way as to test the model beyond the data used for its training and testing phases.
Figure 5 shows the evaluation for the varying EV driving range input and EV charging time inputs, in function of the EV purchase price. The EV purchase price is represented on the x-axis, the fraction of users choosing EV is represented on the y-axis and the different curves represent the other varying parameter. The change in the parameters tended to shift the curve with respect to the x-axis (EV price), while the transition slope remained almost unaltered. The results were in accordance with the expected user behavior—EVs with a longer driving range are preferred and similarly a short charging time is much preferred when compared to the longer times. For the EV driving range, the distance between the curves is almost linear, while for the charging time the behavior is non-linear with little change when the charging time is 65 min or lower. With respect to the charging time, it is important to note that the way the survey question was posed, there was no indication of overnight charging, which could be a preferred mode of charging for many users. Therefore, such an option cannot be considered as part of the model.
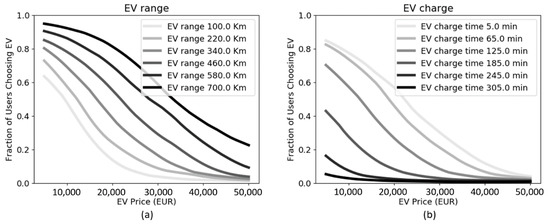
Figure 5.
Model evaluation for varying inputs for (a) electric vehicle (EV) driving range and (b) EV charging time.
For the ICE vehicles’ purchase cost, shown in Figure 6, it can be seen that the model displays the expected consumer behavior—the higher the cost of purchasing an ICE vehicle, the more likely that the consumers will opt for an EV instead. However, the model shows a higher variation with respect to the purchase costs related to petrol vehicle purchase prices when compared to the purchase costs of the diesel vehicle, especially when compared with higher EV purchase costs.
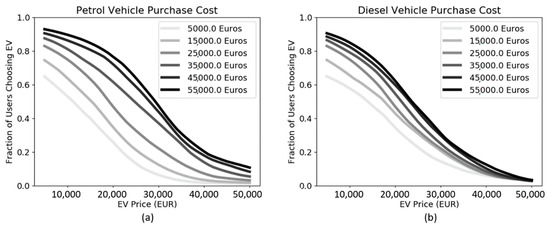
Figure 6.
Model evaluation for varying inputs for (a) petrol vehicle purchase price and (b) diesel vehicle purchase price.
Finally, Figure 7 shows the model output (fraction of users choosing an EV) comparison between operating costs (fuel prices) for petrol and diesel vehicles, with respect to the EV purchase price. Overall, the outputs are consistent with what is expected in practice—higher operating costs lead to a lower chance of consumers purchasing the vehicle. Additionally, once again the results related to the diesel vehicle show less variation when compared to the petrol results. An interesting result from analyzing the effect of the fuel costs in users’ preferences is that one could find the tipping point which could lead to the change of behavior towards purchasing an EV. Such a change could be actionable by policymakers, and therefore useful information to have available in a visualization tool.
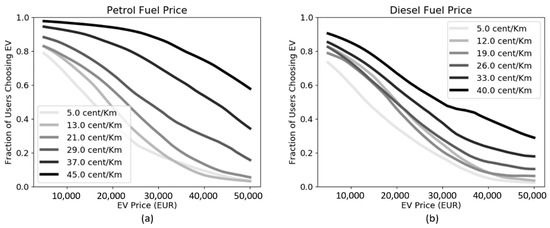
Figure 7.
Model evaluation for varying inputs for (a) petrol vehicle operating costs and (b) diesel vehicle operating costs.
Analyzing the overall results from the dual sensitivity analysis, it can be concluded that the model performs well. The curves have a distinguishable s-shape, which can be characteristic of this type of problem. They display a relatively smooth behavior, interpolating between the discrete values used in training (from the scenarios) and extrapolating well with respect to the maximum and minimum values. Even though the overall model accuracy for training and testing was not very high, the resulting curves from the sensitivity analysis show that the model still has satisfying performance and the capability of generalizing to values that were not included in any of the scenarios in the training and testing phases.
When compared with the results from the other models, there are advantages of using an ANN model. It has similar errors when compared to the RF model, with the added value of allowing sensitivity analyses curves and extrapolation of values used for training.
3.3. Interactive Tool
One of the objectives of this work was to create a visualization of the model that is more accessible to a broad audience, including non-expert stakeholders, so that the impacts of changing the attributes, such as EV range, recharging time and operation cost on powertrain purchasing decisions, can be tried out in an interactive way. For this purpose, an interactive visualization tool was created based on the ANN consumer choice model. It consists of using a graphical user interface where users can easily alter input parameters to the model and visualize how the output is affected.
In this context, the use of neural networks fits quite well within the objective. The most time- and resource-consuming parts of ANNs are the data preparation and processing and the training step. Once the model is trained and validated, it can be run with very little resources or time spent. Therefore, by incorporating the neural network model into the graphical user interface, one can obtain real-time visualization of the results.
Figure 8 shows the graphical interface and the different input parameters that can be varied. It has in total nine sliding bars which can be activated to vary the input values—EV driving range, EV recharge time and EV operation cost, as well as vehicle purchase price, vehicle operation cost and low-emission tax for diesel and petrol vehicles. As a result, the s-curve is changed accordingly, showing the effect of such a change in the fraction of users that would purchase an EV. This allows for a more dynamic evaluation of the model, with the possibility of analyzing its sensitivity when all parameters are changed.
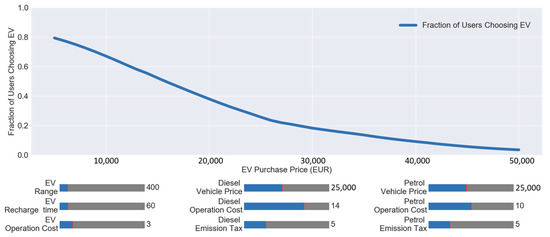
Figure 8.
Interactive tool for visualization of model output.
The creation of the tool aims to shorten the gap between scientific models and policymakers by creating a more accessible means of evaluating, understanding and making use of a model. In our case, the graphical interface provides a way for stakeholders to use the ANN model and understand how the result of different measures could affect the consumer intent to purchase EVs, without the need to fully understand how to run it. In a way, it can give direct access to the user, letting them experience the model without needing to have modelling knowledge.
Thus, by making the results accessible through an interactive tool, the understanding of the interrelation and impacts of policy choices that ultimately affect purchasing decisions can be facilitated. As mentioned, the model is based on data from a stated preference survey and consequently takes into account how consumer decisions are made and the extent to which certain parameters have an influence when deciding about vehicle powertrains.
4. Conclusions
This paper presented an artificial neural network model for consumer preference related to electric and internal combustion vehicles. It uses stated preference data from a survey, with the objective of mapping vehicle attributes, such as range, recharge time and purchase and operation costs, to the intent of purchasing an electric vehicle instead of an internal combustion vehicle. For this purpose, the survey data was processed and used to train the ANN model.
The ANN model has a very similar performance when compared to the Random Forest model, with the added advantage of continuous outputs, which can be used for the policy analysis tool. This highlights the advantages of such a methodology.
An analysis was carried out taking into account the following model inputs: EV purchase price, EV driving range, EV charge time, ICE (petrol and diesel) vehicle purchase price and ICE (petrol and diesel) vehicle operating costs. Overall, the performance of the model was satisfactory, including a sensitivity analysis to verify the model beyond the boundaries of the data used to train it. The results of the ANN model are in line with other studies which apply different methods. In [39], the authors create a nested multinomial logit model and conclude that the vehicle purchase costs are the main drivers for adoption of EVs. In [40], the authors also conclude that vehicle price, vehicle usage, driving range and battery life play a significant role in consumer intentions of purchasing EVs, similar to the results provided by the sensitivity analysis of the ANN model in this work. The methodology overall has proven to be effective. Its advantages are in the ease of use of the data, without much filtering or processing required, as well as the model typology, which was fairly defined. One of the drawbacks of using ANNs is the need for data in large amounts. In our case, there were approximately 1200 respondents (who were presented four scenarios each) and a total of 586 scenarios, which limited the performance of the ANN model. Moreover, with additional respondents, more inputs to the model could have been used to account for unmodelled parameters, such as age and household income.
Additional types of data could also be used for future models, such as presence of public charging infrastructure and users’ opinions on the maximum distance one should be from a charging station. Inclusion of different charging station types, such as public slow chargers, public fast chargers and charging at home overnight are also important inputs to be considered for future surveys and modelling. A similar conclusion on the influence of charging station types, times and costs is presented in [20].
However, there is an advantage with the scalability of the ANNs when very large datasets are available. In this case, ANNs can outperform other models [22,41].
The model sensitivity analysis showed that the most important parameter related to the uptake of EVs is their purchase price, followed by the driving range, both well-known parameters in the literature [42,43]. The recharge time also has a high influence on uptake, with high recharging times leading to very low uptake. In [21], the authors arrive at the same conclusion, that consumers seem to dislike the EV recharging process more when it is compared to standard refueling. Furthermore, by using the ANN model, we are able to verify that the benefits of decreasing the recharge time tend to be less relevant when below 1 h.
Overall, the model showed similar characteristics when comparing petrol and diesel vehicle attributes, but with higher sensitivity towards the petrol attributes. Increasing the purchase cost of ICE vehicles can lead to more users choosing EVs, but with decreased benefits for prices over 35,000 EUR. Fuel prices can have an impact on choice of EVs, but mostly with very high fuel costs.
Finally, the ANN model was included in an interactive tool, as a means to assist the interpretation of data. While the effect of single parameters has been investigated in the past [44], we have created a multi-input model which can be better fit to aid in the assessment of changes in many parameters, allowing for a dynamic sensitivity analysis, understanding the interaction between multiple parameters, which is an advantage of this model. This approach can be used in impact assessments of new policy measures (such as understanding what is the tipping point for EV adoption, which technology developments to favor, and up to which point there is an advantage) and to help understand and communicate the impacts and interrelation of parameters on policy decisions, thus facilitating the policymaking process. The suggestion of a toolset to facilitate policymaking is also encouraged in [40], where the authors bring up the leading role that governments have in wider EV adoption. A similar discussion is carried out in [45], where the authors discuss the need for better policy tools. In this work, such a tool is developed to be used as a standalone attribute value tool, while it can also be used as part of a more complex system composed of multiple sub-models related to future mobility, meaning that such an interface can be a great way to give accessibility to stakeholders to even more complex problems.
However, the disadvantages of using such a tool can be that it cannot be directly customized to new datasets. It cannot be used as a standalone tool where one can easily include their own survey data and visualize the effects of changes in input parameters. For the moment, the model is fixed, and any changes must still be carried out by the modelers. Further developments are still needed to provide a flexible tool for stakeholders which can be easily retrained without the need for the modeler’s intervention. Moreover, improvements are still foreseen for the future, such as the optimization of the ANN structure.
It is important to note that the dataset used is from a 2017 questionnaire, and thus represents people’s opinions with respect to the technologies and EV models available at that time. As the technologies advance and the public opinion changes, the dataset (and therefore the model) will become less relevant. This is a limitation of using survey data for such a purpose, with the need to carry out new surveys every few years, to update the model and the policy support tool.
Author Contributions
Conceptualization, F.L.M.d.S. and P.T.; supervision, F.A. and F.P.; writing—original draft, F.L.M.d.S.; writing—review and editing, F.L.M.d.S., P.T., F.A. and F.P. All authors have read and agreed to the published version of the manuscript.
Funding
This work was carried out within the framework of the SMART (Sustainable use of Materials through Automotive Remanufacturing to boost resource efficiency in the road Transport system) project, which is financed by the Exploratory Research Programme of the Directorate General Joint Research Centre, European Commission, funded by the Horizon 2020 Framework Program for Research and Innovation. The information and views set out in this article are those of the authors and do not necessarily reflect the official opinion of the European Union. Neither the European Union institutions and bodies nor any person acting on their behalf may be held responsible for the use which may be made of the information contained herein.
Institutional Review Board Statement
Not applicable.
Informed Consent Statement
Not applicable.
Data Availability Statement
Survey data were generated by the Joint Research Centre. Derived data supporting the findings of this study are available from the corresponding author upon reasonable request.
Acknowledgments
The authors would like to thank Jonatan Gómez Vilchez, from the Joint Research Centre, for providing the stated preference survey data used in this paper.
Conflicts of Interest
The authors declare no conflict of interest.
Nomenclature
| ANN | artificial neural network |
| BEV | battery electric vehicle |
| EU | European Union |
| EV | electric vehicle |
| ICE | internal combustion engine |
| RF | Random Forest |
| STRIA | Strategic Transport Research and Innovation Agenda |
References
- Pasaoglu, G.; Honselaar, M.; Thiel, C. Potential vehicle fleet CO2 reductions and cost implications for various vehicle technology deployment scenarios in Europe. Energy Policy 2012, 40, 404–421. [Google Scholar] [CrossRef]
- Mccollum, D.; Wilson, C.; Bevione, M.; Carrara, S.; Edelenbosch, O.Y.; Emmerling, J.; Guivarch, C.; Karkatsoulis, P.; Keppo, I.; Krey, V.; et al. Interaction of consumer preferences and climate policies in the global transition to low-carbon vehicles. Nat. Energy 2018, 3, 664–673. [Google Scholar] [CrossRef]
- Rezvani, Z.; Jansson, J.; Bodin, J. Advances in consumer electric vehicle adoption research: A review and research agenda. Transp. Res. Part D Transp. Environ. 2015, 34, 122–136. [Google Scholar] [CrossRef]
- European Automobile Manufacturers’ Association. Quarterly Alternative Fuel Vehicle Registrations; European Automobile Manufacturers’ Association: Brussels, Belgium, 2020. [Google Scholar]
- Tsakalidis, A.; Thiel, C. Electric Vehicles in Europe from 2010 to 2017: Is Full-Scale Commercialisation Beginning? An Overview of the Evolution of Electric Vehicles in Europe; EUR 29401 EN; Publications Office of the European Union: Luxembourg, 2018; ISBN 978-92-79-96719-1. [Google Scholar] [CrossRef]
- Li, W.; Long, R.; Chen, H.; Geng, J. A review of factors influencing consumer intentions to adopt battery electric vehicles. Renew. Sustain. Energy Rev. 2017, 78, 318–328. [Google Scholar] [CrossRef]
- Choi, H.; Shin, J.; Woo, J.R. Effect of electricity generation mix on battery electric vehicle adoption and its environmental impact. Energy Policy 2018, 121, 13–24. [Google Scholar] [CrossRef]
- Byun, H.; Shin, J.; Lee, C. Using a discrete choice experiment to predict the penetration possibility of environmentally friendly vehicles. Energy 2018, 144, 312–321. [Google Scholar] [CrossRef]
- Haboucha, C.J.; Ishaq, R.; Shiftan, Y. User preferences regarding autonomous vehicles. Transp. Res. Part C Emerg. Technol. 2017, 78, 37–49. [Google Scholar] [CrossRef]
- Liao, F.; Molin, E.; van Wee, B. Consumer preferences for electric vehicles: A literature review. Transp. Rev. 2017, 37, 252–275. [Google Scholar] [CrossRef]
- Gnann, T.; Stephens, T.S.; Lin, Z.; Plötz, P.; Liu, C.; Brokate, J. What drives the market for plug-in electric vehicles?—A review of international PEV market diffusion models. Renew. Sustain. Energy Rev. 2018, 93, 158–164. [Google Scholar] [CrossRef]
- Jochem, P.; Vilchez, J.J.G.; Ensslen, A.; Schäuble, J. Methods for forecasting the market penetration of electric drivetrains in the passenger car market drivetrains in the passenger car market. Transp. Rev. 2017, 38, 322–348. [Google Scholar] [CrossRef]
- Glerum, A.; Stankovikj, L.; Thémans, M.; Bierlaire, M. Forecasting the demand for electric vehicles. In Proceedings of the EDC Seminar, University of Leeds, Leeds, UK, 12 November 2013. [Google Scholar]
- Abiodun, O.I.; Jantan, A.; Omolara, A.E.; Dada, K.V.; Mohamed, N.A.E.; Arshad, H. State-of-the-art in artificial neural network applications: A survey. Heliyon 2018, 4, e00938. [Google Scholar] [CrossRef] [PubMed]
- Kennedy, M.; Dinh, V.; Basu, B. Analysis of consumer choice for low-carbon technologies by using neural networks. J. Clean. Prod. 2016, 112, 3402–3412. [Google Scholar] [CrossRef]
- Maria, L.; Stroie, B. Predicting Consumer Behavior with Artificial Neural Networks. Procedia Econ. Financ. 2014, 15, 238–246. [Google Scholar]
- Van Cranenburgh, S.; Alwosheel, A. An artificial neural network based approach to investigate travellers’ decision rules. Transp. Res. Part C 2019, 98, 152–166. [Google Scholar] [CrossRef]
- Lin, L.; He, Z.; Peeta, S. Predicting station-level hourly demand in a large-scale bike- sharing network: A graph convolutional neural network approach. Transp. Res. Part C 2018, 97, 258–276. [Google Scholar] [CrossRef]
- Sifringer, B.; Lurkin, V.; Alahi, A. Enhancing Discrete Choice Models with Neural Networks. In Proceedings of the hEART 2018—7th Symposium of the European Association for Research in Transportation Conference, Athens, Greece, 5–7 September 2018. [Google Scholar]
- Ma, S.C.; Fan, Y.; Guo, J.F.; Xu, J.H.; Zhu, J. Analysing online behaviour to determine Chinese consumers’ preferences for electric vehicles. J. Clean. Prod. 2019, 229, 244–255. [Google Scholar] [CrossRef]
- Jena, R. An empirical case study on Indian consumers’ sentiment towards electric vehicles: A big data analytics approach. Ind. Mark. Manag. 2020. [Google Scholar] [CrossRef]
- West, P.M.; Brockett, P.L.; Golden, L.L. A comparative analysis of neural networks and statistical methods for predicting consumer choice. Mark. Sci. 1997, 16, 370–391. [Google Scholar] [CrossRef]
- Gan, C.; Limsombunc, V.; Clemes, M.; Weng, A. Consumer Choice Prediction: Artificial Neural Networks versus Logistic Models. J. Soc. Sci. 2005, 1, 211–219. [Google Scholar] [CrossRef]
- Van Cranenburgh, S.; Kouwenhoven, M. Using Artificial Neural Networks for Recovering the Value-of-Travel-Time Distribution. In Proceedings of the International Work-Conference on Artificial Neural Networks, Gran Canaria, Spain, 12–14 June 2019; pp. 88–102. [Google Scholar]
- European Commission. European Commission. Europe on the Move—Sustainable Mobility for Europe: Safe, connected, and clean. An EU strategy for mobility of the future. In Communication from the Commission to the European Parliament, the Council, the European Economic and Social Committee and the Committee of the Regions; European Commission: Brussels, Belgium, 2018. [Google Scholar]
- European Commission. A European Strategy for Low-Emission Mobility; COM/2016/0501 Final; European Commission: Brussels, Belgium, 2016. [Google Scholar]
- Siskos, P.; Capros, P.; De Vita, A. CO2 and energy efficiency car standards in the EU in the context of a decarbonisation strategy: A model-based policy assessment. Energy Policy 2015, 84, 22–34. [Google Scholar] [CrossRef]
- Haq, G.; Weiss, M. CO2 labelling of passenger cars in Europe: Status, challenges, and future prospects. Energy Policy 2016, 95, 324–335. [Google Scholar] [CrossRef]
- Thiel, C.; Drossinos, Y.; Krause, J.; Harrison, G.; Gkatzoflias, D.; Donati, A.V. Modelling electro-mobility: An integrated modelling platform for assessing European policies. Transp. Res. Procedia 2016, 14, 2544–2553. [Google Scholar] [CrossRef]
- Silvia, C.; Krause, R.M. Assessing the impact of policy interventions on the adoption of plug-in electric vehicles: An agent-based model. Energy Policy 2016, 96, 105–118. [Google Scholar] [CrossRef]
- Weiss, C.; Heilig, M.; Mallig, N.; Chlond, B.; Franke, T.; Schneidereit, T.; Vortisch, P. Assessing the effects of a growing electric vehicle fleet using a microscopic travel demand model. Eur. J. Transp. Infrastruct. Res. 2017, 17, 330–345. [Google Scholar]
- Vilchez, J.G.; Harrison, G.; Kelleher, L.; Smyth, A.; Thiel, C. Quantifying the Factors Influencing People’s Car Type Choices in Europe: Results of a Stated Preference Survey; EUR 28975 EN; Publications Office of the European Union: Luxembourg, 2017; ISBN 978-92-79-77201-6. [Google Scholar] [CrossRef]
- Rohr, C.; Lu, H.; Smyth, A.; Kelleher, L.; Gómez Vilchez, J.J.; Thiel, C.; Harrison, G. Using Stated choice experiments to quantify the impact of vehicle characteristics that influence European’s propensity to purchase electric vehicles. In Proceedings of the Transportation Research Board 98th Annual Meeting, Washington, DC, USA, 13–17 January 2019; pp. 13–17. [Google Scholar]
- Nair, V.; Hinton, G.E. Rectified Linear Units Improve Restricted Boltzmann Machines. In Proceedings of the 27th international conference on machine learning (ICML-10), Haifa, Israel, 21–24 June 2010; pp. 807–814. [Google Scholar]
- Kingma, D.P.; Ba, J.L. Adam: A method for stochastic optimization. In Proceedings of the International Conference Learn Represent (ICLR), San Diego, CA, USA, 5–8 May 2015; pp. 1–15. [Google Scholar]
- Qi, J.; Du, J.; Siniscalchi, S.M.; Ma, X.; Lee, C.H. On mean absolute error for deep neural network based vector-to-vector regression. IEEE Signal Process. Lett. 2020, 27, 1485–1489. [Google Scholar] [CrossRef]
- Keras. 2015. Available online: https://keras.io (accessed on 21 December 2020).
- Breiman, L.E.O. Random Forests. Mach. Learn. 2001, 45, 5–32. [Google Scholar] [CrossRef]
- Vilchez, J.J.G.; Smyth, A.; Kelleher, L.; Lu, H.; Rohr, C.; Harrison, G.; Thiel, C. Electric car purchase price as a factor determining consumers’ choice and their views on incentives in Europe. Sustainability 2019, 11, 6357. [Google Scholar] [CrossRef]
- Song, R.; Potoglou, D. Are existing battery electric vehicles adoption studies able to inform policy? A review for policymakers. Sustainability 2020, 12, 6494. [Google Scholar] [CrossRef]
- Xu, Y.; Zhang, W.; Bao, H.; Zhang, S.; Xiang, Y. A SEM-neural network approach to predict customers’ intention to purchase battery electric vehicles in China’s Zhejiang Province. Sustainability 2019, 11, 3164. [Google Scholar] [CrossRef]
- Moon, S.; Lee, D.J. An optimal electric vehicle investment model for consumers using total cost of ownership: A real option approach. Appl. Energy 2019, 253, 113494. [Google Scholar] [CrossRef]
- Neubauer, J.; Brooker, A.; Wood, E. Sensitivity of battery electric vehicle economics to drive patterns, vehicle range, and charge strategies. J. Power Sources 2012, 209, 269–277. [Google Scholar] [CrossRef]
- Harrison, G.; Thiel, C. An exploratory policy analysis of electric vehicle sales competition and sensitivity to infrastructure in Europe. Technol. Forecast. Soc. Chang. 2017, 114, 165–178. [Google Scholar] [CrossRef]
- Nielsen, K.R. Policymakers’ views on sustainable end-user innovation: Implications for sustainable innovation. J. Clean. Prod. 2020, 254, 120030. [Google Scholar] [CrossRef]


Publisher’s Note: MDPI stays neutral with regard to jurisdictional claims in published maps and institutional affiliations. |
© 2021 by the authors. Licensee MDPI, Basel, Switzerland. This article is an open access article distributed under the terms and conditions of the Creative Commons Attribution (CC BY) license (http://creativecommons.org/licenses/by/4.0/).