Abstract
As climate changes progress we are dealing with violent and excessive environmental actions. However, the impacts of loads acting on a building object caused by unlikely phenomena such as: fire, explosion, flood, vehicle impact, plane impact, excessive snowfall, and excess wind gusts are still being ignored when analyzing the structure of building objects in the combinatorics of loads. The paper presents a multi-criteria approach to accidental actions and analyzes design situations and load combinations in relation to accidental actions. The existing legal acts were used to define the concept of a construction disaster. The authors verified, on the basis of applicable legal acts and design guidelines, individual analysis strategies for ensuring the safety of building objects and divided them into consequence classes of structural damage. They collected and analyzed the number of construction disasters which occurred in Poland between 1995–2019 (25 years) based on the data from the General Office of Building Control. The number of disasters was divided by voivodeships and causes and supplemented with the data on the number of people injured. The article presents the direction of research development that could be undertaken in order to eliminate future catastrophes caused by the omission of the analysis of the impact of accidental actions at the design stage. Statistical analyses were carried out to show whether land use, population density, and weather factors (wind) affect the number of recorded disasters. It has been shown that regions that have preserved the sustainable development of their territories are less vulnerable to disasters resulting from extreme weather events.
1. Introduction
In the design process, defining the potential loads acting on a building object, and the multi-criteria analysis of these loads, constitutes the most important stage in determining the correct structural operation of a building. The underestimating of loads at the initial design stage is associated with a substantive error, a key element in the destruction of a newly erected and revitalized buildings. The accuracy of the design is dependent on this, and therefore, so is the subsequent safe use of a building. Construction disasters caused by accidental actions are very difficult to predict in advance since they occur as a result of sudden and violent events. One of the purposes of this study was to analyze both the causes and consequences of the construction disasters available for analysis and obtained from various areas of Poland, including their number, cause, and the number of victims over a period of 25 years. An equally important objective was to find out whether there is a statistically significant relationship between the method of land use and the number of construction disasters. The data was obtained from annual reports created by the General Office of Building Control in Poland, the only institution with this data. The collected data can be a source of further scientific research in the field of design safety, construction, and use of buildings as well as in the field of reliability and diagnostics. It may also be relevant for authors of design standards or guidelines as well as for managers, users, and residents, increasing the awareness of risks that can result in a construction accident or disaster.
Currently, for countries associated with the European Committee for Standardization, using a unified system of standards called Eurocodes, the necessity to design structures taking into consideration accidental actions should be thoroughly reflected upon, particularly in the light of advancing climate change which is associated with e.g., severe wind, heavy snowfall, and flooding. Although rapid meteorological phenomena pose a great threat to buildings, they are also a kind of correctness test of their design and construction. The ongoing climate change will affect all countries regardless of their location in the world or their level of economic development. The EASAC Policy Report no. 22 [1] indicated that weather-related catastrophes recorded worldwide have increased from an annual average of 335 events from 1980 to 1989, to 545 events in the 1990s, and to 716 events for 2002–2011. Additionally, [2] indicates that weather disasters have increased in number and intensity in recent decades and that the damage caused by extreme weather events has been on the rise in Europe. Extreme weather conditions may include flooding, drought, high winds, and extreme temperatures. Common engineering solutions for these conditions often involve exterior fortification. It is also emphasized in the cited paper that building engineering which is coupled with landscaping designed to create cooler microclimates will increase mitigation effectiveness. For more than a decade, an increase in the number of construction disasters and incidents caused by severe wind has been observed in Poland (Figure 1) [3,4].
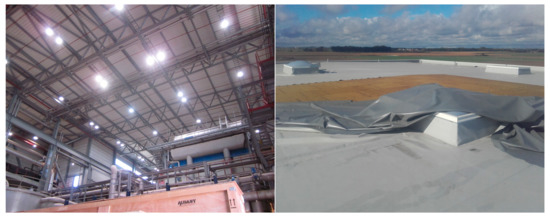
Figure 1.
Deflection of steel elements of the roof structure (left) and damage to the roof sheathing as a result of hurricane winds (right) [4]. Author: B. Ksit.
Authors of [5] discussed about, meteorological features, damage details and failure mechanisms of structures, factors related to damage generation and spread, scales to evaluate storms, and estimations of tornado winds are discussed with the aim of mitigating future wind-related disasters and creating safer and more sustainable societies. Examples also include winters with high intensity of snowfall in Poland. Particularly dangerous for buildings are variable weather temperature situations i.e., higher temperatures during the day that make the snow that has accumulated on roofs melt and then freeze again when the temperature drops [6]. For comparison, it can be stated that the weight of fresh snow is 100 kg/m3, while glaciated snow is 600–700 kg/m3. Each owner or caretaker of a facility is obliged to prevent the roof from exceeding the snow load-weight that was assumed in the design of the project. However, the mass of snow is not always easily determined. Snow action and wind action are combined with ice action, whose impact is of immense importance for all structural elements with small cross-sections. Along with the excessive impact of ice action, the effect of the elements on cross-sections is sometimes several times larger due to sticking with hoarfrost, increasing their weight accordingly [7]. Climate change also causes heat waves, and increased temperature can cause damage to and the failure of the finishing layers of buildings, i.e., cracks in housing panels, failure to roof coverings. The combined effect of temperature load with moisture can cause sudden damage to structures, creating cracks and scratches through which water may leak. It is particularly dangerous for old and historical buildings [8]. Accidental actions caused by excessive hydrostatic water pressure is a phenomenon particularly destructive to structures. Damage is large, the place of occurrence is extensive, and the area covered by such an event is difficult to protect because these actions are often due to progressive degradation [9,10]. For this reason, it is important to locate buildings so that they are least exposed to flooding, inundation, or the raising of water levels (Figure 2) [11,12,13,14,15,16].
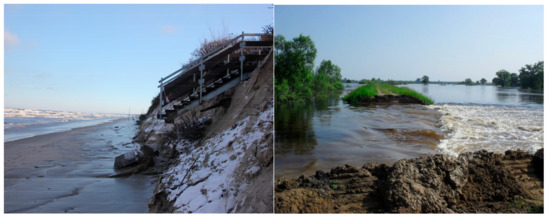
Figure 2.
Stairs destroyed by the sea (left, Author: B. Ksit). A flood embankment broken during the passage of a peak wave (right, Author: I. Laks).
In addition to excessive environmental actions occurring during the use of buildings, other negative phenomena may also occur and can lead to a construction failure or disaster. Accidental events such as fire, explosion, or impact from a vehicle may generate actions with high values. In the event of internal explosion (e.g., in a room or inside a tank), the pressure increases, as a result of which a shock wave is created, destabilizing the construction of the building with its energy [17]. Corrosion processes in reinforced concrete and steel structures adversely affect the reliability of their use. They lead to destruction of concrete surfaces, a reduction in reinforcement diameters, or a reduction in steel profile cross-sections (gross). Structures particularly exposed to corrosion are, i.e., tanks [18,19], silos [20,21,22], bridges, and viaducts. Every structural element is at risk of corrosion: foundations, columns [23], walls [24], floors [25], slabs [26], or beams. These failures or disasters are related to design or execution errors as well as improper use. Additionally, buildings deteriorate due to the use of poor-quality materials, inadequate insulation [27], or a lack of regular repairs and ongoing maintenance (Figure 3) [28,29].
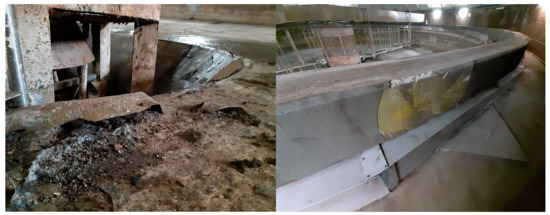
Figure 3.
Corrosion process of the reinforced concrete tank for a sludge thickener (sewage treatment plant) (Author: B. Ksit).
All of these described events and factors may contribute to the occurrence of a construction failure or disaster. Data on the causes and consequences of disasters can be a valuable source for the development of monitoring and reliability systems of building structures [30]. Construction disasters (see definition below, Section 2.1) can occur at any stage of a building’s life, during its construction and operation. Undoubtedly, the construction phase is related to topics widely discussed in the literature regarding accidents during construction works. Construction, as one of the national economic branches, is associated with a high level of threat to the health and life of employees and is characterized by a high accident rate. Based on the data from 2008–2012, the construction industry is ranked second in the European Union among sectors of the economy with high accident rates. In terms of the number of victims of accidents at construction works, Poland was, taking as an example the data from 2012, ranked 10th among European Union countries. At that time, the highest number of victims was recorded for Germany and the lowest for Latvia [31]. Of course, this type of juxtaposition is influenced by the condition of the national economy in a given country, its economic growth, and thus the number of implemented construction investments. Regardless of triggering factors, the issue of occurrence of construction accidents and disasters applies to every country: Poland, other European Union countries, the United States, and all countries in the world. The considered topic is very extensive; however, it is focused on the safety of the implementation and use of buildings [32]. The aim of the study is also to test the hypothesis that areas of sustainable development that have preserved large areas of forests and greenery are less prone to disasters resulting from extreme weather phenomena.
2. Materials and Methods
For the purpose of the paper, it was assumed that the dataset on construction disasters should be analyzed in the following main aspects:
- technical and design, combined with analyzing applicable legal acts and standards,
- analytical with respect to the variability of the number of construction disasters on a multi-annual basis and their main causes,
- correlative between the number of construction disasters and the actual land-use conditions that may affect the likelihood of their occurrence.
The above assumptions are obviously universal and can be used in any part of the world, however their implementation requires adaptation to local conditions. The study refers to the area of Poland, primarily due to the availability of a unique data set. The authors have not been able to find similar data even in the neighboring countries of the European Union. Hence it is difficult to carry out comparative analyses and broader discussions.
2.1. Construction Disaster Definition
The most important document in the field of construction in Poland is the Construction Law [33]. Chapter 7 of the Act [33] provides a definition of a construction disaster as “unintentional, sudden destruction of a building structure or its part, as well as structural scaffolding elements, forming elements, sheet piling, and excavation housing”. To clarify this, the Act [33] states that a construction disaster is not “a damage to an element embedded in a building, suitable for repair or replacement, a damage or destruction of construction equipment related to a building, and installation failure”.
The Act [33] does not define the concept of a construction failure, which is often confused with a construction disaster. A construction failure can be understood as an event that causes damage to the structure of a building, e.g., scratches, cracks, bulges, displacements, deflections, or shifts in structural elements hindering the intended use of the building or part of the building. Construction failures and disasters are caused primarily by human errors and accidental actions [34]. If disasters are not triggered by random determinants, they occur because of human errors. These include: use of a given building which is inconsistent with its purpose, poor technical condition, failure to perform periodic inspections, errors during the construction of a new building or during other construction works in an existing building, and the incorrect design of a building. They also cover: breach of obligations by participants in the construction process during construction, demolition, and renovation as well as non-compliance with the execution technology or deviations from the construction’s design. Whereas, random events include: strong winds, fires, gas system explosions, intense precipitation, atmospheric discharges, landslides, ice phenomenon on rivers, floods, and traffic accidents.
The register of construction disasters in accordance with the obligation provided for in the Act [33] is maintained by the General Office of Building Control.
2.2. Accidental Actions
Actions according to [35] shall be classified by their variation in time. We can distinguish persistent, transient, and accidental actions included in design situations. Persistent actions are those whose value, location, and direction remain unchanged during the construction, assembly, and use of a building/structure. These include the self-weight of elements, unit weight of soil, pre-compression force of the structure, shrinkage, and differential settlement. Transient actions are those whose value, location, and direction may change during the use of a building. Transient actions are divided into utility actions—related to the function and usage of a given facility, e.g., equipment, technological lines, and vehicle weight; and environmental actions—related to the impact of operating loads such as snow, wind, ice, and temperature. We define accidental actions as those that may occur as a result of unlikely events during the use of a building. These include actions caused by fire, flood, explosion, impact from a vehicle, impact from a vessel, impact from a helicopter, heavy snowfall, catastrophic winds, and seismic shocks [35]. It is reasonable to suppose that during the entire period of use of a building, no accidental actions will occur. Although once they occur, the consequences are usually severe. It is impossible to design all structures to be resistant to accidental actions, because then such a building should be designed and later executed as resistant to fire, explosions, and flooding. However, in justified cases related to location, usage, future functionality, and such actions should be taken into consideration. This applies to e.g., tanks for flammable liquids, dams, bridges, and airport buildings. Accidental actions can be divided into global and local actions (Table 1) [36].

Table 1.
Division of accidental actions [36].
2.3. Design of Buildings and Construction Works for Accidental Actions
Building structures are designed using the limit state method. Limit states are verified by a dynamic analysis, a static analysis, a fire circumstances analysis, and other calculations supported by tests [35]. A combination of actions, in which the simultaneous occurrence of different actions in the tested limit state is assumed, should always be created for at least two occurring actions. Design situations are time specific and represent the actual conditions for which the limit states may be calculated, including the levels in which they are exceeded. The following design situations are distinguished: persistent (for the intended use of structures), transient (for temporary conditions during construction or transport), accidental (for exceptional conditions for the use of structures), and seismic (taking into account inertial forces caused by an earthquake).
Building design and construction work which considers accidental actions is carried out in accordance with the standard [37]. The norm specifies strategies and principles that should be applied to safeguard the performance and use of buildings in the event of identified and unidentified accidental actions. Identified accidental actions cover e.g., a vehicle hitting a building wall or a helicopter landing hard on a hospital roof. Unidentified actions can include e.g., explosions, terrorist attacks, or warfare. Identified actions may be analyzed using a classical (advanced) structural analysis and are then considered only in the accidental design situation, which corresponds to a combination of actions expressed by the Equation (1) [35].
where:
- Σ Gk is the combined effects of characteristic persistent actions,
- “+” means “that it should be considered in combination with…”,
- P is the prestressing action,
- Ad is the notional accidental action,
- Qk,1 is the characteristic leading transient action,
- Σ ψ2,i Qk,i is the combined effect of accompanying transient actions, and
- ψ1,1,ψ2,1 is the combination of factors for accidental design situations, depending on the accidental design situation (e.g., impact, fire, condition of a structure after an accidental event).
The characteristic value of the persistent action G should be determined as follows [35]:
- −
- if the variability G can be considered as small, it is permissible to use one single value Gk,
- −
- if the variability G cannot be regarded as small, two values should be used: the higher value Gk,sup and the lower value Gk,inf.
The variability of persistent action can be omitted when it does not change significantly over the design life of a structure and its coefficient of variation is low. This is the case, for example, when the self-weight of a structure is considered, for which the value of the coefficient of variation does not exceed 5% [38,39]. In such situations, the standard [35] recommends that the mean value should be taken as the characteristic value of persistent action.
The characteristic value of transient action Qk should correspond to one of the values below [35]:
- −
- the top value with the assumed probability of this not being exceeded, or the bottom value with the assumed probability this being achieved in the definite return period,
- −
- a nominal value that can be determined if the statistical distribution is unknown.
The characteristic value of climatic loads (wind, snow) is determined assuming that the probability of exceeding the value of the variable part of this action by its maximum for one year is 0.02 (quantile 98%). This is equivalent to assuming that the average period between successive exceedances of the variable part in time (mean return period) is 50 years [35]. For other types of transient actions, e.g., live load in buildings, other reference periods may be more appropriate, e.g., the mean period between changes in the methods of land use which involve a change in the assumed exceedance probability to obtain a standard return period. For imposed loads, the characteristic value is usually in the 95% quantile with a reference period of 50 years [38,39].
The reducing coefficient ψ, known as the combination factor, is designed to take into account the reduced probability of the simultaneous occurrence of the most unfavorable values of two (or more) independent transient actions [39]. The frequent value, expressed as a product ψ1Qk, is used for checking the ultimate limit states which include accidental actions and for checking the reversible serviceability limit states. If possible, the frequent value of transient action is statistically determined in such a way that the period of its exceedance is a small part of the reference period, or the frequency of exceedance during the reference period is limited to a specified value. For buildings, the period during which the frequent value is exceeded is 0.01 of the reference period [35]. The quasi-constant value, expressed as a product ψ2Qk, is used for checking ultimate limit states including accidental actions and irreversible serviceability limit states for long-term effects. The quasi-constant value of transient action is assumed in such a way that its exceedance period is a significant part of the reference period. The values of reducing coefficients ψ1, ψ2 for buildings are given in Table A.1.1 of the standard [35].
Characteristic values of actions (Fk) and their representative values (Frep) are, according to the recommendations of the standard [35], used to define the design values of actions and combinations of actions in order to verify ultimate limit states (ULS) and serviceability limit states (SLS). The design value of an action [35,39] can be expressed in a general form as in the following equations:
where:
- Fk is the characteristic value for action,
- Frep is the appropriate representative value for action,
- γf is the partial factor for action, including the possibility of unfavorable deviations from representative values, and
- Ψ is the reducing coefficient.
The concept of the effect of actions E in Equation (1) is generally understood as a static response (i.e., internal forces, moments, or stresses) or kinematic response (i.e., deflections, linear, or angular displacements) of a structural element or the entire structure [35,39]. Design with the partial factor method is used to define the design values of actions and combinations of actions to verify ultimate limit states. These factors are divided into two groups:
- −
- factors γf including the uncertainty of the represented values of actions (γf) and the uncertainty of the model of actions and their effects (γSd),
- −
- factors γM including the uncertainty of the ULS model (γRd) and the uncertainty of material properties (γm).
The values of partial factors are related to the type of action. For example, the partial factor for persistent action is 1.35, whereas for wind, snow, and ice loads it is 1.5. The importance of partial factors in design is significant, for example, considering that wind action increases its design value by 50% compared to the characteristic value. They protect structures against a deviation from the standard value adopted for design [35].
The standard [37] defines two basic structural design strategies: the first is based on identified accidental actions and the second on limiting the extent of localized failures (Figure 4) [36,37,40].
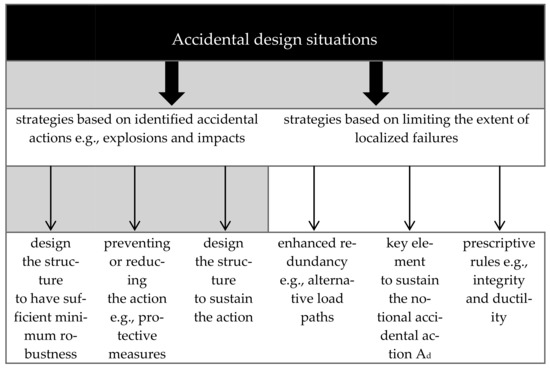
Figure 4.
Strategies for ensuring the safety of buildings and construction works.
It is practically impossible to design, construct, and use buildings with zero risk. Figure 4 shows activities that need to be undertaken in order to mitigate the risk of accidental actions. The strategies presented in Figure 1 are based on the consequence classes of buildings damage that differentiate their functional robustness. Consequence classes are defined as follows:
- −
- Consequence class CC1—low consequences of failure (low risk to human life, minor social, economic, and environmental consequences), no specific consideration of accidental actions;
- −
- Consequence class CC2—medium consequences of failure (medium risk to human life, major social, economic, and environmental consequences), design is dependent on the specific circumstances of the structure in question: a simplified analysis is performed through the use of static equivalent load models for identified accidental loads and/or prescriptive design/detailing rules are applied;
- −
- Consequence class CC3—high consequences of failure (high risk to human life, significant social, economic, and environmental consequences), design considering accidental actions, previously preceded by determining the level of reliability and detailed design requirements as well as risk analysis [35,37].
A very important issue described in the literature on this subject is the skilful use of technologies dedicated to testing damage to buildings. They can be divided into destructive, semi-destructive, and non-destructive. The semi-destructive tests include pull-out, pull-off, and break-out methods, and typically destructive tests include cutting samples from the structure of a building which are then examined in s laboratory. Recently, non-destructive testing methods for construction works have been developing very rapidly. These are: radiological, ultrasonic, sclerometric, optical, acoustic, electromagnetic, laser, and thermographic methods. Their application during building audits can increase the level of safety in the use of facilities, and thus prevent progressive construction disasters caused by slow degradation [41,42]. At the stage of use of buildings, their monitoring is important, including the ongoing control of the technical condition, wear of construction materials, and assessment of the actual limit-state ratio during the occurrence of actions. Monitoring can use fiber optic sensors, technology based on GPS receivers, and laser scanners. Fiber optic sensors are used to monitor bridges, tunnels, dams, tall buildings, tracks, roof trusses, oil rigs, harbor wharfs, historical buildings, pipelines, and other structures. They are also used, inter alia, to measure the deformations of structures, in particular the opening of scratches and cracks, subsidence, deflections, vibrations, temperature, compression ratios, inclination of walls and pillars, concrete shrinkage, and the cooperation of old and new concrete [43]. GPS stations and laser scanners allow for the remote measurement of displacements at selected points in a structure in three dimensions. They can work independently of each other or act together as a single monitoring system. These systems have a measurement accuracy down to the millimeter and are particularly suitable for monitoring large geotechnical facilities such as dams, breakwaters, landslide areas, as well as deflections of roof trusses and subsidence of buildings [44,45,46].
3. Results
3.1. Construction Disasters in Poland between 1995–2018
The General Office of Building Control, acting in accordance with [33], maintains a register of construction disasters. In Poland, between 1995 and 2019, i.e., within 25 years, there were 8169 construction disasters [47]. Figure 5 shows the number of construction disasters between 1995–2019. Most of them happened in 2008, with as many as 1113.
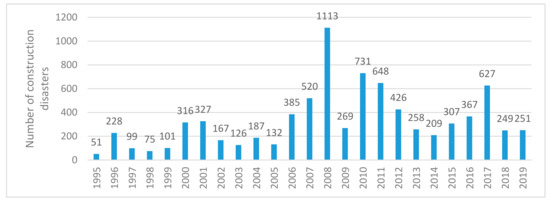
Figure 5.
Number of construction disasters in Poland in 1995–2019 [47].
Figure 6 shows the number of construction disasters in Poland with regard to voivodeships (the highest-level administrative division of Poland, corresponding to a “province” in many other countries). The voivodeship in which the largest number of construction disasters occurred is the Łódź voivodeship. It is worth noting that, according to data from the Central Statistical Office of Poland, the Łódź voivodeship is the area with the lowest forest cover in Poland with 21.5% in 2017. The Mazovian voivodeship is second in terms of the lowest forest cover with 23.3%, and it is also second in terms of the number of construction disasters. Undoubtedly, the low forest cover of the terrain intensifies the action of severe wind gusts. The Silesian voivodeship is third in terms of the number of disasters, in this case the result may be affected by the strong urbanization of the area and the activity of the mining industry.
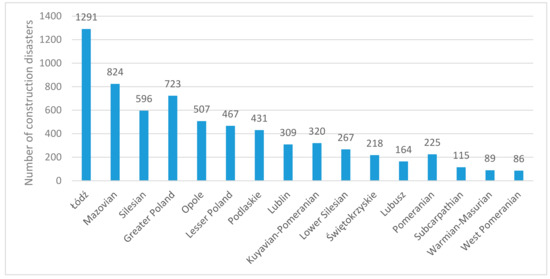
Figure 6.
Number of construction disasters in Poland in 2004–2019 by voivodeship [47].
By analyzing the data obtained from [47], it can be concluded that the constructions most frequently subject to disasters were low, small-cubature residential, farm, and livestock buildings of masonry construction. They constituted 83.8% of all construction disasters that occurred in Poland between 1995 and 2019. Figure 7 shows the types of buildings that were destroyed in 2004–2019.
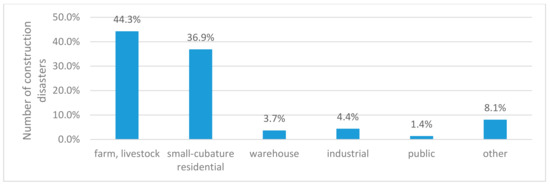
Figure 7.
Types of buildings subject to construction disasters in 2004–2019 [47]. Other structures, e.g., individual recreation buildings, collective housing buildings, bridges, viaducts, roads, embankments, dams, sluices, weirs, networks, formwork, sheet piling, and excavation casings.
Construction disasters are divided into two categories. Category I covers disasters that do not result from random events, while category II consists of disasters that result from random causes. Random events include: strong winds, flood, heavy snowfall, heavy rainfall, landslides, lightning strikes, and events related to human activities, e.g., gas explosion, fire, impact from a vehicle, or boiler explosion. Construction disasters due to random events are often a combination of several causes, such as strong gusty wind with intense rainfall and storms, or explosion along with fire. Almost half of the construction disasters were caused by strong wind, followed by fire, gas installation explosion, intense precipitation, and traffic accidents. Construction disasters that are not caused by random determinants occur due to errors made during building maintenance operations. The most common errors at this stage are poor technical condition and failure to perform periodic inspections. Errors during the construction of a new facility or when performing other construction works in an existing facility can be indicated as another cause of construction disasters that are not caused by random event. These include: breach of obligations by participants in the construction process, demolition, renovation, non-compliance with performance technology, or deviations from the design. Figure 8 shows the number of construction disasters with regard to categories [47]. Based on the data collected in Figure 8, a constant trend can be determined showing the predominance of random disasters over non-random disasters. Taking into consideration the ongoing climate changes in the world, it can be assumed that construction disasters caused by violent atmospheric phenomena will be a permanent environmental element.
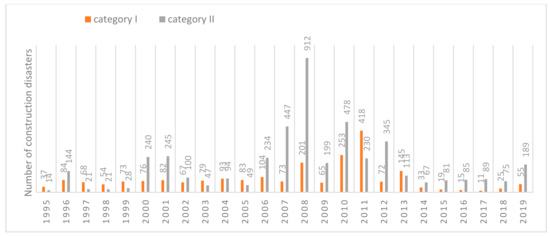
Figure 8.
Number of construction disasters by category in 1995–2019 [47].
The chart included in Figure 9 supplements data on construction disasters caused by random events. It shows the percentage of category II disasters in the total number of construction disasters in Poland between 2004–2019. It can be seen that weather conditions heavily affect the number of construction disasters. In 2008, 95.6% of the total number of disasters were caused by random events. Based on the data collected over 16 years, there is a clearly noticeable tendency which indicates that on average 70% of the analyzed construction disasters are caused by random events. Such data is valuable for designers, contractors, and users of building objects, showing how important it is to take into account accidental actions at every stage of a building’s life.
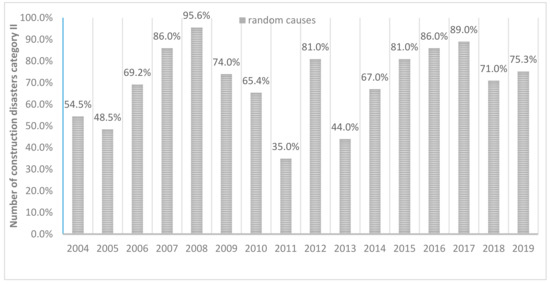
Figure 9.
Number of category II (random causes) construction disasters in 2004–2019 [47].
By analyzing more precisely the number of disasters attributed to random causes on the basis of the data in Figure 10, it can be concluded that strong winds are the factor causing the highest number of disasters. Successively, fires can be cited as a nearly frequent factor causing construction disasters. Other events provided in Figure 10, such as gas explosion or rainfall, occur in similar numbers. Figure 10 also lists some factors identified as “other”, including i.e., snowfall, flooding, mudslide, impact from a vehicle, or a lightning strike. However, these are much less common factors than the rest listed in Figure 10. The events described as “other” delimited the number of disasters, for example in 2006 when heavy snowfall was the factor causing the highest number of disasters, or in 2010 when floods and landslides were the cause of the highest number of disasters.
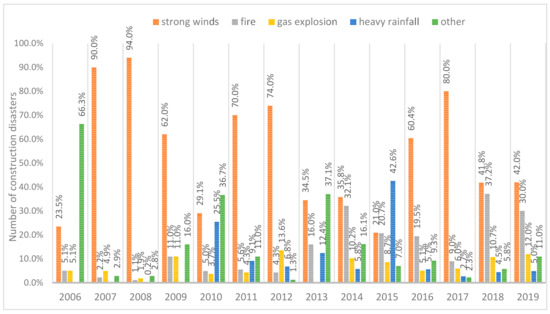
Figure 10.
Number of category II (random causes) construction disasters attributed to the most common factors in 2006–2019 [47].
The greatest number of disasters was caused by strong winds occurring in the Łódź voivodeship, then in Greater Poland, Podlaskie, and Mazovian voivodeships.
The catastrophic effects of excessive wind action are caused not only by the high speed of swirling air, but also by a very high suction force and a sharp drop in pressure inside of the vortex. These accidental actions cause total or partial destruction of buildings. The intensity of these phenomena is assessed by considering the velocity of the induced wind determined on the basis of the damage done. For this purpose, the 6-point Tetsuya Fujita scale is used. The lowest value of wind force (F0) is 64–116 km/h and the highest value (F6) is 512 km/h [47]. Referring to the data from media reports i.e., in the administrative district of Częstochowa in 2007 the wind velocity of Storm Kyrill was approximately 150 km/h, and in the administrative district of Poznań the wind velocity during Storm Friderik in 2010 reached 155 km/h, corresponding to F1 of the Fujita scale [4].
The most tragic result of construction disasters is human loss. Between 2005 and 2019, there were a total of 6492 construction disasters in which 1553 people were injured (resulting in 386 fatalities and 1167 injured). Figure 11 shows the number of people who lost their lives and those injured as a result of construction disasters in the period of 2004–2019. The most tragic year on record since the reports by the General Office of Building Control [47] began was 2006, which can be significantly contributed to the catastrophe of the exhibition hall at the International Katowice Fair which occurred on 28 January 2006 (resulting in 65 fatalities). When explaining the causes of this catastrophe, several issues were taken into account, such as: excess snow on the roof, poor use of the facility (not removing snow from the roof), design, construction and workmanship errors, and previous damage that had not been repaired. Finally, it was established that the main cause of the catastrophe was human error, i.e., a poorly executed detailed design of the building, significantly different from the actual construction design approved by the building permit. Changes were made to reduce construction costs and these included the use of: steel of a lower strength, single bolt connections, joints with incomplete penetration, and no bracing or roof braces. In addition, the facility was designed by a person who did not have the necessary levels of education and building qualifications. Static diagrams were incorrectly adopted for calculations and snow piles on the roof were not taken into account. The use of the facility was also erroneous. The hall had damage which was visible much earlier than 2006, but neither the user nor the construction supervision authority took steps to remedy this.
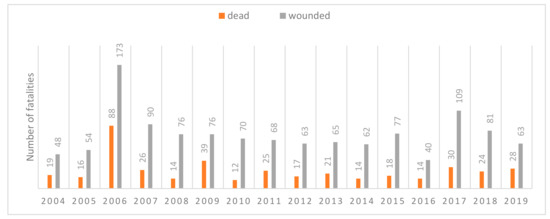
Figure 11.
Number of fatalities of construction disasters in 2004–2019 [47].
By analyzing the materials made available by the General Office of Building Control [47], it can be concluded that most (more than half) construction disasters involve masonry structures, followed by wooden, steel, and reinforced concrete buildings. Undoubtedly, this is due to the fact that masonry prevails as a construction material in Poland. The elements that are the most frequently destroyed as a result of construction disasters are walls, roofs, and ceilings. Over 90% of structures which were subject to construction disasters concerned buildings which already existed, were used or excluded from use, and in which construction works were being carried out. According to the data [47], the lifetime of a construction disaster-affected building is of great importance. For more than half of the buildings, the time of exploitation until the construction disaster occurred was between 11 and 50 years, then between 51–100 years, and finally over 100 years. The least number of disasters is recorded for buildings under 10 years of age and it is on average approximately 5% of the total. Most buildings, more than 80%, that undergo construction disasters were owned by Polish citizens. In general they were entities who had a statutory obligation [33] to notify the construction supervision authority, the police, and prosecutors about the event, secure the site and, above all, organize assistance to victims and prevent the spread of disaster effects.
3.2. Statistical Analysis of the Impact of Land Use on the Total Number of Disasters
In order to verify the assumptions on the impact of land use, population equivalents, and weather factors such as wind on the number of disasters caused by random events, a statistical analysis was carried out, the purpose of which was to show correlations between individual data sets. The following data on land use in individual voivodeships (Table 2), available on the website https://bdl.stat.gov.pl/, was selected for analysis: agricultural land—permanent meadows, forest and wooded land, lakes and rivers, industrial areas, and arable land; built-up and urbanized land—residential areas, density of population, and average wind value. Data in columns 2 to 7 of Table 2 is the quotient of the developed area (e.g., forests) to the total area of a given voivodeship. Hence, all values in these columns are dimensionless and less than one. Columns 8 and 9 have dimensional units. The values presented in Table 2 were calculated as the mean values of the multi-year period, covering the same years for which construction disasters data were compiled. The average value of the multi-year wind velocity (column 9) was calculated as the average value of the annual averages for individual voivodeships.
Table 2.
Data used for statistical analysis of the impact of land use, population equivalents, and the average wind value on the number of disasters.
The individual steps of statistical analyses are presented in Figure 12.
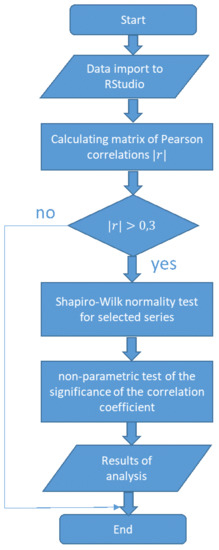
Figure 12.
Main steps of the statistical analysis.
For the analysis, well-known and reliable correlation methods, the linear Pearson method and the non-parametric Spearman method, were chosen [48]. The Shapiro–Wilk test was selected due to its use with small datasets (n < 100).
The Pearson’s correlation coefficient was used for analyses, expressed by Equation [48]:
where:
- xi,yi are the data series values,
- are the average values,
and the Spearman’s rank correlation coefficient [46]:
where:
- are the squares of the difference of ranks with corresponding values xi and yi, and
- n is the number of data pairs.
Well-known and widespread software by RStudio was used as a tool for performing the statistical calculations [49]. Using the functionality of the RStudio application, the correlation coefficients for the Pearson and Spearman methods were calculated and the Shapiro–Wilk test was performed for each series, verifying if they had a normal distribution.
The analysis of the Pearson correlation matrix presented in Table 3 shows that only five sets of data series correlate with disaster data at a moderate and strong level. The greatest correlation was obtained for forest and wooded land, where no. of disasters (). The arable land no. of disasters also had a strong correlation coefficient (). Greater correlation coefficients occurred for the series describing the opposite natures of land use: forest and wooded land, and arable land. Obviously, larger arable land means less forestation and vice versa. The correlation matrix presented in Table 3 is of course excessive. In the analyses the authors were interested in dependencies between the method of land use and the number of disasters. However, the correlation between individual methods of land use was used to verify the quality of data (strong correlation occurred for areas with an opposite spatial management method, such as forests or arable land), and it indicated the lack of correlation for compact methods of land use, such as urbanized areas.
Table 3.
Correlation matrix—the Pearson’s method.
For the data series with Pearson correlation coefficients greater than 0.3, the Shapiro–Wilk test was carried out and the Spearman rank correlation coefficients were calculated.
The following series were further analyzed: forest and wooded land, lakes and rivers, arable land, residential areas, and density of population. Correlation charts of no. of disasters (the data series listed above) are presented in Figure 13.
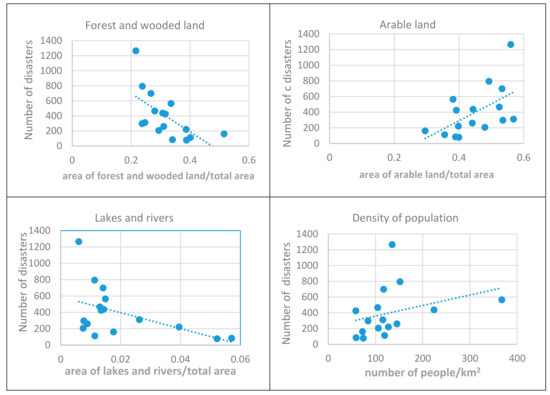
Figure 13.
Correlation between the data series with the highest value of the Pearson correlation coefficient.
The Shapiro–Wilk normality [48] test was carried out in order to check whether all of the selected series met the criterion of a normal distribution. The calculation results are presented in Table 4. It appeared that in the number of disasters series there was an outlier (the number of disasters for the Łódź voivodeship), thus the criterion of a normal distribution was not met. When this value was omitted from the data series, the series satisfied the requirements of a normal distribution. Therefore, it was assumed that the series could have a normal distribution and could be used for further analysis based on the correlation coefficients. Three series: lakes and rivers, residential areas, and density of population had very low Shapiro–Wilk test values and were excluded from further direct correlation analyses.
Table 4.
Shapiro–Wilk test results for selected data series.
According to the commonly used methodology, the null hypothesis H0 was assumed for the Shapiro–Wilk test: the series had a normal distribution. It was assumed that this hypothesis could be rejected if the value of p < 0.05 and the value of the W statistic was not in the range of 0.877 to 1.00 [48].
Therefore, the analyses showed that only two series: forest and wooded land and arable land were normally distributed and could be used in reliable correlation analyses with the series of number of disasters. For these pairs of series, a non-parametric test of significance of the correlation coefficient was performed for the alternative hypothesis for both the Pearson and Spearman coefficients. RStudio cor.test allows us to test for association between the paired samples, using one of Pearson’s product moment correlation coefficients, Kendall’s tau or Spearman’s rho. The p-value and t statistics are also calculated by cor.test. By using the functionality of cor.test by RStudio, the values summarized in Table 5 were obtained.
Table 5.
Results of the non-parametric test of the correlation coefficient significance.
It is necessary to perform a significance test to decide whether there is any or no evidence to suggest that linear correlation is present in the population. To do this we test the null hypothesis, H0—no correlation in the population against the alternative hypothesis, H1—there is a correlation. Calculating the statistics will indicate which of these opposing hypotheses is most likely to be true.
When ρ is the Pearson or Spearman’s population correlation coefficient then we can thus express this test as [48]:
i.e., the null hypothesis of no correlation present in the population against the alternative that there is correlation present.
H0: ρ = 0
H1: ρ ≠ 0
Two statistics can be used to check above hypothesis:
- Where the p-value is less than 0.05 we can say that there is a very strong evidence to believe H1,
- t statistic defined by formula [48]:
The value of the t statistic must fall within the critical region defined as: to confirm the alternative hypothesis H1. Assuming the significance level α = 0.05 and the number of degrees of freedom equal to n−2, where n is the number of elements, which for the analyzed set is 16. The value of tcr can be determined by using the Student t-distribution. The tcr value is equal to 2145. Hence, the critical area is . If the value of t belongs to the critical area, it confirms the hypothesis H1.
For both methods, a better correlation is shown by the pair: forest and wooded land/number of disasters. Negative values of the correlation coefficients mean that decreasing the value of forest and wooded land will increase the number of catastrophes. While increasing the value of arable land will lead to an increase in the number of disasters.
One more statistical study was carried out which consisted of summarizing all values from the series that had a positive impact on reducing the number of disasters (called: green data) i.e., forest and wooded land, lakes and rivers, and permanent meadows. It was assumed that these land-use factors constitute a buffer which protects a given area against the impact of extreme phenomena that could cause catastrophes. The data is presented in Table 5.
4. Discussion
Construction disasters are largely caused by accidental actions. Random causes are here a major contributor. Today, in the face of advancing climate change, violent weather phenomena can occur more and more often. According to the estimates of climatologists, there is a close relationship between the random events causing accidental actions and subsequent construction disasters, and global warming, and it is necessary to be prepared for an increase in the number of extreme weather phenomena. Hence, prolonged periods of drought can be expected, followed by violent downpours and floods. In summer this means extreme heat and in winter severe frost. Poland may also experience whirlwinds of F3–F4 strength on the Fujita scale (up to 417 km/h) [47]. Although it is not possible to construct structures resistant to all excessive loads, it is necessary to conduct permanent analyses in order to better understand the causes of construction disasters and to adapt standard construction values. The design of structural and building elements which are exposed to wind action is based on the standard [50], which provides a map of Poland with wind-load zone divisions (point NA.5). About 80% of Poland’s territory is classified as zone 1. According to the data from Table NA.1 of [50], the value of the base wind velocity in zone 1, for an area with a maximum height of 300 m above sea level, is νb,0 = 22 m/s which corresponds to a wind velocity of 79.2 km/h. Therefore, it would be advisable to consider an increase in the base wind velocity value to the nomenclature of standards.
The year of 2006 was the most tragic in terms of human loss, when the roof of one of the buildings at the Katowice International Fair collapsed due to excessive snow load, killing 65 people. After the disaster, the standard values of ground snow load and load coefficients were changed. It is crucial to find the causes of construction disasters in order to draw conclusions and perhaps prevent future events attributable to the same cause. The ultimate solution would be to develop a safety management system for buildings that could limit the size of a construction disaster if it happens. This definitely calls for the cooperation of all the participants of the investment process. It would be useful to create one coherent database for gathering information on disasters and consequential damages [51,52]. This is particularly important for buildings whose destruction causes huge losses both human and economic, e.g., dams, bridges, and skyscrapers. The design of structures is a difficult, responsible task that requires knowledge, experience, and engineering intuition. Numerous construction disasters, particularly of small, farm, and residential buildings are caused by a lack of knowledge of the owners or investors, or simply by a lack of imagination and human thoughtlessness. These disasters could be avoided. Nevertheless, the issue of accidental actions remains a challenging task. There is no way to secure a building against an explosion, flood, or terrorist attack. It is essential to constantly improve the design process and analyze how structures might be affected by accidental actions. The accuracy of calculation methods and the ability to model e.g., in BIM technology, can improve the efficiency of the entire investment process. Forecasting a construction disaster is practically impossible if there are no visible signs of damage to the facility or it is caused by rapid atmospheric phenomena. There have been actions taken to develop a model for the stochastic forecasting of this dynamic process, e.g., the Gray-Markov model [53]. The theory consists of analyzing and following the chain of events that lead to a disaster. It also allows for the forecasting of the number of fatalities [54]. Risk-taking methods and models in land planning are also being developed [54,55,56]. Authors of [57] provide a method for analyzing the French law on natural hazards and environmental protection for land planning. An analytical model for identifying and linking risk management tools was presented and then applied in three French territories. It is necessary to analyze the construction stage and study the phenomenon of accidents at work in order to avoid disasters during the implementation of construction works. Here, the European Statistical Office of the European Union provides methodology, where the basic element is a computer database containing information on the circumstances and causes of accidents [58]. The analyses allow for providing the most probable scenarios of the occurrence of accidents and failures. This develops knowledge that helps to determine what technologies, types of work carried out, or equipment used is the greatest threat during the construction of a facility [59] and its later use.
Modern methods of monitoring structures allow for the assessment of changes in deflections and displacements not only in the event of an existing hazard, but primarily at the stage of construction, extension, or strengthening of a facility. They serve as quality control tools for buildings and as tools for identifying emerging construction hazards. It is possible to monitor the cooperation of old and new concrete, temperature distribution, shrinkage and setting time, deflections of bridge spans and roof trusses due to degradation and operational loads, opening of cracks, and inclination of structural elements. Monitoring can also include the control of stress on bridge girders, track deflections during train braking, tightness of pipelines and hydrogen tanks, vibrations of high-speed rail tracks, deformations of tanker hulls, and many other measurements. Tested in laboratories and verified in practical applications, various types of fiber-optic sensors are used as tools to support the work of experts, building inspectors, and facility administrators, delivering current measurement results via the internet directly to computers for further analysis [60].
Employees at construction works should know how to proceed during a construction disaster, protecting their lives and health, while users of buildings should know where to evacuate in the event of a disaster. This is particularly important if a natural disaster occurs. Residents should be trained in the method and procedure of evacuation [61].
Analyses of construction disasters carried out by the Polish General Office of Building Control [47] provide a lot of valuable information and encourage designers, contractors, and users to properly fulfil the legal obligations imposed by [33]. Construction safety is one of the main requirements that must be met by building structures add this is additionally included in the Act [33].
It is necessary to constantly improve the design process and analyze how the structure will act during the occurrence of accidental actions. The accuracy of the calculation methods and the ability to model structures e.g., in BIM technology, can improve the efficiency of the investment process.
The conducted analysis showed that the method of land use may have an impact on the number of disasters in a given area. The voivodeships with large areas covered by forests, vegetation, and water bodies advance in compliance with sustainable development principles and benefit from a specific “green buffer” protecting them against extreme weather phenomena [19]. As can be seen, there is no effect on the number of disasters of parameters such as population density, wind strength, or the size of urbanized or industrialized areas. It may seem that they should have an obvious affect the possibility of a disaster. The lack of their statistically considerable effect may indicate a significant impact of factors related to buildings themselves, such as their technical condition, type of structure, operating conditions, or location. It is also worth paying attention to the case of the Łódź voivodeship, which significantly exceeds other regions in terms of the number of disasters. It has the smallest percentage of forested areas, and the levels of urbanization and industrialization are lower than in four of the other voivodeships. However, the location of this voivodeship seems to be an important factor here—it is situated in central Poland and connects foothill and lowland areas. The topography has helped the formation of a storm belt with strong rainstorms and winds every year. These storms are short and localized, hence they are not reflected by standard meteorological measurements, which in turn hinders statistical analysis. Further analysis should also take into account the physiographic characteristics of the area.
5. Conclusions
Based on the analyzed data on construction disasters covering the period 1995–2019, it can be stated that:
- −
- the trend in the number of disasters is imperceptible. The number of construction disasters is greater than at the beginning of the data collection, nevertheless this may be due to a more efficient architectural and construction administration than the actual number of disasters (Figure 5),
- −
- the relationship between the location of a voivodeship in Poland and the number of construction disasters is imperceptible (Figure 6),
- −
- small-cubature residential, farm, and livestock buildings of masonry construction are the buildings most frequently subject to construction disasters (Figure 7),
- −
- a steady upward trend showing the predominance of construction disasters caused by random events over non-random events is noticeable (Figure 8),
- −
- on average, 70% of the analyzed construction disasters are caused by random events (Figure 9),
- −
- strong winds are the cause of the greatest number of construction disasters (more than 50%). In turn, fires can be listed as the second factor causing construction disasters. Other events such as a gas explosion or rainfall occur in similar numbers (Figure 10),
- −
- a steady upward trend in the number of people injured in construction disasters is noticeable,
- −
- half of the construction disasters concern masonry structures, followed by wooden, steel, and reinforced concrete buildings,
- −
- over 90% of the structures which were subject to construction disasters were objects which already existed, were used or excluded from use, and in which construction works were carried out,
- −
- for more than half of the buildings, the service life until the occurrence of a construction disaster ranged from 11 to 50 years, then from 51–100 years to over 100 years. The least number of construction disasters is recorded for buildings under 10 years old which on average made up approximately 5% of the total,
- −
- most of the buildings, more than 80%, that underwent construction disasters belonged to Polish citizens.
Based on the conducted analyses, it can be concluded that omitting the consideration of the impacts of accidental actions during design, construction, and use of a building may be significant in the event of construction disasters. It is recommended that analysis is carried out regarding the possibility of the occurrence of accidental actions in a given area and that this is considered during the design process. The dimensioning of structures with the limit state method including partial factors does not safeguard them against accidental actions.
The statistical analyses performed also showed a relationship between the method of land use and the total number of disasters. It has been confirmed that forested areas and grasslands (green data) can act as a buffer for extreme weather events, reducing the probability of the occurrence of construction disasters. The calculated Pearson and Spearman correlation coefficients reach values which indicate a strong correlation between the size of “green data” and the total number of disasters. Additionally, in the case of construction disasters, the observance of the principle of sustainable development may reduce their number.
Author Contributions
Conceptualization, A.S.-G.; methodology, A.S.-G.; software, I.L.; validation, I.L.; formal analysis, A.S.-G., I.L.; investigation, I.L.; resources, M.R.; writing—original draft preparation, A.S.-G.; writing—review and editing, A.S.-G.; visualization, I.L.; supervision, A.S.-G.; project administration, B.K. and M.R.; funding acquisition, A.S.-G. All authors have read and agreed to the published version of the manuscript.
Funding
The funders had no role in the design of the study; in the collection, analyses, or interpretation of data; in the writing of the manuscript, or in the decision to publish the results.
Institutional Review Board Statement
Not applicable.
Informed Consent Statement
Not applicable.
Acknowledgments
The publication was financed within the framework of Ministry of Science and Higher Education programme as ‘‘Regional Initiative Excellence” in years 2019–2022, Project No. 005/RID/2018/19.
Conflicts of Interest
The authors declare no conflict of interest.
References
- Hov, O.; Cubasch, U.; Fischer, E.; Höppe, P.; Iversen, T.; Kvamstø, N.G.; Kundzewicz, Z.W.; Rezacova, D.; Rios, D.; Santos, F.D. Trends in Extreme Weather Events in Europe; EASAC Policy Report 22; European Academies’ Science Advisory Council: Halle, Germany, 2013. [Google Scholar]
- Kron, W.; Löw, P.; Kundzewicz, Z. Changes in risk of extreme weather events in Europe. Environ. Sci. Policy 2019, 100, 74–83. [Google Scholar] [CrossRef]
- Żurański, J.A.; Gaczek, M.; Fiszer, S. Damaging Winds Action on Buildings in Poland. In Proceedings of the XXIV Scientific and Technical Conference “Awarie Budowlane”, Szczecin-Międzyzdroje, Poland, 26–29 May 2009. [Google Scholar]
- Ksit, B.; Szymczak-Graczyk, A. Rare weather phenomena and the work of large-format roof coverings. CEER 2019, 30, 123–133. [Google Scholar] [CrossRef]
- Yang, Q.; Gao, R.; Bai, F.; Li, T.; Tamura, Y. Damage to buildings and structures due to recent devastating wind hazards in East Asia. Nat. Hazards 2018, 92, 1321–1353. [Google Scholar] [CrossRef]
- Żurański, J.A. Failures of roofs under Snow loads in Poland. In Proceedings of the XXIII Scientific and Technical Conference “Awarie Budowlane”, Szczecin-Międzyzdroje, Poland, 23–26 May 2007. [Google Scholar]
- Szymczak-Graczyk, A. Icing effect on steel bar structures. Annu. Set Environ. Prot. 2018, 20, 934–947. [Google Scholar]
- Lucchi, E.; Pereira, L.D.; Andreotti, M.; Malaguti, R.; Cennamo, D.; Calzolari, M.; Frighi, V. Development of a Compatible, Low Cost and High Accurate Conservation Remote Sensing Technology for the Hygrothermal Assessment of Historic Walls. Electronics 2019, 8, 643. [Google Scholar] [CrossRef]
- Bathrellos, G.D.; Skilodimou, H.D.; Soukis, K.; Koskeridou, E. Temporal and Spatial Analysis of Flood Occurrences in the Drainage Basin of Pinios River (Thessaly, Central Greece). Land 2018, 7, 106. [Google Scholar] [CrossRef]
- Laks, I.; Kałuża, T.; Sojka, M.; Walczak, Z.; Wróżyński, R. Problems with modelling water distribution in open channels with hydraulic engineering structures. Annu. Set Environ. Prot. 2013, 15, 245–257. [Google Scholar]
- Laks, I.; Walczak, Z. Modelling of the impact of the retention reservoir on the flood protection of the city–A case study for the city of Kalisz (Central Poland). IOP Conf. Ser. Mater. Sci. Eng. 2019, 603, 022066. [Google Scholar] [CrossRef]
- Laks, I.; Walczak, Z.; Szymczak-Graczyk, A.; Ksit, B.; Mądrawski, J. Hydraulic and legal conditions for buildings in floodplains—A case study for the city of Kalisz (Poland). IOP Conf. Ser. Mater. Sci. Eng. 2019, 471, 102050. [Google Scholar] [CrossRef]
- Garcia-Ayllon, S. Long-Term GIS Analysis of Seaside Impacts Associated to Infrastructures and Urbanization and Spatial Correlation with Coastal Vulnerability in a Mediterranean Area. Water 2018, 10, 1642. [Google Scholar] [CrossRef]
- Laks, I.; Kałuża, T.; Zawadzki, P. Impact of a weir damage located on a polder on flood wave transformation. A case study of the Golina polder/Poland. WasserWirtschaft 2018, 5, 21–26. [Google Scholar] [CrossRef]
- Walczak, Z.; Sojka, M.; Wróżyński, R.; Laks, I. Estimation of polder retention capacity based on ASTER, SRTM and LIDAR DEMs: The case of Majdany Polder (West Poland). Water 2016, 8, 230. [Google Scholar] [CrossRef]
- Rijal, S.; Rimal, B.; Sloan, S. Flood Hazard Mapping of a Rapidly Urbanizing City in the Foothills (Birendranagar, Surkhet) of Nepal. Land 2018, 7, 60. [Google Scholar] [CrossRef]
- Chyży, T.; Łapko, A.; Prusiel, J.A. Assessment of dust explosions effects in agriculture silos in the light of theory and structural codes. In Proceedings of the 8th International Conference for Conveying and Handling of Particulate Solids: CHoPS 2015, Tel-Aviv, Israel, 3–7 May 2015. [Google Scholar]
- Szymczak-Graczyk, A. Floating platforms made of monolithic closed rectangular tanks. Bull. Pol. Acad. Sci. Tech. Sci. 2018, 66, 209–219. [Google Scholar]
- Buczkowski, W.; Szymczak-Graczyk, A.; Walczak, Z. Experimental validation of numerical static calculations for a monolithic rectangular tank with walls of trapezoidal cross-section. Bull. Pol. Acad. Sci. Tech. Sci. 2017, 65, 799–804. [Google Scholar] [CrossRef]
- Prusiel, J.A.; Gierej, K. Stress states caused in chamber of reinforced concrete grain silo by non-centric emptying on large eccentricities. Stud. Geotech. Mech. 2018, 40, 282–291. [Google Scholar] [CrossRef]
- Łapko, A.; Prusiel, J.A. Numerical and experimental analysis of temperature effects on reinforced concrete cylindrical silo bins. Arch. Civ. Eng. 1998, XLIV, 121–148. [Google Scholar]
- Łapko, A.; Prusiel, J.A. Computational control of cracking state in reinforced concrete silo walls. In Proceedings of the 8th International Conference for Conveying and Handling of Particulate Solids: CHoPS 2015, Tel-Aviv, Israel, 3–7 May 2015. [Google Scholar]
- Szymczak-Graczyk, A.; Ksit, B.; Laks, I. Operational problems in structural nodes of reinforced concrete constructions. IOP Conf. Ser. Mater. Sci. Eng. 2019, 603, 032096. [Google Scholar] [CrossRef]
- Korentz, J.; Nowogońska, B. Assessment of the life cycle of masonry walls in residential buildings. In Proceedings of the Environmental Challenges in Civil Engineering (ECCE), Opole, Poland, 23–25 April 2018; Volume 174, pp. 1–7. [Google Scholar]
- Szymczak-Graczyk, A. Numerical analysis of the impact of thermal spray insulation solutions on floor loading. Appl. Sci. 2020, 10, 1016. [Google Scholar] [CrossRef]
- Szymczak-Graczyk, A. Rectangular plates of a trapezoidal cross-section subjected to thermal load. IOP Conf. Ser. Mater. Sci. Eng. 2019, 603, 032095. [Google Scholar] [CrossRef]
- Monczyński, B.; Ksit, B.; Szymczak-Graczyk, A. Assessment of the effectiveness of secondary horizontal insulation against rising damp performed by chemical injection. IOP Conf. Ser. Mater. Sci. Eng. 2019, 471, 052063. [Google Scholar] [CrossRef]
- Runkiewicz, L. Analysis of threats, failures and catastrophes of reinforced concrete tanks and silos. Przegląd Bud. 2012, 4, 19–75. [Google Scholar]
- Runkiewicz, L. Impact of corrosion on hazards and failure rate of buildings. Przegląd Bud. 2016, 12, 32–37. [Google Scholar]
- Szer, J. Katastrofy Budowlane; Wydawnictwo Naukowe PWN SA: Warszawa, Poland, 2018. [Google Scholar]
- Hoła, B.; Szóstak, M.P. Analysis of the state of the accident rate in the construction industry in European Union countries. Arch. Civ. Eng. 2015, 61, 19–34. [Google Scholar] [CrossRef]
- Chi, S.; Han, S. Analyses of systems theory for construction accident prevention with specific reference to OSHA accident reports. Int. J. Constr. Proj. Manag. 2013, 31, 1027–1041. [Google Scholar] [CrossRef]
- Construction Law-the Act of 7 July 1994 (as Amended). Available online: https://isap.sejm.gov.pl/isap.nsf/DocDetails.xsp?id=WDU19940890414 (accessed on 5 January 2021).
- Lewicki, B. Accidental Actions as a Cause of Construction Failures in Standard Terms. In Proceedings of the XIX Scientific and Technical Conference “Awarie Budowlane”, Szczecin-Międzyzdroje, Poland, 26–29 May 1994. [Google Scholar]
- PN-EN 1990:2004 Eurocode. In Basic of Structural Design; European Standard; The European Union: Brussels, Belgium, 2004.
- Rawska-Skotniczny, A. Loads on Buildings and Construction Works According to Eurocodes; Wydawnictwo Naukowe PWN SA: Warszawa, Poland, 2020. [Google Scholar]
- PN-EN 1991-1-7:2008 Eurocode 1. In Actions on Structures; Part 1–7: General Actions; Accidental Actions; European Standard; The European Union: Brussels, Belgium, 2008.
- Baucart, E.; de Chefdebien, A. Disscusion on the Rules for Combination of Actions in EN 1990 “Basis of Structural Design”; CERIB: Épernon, France, 2004. [Google Scholar]
- Tylek, I. Models of actions in limit states of building structures according to PN-EN 1990. Tech. Trans. 2012, 20, 195–215. [Google Scholar]
- Brygier, M. Accidental Actions in the Context of Building Disasters. (Engineering Dissertation); University of Life Sciences in Poznań: Poznań, Poland, 2017. [Google Scholar]
- Lucchi, E. Non-invasive method for investigating energy and environmental performances in existing buildings. In Proceedings of the 27th International Conference on Passive and Low Energy Architecture, Louvain-la-Neuve, Belgium, 13–15 July 2011; pp. 571–576. [Google Scholar]
- Lucchi, E. Application of the infrared thermography in the energy audit of buildings: A review. Renew. Sustain. Energy Rev. 2018, 82, 3077–3090. [Google Scholar] [CrossRef]
- Glisic, B.; Inaudi, D. Structural Monitoring of Concrete Bridges during Whole Lifespan. In Proceedings of the 82nd Annual Meeting of the Transportation Research Board (TRB), Washington, DC, USA, 12–16 January 2003. [Google Scholar]
- Manetti, L.; Inaudi, D.; Glisic, B. 3-Demon Monitoring Platform: Examples of Applications in Structural and Geotechnical Monitoring Projects. In Proceedings of the 13th FIG Symposium on Deformation Measurement and Analysis, LNEC, Lisbon, Portugal, 12–15 May 2008. [Google Scholar]
- Del Grosso, A.; Lanata, F.; Pieracci, A. Data Analysis and Interpretation from GPS Monitoring of Breakwater. In Proceedings of the 3rd International Conference on Structural Health Monitoring of Intelligent Infrastructure-SHMII-3, Vancouver, BC, Canada, 13–16 November 2007. On Proceedings CD. [Google Scholar]
- Manetti, L.; Steinmann, G. 3DeMoN ROBOVEC–Integration of a new measuring instrument in an existing generic remote monitoring platform. In Proceedings of the 7th International Symposium on Field Measurements in Geomechanics, Boston, MA, USA, 24–27 September 2007. [Google Scholar]
- The General Office of Building Control. Construction Disasters in 1995, 1996, 1997, 1998, 1999, 2000, 2001, 2002, 2003, 2004, 2005, 2006, 2007, 2008, 2009, 2010, 2011, 2012, 2013, 2014, 2015, 2016, 2017, 2018, 2019. Warsaw. Available online: https://www.gunb.gov.pl/strona/katastrofy-budowlane (accessed on 5 January 2021).
- Rahman, N.A. A Course in Theoretical Statistics; Charles Griffin and Company: London, UK, 1968. [Google Scholar]
- Pebesma, E. Simple Features for R: Standardized Support for Spatial Vector Data. R J. 2018, 10, 439–446. [Google Scholar] [CrossRef]
- PN-EN 1991-1-4:2008 Eurocode 1. In Loads on Structures; Part 1–4. General loads; Wind Loads; The European Union: Brussels, Belgium, 2005.
- Kia, S.; Park, N. Research on the Establishment of Contractor Centered Safety Management System to Reduce Construction Disaster. J. Society Disaster Inf. 2014, 10, 503–510. [Google Scholar]
- Hwang, H.S.; Kim, C.S. A Study on Damage Spatial Data Generation to Construct Disaster History Information. In Computer Applications for Software Engineering, Disaster Recovery, and Business Continuity; Communications in Computer and Information Science; Springer: Berlin/Heidelberg, Germany, 2012; Volume 340, pp. 233–238. [Google Scholar]
- Sun, L.; Liu, G. Apply Gray-Markov Model to predict construction disaster death toll. In Proceedings of the 2011 2nd International Conference on Artificial Intelligence, Management Science and Electronic Commerce (AIMSEC), Dengleng, China, 8–10 August 2011; pp. 4969–4972. [Google Scholar]
- Seck, E.H.D.; Ortola, S.; Davenne, L. From initial localized failures to collapse of structures in a probabilistic context. Eur. J. Environ. Civ. Eng. 2018, 22, 1499–1510. [Google Scholar] [CrossRef]
- Grant, A.; Ries, R. Impact of building service life models on life cycle assessment. Build. Res. Inf. 2013, 41, 168–186. [Google Scholar] [CrossRef]
- Shi, C.; Zhang, Y.-L.; Xu, W.-Y.; Zhu, Q.-Z.; Wang, S.-N. Risk analysis of building damage induced by landslide impact disaster. Eur. J. Environ. Civ. Eng. 2013, 17, 126–143. [Google Scholar] [CrossRef]
- Vigier, E.; Curt, C.; Curt, T.; Arnaud, A.; Dubois, J. Joint analysis of environmental and risk policies: Methodology and application to the French case. Environ. Sci. Policy 2019, 101, 63–71. [Google Scholar] [CrossRef]
- Szóstak, M.P.; Hoła, B. Modelling of the accidentality phenomenon in the construction industry. Appl. Sci. 2019, 9, 1878. [Google Scholar]
- Hoła, B. Methodology of estimation of accident situation in building industry. Arch. Civ. Mech. Eng. 2009, 9, 19–46. [Google Scholar] [CrossRef]
- Skłodowski, M. Modern monitoring of building and civil engineering structures. Przegląd Bud. 2009, 3, 37–46. [Google Scholar]
- Chen, S.C.; Chen, L.K. TXT-tool 4.886-1.2: Procedures for Constructing Disaster Evacuation Maps: Guidelines and Standards. In Landslide Dynamics: ISDR-ICL Landslide Interactive Teaching Tools; Springer: Cham, Switzerland, 2018; pp. 669–673. [Google Scholar]


Publisher’s Note: MDPI stays neutral with regard to jurisdictional claims in published maps and institutional affiliations. |
© 2021 by the authors. Licensee MDPI, Basel, Switzerland. This article is an open access article distributed under the terms and conditions of the Creative Commons Attribution (CC BY) license (http://creativecommons.org/licenses/by/4.0/).