1. Introduction
One of the main engineering approaches to control environmental noise is to use sound-absorbing materials. The traditional method of environmental noise reduction is to use materials of non-renewable sources such as mineral wool, polyurethane and melamine foams, fibre glass or glass wool [
1]. Such materials often provide high sound absorption coefficients, but they are not considered environmentally friendly.
Noise control could be achieved using recycled or natural sound absorbing materials as well. Such an approach has become more interesting nowadays since the legislations in most countries are moving towards waste reduction or reusability. Such goals create motivation to look for a new environmentally friendly alternatives for noise control. Numerous studies are concerned about the acoustic properties of recycled tire rubber, wood chip, foam, plastics and natural fibres [
2,
3,
4,
5,
6,
7,
8]. The most common approach is to use natural coconut and kenaf fibres [
9,
10]. Such materials showed high potential to be used for sound absorption applications [
10,
11,
12].
Many of the materials mentioned could be made into panels for sound absorption applications. Such panels usually are 10–20 cm thick and are often used with air space behind the panel to increase the sound absorption in low and middle frequencies. Often, acoustic panel studies are concerned with microperforated and porous panels [
13,
14,
15]. Such panels could be used with sound absorbing material behind a sample as well [
16]. Such systems are often used in buildings to improve room acoustics in offices, classrooms, etc. [
17,
18].
Several studies suggest that paper pulp could be used to create sound-absorbing materials. Paper pulp was used to create a foam-like material that has similar properties to conventional foam [
19]. In the paper [
20], the air resistance and thermal conductivity of paper mill foam were tested. The results show that paper foam has the potential to be a heat-insulating and sound-absorbing material.
Sludge from paper production is a huge problem in the paper industry. More and more attention is being paid to the management of this waste, and scientists are looking for ways to use it more efficiently. As the economy grows and consumption increases, the problem of waste management is constantly emerging. The production of high-consumption paper produces a by-product of paper sludge (PS), which is currently considered waste and continues to travel to landfills or waste incineration plants. In the European Union alone, 32.5 million t 20% of paper sludge ends up in landfills.
According to Directive 2008/98/EC in the European Union, the aim is to avoid the generation of waste or to use waste that has already been generated as a resource. Attention should therefore be paid to the recycling or recovery of waste. Paper production is a complex field consisting of many multistage processes that produce a variety of products and at the same time generate significant amounts of various wastes—paper sludge and de-inking sludge [
21]. Most of the studies are looking for a way to use PS in three sectors: biogas production, biochar production and in different composites in the building sector [
22,
23,
24,
25,
26,
27,
28,
29,
30].
PS in studies for the building sector and for material engineering is usually used in composite materials. In the studies, PS is often used as an additive to create boards or panels [
31,
32]. The most popular composites with regard to PS are cemented composites. Few studies tested the cement boards with PS additive. The sound absorption coefficient of such a composite at α-octave frequencies from 125 to 500 Hz was 0.05 to 0.3, and from 500 to 2000 Hz it was from 0.3 to 0.8 [
33,
34,
35,
36]. Those studies stated that adding more PS decreases the mechanical strength of the composites.
While there are a few studies [
35,
37] concerning the mechanical and non-acoustic properties of paper sludge composite materials, the knowledge of acoustic properties is still limited. With this paper we propose acoustic composite panels which are made using PS and clay composites. The aim of this paper is to evaluate the influence of different mixing ratios of PS and clay on sound absorption properties and compare it to traditionally used acoustic panels in the construction sector. The article is organised as follows: in
Section 2 the methods and materials used in the study are presented,
Section 3 presents the main results and discussion, and in
Section 4 the conclusions are presented.
2. Materials and Methods
2.1. Paper Sludge
The paper sludge was provided by a company that recycles and produces paper products. The provided PS was the mixture of primary and secondary sludges.
Before the sample making process, the PS was dried at 60 °C in a drier. In different areas of the drier, the temperature change was ±1 °C. The PS was mixed every 72 h to ensure the effective and even drying of the PS. The total time to dry the PS was 14 days. The dried PS was then crushed with a gill crusher and eventually sorted into three grain sizes (1–2.5 mm; 2.5–5 mm; 5–10 mm).
The unsorted dried PS bulk density was 313 kg/m
3. The bulk density of sorted PS differed because smaller grain size was more compact, which resulted higher bulk density. The bulk densities of different grain sizes of PS are shown in
Table 1.
2.2. Method of Sample Preparation
To prepare the acoustic panels based on PS it was mixed with clay. Clay was used as a binder due to its well-known binding properties, and it is often used in the construction sector; for example, even nowadays clay bricks are a common building material, mainly for structural reasons.
Composites were obtained by mixing grains PS and clay. To bind the clay and PS grains, water was used. While making clay and PS composite samples, it was noticed that, depending on clay quantity in the sample, the water quantity needed to make homogenous mixture changed. The mixture of clay and PS grains was dried at 50 °C for 3 days. To test the sound absorption coefficient depending on composition, four samples were made by changing the PS amount in the composition from 50–80% in steps of 10%. While preparing samples it was noticed that higher values of PS (90%) were not appropriate, because those samples did not bind well enough and became fragile. Therefore, the acoustic properties of such samples could not be tested due to their fragility.
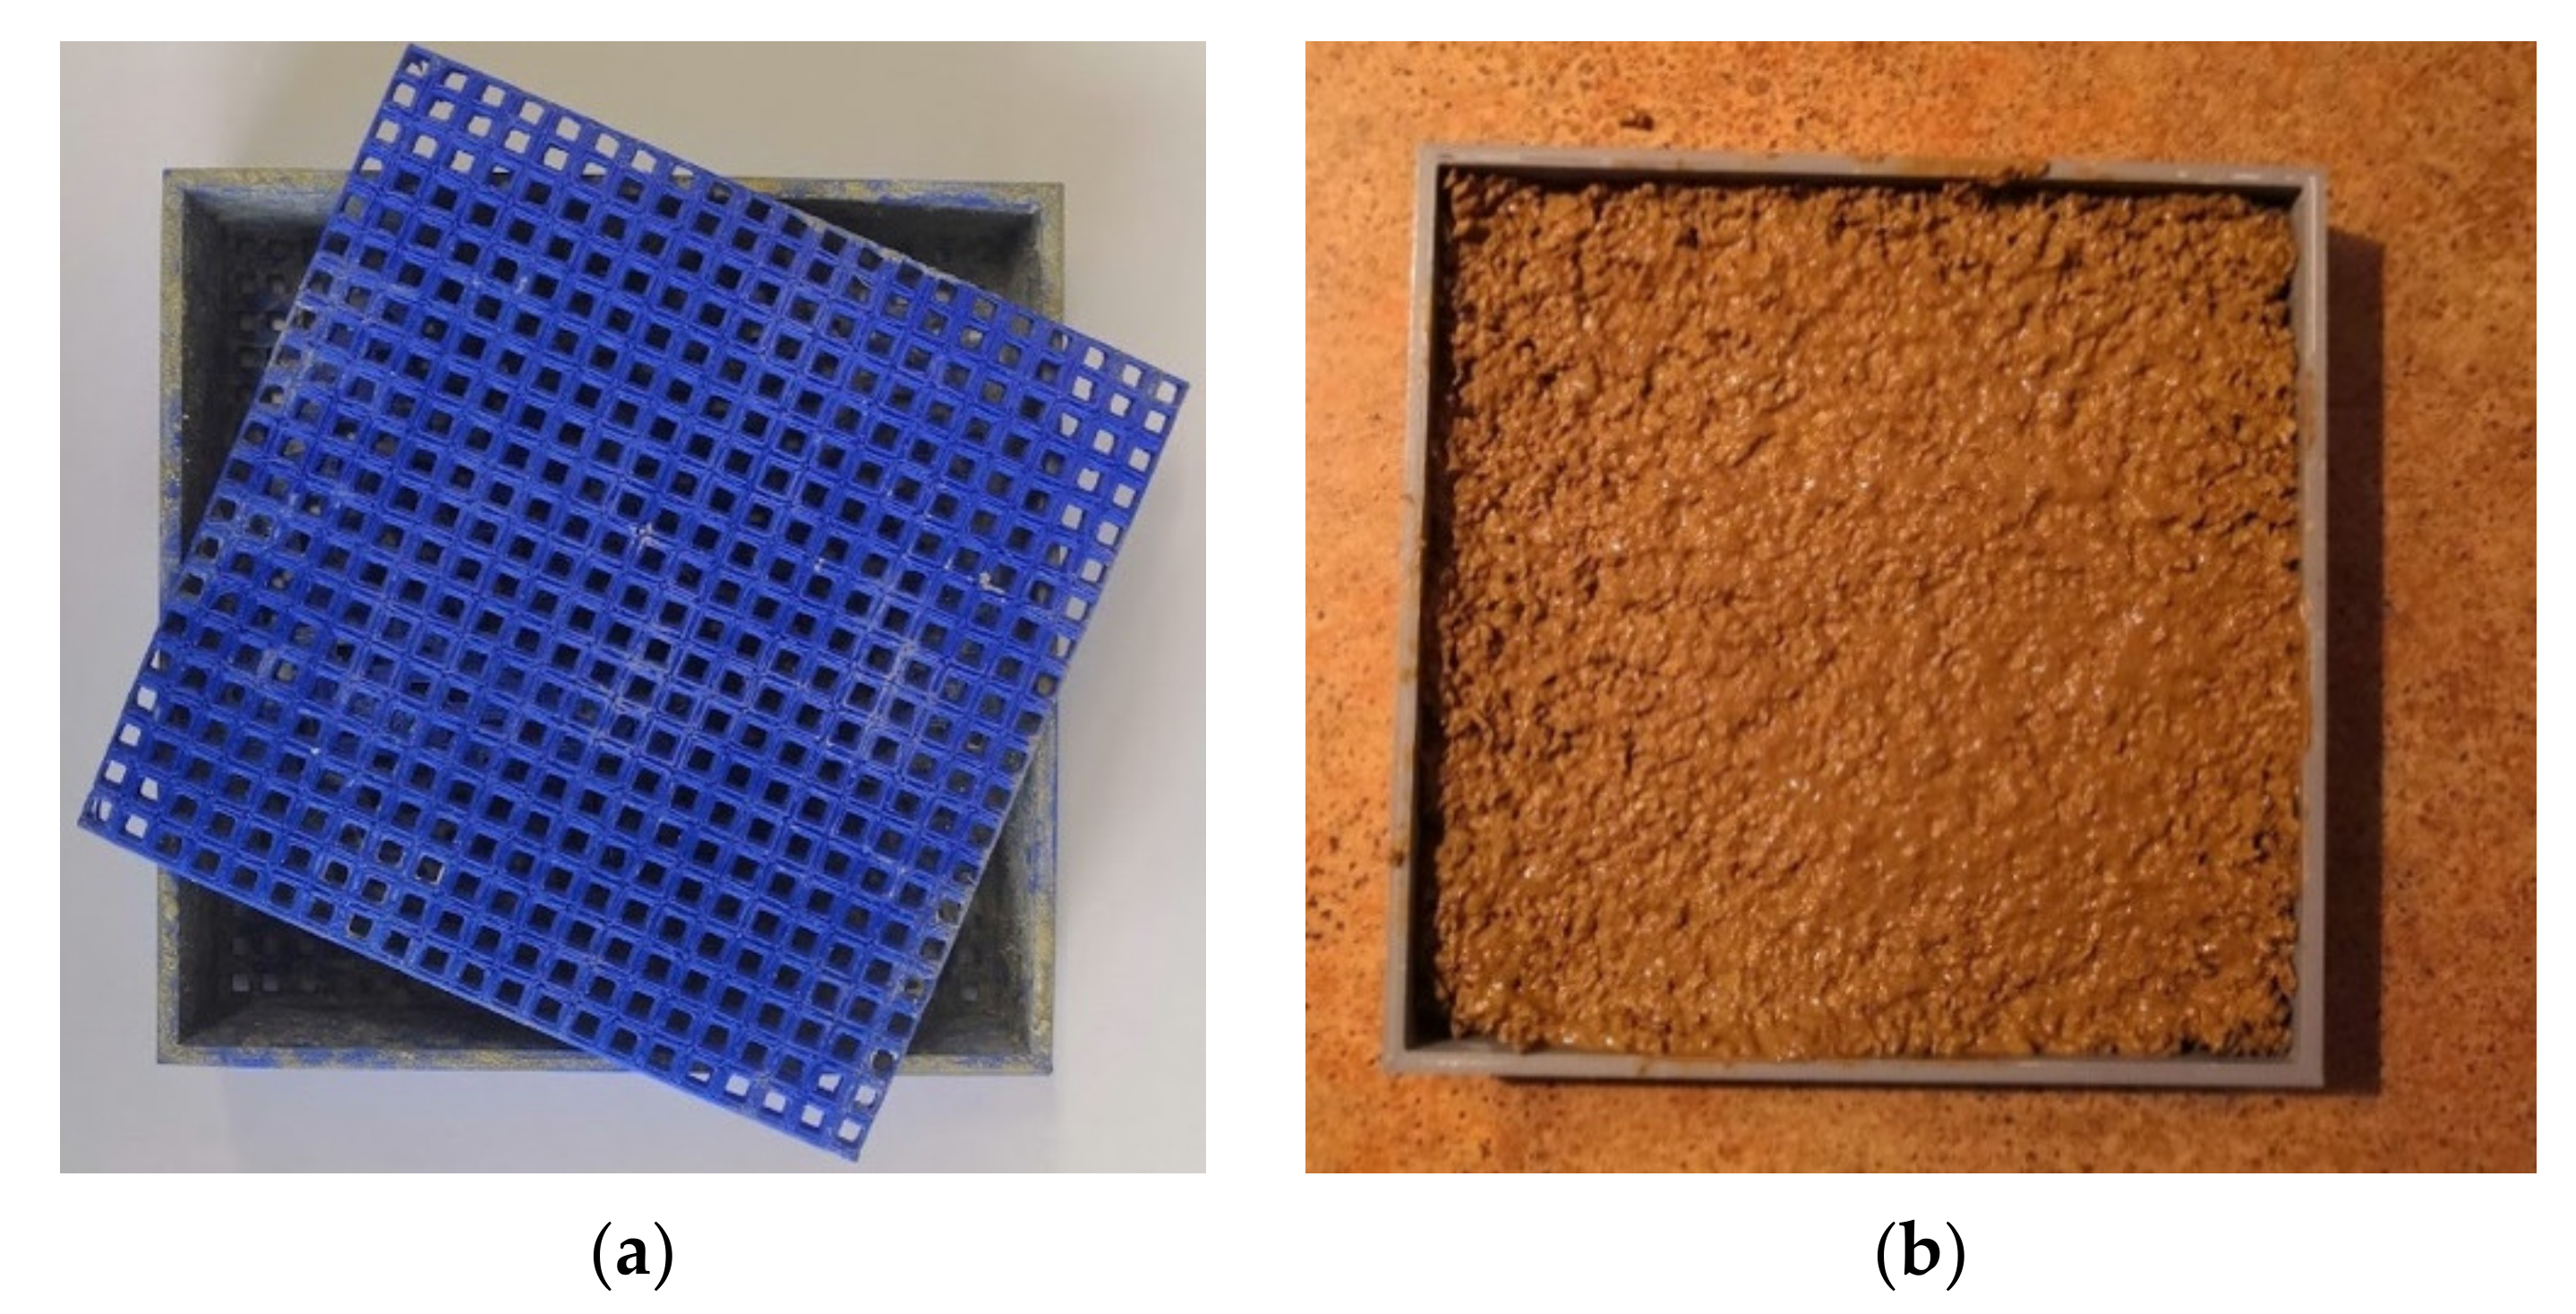
A square sample box was designed and 3D-printed using polylactic acid (see
Figure 1a). The bottom of the container was perforated with square holes of 2 × 2 mm in a square lattice of 3.5 mm. The function of the holes is to ensure the diffuseness of water drying.
A top perforated layer was also printed to close the box from the top. The samples were pressed and flipped every 2 h during the drying period; this way the samples experienced gravity from both sides, and therefore the clay did not travel to one side of the sample.
The pressure of 120 Pa was applied to the sample to ensure that the shape of the sample did not change while drying. In 3 days, a square acoustic panel of 100 cm
2 and 10 ± 4 mm thickness was obtained using this container (see
Figure 2). In total 4 containers were used for sample making.
The density of the panels varied due to content of the clay. In
Table 2, the density of different composite panels is presented.
2.3. Measurement Setup and Method
For obtaining the sound absorption coefficient (α) of the paper sludge composites, the ISO 10534-2 standard method was used [
38]. The cross section of the tube was squared with 10 cm sides. Composite panels were built to fit into the tube. The samples were rigidly backed. The experimental set up is shown in
Figure 3. The distances from the sample to the microphones were
X1 = 190 mm and
X2 = 100 mm, and the distance between microphones was
S= 90 mm. The working frequency range was from 200 to 1600 Hz. The results are presented using 1/3 octave band filtering.
The tests were made according to the methodology described in the ISO 10534-2 standard. The transfer function method was used, as well as the two-microphone technique.
The transfer function
(Equation (1)) between microphone positions was calculated as the pressure ratio between pressures measured by both microphones. The transfer function for incident wave alone
and transfer function for reflected wave alone
were calculated according to Equations (2) and (3) [
38]:
From Equations (1)–(3) the reflection coefficient of the samples could be calculated as:
where
R is the reflection coefficient of the sample,
k is the wavenumber and
is the distance between the sample and microphone 1
.
Finally, the sound absorption coefficient was calculated using the following expression:
The measurements were performed three times with 3 samples with the same composition.
Sound spectrum is typically presented in one-third octave frequency bands. This frequency representation is linked to the perception of sound by a human ear. In this paper, results are presented in 1/3 octave in order to show the reader only relevant information to emphasize application possibilities of the panels.
The 1/3 octave bands are determined by the middle frequency of the band, the lower frequency bound and the upper frequency bound. The reference middle frequency is 1000 Hz. In 1/3 octave band spectra, other middle frequencies are calculated by multiplying or dividing by 2
1/3. The lower and higher frequency bounds are calculated according to Equations (6) and (7) [
39]. The sound absorption values in each one-third octave band were averaged.
where
is the lower frequency bound,
is the middle frequency and
is the upper frequency bound.
To compare the results with conventional sound-absorbing panels, the commercially produced mineral fibre acoustic panels were also tested using the same methodology. In our developed panels, at least 50% of recycled content is used. Usually, such panels are constructed with air spacing behind the panel to ensure better sound absorption properties. To test the PS and commercially produced panels, the chosen amounts of air space behind the panels were 200 mm, 150 mm, 100 mm, 50 mm and no air space.
Due to limitations of the measurement system, a weighted sound absorption coefficient could not be obtained. To compare the different panels, the value was introduced. This value is the arithmetic average of nine one-third octave band values of frequencies from 250 to 1600 Hz.
3. Results and Discussion
In this section the experimental results are presented. Different PS panels, which were made of different grain sizes and different mixing ratios, presented various density values.
Firstly, all the PS and clay panels were tested to find the optimal ones with regard to sound absorption. All these panels we measured without air space behind the panel.
In
Figure 4, the sound absorption of different PS and clay composite panels is presented. All the panels are symmetric in vertical direction. The PS and clay composite panels of different grain size showed different behaviour (
Figure 4). The PS panels with smaller grain size showed higher sound absorption in low and mid frequencies while others showed higher sound absorption coefficient values in higher frequencies. Such a result could be justified by compactivity of the samples. Smaller grain size samples are more compact and denser, which leads to higher density values and eventually to higher sound absorption values in lower frequencies (250–800 Hz).
For further investigation, one sample of each grain size was selected and compared with commercially produced acoustic panels, which are often used as commercial sound treatment solution in rooms. This further investigation was made by introducing air space behind the sample by moving the rigid backing further from the sample. This decision was made because in most cases such panels are used with the air gap behind. Air space introduction provides better sound absorption in lower frequencies, therefore with some panels such an acoustic system could work as a resonant absorber, and in some frequency bands it is possible achieve near perfect absorption (normal incidence case only). The selected PS composite samples for comparison were the A1, B3 and C3 samples.
In
Figure 5 the sound absorption using different amounts of air space behind the samples is presented. It is shown that using samples A1 and D2, there are no visible wave interferences within the measured frequency range which results in more stable but lower sound absorption coefficient values. Such phenomena are influenced by the sample itself by absorbing waves of certain frequencies and in the result, there is no standing wave to be interfered. However, such phenomena were found only with A1 and D1 samples, which were denser compared to B3 and C3. Using B3 and C3 samples, resonances were clearly seen (see
Figure 5b,c). Such peak values are typically seen in ¼ wavelength when the air gap is present in the acoustic system. The frequency of the peak value depends on the thickness of the air gap. The peak sound absorption values shifted to lower frequencies when the air gap thickness increased, and the peak values of 15 and 20 cm of air gap could not be seen using this measurement system. From a room-acoustics engineering point of view, the 500 Hz octave band frequency is one of the most important. Such panels show the potential to be used for applications in reducing reverberation time of the room.
Due to equipment limitations in measuring frequencies, weighted sound absorption coefficient calculations were not valid. To compare these four panels directly, it was decided to use the average value of the sound absorption coefficient of measured frequency bands.
In
Figure 6 is presented a graph that shows the average sound absorption coefficient as a function of air space behind the sample. It is clearly seen that any air space behind the sample increases the sound absorption. In this graph it is shown that optimal sound absorption is with 50 mm behind the sample, regardless of the sample itself. It is clearly seen that sample A1 has lower average sound absorption using all set up configurations. While sample C3 showed lowest sound absorption without air space (αavg. = 0.36), all other configurations showed highest average sound absorption values (αavg. up to 0.55). Such results show potential use for acoustic applications of PS and clay composites. Comparing results with the commercially produced mineral fibre acoustic panel (αavg. up to 0.51), the PS and clay composite panels showed similar or slightly better acoustic performance.
The future studies will follow with fine tuning the air space behind samples to obtain optimal average sound absorption. Further developed panels will be tested using diffuse sound field method to obtain a wider frequency range of sound absorption. In this study, such tests are not relevant due to amount of sample required for the mentioned method.
Similar acoustic systems are being used in hallways, classrooms, etc. This study shows the potential to recycle paper sludge more efficiently with usage of PS at least 50% per panel. Knowing the problems of this sector in waste management, such a product could reduce the amount of incinerated or landfilled PS significantly.
4. Conclusions
PS was used as a raw material in this study to produce acoustic panels. Clay was used as a binder to make robust PS and clay composite panels. In this work, the method used to produce such panels was presented. To evaluate such composite panels’ acoustic performance, it was compared with traditional mineral fibre acoustic panels.
The PS and clay composite samples were tested using different PS and clay mixing ratios. Then, the samples which showed the best acoustic performance of each grain size were further tested with added air space behind the samples, and ultimately compared with the traditional acoustic panel. For further testing, 1–2.5 mm grain size with 50% PS content, 2.5–5 mm with 70% PS and 5–10 mm with 70% PS samples were selected.
The average sound absorption coefficient, in frequencies from 250 to 1600 Hz, varied with change of air space behind sample. The optimal air gap was 5 cm (αavg. 0.46–0.55). When increasing the air gap, the average sound absorption coefficient decreased. A 5 mm grain size with 70% PS content and the commercially produced mineral fibre panels showed a sound absorption decrease of 2% in each 5 cm, while the other two samples showed a 7% decrease.
When comparing average sound absorption results, it was noticed that a 2.5–5 mm grain size with 70% PS content and a 5–10 mm grain size with 70% PS content showed higher average sound absorption coefficients compared to commercially produced panels when the air space behind the sample was 50 mm. Additionally, the 2.5–5 mm grain-sized sample with 70% PS content showed the highest overall sound absorption coefficients when air space behind the sample was present (αavg. up to 0.55). Compared with traditional acoustic panels (αavg. up to 0.51), PS and clay panels show potential to be used for acoustic applications. Such panels further developed could be products to recycle PS waste.
Author Contributions
Conceptualization, T.A. and R.G.; methodology, T.A.; software, T.A.; validation, T.A., T.J. and R.G.; formal analysis, T.A.; investigation, T.A.; resources, T.J.; data curation, T.A.; writing—original draft preparation, T.A.; writing—review and editing, T.J. and R.G.; visualization, T.A.; supervision, R.G.; project administration, T.J.; funding acquisition, R.G. All authors have read and agreed to the published version of the manuscript.
Funding
This research received no external funding.
Institutional Review Board Statement
Not applicable.
Informed Consent Statement
Not applicable.
Acknowledgments
Authors would like to thank Olga Kizinievič for fruitful suggestions on this study.
Conflicts of Interest
The authors declare no conflict of interest.
References
- Ulrich, T.; Arenas, J.P. Sound absorption of sustainable polymer nanofibrous thin membranes bonded to a bulk porous material. Sustainability 2020, 12, 2361. [Google Scholar] [CrossRef]
- Pfretzschner, J.; Rodriguez, R.M. Acoustic properties of rubber crumbs. Polym. Test. 1999, 18, 81–92. [Google Scholar] [CrossRef]
- Swift, M.J.; Briš, P.; Horoshenkov, K.V. Acoustic absorption in re-cycled rubber granulate. Appl. Acoust. 1999, 57, 203–212. [Google Scholar] [CrossRef]
- Xu, X.; Wang, H.; Sun, Y.; Han, J.; Huang, R. Sound absorbing properties of perforated composite panels of recycled rubber, fiberboard sawdust, and high density polyethylene. J. Clean. Prod. 2018, 187, 215–221. [Google Scholar] [CrossRef]
- Oancea, I.; Bujoreanu, C.; Budescu, M.; Benchea, M.; Grădinaru, C.M. Considerations on sound absorption coefficient of sustainable concrete with different waste replacements. J. Clean. Prod. 2018, 203, 301–312. [Google Scholar] [CrossRef]
- Taban, E.; Khavanin, A.; Faridan, M.; Samaei, S.E.; Samimi, K.; Rashidi, R. Comparison of acoustic absorption characteristics of coir and date palm fibers: Experimental and analytical study of green composites. Int. J. Environ. Sci. Technol. 2020, 17, 39–48. [Google Scholar] [CrossRef]
- Arenas, J.P.; del Rey, R.; Alba, J.; Oltra, R. Sound-absorption properties of materials made of esparto grass fibers. Sustainability 2020, 12, 5533. [Google Scholar] [CrossRef]
- Boubel, A.; Garoum, M.; Bousshine, S.; Bybi, A. Investigation of loose wood chips and sawdust as alternative sustainable sound absorber materials. Appl. Acoust. 2021, 172, 107639. [Google Scholar] [CrossRef]
- Berardi, U.; Iannace, G. Acoustic characterization of natural fibers for sound absorption applications. Build. Environ. 2015, 94, 840–852. [Google Scholar] [CrossRef]
- Tang, X.; Yan, X. Acoustic energy absorption properties of fibrous materials: A review. Compos. Part A Appl. Sci. Manuf. 2017, 101, 360–380. [Google Scholar] [CrossRef]
- Hao, A.; Zhao, H.; Chen, J.Y. Kenaf/polypropylene nonwoven composites: The influence of manufacturing conditions on mechanical, thermal, and acoustical performance. Compos. Part B Eng. 2013, 54, 44–51. [Google Scholar] [CrossRef]
- Dunne, R.; Desai, D.; Sadiku, R. Material characterization of blended sisal-kenaf composites with an ABS matrix. Appl. Acoust. 2017, 125, 184–193. [Google Scholar] [CrossRef]
- Yang, X.; Bai, P.; Shen, X.; To, S.; Chen, L.; Zhang, X.; Yin, Q. Optimal design and experimental validation of sound absorbing multilayer microperforated panel with constraint conditions. Appl. Acoust. 2019, 146, 334–344. [Google Scholar] [CrossRef]
- Gai, X.L.; Cai, Z.N.; Xing, T.; Wang, F.; Li, X.H.; Zhang, B.; Guan, X.W. Experimental study on sound absorbing property of spatial absorber of non-woven fabric with micro-perforated plate-like structure. Appl. Acoust. 2020, 160, 107156. [Google Scholar] [CrossRef]
- Cobo, P.; de la Colina, C.; Roibás-Millán, E.; Chimeno, M.; Simón, F. A wideband triple-layer microperforated panel sound absorber. Compos. Struct. 2019, 226, 111226. [Google Scholar] [CrossRef]
- Rusli, M.; Rahman, F.; Dahlan, H.; Gusriwandi; Bur, M. Sound Absorption Characteristics of a Single Micro-Perforated Panel Backed by a Natural Fiber Absorber Material. Solid State Phenom. 2020, 307, 291–296. [Google Scholar] [CrossRef]
- Hoshi, K.; Hanyu, T.; Okuzono, T.; Sakagami, K.; Yairi, M.; Harada, S.; Takahashi, S.; Ueda, Y. Implementation experiment of a honeycomb-backed MPP sound absorber in a meeting room. Appl. Acoust. 2020, 157, 107000. [Google Scholar] [CrossRef]
- Labia, L.; Shtrepi, L.; Astolfi, A. Improved Room Acoustics Quality in Meeting Rooms: Investigation on the Optimal Configurations of Sound-Absorptive and Sound-Diffusive Panels. Acoustics 2020, 2, 451–473. [Google Scholar] [CrossRef]
- Jahangiri, P.; Logawa, B.; Korehei, R.; Hodgson, M.; Martinez, D.M.; Olson, J.A. On acoustical properties of novel foam-formed cellulose-based material. Nord. Pulp Pap. Res. J. 2016, 31, 14–19. [Google Scholar] [CrossRef]
- Pöhler, T.; Jetsu, P.; Fougerón, A.; Barraud, V. Use of papermaking pulps in foam-formed thermal insulation materials. Nord. Pulp Pap. Res. J. 2017, 32, 367–374. [Google Scholar] [CrossRef]
- Frías, M.; Rodríguez, O.; Sánchez de Rojas, M.I. Paper sludge, an environmentally sound alternative source of MK-based cementitious materials. A review. Constr. Build. Mater. 2015, 74, 37–48. [Google Scholar] [CrossRef]
- Priadi, C.W.; Rahmatika, D.; Moersidik, I.; Setyo, S. Biogas Production in the Anaerobic Digestion of Paper Sludge. APCBEE Procedia 2014, 9, 65–69. [Google Scholar] [CrossRef]
- Kolbl, S.; Forte-Tavčer, P.; Stres, B. Potential for valorization of dehydrated paper pulp sludge for biogas production: Addition of selected hydrolytic enzymes in semi-continuous anaerobic digestion assays. Energy 2017, 126, 326–334. [Google Scholar] [CrossRef]
- Paz-Ferreiro, J.; Plasencia, P.; Gascó, G.; Méndez, A. Biochar from Pyrolysis of Deinking Paper Sludge and Its Use in the Remediation of Zn-polluted Soils. L. Degrad. Dev. 2017, 28, 355–360. [Google Scholar] [CrossRef]
- Van Zwieten, L.; Kimber, S.; Morris, S.; Chan, K.Y.; Downie, A.; Rust, J.; Joseph, S.; Cowie, A. Effects of biochar from slow pyrolysis of papermill waste on agronomic performance and soil fertility. Plant Soil 2010, 327, 235–246. [Google Scholar] [CrossRef]
- Frías, M.; Vegas, I.; Villa, R.V.d.l.; Gimeínez, R.G. Recycling of Waste Paper Sludge in Cements: Characterization and Behavior of New Eco-Efficient Matrices. In Integrated Waste Management: Volume II; Kumar, S., Ed.; BoD—Books on Demand: Norderstedt, Germany, 2011; pp. 301–318. [Google Scholar]
- Sutcu, M.; Akkurt, S.; Bayram, A.; Uluca, U. Production of anorthite refractory insulating firebrick from mixtures of clay and recycled paper waste with sawdust addition. Ceram. Int. 2012, 38, 1033–1041. [Google Scholar] [CrossRef]
- Goel, G.; Kalamdhad, A.S. An investigation on use of paper mill sludge in brick manufacturing. Constr. Build. Mater. 2017, 148, 334–343. [Google Scholar] [CrossRef]
- Sarkar, R.; Kurar, R.; Gupta, A.K.; Mudgal, A.; Gupta, V. Use of paper mill waste for brick making. Cogent Eng. 2017, 4. [Google Scholar] [CrossRef]
- Munir, M.J.; Kazmi, S.M.S.; Wu, Y.F.; Hanif, A.; Khan, M.U.A. Thermally efficient fired clay bricks incorporating waste marble sludge: An industrial-scale study. J. Clean. Prod. 2018, 174, 1122–1135. [Google Scholar] [CrossRef]
- Zhang, S.-Y.; Li, Y.-Y.; Wang, C.-G.; Wang, X. Thermal Insulation Boards from Bamboo Paper Sludge. BioResources 2016, 12, 56–67. [Google Scholar] [CrossRef]
- Wang, S.; Chen, M.; Lu, L.; Zhao, P.; Gong, C. Investigation of the Adaptability of Paper Sludge with Wood Fiber in Cement-Based Insulation Mortar. BioResources 2016, 11, 10419–10432. [Google Scholar] [CrossRef]
- Soucy, J.; Koubaa, A.; Migneault, S.; Riedl, B. The potential of paper mill sludge for wood-plastic composites. Ind. Crops Prod. 2014, 54, 248–256. [Google Scholar] [CrossRef]
- Geng, X.; Zhang, S.Y.; Deng, J. Characteristics of Paper Mill Sludge and Its Utilization for the Manufacture of Medium Density Fiberboard. Wood Fiber Sci. 2007, 39, 345–351. [Google Scholar]
- Donmez Cavdar, A.; Yel, H.; Boran, S.; Pesman, E. Cement type composite panels manufactured using paper mill sludge as filler. Constr. Build. Mater. 2017, 142, 410–416. [Google Scholar] [CrossRef]
- Doudart de la Grée, G.C.H.; Yu, Q.L.; Brouwers, H.J.H. Upgrading and Evaluation of Waste Paper Sludge Ash in Eco-Lightweight Cement Composites. J. Mater. Civ. Eng. 2018, 30, 04018021. [Google Scholar] [CrossRef]
- Kim, S.; Kim, H.J.; Park, J.C. Application of recycled paper sludge and biomass materials in manufacture of green composite pallet. Resour. Conserv. Recycl. 2009, 53, 674–679. [Google Scholar] [CrossRef]
- International Organization for Standardization. ISO 10534-2, Acoustics- Determination of Sound Absorption Coefficient and Impedance in Impedance Tubes—Part 2: Transfer-function method. ISO: Geneva, Switzerland, 2002. [Google Scholar]
- Everest, F.A.; Pohlmann, K.C. Master Handbook of Acoustics, 6th ed.; McGraw-Hill Education: New York, NY, USA, 2015; ISBN 9780071841047. [Google Scholar]
| Publisher’s Note: MDPI stays neutral with regard to jurisdictional claims in published maps and institutional affiliations. |
© 2021 by the authors. Licensee MDPI, Basel, Switzerland. This article is an open access article distributed under the terms and conditions of the Creative Commons Attribution (CC BY) license (http://creativecommons.org/licenses/by/4.0/).


