Abstract
Roads are notable and responsible for the loss of biodiversity and disruption of wildlife habitats connectivity. Wildlife crossing structures (WCS) help wildlife move between habitats by connecting fragmented habitats. Their effectiveness is affected by various factors. Here, to identify methods for improving the effectiveness of wildlife crossing structures, we controlled the effect of intrinsic factors, such as size, that are difficult to improve in an already installed area, and then, evaluated the differences in extrinsic factors using 12 landscape characteristics. Our results show that 18 wildlife crossing structures were selected with propensity-score (PS) matching method. The surrounding landscape characteristics differed between high-effectiveness wildlife crossing structures and low-effectiveness wildlife crossing structures. Particularly, there was a significant difference between the ‘statutory protected area’ and the ‘edge’ index of the morphological spatial pattern analysis among the landscape characteristic variables derived within 1 km2 of wildlife crossing structures. We empirically demonstrate that characteristics around highly effective WCS, statutory protected areas are widely distributed, and the ratio of edge of MSPA is low (within 1 km2). Therefore, an important outcome of our research is the demonstration that management of WCS itself is important, but conservation of surrounding habitats and landscape management plans are also significant.
1. Introduction
Roads have profound effects on biodiversity due to habitat disturbance, mortality, and barrier effects. There are an estimated 64,282,009 km of paved and unpaved roads worldwide [1]. Wildlife crossing structures (hereinafter WCS) are one of the mitigation measures for the negative impact of roads on biodiversity. WCS connect fragmented habitat patches that are disconnected by roadways to prevent wildlife–vehicle collisions [2], increase the safety of motorists [3], maintain wildlife populations [4], and promote gene flow [5]. WCS should reduce the impact of roads to a level allowing maintenance or restoration of basic ecological processes and functions within their historic range of variability [6]. The general idea of how well a WCS performs is if animals use it, then it must be functional. Measures that promote movement across road barriers enhance population viability and likelihood of recolonization [7,8]. Therefore, how well a WCS performs is evaluated by the animal use.
A law related to the installation and management of wildlife crossing structures (Natural Environment Conservation Act, Environmental Impact Assessment Act) was established in South Korea in 1998 [9], with the first WCS installed in Jiri National Park [10]. Since then, the number of WCS has increased quantitatively, as of 2020, the total number of WCS in Korea reached 509 [11]. However, in many cases, it was created in a manner of showing the reduction measures according to the environmental impact assessment (EIA), and was criticized by the media or the National Assembly for its efficiency [10]. Compared to the quantitative increase of WCS in Korea, qualitative evaluation of WCS was insufficient. Therefore, it is an important point to measure the efficiency of the WCS through scientific assessment of the WCS.
The construction cost of a WCS is very high and, once installed, it is very difficult to change the location, size, or structure. Accordingly, methods for maximizing the effectiveness of WCS should be established [12]. To date, a large amount of the previous research on effectiveness of WCS has been conducted [13,14,15,16] around the world. Various factors influencing the efficiency of WCS including size [17], traffic volume [18], noise and light pollution [19], habitat corridor [20], and landscape characteristics [21] have been evaluated.
Particularly, landscape characteristics are considered important factors because wildlife is connected to habitat patches and land use types [2,21]. As the movement of wild fauna is affected by anthropogenic changes in land use, the characteristics of landscape around WCS greatly influence their effectiveness [21]. In this study, the effectiveness of WCS was evaluated at a national scale and various factors affecting landscape characteristics around WCS were compared.
First, few studies have evaluated the effectiveness of WCS using quantitative indicators and their influence at the national scale [22]. Previous studies focused on evaluating the effectiveness of WCS installed at several sites, such as a National Park or specific urban area to examine influential factors [6]. Although these studies are very important, it is difficult to derive common influencing factors at the national scale and suggest policy alternatives based on the results.
Second, the criteria defined in “The guideline for wildlife crossing construction and management” developed by the Ministry of Environment (MoE) in 2003 focus on intrinsic factors rather than extrinsic factors around WCS. The intrinsic factors include size, subsidiary facilities (e.g., fences), monitoring facilities, and cycle of investigation based on the structural characteristics of WCS [23]. Extrinsic factors include the type of land cover around the WCS, presence of protected areas, and connectivity of surrounding habitat patches in relation to the location characteristics of WCS [10].
The MoE guidelines have improved the effectiveness of WCS by specifying criteria such as standards for underpasses and overpasses, monitoring facilities, and investigation cycles. However, the criteria for characteristics of the habitat around WCS and connectivity, which are extrinsic factors, remain unclear, limiting efforts aimed at improving the effectiveness of WCS. Korea has 507 officially registered WCS, which is a very large on the international scale [11]. Additionally, constant expansion of cities has highlighted the need to develop suburban and agricultural land. Accordingly, habitats around WCS will likely decrease and become fragmented with further developments.
This study was conducted to evaluate the differences in the characteristics of the surrounding landscape depending on the effectiveness of a WCS. Intrinsic factors were treated for low- and high-effectiveness wildlife crossing sites. Differences in the characteristics of the landscape as extrinsic factor around the two groups was also tested.
2. Materials and Methods
2.1. Research Subject and Data
The research sites were 49 WCS in East Asia and on the southern part of the Korean peninsula (Figure 1; Table S1). The total land area of South Korea is approximately 100,000 km2. Around 70% of its terrain is mountainous, and various types of roads of more than 600,000 km are installed [24]. A total of 128 mammals were reported to inhabit this area as of 2018 [25].
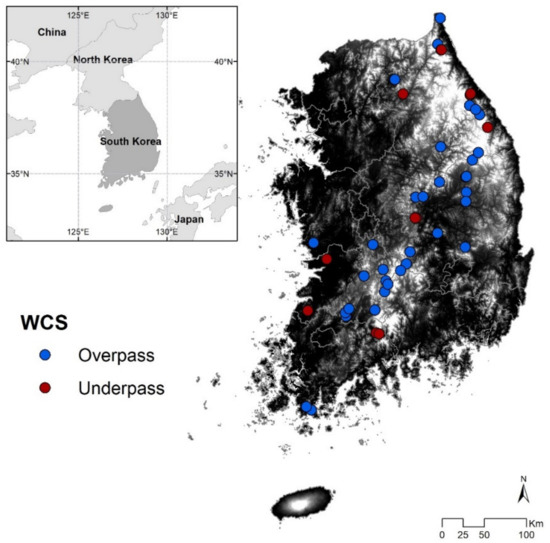
Figure 1.
Distribution of field survey and monitoring wildlife crossing structures (n = 49). Blue and red dots indicate an overpass (n = 36) and underpass (n = 13), respectively.
Since 1986, the government has continuously collected basic data on the biota at the national level every 5–10 years by conducting an ‘Investigation of Natural Environment’ [26]. Along with these nationwide data, data obtained from continuous or temporary monitoring and field investigations of 49 overpass WCS from 2016 to 2018 were used [27]. A wildlife camera trap (HC600, Reconyx, Holmen, WI, USA) was used for monitoring, and 2–4 cameras were installed per WCS. Considering the distance of the camera sensor range, the cameras were installed side-by-side at intervals of 5~8 m to photograph wild animals.
2.2. Effectiveness Evaluation Index
Woo et al. [28] suggested that WCS (n = 49) were evaluated for the effectiveness using the daily average frequency index (FI) and diversity index (DI). The average daily use frequency value was calculated as the ratio of the total number of monitoring days to the number of uses per WCS. After calculating the average value of 49 sites, the effectiveness of individual WCS was evaluated based on the value.
Average capture frequency of wildlife animals as the number of events/day was defined as the threshold value (Equation (1)). The species diversity value was compared to the number of species that appeared in the WCS compared to the number of species around the WCS. The number of surrounding species was based on the results of INE mammalian surveys on a scale of 1:25,000, and the reference value was set to 1.0 when the number of species appearing in the WCS and the number of species around them were the same. Conversely, if it is less, it is calculated below 1.0 (Equation (2)). The threshold of species diversity (1.0) was defined by calculating the ratio between the mammalian survey grid data (Figure S1) of the 2nd (1997–2005) and 3rd (2006–2013) Investigations of Natural Environment (INE) and species for the WCS [27]. Index values above the threshold were considered to indicate a highly efficient WCS (Equation (3)).
where Ni: the number of crossing by animal of all species in each WCS; Nd: the average number of crossing by animal of all species in all surveyed WCS
where Ds: the number of species crossing in each WCS; Di: the number of species in ‘Investigation of Natural Environment’ grid
2.3. Landscape Characteristic Variable
By utilizing the habitat range and dispersion distance of mammals living on the Korean Peninsula [28,29] and setting a minimum radius of 1 km and maximum radius of 5 km (1 and 25 km2) around the WCS, a buffer was created, and 12 variable values for the landscape characteristics of the habitat within the buffer were calculated (Table 1).

Table 1.
Summary of 12 landscape characteristic variables and method of variable construction.
For the human-dominated landscape variable, the 2010 land cover map level 1 (30 m resolution) produced by the MoE was used [30]. The land cover map has three levels; level 1 is divided into seven types (urban, agricultural land, grassland, forest, wetland, bare land, and water). In this study, urban and agricultural land were selected as variables (Figure 2A).
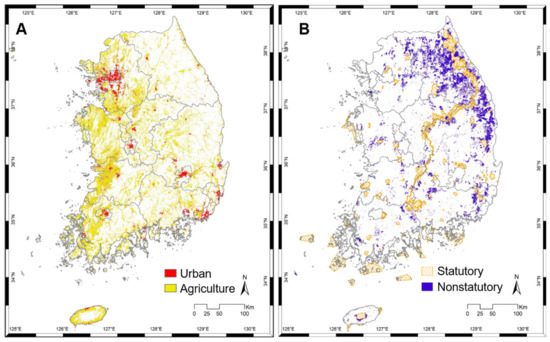
Figure 2.
(A) Human-dominated landscape (urban area and agricultural area due to land cover), (B) protected area where development is prohibited, statutory protected area (slashed area: Baekdudaegan, National Park, Provincial Park, County Park), and nonstatutory protected areas with limited protection (purple zone: 1st grade zone in ENM).
The Korea Database on Protected Area provides data on 3392 protected areas comprised of 30 types designated by 14 laws [31]. To select a protected area for study, the Baekdudaegan Protection Area, National Park, Provincial Park, and County Park were used as protected areas that legally restrict development. These areas were chosen to examine protected areas that are widely distributed around WCS. Additionally, First Grade Zone in the Ecology and Nature Maps (1st zone in ENM) was used as a protected area that can be developed conservatively when there is a specific reason, although general development activities are restricted (Figure 2B). The ENM divides the ecosystem conservation level into 1–3 stages based on various ecological survey data such as Investigation of Natural Environment data and protected area status, with development restrictions strongest in the 1st zone [32].
The final landscape characteristic variable is the landscape index calculated using the MSPA method [33]. The MSPA is a very useful method for quantifying the spatial arrangement and connectivity of landscape elements in geometrical terms and visually expressing these elements [33,34]. MSPA categorizes the landscape as a core, islet, bridge and loop, edge and perforation, and background according to its shape via various mathematical operations and simple geometric processes based on a binary map and provides information on the percentage (%) of each element in the entire landscape [33,35].
Moreover, MSPA shows different results depending on the parameter value used for the proximity rule (4- or 8-connectivity), which are set by the researcher, and edge width. This allows for visual analysis of the landscape change expected in accordance with various scenarios [34,36]. In this study, a binary forest (1) and non-forest (0) map was generated by using land cover map level 1 from the MoE. The edge width was set to 30 m in accordance with the spatial resolution of the land cover map, and GUIDOS was used for data analysis [37].
2.4. Comparison of Landscape Characteristics Based on Effectiveness Evaluation
WCS effectiveness is affected by various factors, and this study focus only on extrinsic factors such as landscape characteristics [14]. Therefore, other variables that may affect WCS efficiency must be controlled. For this, the propensity-score (PS) matching method was used. Propensity-score method was used to reduce the impact of treatment-selection bias in the estimation of treatment effects using observational data. It is based on the assumption that objects with similar propensity scores have similar distributions of measured covariate values. The method consists of selecting a treatment group by matching propensity score using covariates and it can reliably confirm the causal effect by adjustment of the covariate using propensity-score [38].
We consider intrinsic factors related to WCS type, road type, number of lanes, and construction year, which affects wild animals in becoming accustomed to the structure were selected as a covariate. Based on this, 1:1 Caliper PS matching method was applied for LWC grouping. To verify the accuracy of PS matching, Fisher’s exact test was employed.
A difference test was conducted to verify whether there was a difference in the characteristics of the surrounding landscape between the HWC and LWC groups. As the two groups contained small numbers of cases (n ≤ 20), normality for logistic regression analysis could not be assumed. Thus, the difference in landscape characteristics was tested according to effectiveness by performing the Mann–Whitney U test, which is a nonparametric method [39]. IBM SPSS Statistics (23.0) was used for data analysis.
3. Results
3.1. Monitoring Results and Effectiveness Evaluation
Analysis of the monitoring data confirmed 20,958 uses during a cumulative total of 13,623 days (Table S1). The threshold of FI, the average daily use frequency of all WCS, was 1.4. There were 17 WCS with an FI value greater than 1.4 and 32 WCS with an FI value less than 1.4. Among these, ungulates used overpasses an average of 0.9 times per day and underpasses 0.8 times per day. Carnivores crossed overpasses and underpasses an average of 0.3 times per day. The total number of species using WCS was 18. For overpasses, water deer (Hydropotes inermis) were observed most frequently, followed by raccoon dogs (Nyctereutes procyonoides), and roe deer (Capreolus pygargus). Raccoon dogs most frequently used underpasses, followed by water deer, leopard cats (Prionailurus bengalensis), and Asian badgers (Meles leucurus). Using this, the DI was calculated by comparing to the data derived from the Investigation of Natural Environment (Figure S1). The number of WCS with a DI threshold greater than 1.0 was 18.
For WCS that simultaneously satisfy the FI and DI thresholds, 10 of 49 monitored WCS were rated as highly effective (nine overpasses and one underpass). Here, as a covariate for efficient controlling of the effect of intrinsic factors, only nine overpasses, excluding underpass, were grouped into High-HWC in terms of types of WCS.
3.2. Effectiveness of Grouping
Matching analysis was performed to group nine LWC by controlling intrinsic factors. The nine overpasses were selected, and their suitability was tested using the results of Fisher’s exact test (Table 2).
Table 2.
Difference between the HWC and LWC groups was confirmed by dividing each covariate into two characteristics in Fisher’s exact test for covariates.
According to the p-value of the covariate, the road type (0.620), number of road lanes (0.637), and construction year (1.000) were not significant. Thus, there was no difference between HWC and LWC, and LWC with intrinsic factors controlled by PS matching method was selected.
Figure 3 shows the distribution of 18 HWCs and LWCs that were selected. In the comparison of the distribution results by administrative district, Chungcheongnam-do in the central west of South Korea had the largest number of HWCs (n = 3). The area with the second largest number was Gangwon-do, which showed the largest distribution of mountains and highest elevation (n = 2) compared to the other areas.
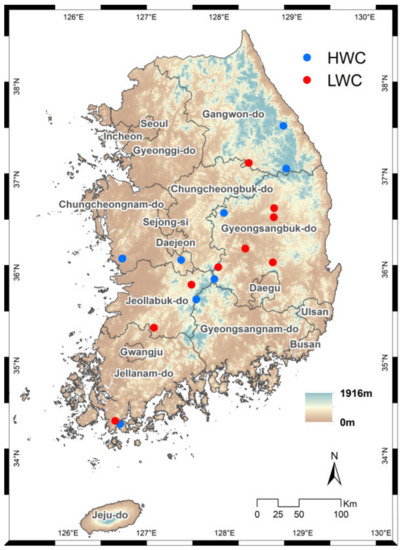
Figure 3.
Distribution status of HWC (blue dot) and LWC (red dot) according to elevation, effectiveness evaluation, and grouping. South Korea mainly has high elevation in the eastern region, including many areas of Gangwon-do and Gyeongsangbuk-do.
WCS are uncommon in Seoul, which is the capital city, and its surrounding area, Gyeonggi-do. This is thought to be because land use changes in Seoul and Gyeonggi province had already progressed considerably in the early 2000s when the first WCS-related law was enacted in 1998 and WCS were being installed in earnest [40].
3.3. Comparison of Landscape Characteristics Based on Effectiveness Evaluation
To compare the landscape characteristics of HWC and LWC, a buffer was created for every 18 WCS, and 12 landscape characteristic values were extracted (Table 3). First, the area of urban and agricultural areas, which are the human activity variable, was larger around the HWC within a 1-km radius of the buffer compared to around the LWC within a 5-km radius.
Table 3.
Area calculated by extracting 12 landscape characteristics within 1- and 5-km radii of HWC and LWC (km2) (Perf.: Perforation, Bran: Branch, Back.: Background, Brid.: Bridge).
Second, for the conservation zone variable, the area of the statutory protected area was much larger around the HWC than around the LWC, regardless of the buffer size. The 1st zone in ENM showed little difference between the HWC and LWC in the 1-km buffer was approximately twice as large as around the HWC within 5 km. The conservation zone variable showed consistent results regardless of the buffer size. As confirmed in other empirical studies [41], our results indicate that the conservation zone exhibits differences depending on the effectiveness of WCS and, particularly, that the effectiveness of WCS is higher in areas with a higher ratio.
Finally, for the landscape index, the eight indices changed in group with a higher value according to buffer size except for Edge. For example, for the Core, which is related to the habitat size [23], a slightly high value was observed in the LWC group within a 1-km radius of the buffer and a relatively high value was observed for the HWC group within the 5-km buffer. This indicates that other morphological characteristics such as Edge should be considered rather than simply focusing on securing the core when establishing a plan to conserve habitats around WCS.
In the Mann–Whitney U test between HWC and LWC (Tables S3 and S4), only 1 km of statutory protected area (p = 0.040) and edge (p = 0.047) significantly differed (Table 4). Comparing this result with that of area extraction for each variable in the buffer previously performed, both the statutory conservation zone located around the HWC and 1st grade zone in the ENM showed high values in area analysis. However, in statistical analysis, only the statutory protected area exhibited a significant difference for the effectiveness of WCS. In contrast, Edge was a meaningful variable for both area comparison analysis and statistical analysis.
Table 4.
Variables explaining the landscape characteristics of the two WCS groups (Mann–Whitney U test, p ≤ 0.05).
To visually confirm these results, they were expressed in a map. A1 and A2 represent an HWC and B1 and A2 represent an LWC (Figure 4). The protected area variable map (above map) indicates that it is difficult to improve effectiveness only by designating the 1st grade zone in the ENM around the WCS. As a result of MSPA (below map), the place where the edge landscape, generated by innumerable fragmentation, exists even if the area of the core is widely distributed and showed low effectiveness for the WCS in both A2 and B2.
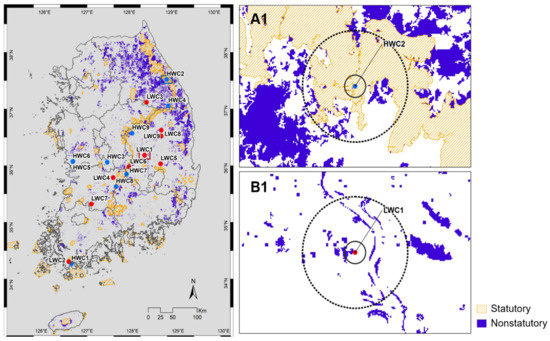
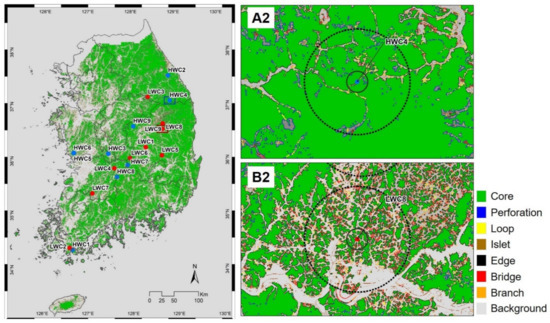
Figure 4.
Mapping results of protected areas (above map) and landscape metrics using MSPA (below map) around HWC and LWC. The above map legend indicates the statutory and nonstatutory protected areas (A1,B1), the below map legend indicates MSPA eight indices (A2,B2). Four WCS that clearly reveal the landscape characteristics were expressed in an enlarged map on the right (above map: HWC2 (A1) and LWC1 (B1), below map: HWC4 (A2) and LWC8 (B2)) along with two types of boundaries extracted from landscape characteristics (solid line: radius 1 km, dotted line: radius 5 km).
4. Discussion
4.1. Discussion and Limitations
This study shows a significant difference between the ‘statutory protected area’ and the ‘edge’ index of the morphological spatial pattern analysis among the 12 landscape characteristic variables derived within 1 km2 of WCS.
In the difference test, only the statutory protected areas showed significant results. This is because it has important implications in terms of landscape connectivity or habitat connectivity around the WCS. Protected areas are a key tool in efforts to safeguard biodiversity against increasing anthropogenic threats [42].
Among the statutory protected areas, ‘Baekdudaegan Protection Area’ was designated under the law in 2005 to preserve the core ecological corridor of the Korean peninsula and has a very high biodiversity value [10]. This protected area is a mountain range and watershed spanning approximately 1400 km that crosses the north and south of the Korean peninsula, and is an important area in the ecological “Network” [41]. Considering that WCS began to be installed in earnest in the early 2000s, development of the surrounding area was likely restricted while installation of WCS was carried out simultaneously.
Moreover, in Korea, the mountainous area that occupies approximately 70%, is fragmented into very small pieces of habitat, and thus the natural wildlife habitat is severely disconnected [27]. Habitat loss and fragmentation are some of the most important and increasing threats to biodiversity [43]. Landscape changes over time and its transformation is closely related to landscape fragmentation, which in turn has some effects on connectivity and it is common worldwide [44].
In this context, edge is the only landscape index with explanatory power. This study suggests that to ensure the effectiveness of WCS, a strategy that can reduce the ratio of the edge from a morphological perspective and securing the core in terms of area is needed.
An important outcome of our research is the demonstration that management of WCS itself is important, but conservation of surrounding habitats and landscape management plans are also significant. The landscape characterization methods outlined in this study can help WCS to provide the greatest conservation benefit. We caution that the results from our work are not universal in their application, as the influence of factors related to the efficacy of crossing structures might be expected to vary between landscapes and faunal communities. Therefore, landscape level attributes of WCS are important in determining the efficacy of the measures. Understanding the spatial arrangement of landscape features is now well recognized as being crucial in order to achieve sustainable development [45]. This approach can contribute towards improving landscape conditions by mitigating the effects of fragmentation and stimulating enhanced ecological benefits of future WCS design.
This study had some limitations. First, although the intrinsic factors of WCS were significantly controlled, no WCS were installed in the same environmental condition. Studies performed while considering this factor can lead to the establishment of more effective conservation strategies. In fact, as a result of investigation of compliance with the guidelines of WCS, even when a WCS is in a major ecosystem with high connectivity, standards that do not meet the guidelines and poor management of nearby facilities greatly influence the effectiveness of a WCS [22].
Taken together, empirical analysis implies that compliance with guidelines before installing WCS is important, and connectivity between surrounding habitats as well as legal restrictions should be increased to minimize the impacts of human activities after installation.
To develop such a strategy in the future, additional empirical research is needed. A landscape analysis method that can analyze not only the core area within a unit area, but also the number and connectivity of the cores, various nonparametric regression analysis, and quantitative analysis applying a geographic weighted regression model are necessary. In addition, a method for evaluating the effectiveness of WCS analytical scale and land-use change scenarios are needed. Particularly, to consider the diversity of species observed, landscape indices such as richness and diversity should be used for comparison. Moreover, the mammalian survey scale of the ‘Investigation of Natural Environment’ and land cover map resolution were considered. However, because MSPA is very sensitive to the spatial scale, sensitivity analysis according to differences in the evaluation scale should be performed. As such, future work might also develop spatial models for landscape management plans around WCS in an even wider array of land-use change scenarios than those discussed in this article.
4.2. Policy Proposal
As crossing structures can be expensive to implement, the goal of transportation planning and wildlife management in this case should be for conservation action around the WCS that provides the greatest conservation benefit given limited resources. In order to improve the effectiveness of WCS, it is necessary to manage a landscape scale habitat such as designating a protected area and reducing edge effects.
However, in practice, there are many cases in which protecting the land around a WCS is impossible because of institutional reasons (e.g., purchase of private land), which should be further studied. The factors influencing the effectiveness of WCS analyzed in this study will facilitate selection of an alternative location.
Furthermore, the WCS installation area designated by law (mainly a protected area) prevents “the movement and ecological continuity of wild animals from being disconnected.” Accordingly, near large cities such as Seoul, which experienced rapid urbanization before the 2000s, there are a relatively few areas that can be mandated for installation. Thus, efforts aimed at conserving and limiting development more specifically and quantitatively are needed rather than using existing guidelines by securing locations that can ensure ecological continuity with wild animals.
Efforts to legally restrict development among protected areas are very important for conserving the ecosystem and improving the effectiveness of WCS. Although the Baekdudaegan Protection Area is fully implementing these systems, small-scale disturbances such as hiking trails continue to occur. A restoration strategy is lacking for areas that were damaged before being designated as protected by law in 2005. Thus, a conservation and restoration plan that can comprehensively consider all of these factors is needed.
The results of this study evaluated the WCS at the national and landscape scale, and in future studies, it is necessary to compare differences such as preferred standards, avoidance characteristics, and adaptability by species. In Korea, since 2018, road-kill information (location, animal type, etc.) nationwide has been received in real time on the wildlife vehicle collision information system. Based on this, roadkill-hotspots are selected to prioritize reduction measures (fences, road signs, WCS). In the future, it is necessary to conduct a study using the WCS efficiency evaluation index by comparing the characteristics before and after road-kill in the area where WCS are installed.
5. Conclusions
This study attempted to identify landscape characteristic based on effectiveness of wildlife crossing structures. Their effectiveness is affected by various factors. Here, to identify methods for improving the effectiveness of wildlife crossing structures, we controlled the effect of intrinsic factors, such as size, that are difficult to improve in an already installed area, and then, evaluated the differences in extrinsic factors using 12 landscape characteristics.
We empirically demonstrated that characteristics around highly effective WCS, statutory protected areas are widely distributed, and the ratio of edge of MSPA is low (within 1 km2). Therefore, improving the effectiveness of WCS is required considering ecological corridors and institutionally restricting land-use changes in habitats around wildlife crossing structures.
An important outcome of our research is the demonstration that management of WCS itself is important, but conservation of surrounding habitats and landscape management plans are also significant. It is necessary to expand the protected area and reduce the edge effect due to habitat fragmentation around WCS. By improving the efficiency of WCS, it is possible to expect the effect of promoting biodiversity and sustainability of the landscape.
Supplementary Materials
The following are available online at https://www.mdpi.com/2071-1050/13/2/675/s1, Figure S1: Thematic map dividing the number of species appearing in the mammalian survey grid of the Investigation of Natural Environment (INE) into 5 levels, Table S1: List of monitoring wildlife crossing structure, Table S2: 18 WCS evaluated for the effectiveness using the daily average frequency index(FI) and diversity index(DI), Table S3: Results of Mann-Whitney U test in human-dominated landscape and conservation zone where development is prohibited, Table S4: Results of Mann-Whitney U test landscape metrics using MAPA.
Author Contributions
Conceptualization, H.S. and D.W.; investigation, D.W.; data curation, D.W.; methodology, K.L.; software, H.S. and C.C.; visualization, H.S.; project administration, H.S. and D.W.; writing, H.S. and D.W. All authors have read and agreed to the published version of the manuscript.
Funding
This research was supported by National Institute of Ecology (No. NIE-Fundamental Research-2021-07).
Institutional Review Board Statement
Not applicable.
Informed Consent Statement
Not applicable.
Data Availability Statement
Not applicable.
Acknowledgments
We would like to thank the MoE (Ministry of Environment) of Republic of Korea for its assistance. We are also grateful to all researchers who carried out field surveys. We also thank the editors and reviewers for their helpful comments on previous versions of this manuscript.
Conflicts of Interest
The authors declare no conflict of interest.
References
- Central Intelligence Agency. The World Factbook. 2013. Available online: https://www.cia.gov/library/publications/resources/the-world-factbook/index.html (accessed on 22 October 2020).
- Clevenger, A.P.; Chruszcz, B.; Gunson, K.E. Spatial patterns and factors influencing small vertebrate fauna road-kill aggregations. Biol. Conserv. 2003, 109, 15–26. [Google Scholar] [CrossRef]
- Clevenger, A.P.; Hardy, A.; Gunson, K.; Bissonette, J. Analyses of Wildlife-Vehicle Collision Data: Applications for Guiding Decision-Making for Wildlife Crossing Mitigation and Motorist Safety; Unpublished Report; Utah State University: Logan, UT, USA, 2006. [Google Scholar]
- Weaver, J.L.; Paquet, P.C.; Ruggiero, L.F. Resilience and conservation of large carnivores in the Rocky Mountains. Conserv. Biol. 1996, 10, 964–976. [Google Scholar] [CrossRef]
- McDonald, W.; St. Clair, C.C. Elements that promote highway crossing structure use by small mammals in Banff National Park. J. Appl. Ecol. 2004, 41, 82–93. [Google Scholar] [CrossRef]
- Clevenger, A.P. Conservation value for wildlife crossings: Measures of performance and research directions. GAIA 2005, 14, 124–129. [Google Scholar] [CrossRef]
- Beier, P.; Noss, R. Do habitat corridors provide connectivity? Conserv. Biol. 1998, 18, 1241–1252. [Google Scholar] [CrossRef]
- Van der Grift, E.A. Defragmentation in the Netherlands: A success story? GAIA 2005, 14, 144–147. [Google Scholar] [CrossRef]
- Korea Law Translation Center (KLTC). Available online: https://elaw.klri.re.kr/kor_service/lawView.do?hseq=49087&lang=ENG (accessed on 2 May 2020).
- National Institute of Ecology (NIE). Fundamental Research on the Conservation of National Ecological Network; National Institute of Ecology: Seocheon-gun, Korea, 2019; pp. 42–63.
- Korea Wildlife Crossing Structure Information System. Available online: https://widlifecrossing.nie.re.kr (accessed on 10 December 2020).
- Downs, J.A.; Horner, M.W. Enhancing habitat connectivity in fragmented landscapes: Spatial modeling of wildlife crossing structures in transportation networks. Ann. Am. Assoc. Geogr. 2012, 102, 17–34. [Google Scholar] [CrossRef]
- Clevenger, A.P.; Waltho, N. Performance indices to identify attributes of highway crossing structures facilitating movement of large mammals. Biol. Coserv. 2005, 121, 453–464. [Google Scholar] [CrossRef]
- Bond, A.R.; Jones, D.N. Temporal trends in use of fauna-friendly underpasses and overpasses. Wildl. Res. 2008, 35, 103–112. [Google Scholar] [CrossRef]
- Olsson, M.P.O.; Widen, P. Effects of highway fencing and wildlife crossings on moose Alces alces movements and space use in southwestern Sweden. Wildl. Biol. 2008, 14, 111–117. [Google Scholar] [CrossRef]
- Wang, Y.; Guan, L.; Piao, Z.; Wang, Z.; Kong, Y. Monitoring wildlife crossing structures along highways in Changbai Mountain, China. Transport. Res. Part D Transp. Environ. 2017, 50, 119–128. [Google Scholar] [CrossRef]
- Hardy, A.; Clevenger, A.P.; Huijser, M.; Neale, G. An overview of methods and approaches for evaluating the effectiveness of wildlife crossing structures: Emphasizing the science in applied science. In Proceedings of the 2003 International Conference on Ecology and Transportation (ICOET 2003), Lack Placid, NY, USA, 24–29 August 2003; pp. 319–330. [Google Scholar]
- Van der Ree, R.; Jaeger, J.A.; van der Grift, E.A.; Clevenger, A.P. Effects of roads and traffic on wildlife populations and landscape function: Road ecology is moving toward larger scales. Ecol. Soc. 2011, 16, 489. [Google Scholar] [CrossRef]
- Shilling, F.; Collins, A.; Louderback-Valenzuela, A.; Farman, P.; Guarnieri, M.; Longcore, T.; Banet, B.; Knapp, H. Wildlife-Crossing Mitigation Effectiveness with Traffic Noise and Light; UC Davis: National Center for Sustainable Transportation: Sacramento, CA, USA, 2018; pp. 1–21. [Google Scholar]
- Riley, S.P.; Brown, J.L.; Sikich, J.A.; Schoonmaker, C.M.; Boydston, E.E. Wildlife friendly roads: The impacts of roads on wildlife in urban areas and potential remedies. In Urban Wildlife Conservation; Springer: Boston, MA, USA, 2014; pp. 323–360. [Google Scholar]
- Forman, R.T.; Alexander, L.E. Roads and their major ecological effects. Annu. Rev. Ecol. Systemat. 1998, 29, 207–231. [Google Scholar] [CrossRef]
- Woo, D.G.; Seo, H.J.; Choi, T.Y.; Song, E.G.; Kim, K.M.; Park, T.J. A Study on the Wildlife Crossings Efficiency Evaluation Criteria. In Proceedings of the International Conference on Ecology & Transportation ICOET 2019, Sacramento, CA, USA, 22–26 September 2019. [Google Scholar]
- National Institute of Ecology (NIE). A Study on Analysis of Habitat Fragmentation and Improvement of Wildlife Passage Effectiveness; National Institute of Ecology: Seocheon-gun, Korea, 2015; pp. 10–54.
- Choi, T.Y. Wildlife on the Roads, 1st ed.; National Institute of Ecology: Seocheon-gun, Korea, 2016; pp. 174–215.
- Convention on Biological Diversity-Clearing House Mechanism Korea (CBD-CHM KOREA). Available online: http://www.kbr.go.kr (accessed on 5 April 2020).
- Kim, C.H.; Kang, J.H.; Kim, M.J. Status and development of national ecosystem survey in Korea. J. Environ. Impact. Assess. 2013, 22, 725–738. [Google Scholar] [CrossRef]
- National Institute of Ecology (NIE). Fundamental Research on the Conservation of National Ecological Network; National Institute of Ecology: Seocheon-gun, Korea, 2018; pp. 49–84.
- Woo, D.G. A Study on Ecological Characteristics and Conservation of Yellow-Throated Marten. Ph.D. Thesis, Seoul National University, Seoul, Korea, 2014. [Google Scholar]
- Choi, T.Y.; Yang, B.G.; Woo, D.G. The suitable types and measures of wildlife crossing structures for mammals of Korea. J. Environ. Impact. Assess. 2012, 21, 209–218. [Google Scholar]
- Environmental Geographic Information Service (EGIS). Available online: https://egis.me.go.kr (accessed on 15 August 2020).
- Korea Database on Protected Area (KAPA). Available online: http://www.kdpa.kr (accessed on 15 August 2020).
- Choi, C.H.; Lim, C.H.; Lee, S.J.; Seo, H.J. The impact of anthropogenic land cover change on degradation of grade in ecology and nature map. J. Korean Environ. Res. Technol. 2019, 22, L77–L87. [Google Scholar]
- Vogt, P.; Ritters, K.H.; Estreguil, C.; Kozak, J.; Wade, T.G.; Wickham, J.D. Mapping spatial patterns with morphological image processing. Landsc. Ecol. 2007, 22, 171–177. [Google Scholar] [CrossRef]
- Kupfer, J.A. Landscape ecology and biogeography: Rethinking land-scape metrics in a post-FRAGSTATS landscape. Prog. Phys. Geogr. Earth Environ. 2012, 36, 400–420. [Google Scholar] [CrossRef]
- Soille, P.; Vogt, P. Morphological segmentation of binary patterns. Pattern Recognit. Lett. 2009, 30, 456–459. [Google Scholar] [CrossRef]
- Estreguil, C.; Caudullo, G. Harmonized measurements of spatial pattern and connectivity: Application to forest habitats in the EBONE European project Forest landscape and global change-new frontiers in management. In Proceedings of the IUFRO Landscape Ecology Working Group International Conferences, Braganta, Portugal, 21–27 September 2010. [Google Scholar]
- Vogt, P.; Riitters, K. Guidos Toolbox: Universal digital image object analysis. Eur. J. Remote Sens. 2017, 50, 352–361. [Google Scholar] [CrossRef]
- Guo, S.; Fraser, M.W. Propensity Score Analysis: Statistical Methods and Applications; Sage Publications: Newbury Park, CA, USA, 2014; Volume 11. [Google Scholar]
- MacFarland, T.W.; Yates, J.M. Introduction to Nonparametric Statistics for the Biological Sciences Using R; Springer: New York, NY, USA; Cham, Swizerland, 2016. [Google Scholar]
- Kim, I.K. Socioeconomic concentration in the Seoul metropolitan area and its implications in the urbanization process of Korea. Korean J. Sociol. 2010, 44, 111–128. [Google Scholar]
- National Institute of Ecology (NIE). Conservation and Restoration Based Research on the Core Ecological Axis of the Korean Peninsula; National Institute of Ecology: Seocheon-gun, Korea, 2015; pp. 7–75.
- Coad, L.; Watson, J.E.; Geldmann, J.; Burgess, N.D.; Leverington, F.; Hockings, M.; Knights, K.; Marco, M.D. Widespread shortfalls in protected area resourcing undermine efforts to conserve biodiversity. Front. Ecol. Environ. 2019, 17, 259–264. [Google Scholar] [CrossRef]
- Carlier, J.; Moran, J. Landscape typology and ecological connectivity assessment to inform Greenway design. Sci. Total Environ. 2019, 651, 3241–3252. [Google Scholar] [CrossRef] [PubMed]
- Clevenger, A.P.; Wierzchowski, J. Maintaining and restoring connectivity in landscapes fragmented by roads. Conserv. Biol. Ser. 2006, 14, 502. [Google Scholar]
- Vogiatzakis, I.N.; Mannion, A.M.; Griffiths, G.H. Mediterranean ecosystems: Problems and tools for conservation. Prog. Phys. Geogr. 2006, 30, 175–200. [Google Scholar] [CrossRef]


Publisher’s Note: MDPI stays neutral with regard to jurisdictional claims in published maps and institutional affiliations. |
© 2021 by the authors. Licensee MDPI, Basel, Switzerland. This article is an open access article distributed under the terms and conditions of the Creative Commons Attribution (CC BY) license (http://creativecommons.org/licenses/by/4.0/).