Article

Proposing Alternative Solutions to Enhance Natural Ventilation Rates in Residential Buildings in the Cfa Climate Zone of Rasht

by
Roya Aeinehvand
1,
Amiraslan Darvish
2,
Abdollah Baghaei Daemei
3,*,
Shima Barati
4,
Asma Jamali
5 and
Vahid Malekpour Ravasjan
6
1
School of Architecture Urban Planning Construction Engineering, Politecnico di Milano, 23900 Lecco, Italy
2
Department of Energy and Architectural Engineering, Faculty of Architecture and Urbanism, Imam Khomeini International University, Qazvin, Iran
3
Young Researchers and Elite Club, Rasht Branch, Islamic Azad University, Rasht, Iran
4
Faculty of Architecture, Karaj Branch, Islamic Azad University, Karaj, Iran
5
Department of Architectural Engineering, Rahbord Shomal University, Rasht, Iran
6
Faculty of Architecture, Shabestar Branch, Islamic Azad University, Shabestar, Iran
*
Author to whom correspondence should be addressed.
Sustainability 2021, 13(2), 679; https://doi.org/10.3390/su13020679
Submission received: 13 November 2020 / Revised: 30 December 2020 / Accepted: 5 January 2021 / Published: 12 January 2021
(This article belongs to the Section Energy Sustainability)

Abstract

:
Today, renewable resources and the crucial role of passive strategies in energy efficiency in the building sector toward the sustainable development goals are more indispensable than ever. Natural ventilation has traditionally been considered as one of the most fundamental techniques to decrease energy usage by building dwellers and designers. The main purpose of the present study is to enhance the natural ventilation rates in an existing six-story residential building situated in the humid climate of Rasht during the summertime. On this basis, two types of ventilation systems, the Double-Skin Facade Twin Face System (DSF-TFS) and Single-Sided Wind Tower (SSWT), were simulated through DesignBuilder version 4.5. Then, two types of additional ventilation systems were proposed in order to accelerate the airflow, including four-sided as well as multi-opening wind towers. The wind foldable directions were at about 45 degrees (northwest to southeast). The simulation results show that SSWT could have a better performance than the aforementioned systems by about 38%. Therefore, the multi-opening system was able to enhance the ventilation rate by approximately 10% during the summertime.

1. Introduction

The environment or, in other words, urban space, is one of the most vital factors affecting various aspects of people’s lives and human behavior. If urban spaces are not designed effectively, the results can be devastating [1]. Among the climatic elements, wind is of paramount importance to humid regions as well as passive houses, which are mostly designed to take advantage of climatic indicators. Owing to several factors and because it requires adaptation at the early design stage, applying wind as natural ventilation for cooling building blocks is quite challenging [2,3,4]. On this basis, the primary element acting as guidance for wind in urban areas is the density of the city pattern, which needs to be considered for natural ventilation throughout cities [5,6]. Previous research has proven that naturally ventilated buildings are significantly more suitable for occupants than buildings that have mechanical cooling systems [7,8]. Harnessing the cooling capacity of the surrounding air can dramatically lessen the demand for mechanical devices. Exploiting the potential of natural ventilation in buildings offers additional merits for buildings, the environment, and humans [9].
The main purpose of urban planners and architects is the spatial organization of urban functions as well as the appropriate use of urban land. Urban planners and designers often encounter the problem of having to deal with circumstances requiring difficult decisions based on various aspects that have to be considered by designers, i.e., climate, economics, culture, and context [10]. In November 1991, Iran’s Supreme Council for Planning and Architecture (ISCPA) approved a resolution regarding the formulation of policies and strategies necessary for master plans to effectively use national, urban, and rural lands in order to rationalize the size of cities and villages [11]. Moreover, this will enable determining population centers and striking an optimum balance between the population and size of cities, as well as meeting public needs and relevant regulations. The result of the aforementioned resolution was the ISCPA’s enactment of the criteria for preventing the urban growth boundary [12].
In fact, this agenda not only led cities to have a compact urban form but also caused overpopulation density as well as construction in the urban area, specifically in city centers. Hence, Yaran and Mehranfar [13] concluded that the urban planning and typology of buildings in Rasht is profoundly compact, which has resulted in the lack of wind motion, preventing airflow among building blocks and the lack of climatic orientation. These issues have given rise to the elimination of open space in building blocks due to the compact building density. This reveals that these laws have highly negative consequences. However, the environmental impact of buildings can be affected by the strict and erroneous legislation of governments [14]. Consequently, it is the architect’s duty to navigate these restrictions by providing practical solutions. The question arises of how designers can offer appropriate strategies without defying the previously mentioned criteria. However, no serious technical development has been taken yet by authorities or designers to address these issues.

Aims and Framework

Therefore, based on these restrictions, how can architects solve such problems in order to use wind potential appropriately? The research team assumed that the buildings’ envelope and top have the features necessary to gain climatic data elements. The main goal of this paper was to investigate an alternated design of wind towers. On this basis, primarily two types of systems are evaluated through simulation including the Single-Sided Wind Tower (SSWT) and Double-Skin Facade Twin Face System (DSF-TFS). Then, the performances of the proposed wind tower systems are discussed to determine which of these systems could have the optimal natural ventilation rate in indoor zones. In the second phase, the research team proposed two wind towers, which are introduced here as the four-sided and multi-opening systems, which are a form of wind tower used to analyze wind flow characteristics throughout internal zones based on their geometry of openings.
Therefore, this section of the paper investigates the impact of outlet openings of the proposed wind towers integrated into a sample case, which is in an urban boundary layer. One of the most vital factors of using these systems is that they are much more economical than other types of wind tower systems, because by altering the openings of the wind towers, a high enough natural ventilation rate can move inside the building. These systems can not only reduce the wind pressure but also increase the ventilation rate. Moreover, these systems are viable design alternatives for sustainable building techniques, since they provide additional ventilation rates using natural ventilation and diminish the demands of mechanical cooling systems. For further clarification of the processes, the research conceptual framework is provided in Figure 1.

2. Research Methodology

In the present study, the DesignBuilder software v.4.5 was employed. DesignBuilder is a user-friendly modeling environment where users can work with virtual building models. It provides a range of environmental performance data such as energy consumption, carbon emissions, comfort conditions, daylight illuminance, maximum summertime temperatures, and HVAC component sizes. DesignBuilder uses the EnergyPlus dynamic simulation engine to generate performance data [15]. This software uses EnergyPlus EPW (EnergyPlus Weather Data) to format hourly weather data for simulations. Through Meteonorm, the research team could extract Rasht’s EPW file and load it onto DesignBuilder.

2.1. Calculated Natural Ventilation Data

DesignBuilder has two general approaches to natural ventilation, and infiltration modeling depends on the setting of the natural ventilation model options Scheduled and Calculated. The scheduled natural ventilation is capable of making a reasonable estimate of the natural ventilation rates and infiltration rates in the building. However, the calculated model is used when natural ventilation and infiltration are going to calculate based on window openings, cracks, buoyancy, and wind-driven pressure. According to the objectives of the present study and proposed strategies, we used the calculated natural ventilation model, which makes the simulation more accurate.
To calculate the natural ventilation during summertime through simulation of a large building, reduce the number of cracks in the model, and increase the simulation speed, model infiltration was switched off. Thereafter, the natural ventilation option on the heating and cooling system (HVAC) tab is switched on to ensure that sufficient flow paths exist. The control mode is another option that DesignBuilder offers upon HVAC tab model data for calculating natural ventilation. This feature defines the way that the openings are open and close based on air temperatures or enthalpy. Table 1 indicates further details.
In the following, the actual natural ventilation rate at any one time in the simulation is calculated by multiplying the maximum natural ventilation rate (ac/h) by the value of the operation schedule. The ventilation rate (q) through each opening in the model is calculated based on the pressure difference using wind and stack pressure effects:
q = C   ×   ( D P ) n
where
  • q is the volumetric flow through the opening.
  • DP is the pressure difference across the opening.
  • n is the flow exponent varying between 0.5 for fully turbulent flow and 1.0 for fully laminar flow.
  • C is the flow coefficient, which is related to the size of the opening.
The EnergyPlus engine utilizes these data to calculate the modulation of openings (window or door) in the building. In addition, the heating and cooling system (HVAC) configuration is disabled during the simulation process. The air current between openings and corridors is modeled with an exchange of equal value of air in between indoor spaces. It is necessary to specify each zones’ functionality in the activity tab. Thus, DesignBuilder has an option to determine the activity templates as a source of building usage data for building models, which should be specified for each zone. Through this tab, the types of zone functions were characterized during the simulation, based on the actual plan. Data on the Activity tab allow users to define the activity (usage) of the zones including information such as occupancy, metabolic rates, and so on. The metabolic rate determines the amount of indoor heat gain per person in the zone under design conditions, which accounts for people of various sizes such as 1.00 for men, 0.85 for women, and 0.75 for children [16]. Consequently, the research team uses an average value of 0.9 due to there being a mix of sizes.

2.2. Study Area Description

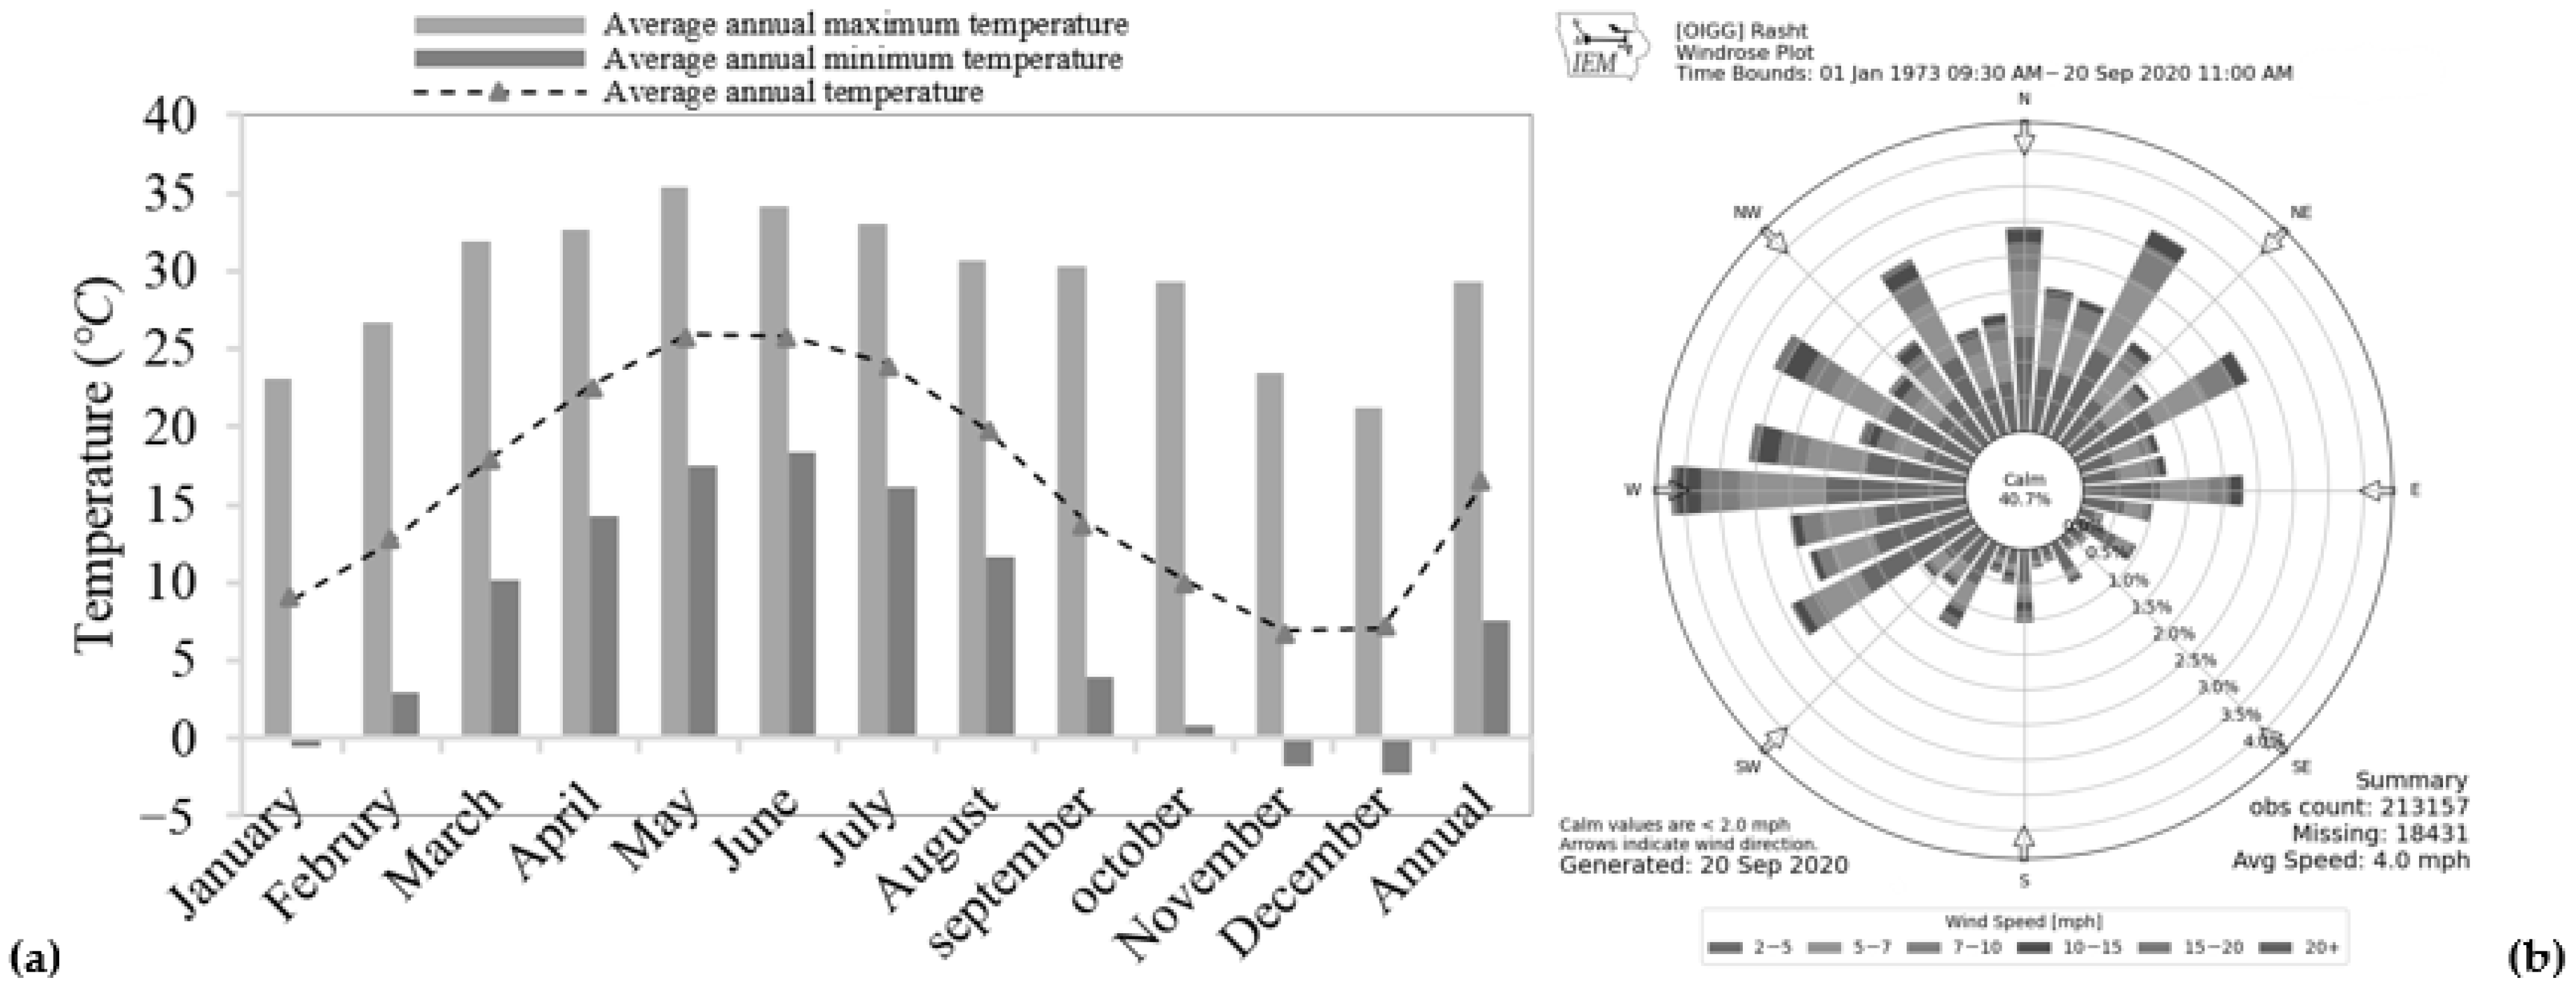
The latitude of Rasht is 37.280834, and the longitude is 49.583057. Rasht is located in the north of Iran with the GPS coordinates of 37°16′51.0024″ North and 49°34′59.0052″ East. Among the Köppen climate classification that was proposed by a German–Russian climatologist Wladimir Köppen, Rasht is characterized in a subtype of Cfa (c: cold summer, f: no dry season, and a: hot summer) humid subtropical climate zone [17]. According to the statics of the Iran meteorological organization, the highest maximum temperature of Rasht is around 38 °C in summer and around 3 °C in winter, the average annual rainfall is about 1200 mm, the highest relative humidity was reported at 80.9%, and the average wind speed was measured at 1.7 m/s. The range of the highest, lowest, and average temperature as well as the annual wind direction as the wind rose is depicted in Figure 2.

2.3. Outline of the Sample Case

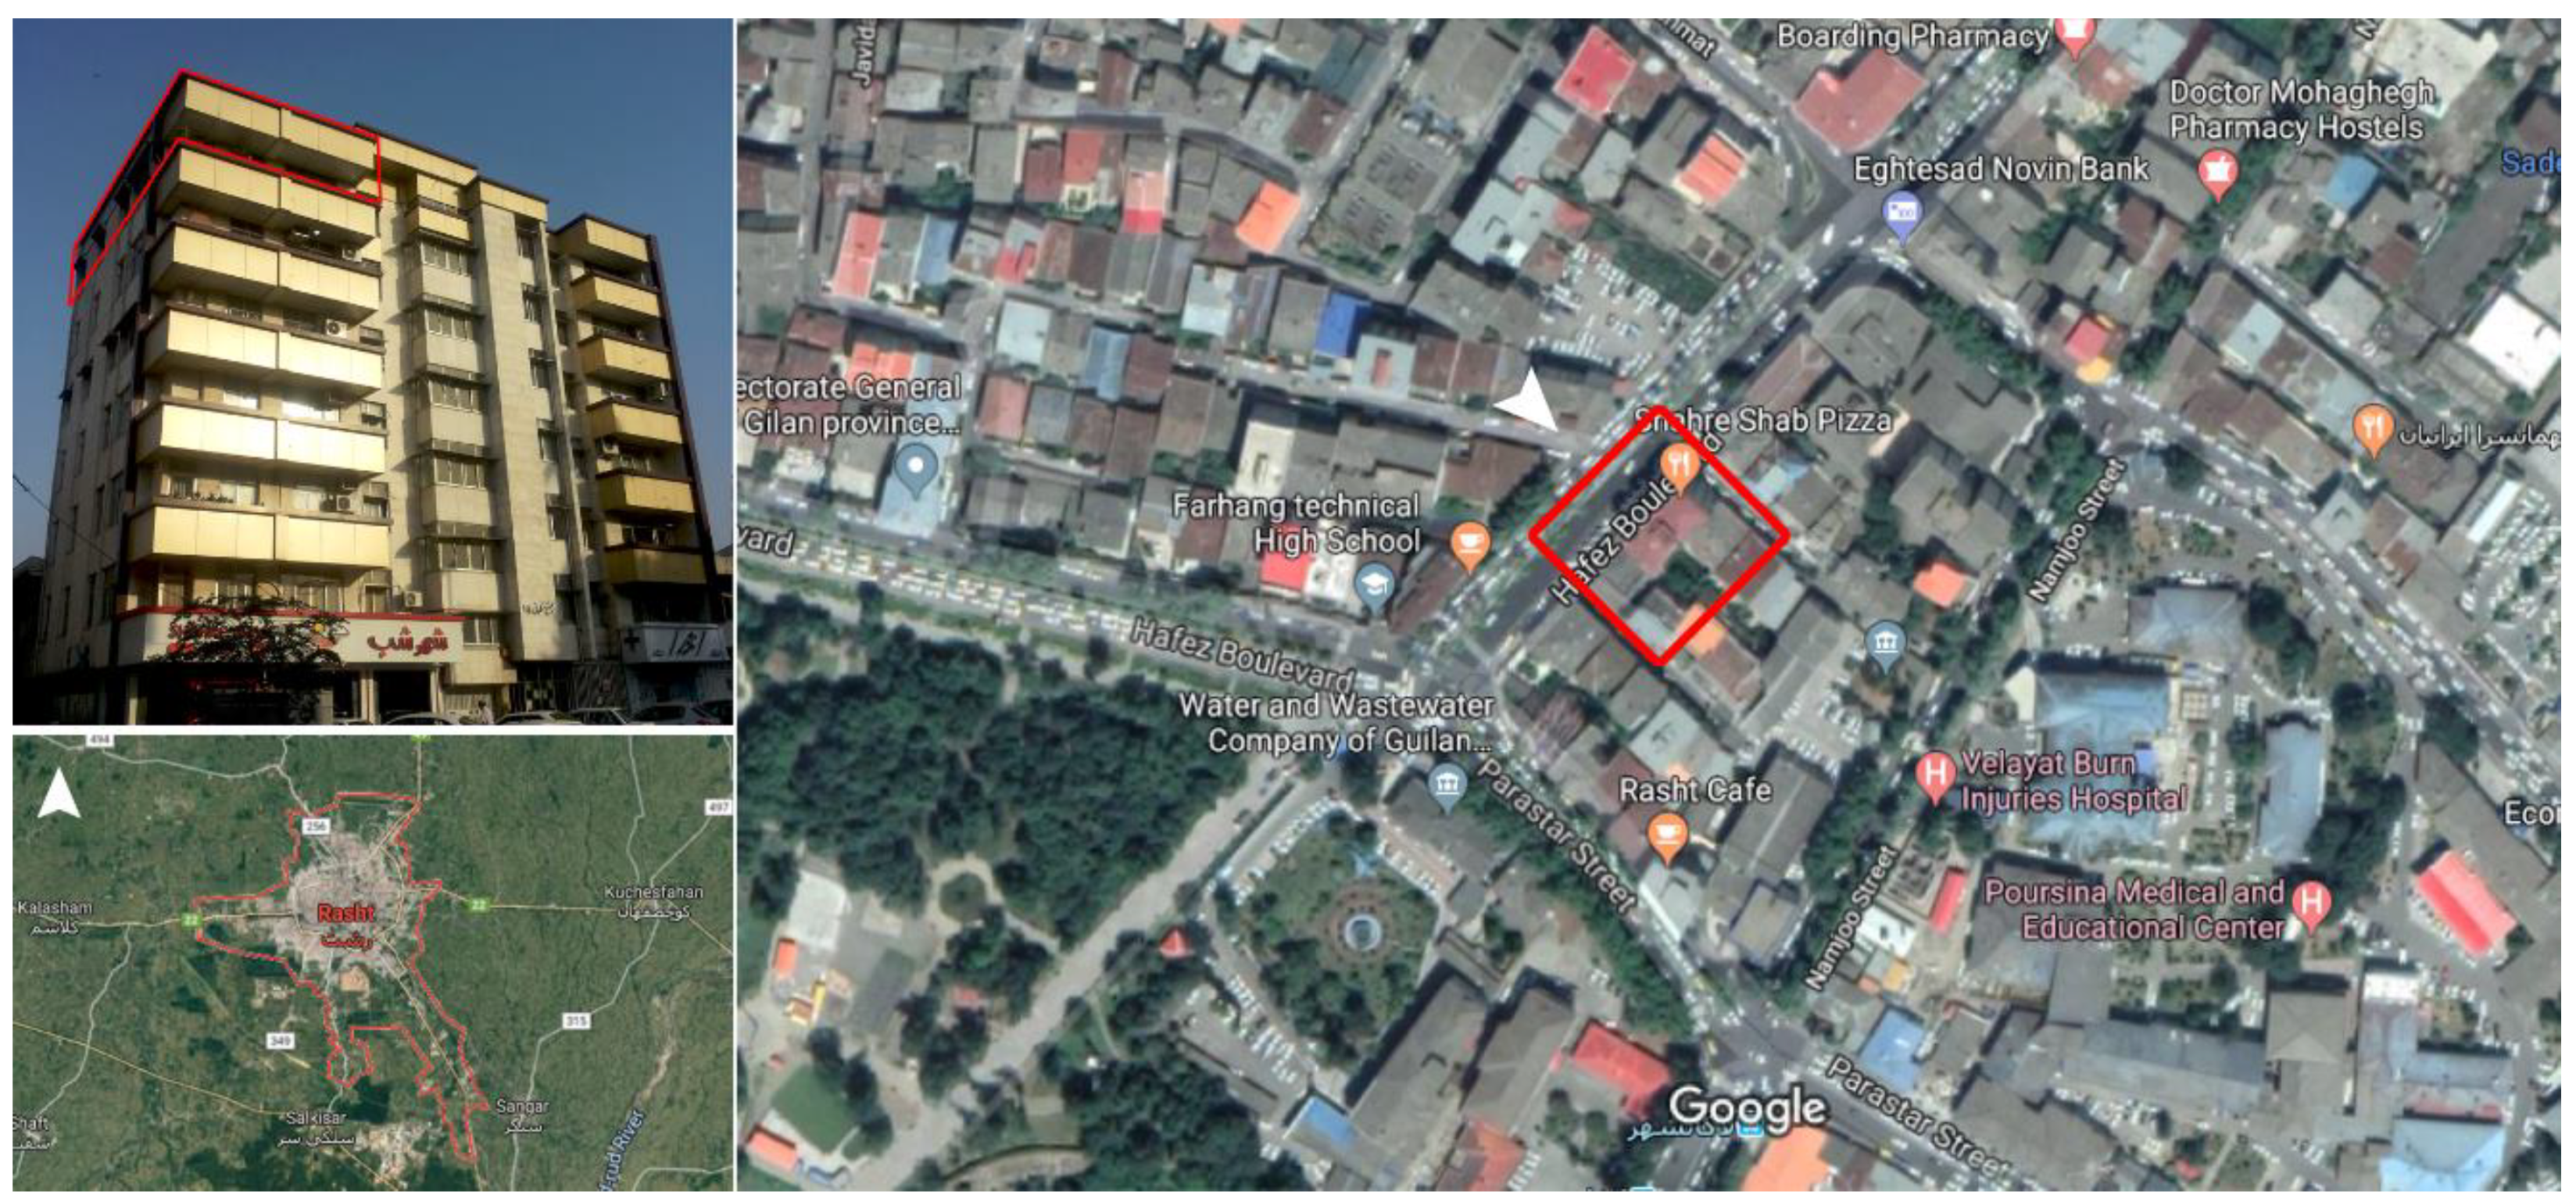
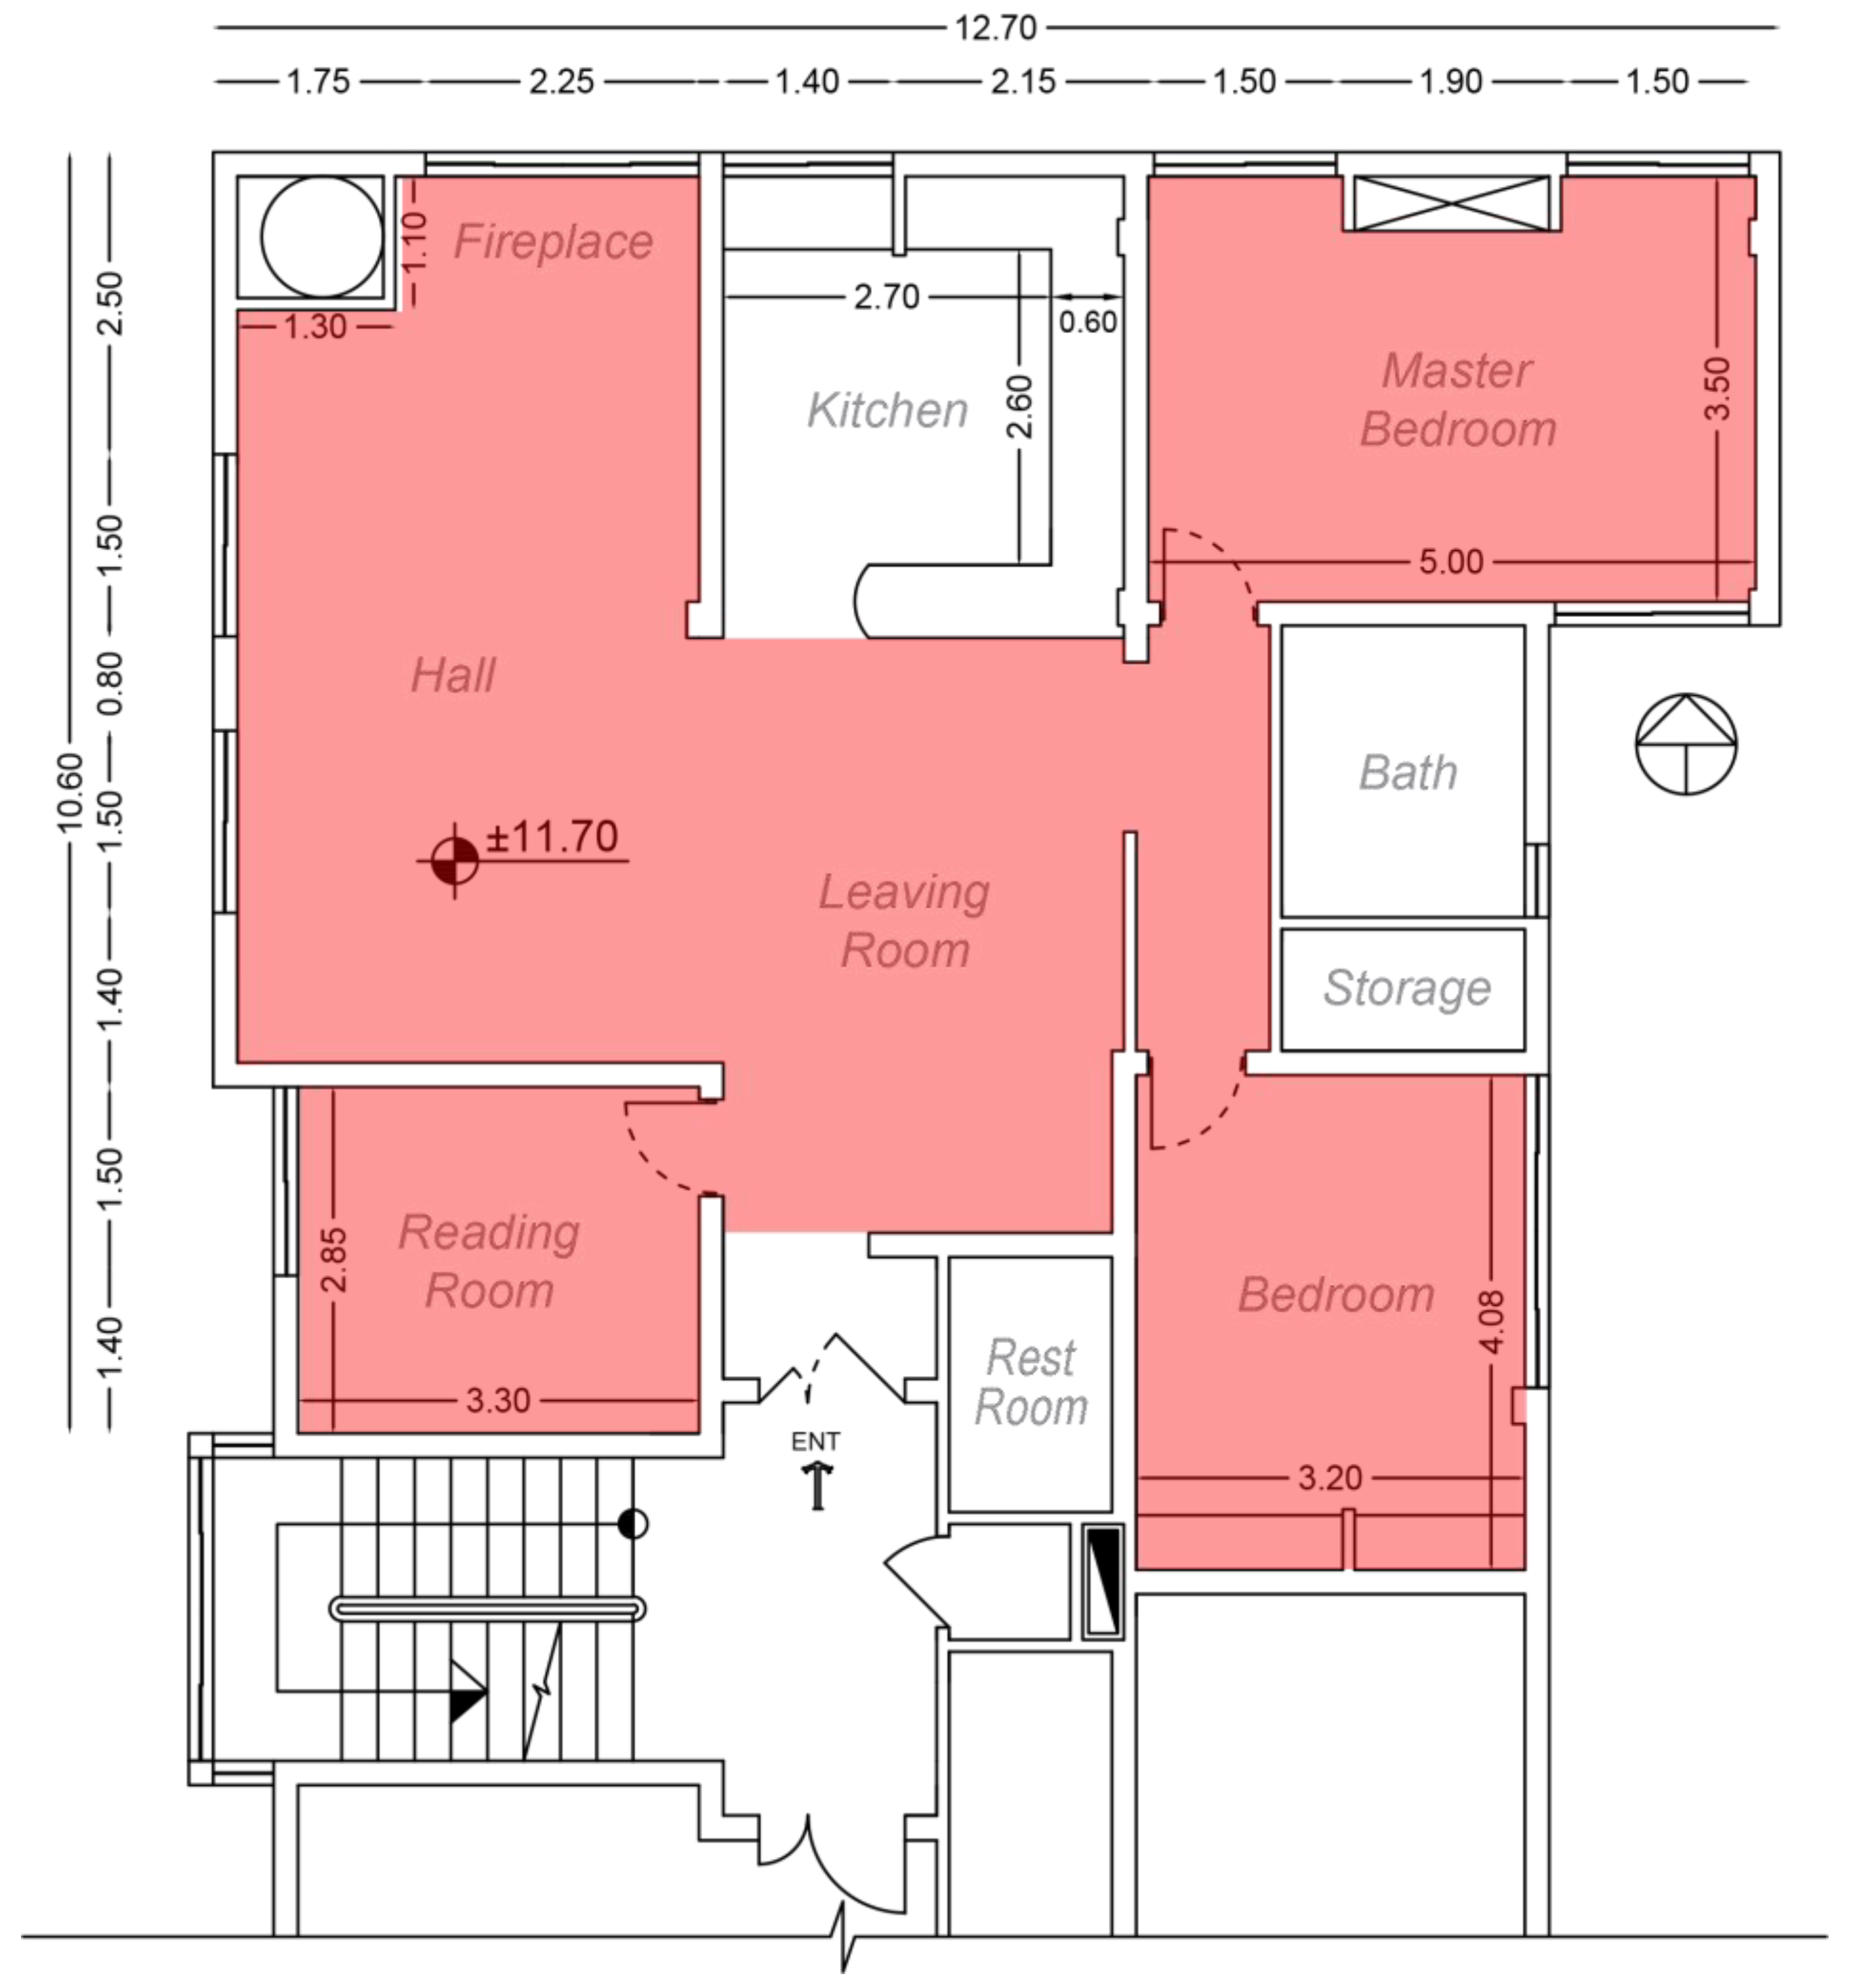
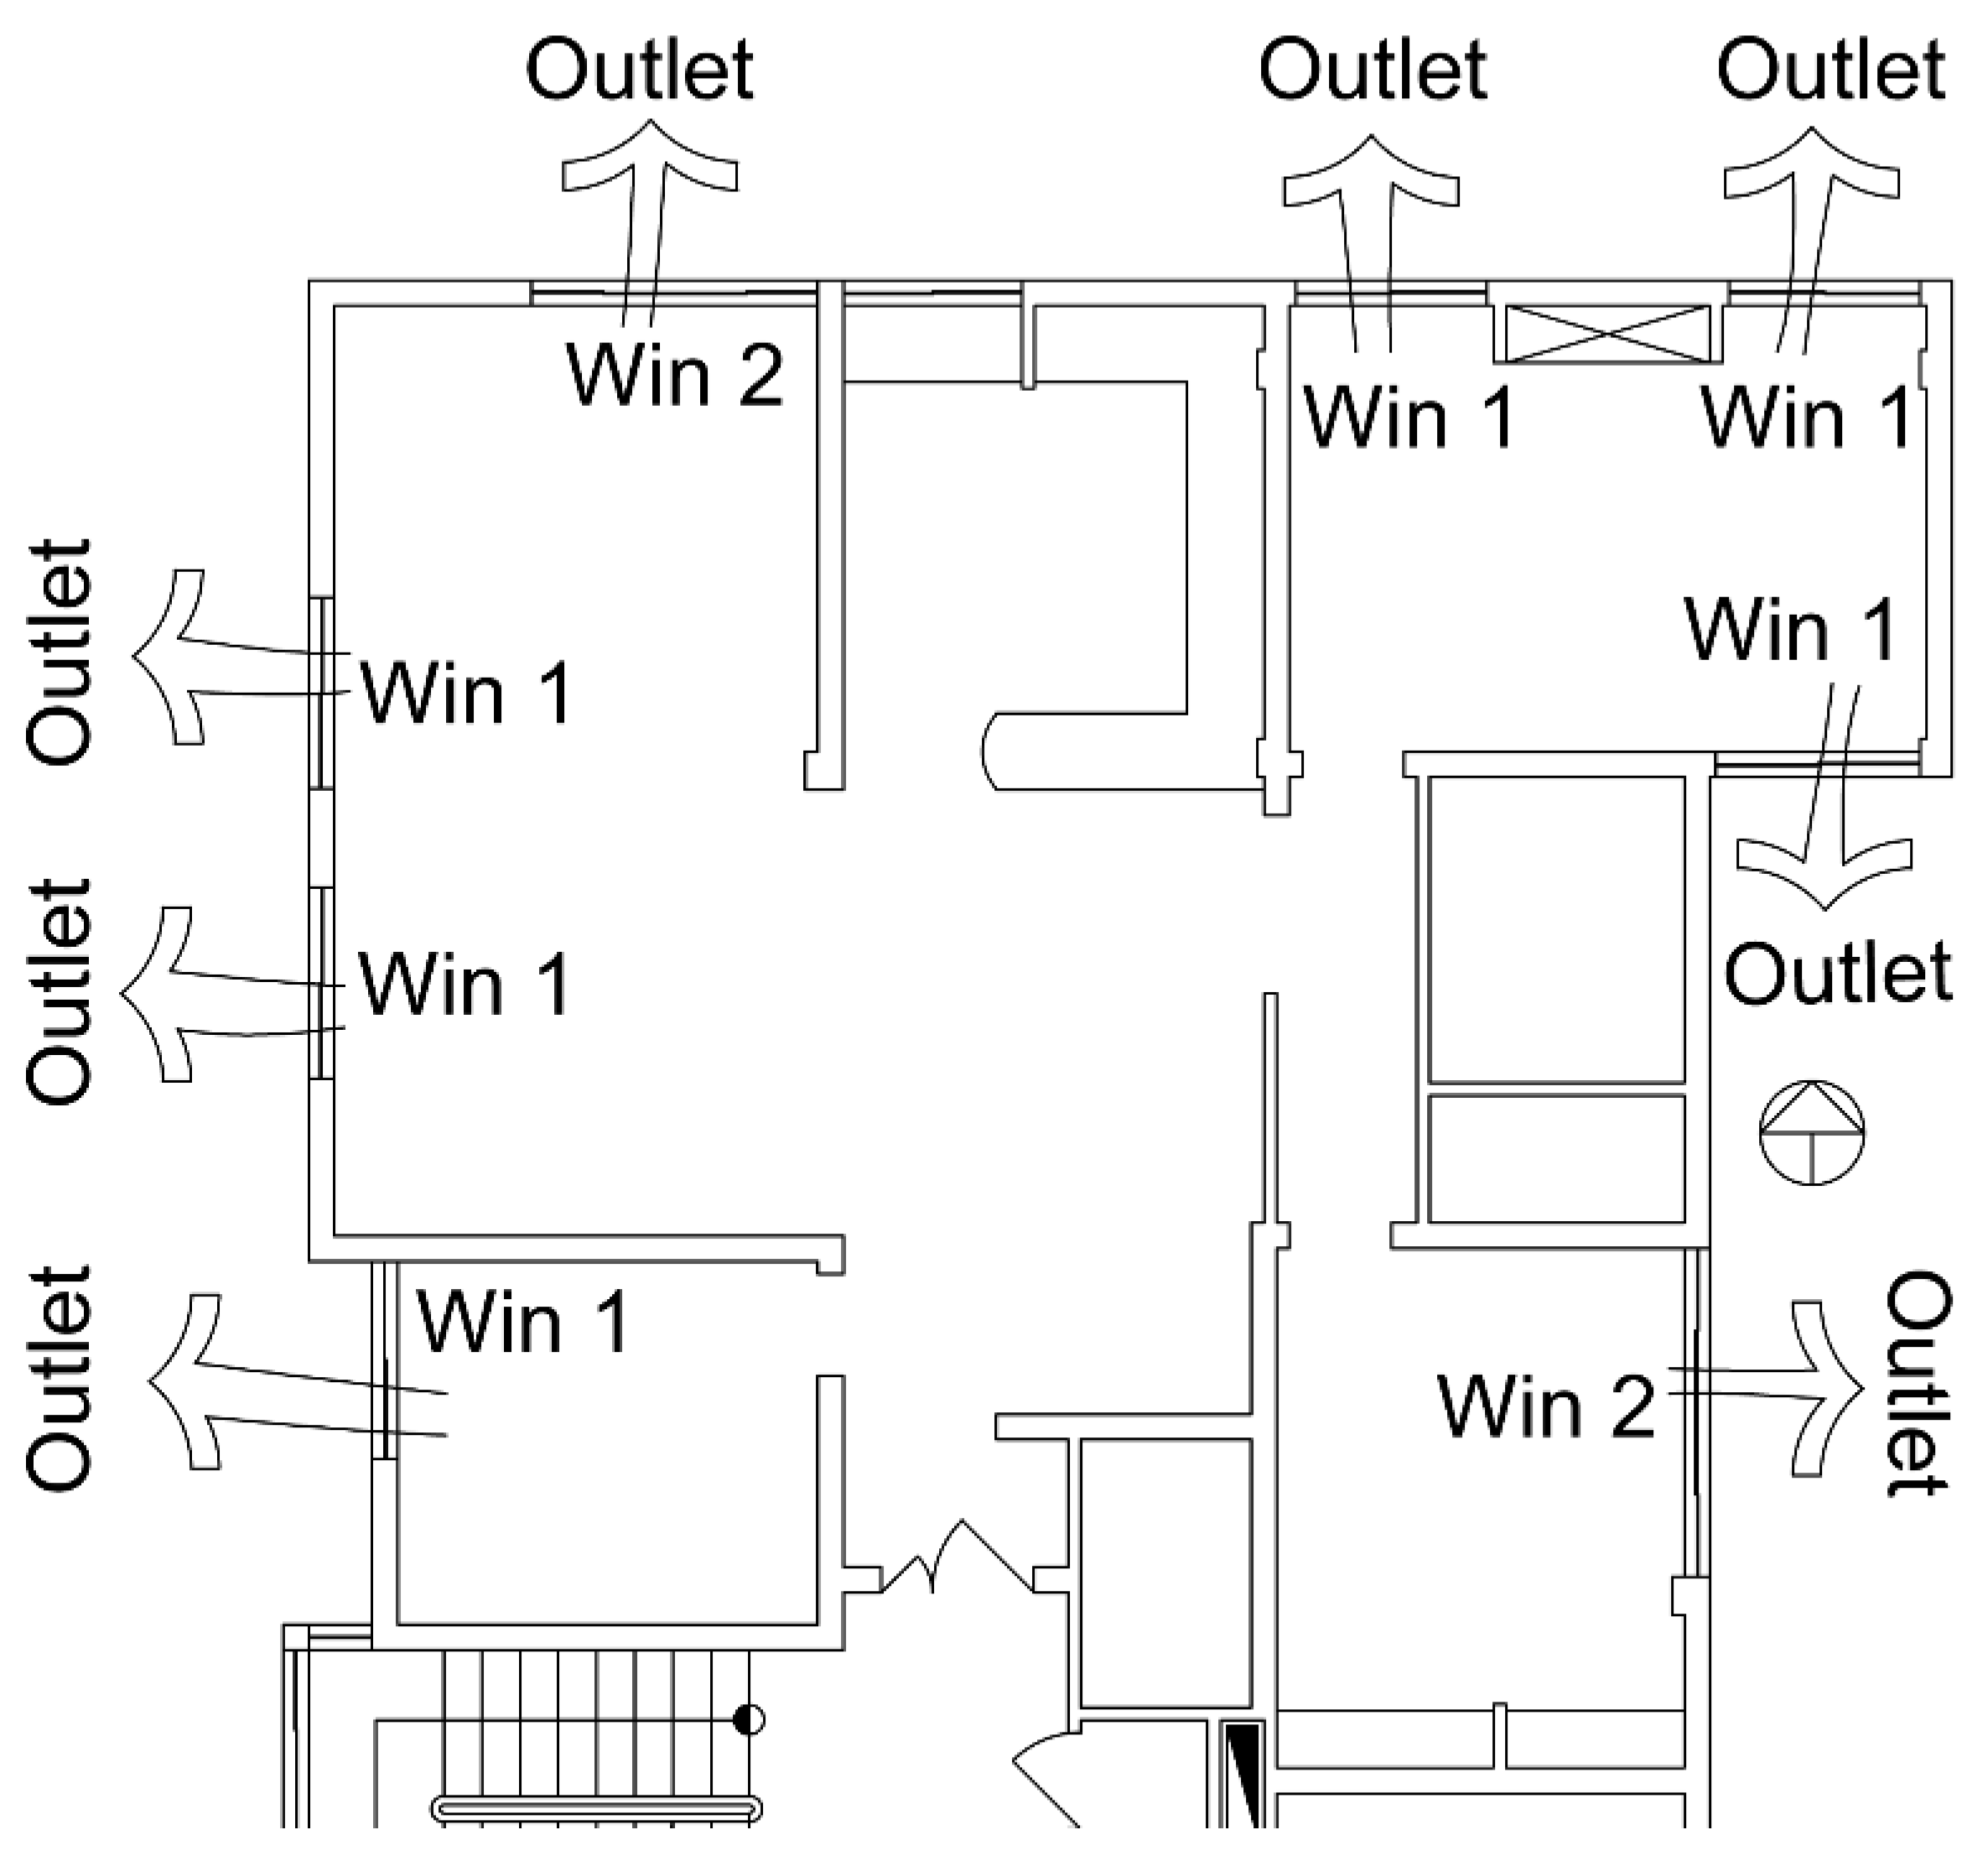
Based on a field measurement of the site and construction characteristics of the residential buildings, which were built in Rasht, the building was assumed to be located in an open urban area and be taller than the neighboring buildings, and the implementability of both double-skin face and wind tower systems was assumed as well in order to test the research objectives. The sample case is a six-story residential building located in Hafez Street, Rasht. There are nine zones included a master bedroom (17 m2), child bedroom (13 m2), study room (10 m2), living room (16 m2), hall (28 m2), kitchen (12 m2), storage (2 m2), bathroom (5 m2), and rest room (3 m2). Figure 3 indicates the location of the sample case on the map. Due to the nature of the sample case, the zones containing a master bedroom, child bedroom, study room, living room, and hall were considered during the calculation, which are highlighted with red color in Figure 4. The key building materials and additional actual building specifications are listed in Table 2. The selected building has the same plans throughout its floors, and this feature enables designers to develop the proposed strategies in this paper and apply them to all of the floors in an integrated and uniform manner.

3. Data Analysis

3.1. Single-Sided Wind Tower (SSWT)

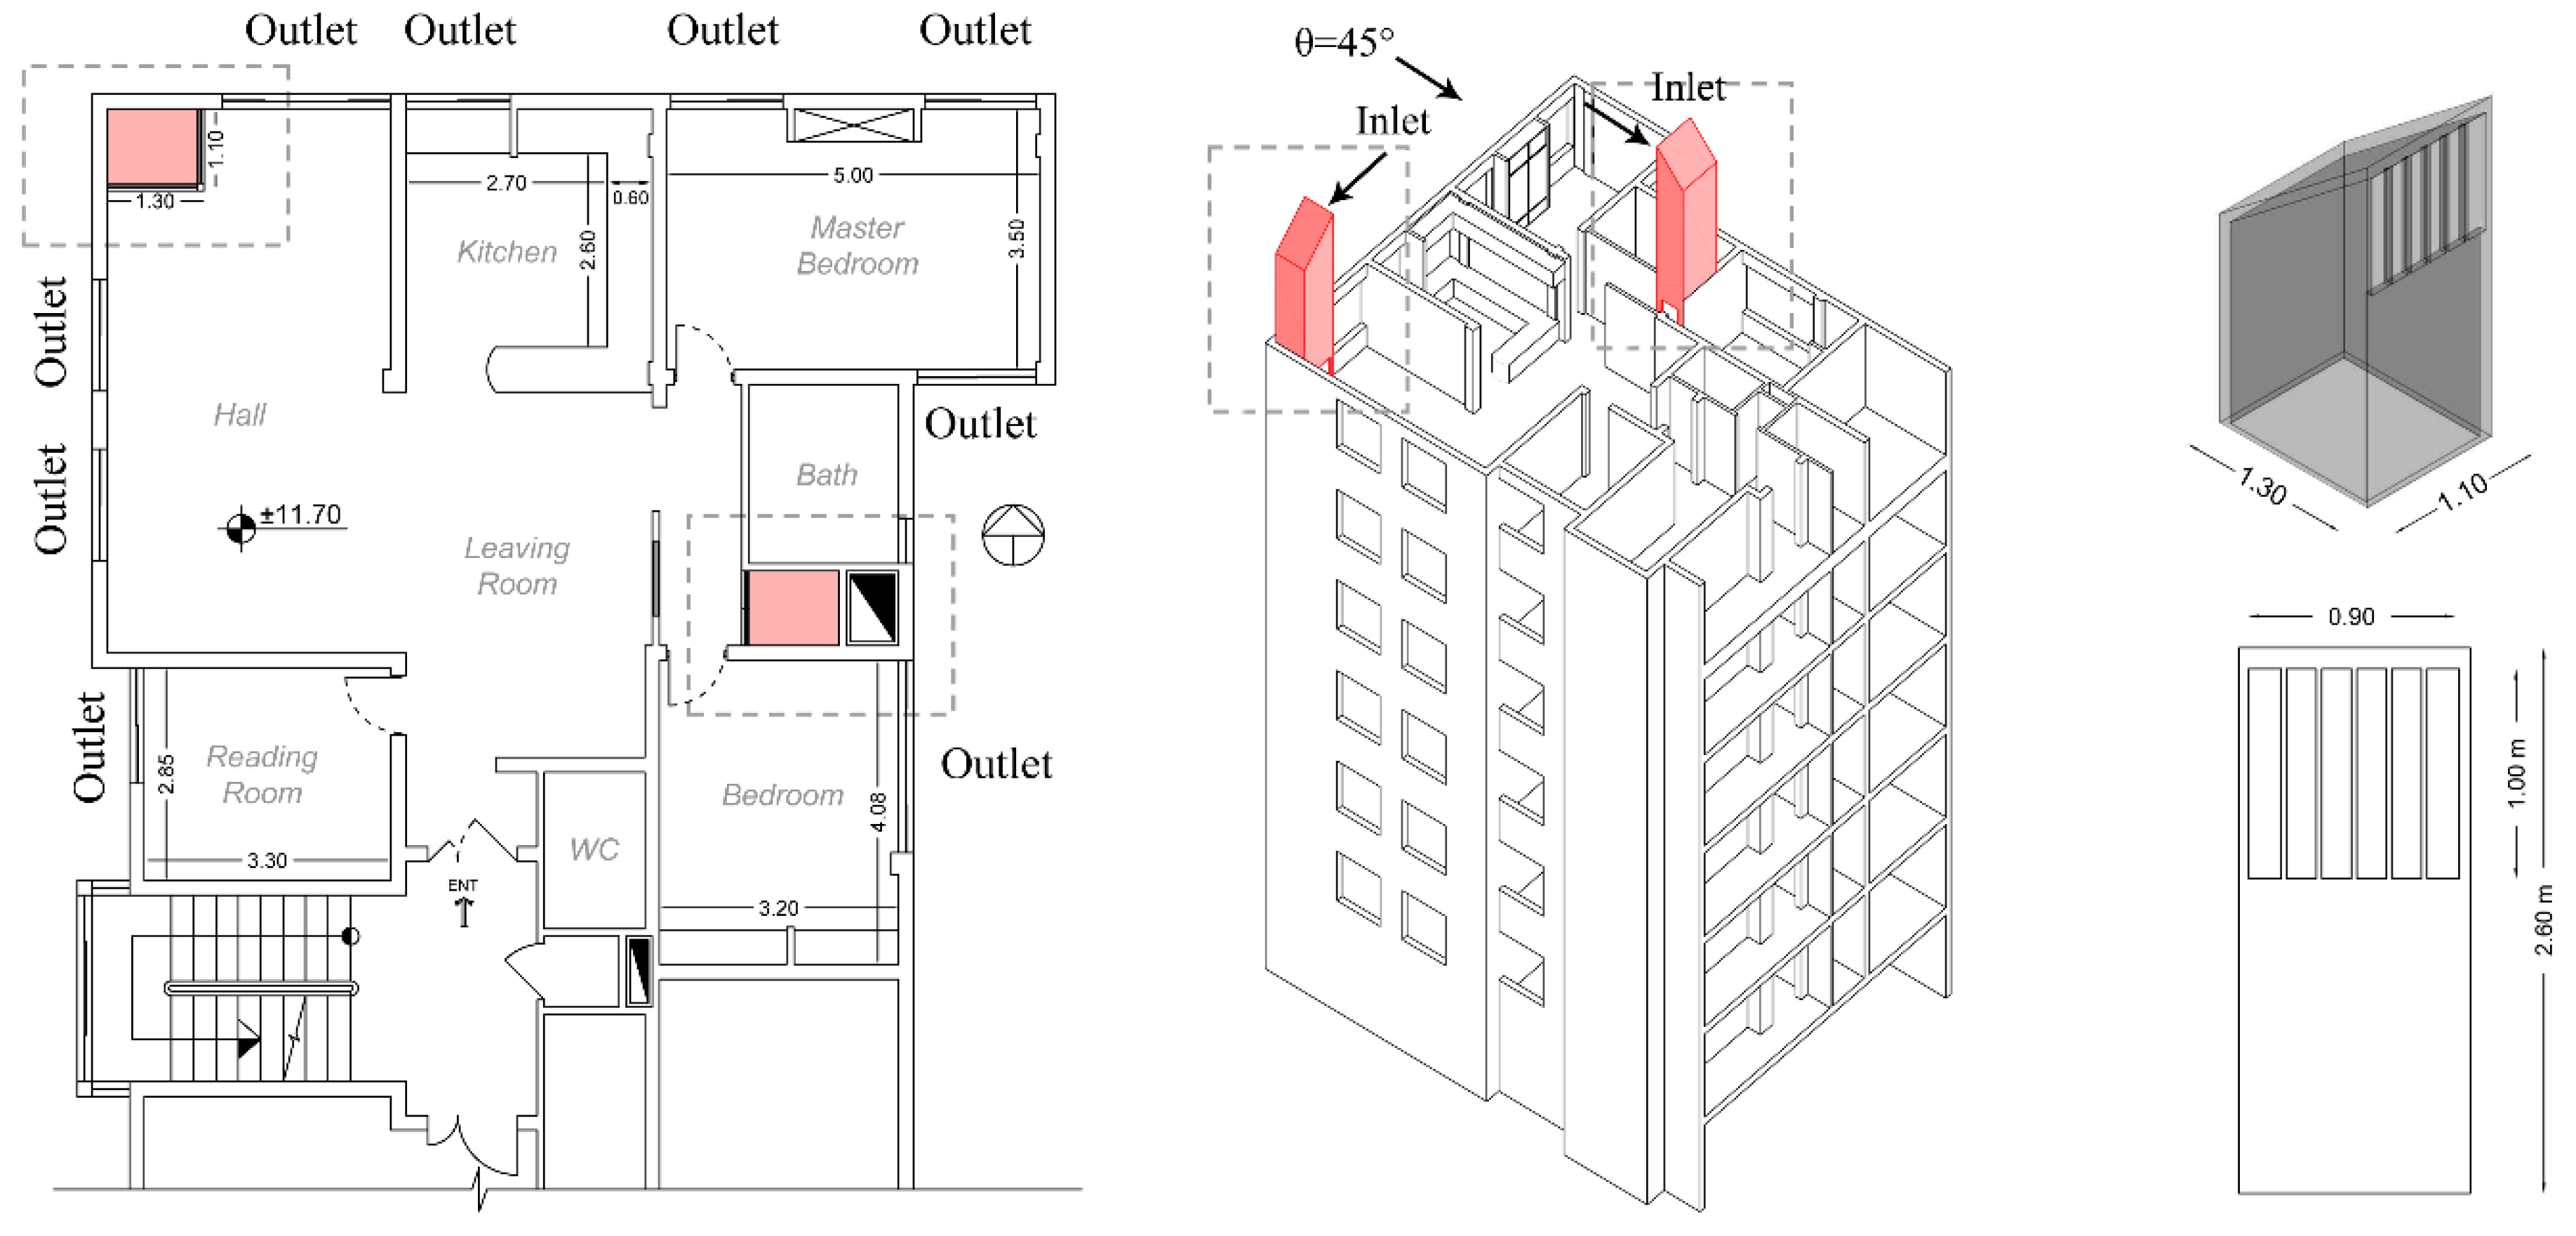
A wind tower is defined as rising airflow in the stack ventilation system due to the lower density of the warm air related to the surrounding air. The air is moving due to pressure gradient force. When wind pressure is different from one spot to another, a difference in pressure exists. The warm air tends to move upward to exit from the ventilation systems outlets and is replaced with cooler air, which comes from lower levels. This phenomenon, which is called the stack ventilation effect, is more severe during the winter in comparison with summer, which can improve the natural ventilation. In the present sample case, a Single-Sided Wind Tower (SSWT) was applied in two separated locations (Figure 5).
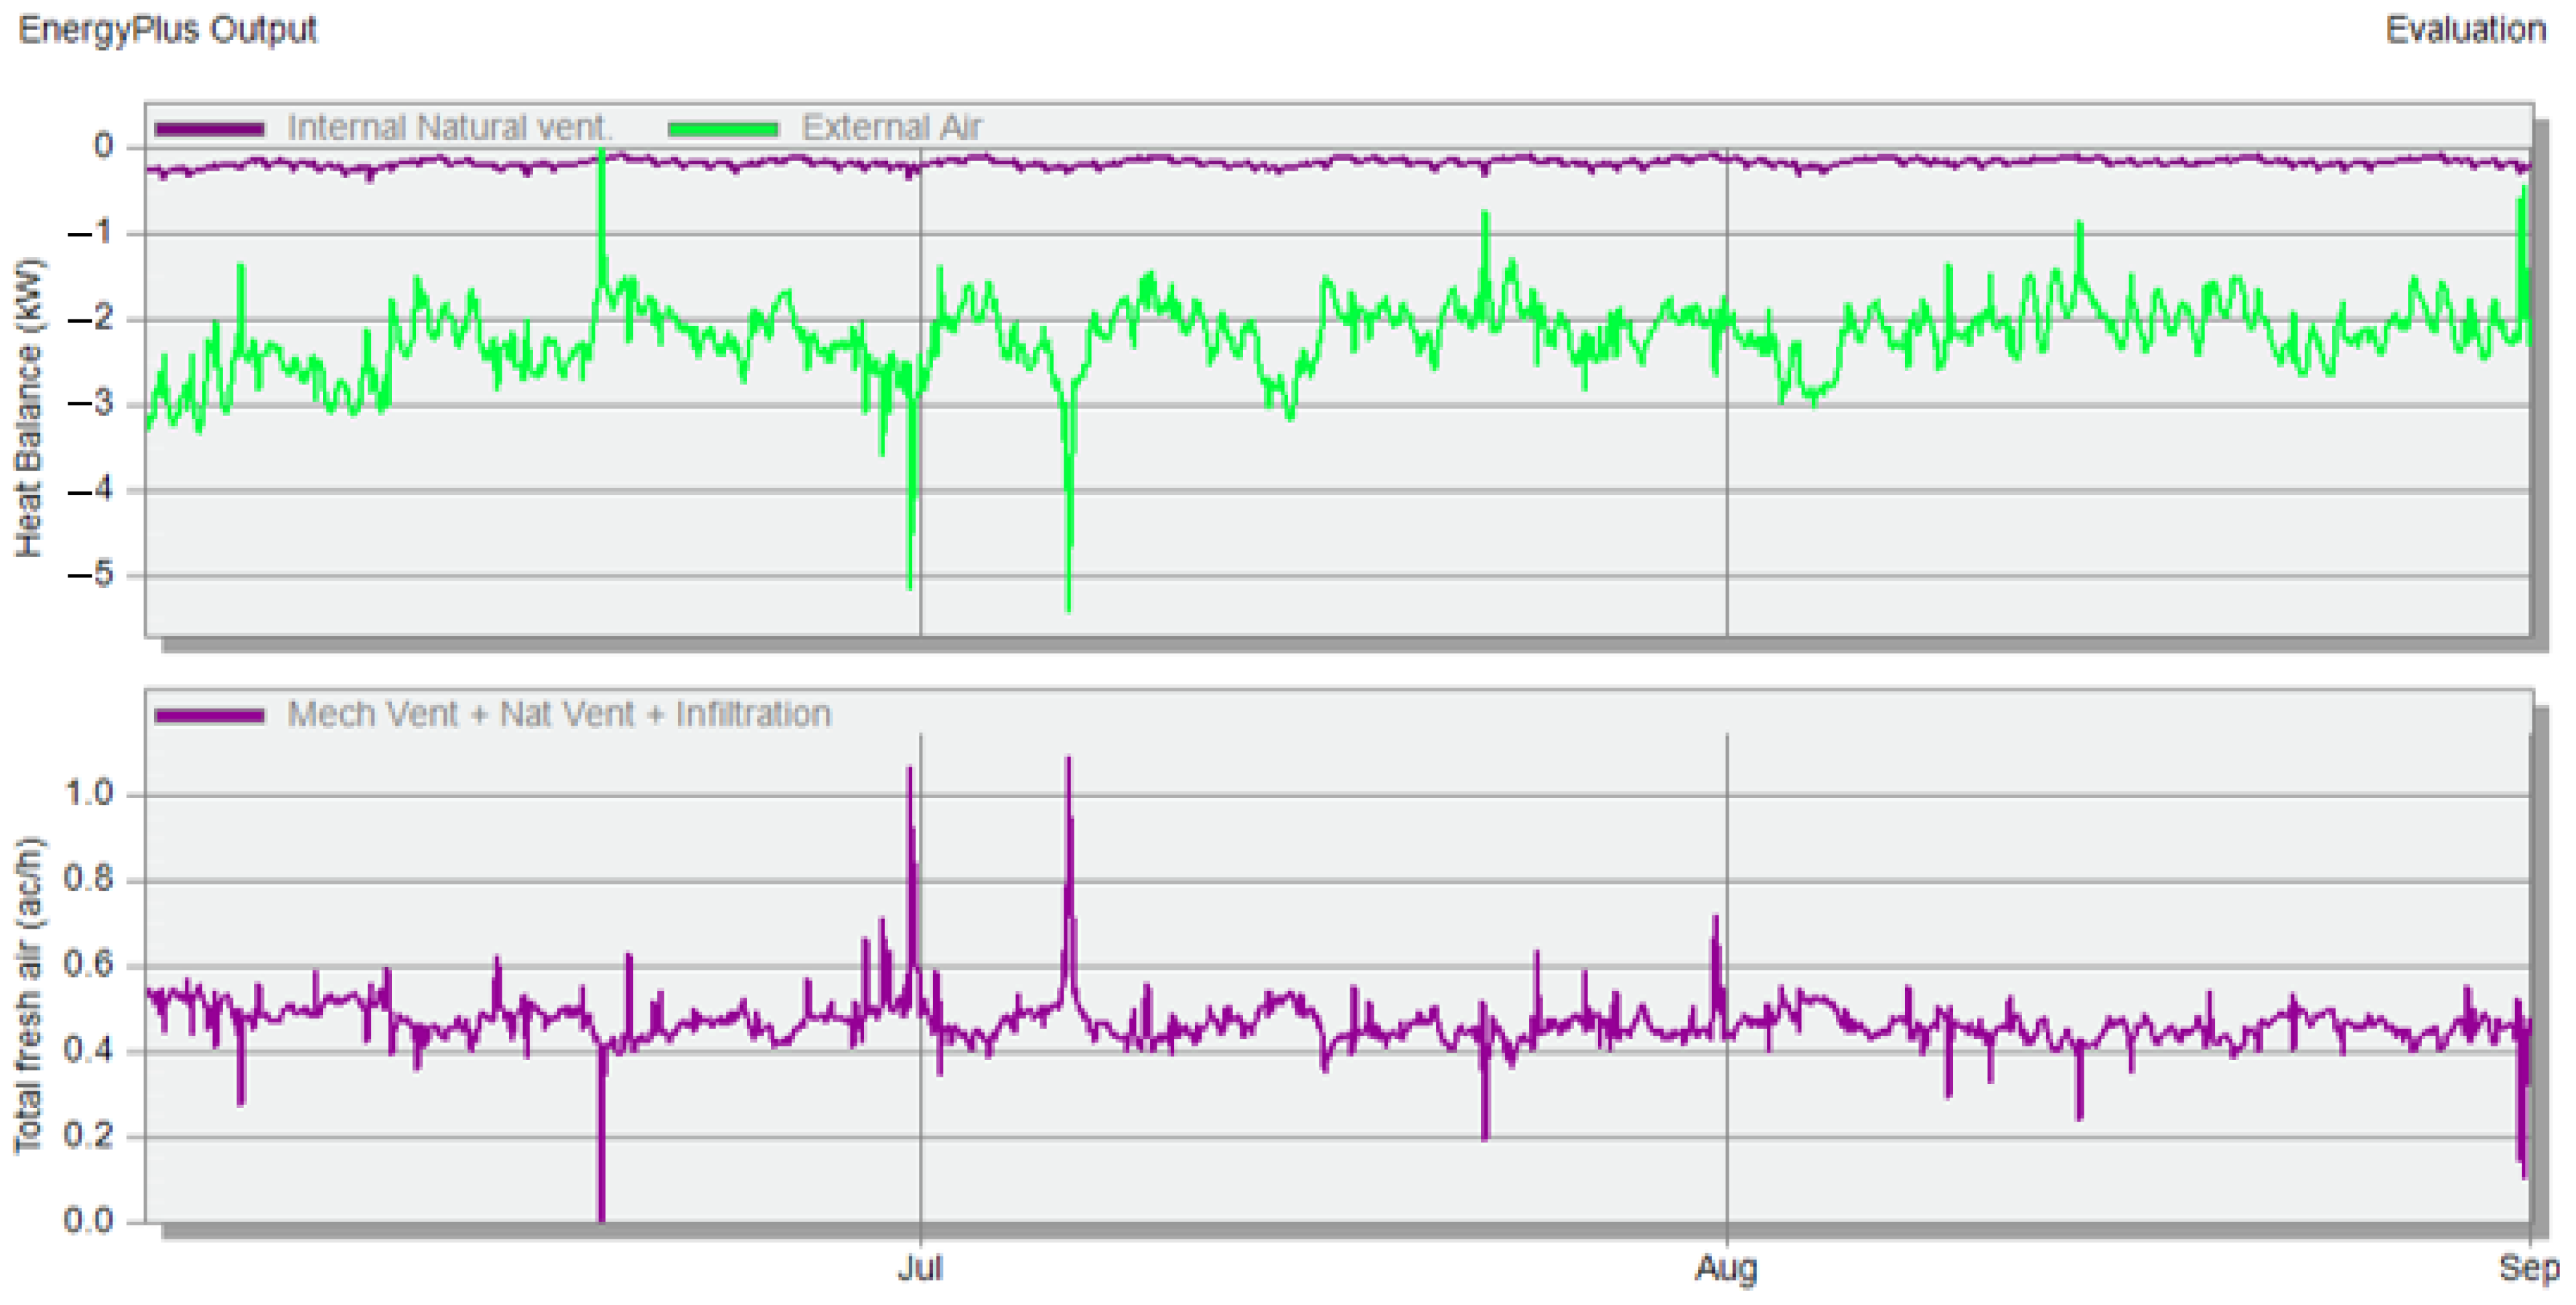
According to Figure 5, a base sample of a wind tower window W × H included Win 1 = 1.50 × 1.50 m and Win 2 = 2.50 × 1.5 m. The wind tower height in the rooftop is 2.60 m, in which the inlet opening area of the one-sided model has width and height proportions of 1 × 0.9 m2, respectively (Ainlet = 0.9 m2). For those wind towers, the areas of the openings are the same (Ainlet = 1.8 m2) and the proportions of outlet openings area for those wind towers are considered to be equal as well (Ainlet = Aoutlet 1.8 m2). Fresh air is taken in from the wind towers’ openings, passes through the occupant spaces, and is discharged into the zones. It is finally exhausted from the outlets. In the following, an angle ( θ = 45 ° ) has been allocated to the surface facing the wind, which is based on the annual favorable wind of Rasht. The analysis and simulation of the natural ventilation in the solar stack ventilation system are contemplated as shown in Figure 6.

3.2. Double-Skin Façade: Twin Face System (DSF-TFS)

For decades, utilizing a Double-Skin Facade (DSF) has increased in buildings. This system is an element of buildings consisting of two skins placed in such a way that allows airflow to the intermediate cavity. This system offers several merits, including natural ventilation, air renewal, providing a healthier environment, and promoting not only indoor air quality but also human thermal comfort [18]. The DSBs have a single sliding glass skin or double glazing, which may be either naturally or mechanically ventilated. The airflow between the cavities functions as insulation against temperature extremes, wind, and sound. Sun shading devices are often located between the two skins. There are numerous variations in the construction types for DSBs; in this research, due to sample case limitations, the Twin Face System is used (Figure 7).
Shameri et al. [19] conducted a review study regarding DSF and examined various positive aspects of this system such as optimization, glare, cost, durability, natural ventilation [20], daylighting [21], energy efficiency [22], and aspects on the facade. DSFs have recently become common in some countries, enabling the possibility of controlling the temperature, wind, rain, and sound as well. Due to the importance of this system, a plethora of studies illustrate the positive aspects of this system. Table 3 introduces a brief summary of them.
The DSF-TFS in DesignBuilder was modeled with geometric proportions based on the actual specifications of the sample case. A ventilated cavity, having a width that can range several centimeters, is located between these two skins. The DSF-TFS system was plugged into the main body and facade, and the cavity distance to the main body was considered at 0.60 m [32,33]. There were various essential considerations when modeling DSB in DesignBuilder during the simulation process. Primarily, the zone type on the activity tab was set to the cavity because a zone should be identified as unoccupied (Figure 8).
Shading devices may be included. These systems must have an interior space of at least 0.50 to 0.60 m to permit cleaning, which may be distinguished from both buffers and extract air systems by their inclusion of openings in the skin to allow for natural ventilation. The single-glazed outer skin is used primarily for the protection of the air cavity contents (shading devices) from the weather. With this system, the internal skin offers insulating properties to minimize heat loss. The outer glass skin is used to block the wind at heights and allow interior openings for fresh air without the associated noise [34]. The performance of DSF-TFS was that the windows open automatically when residents occupied the zones. Figure 9 shows the results of the simulation of the DSF.

4. Research Findings Based on the Simulation Results

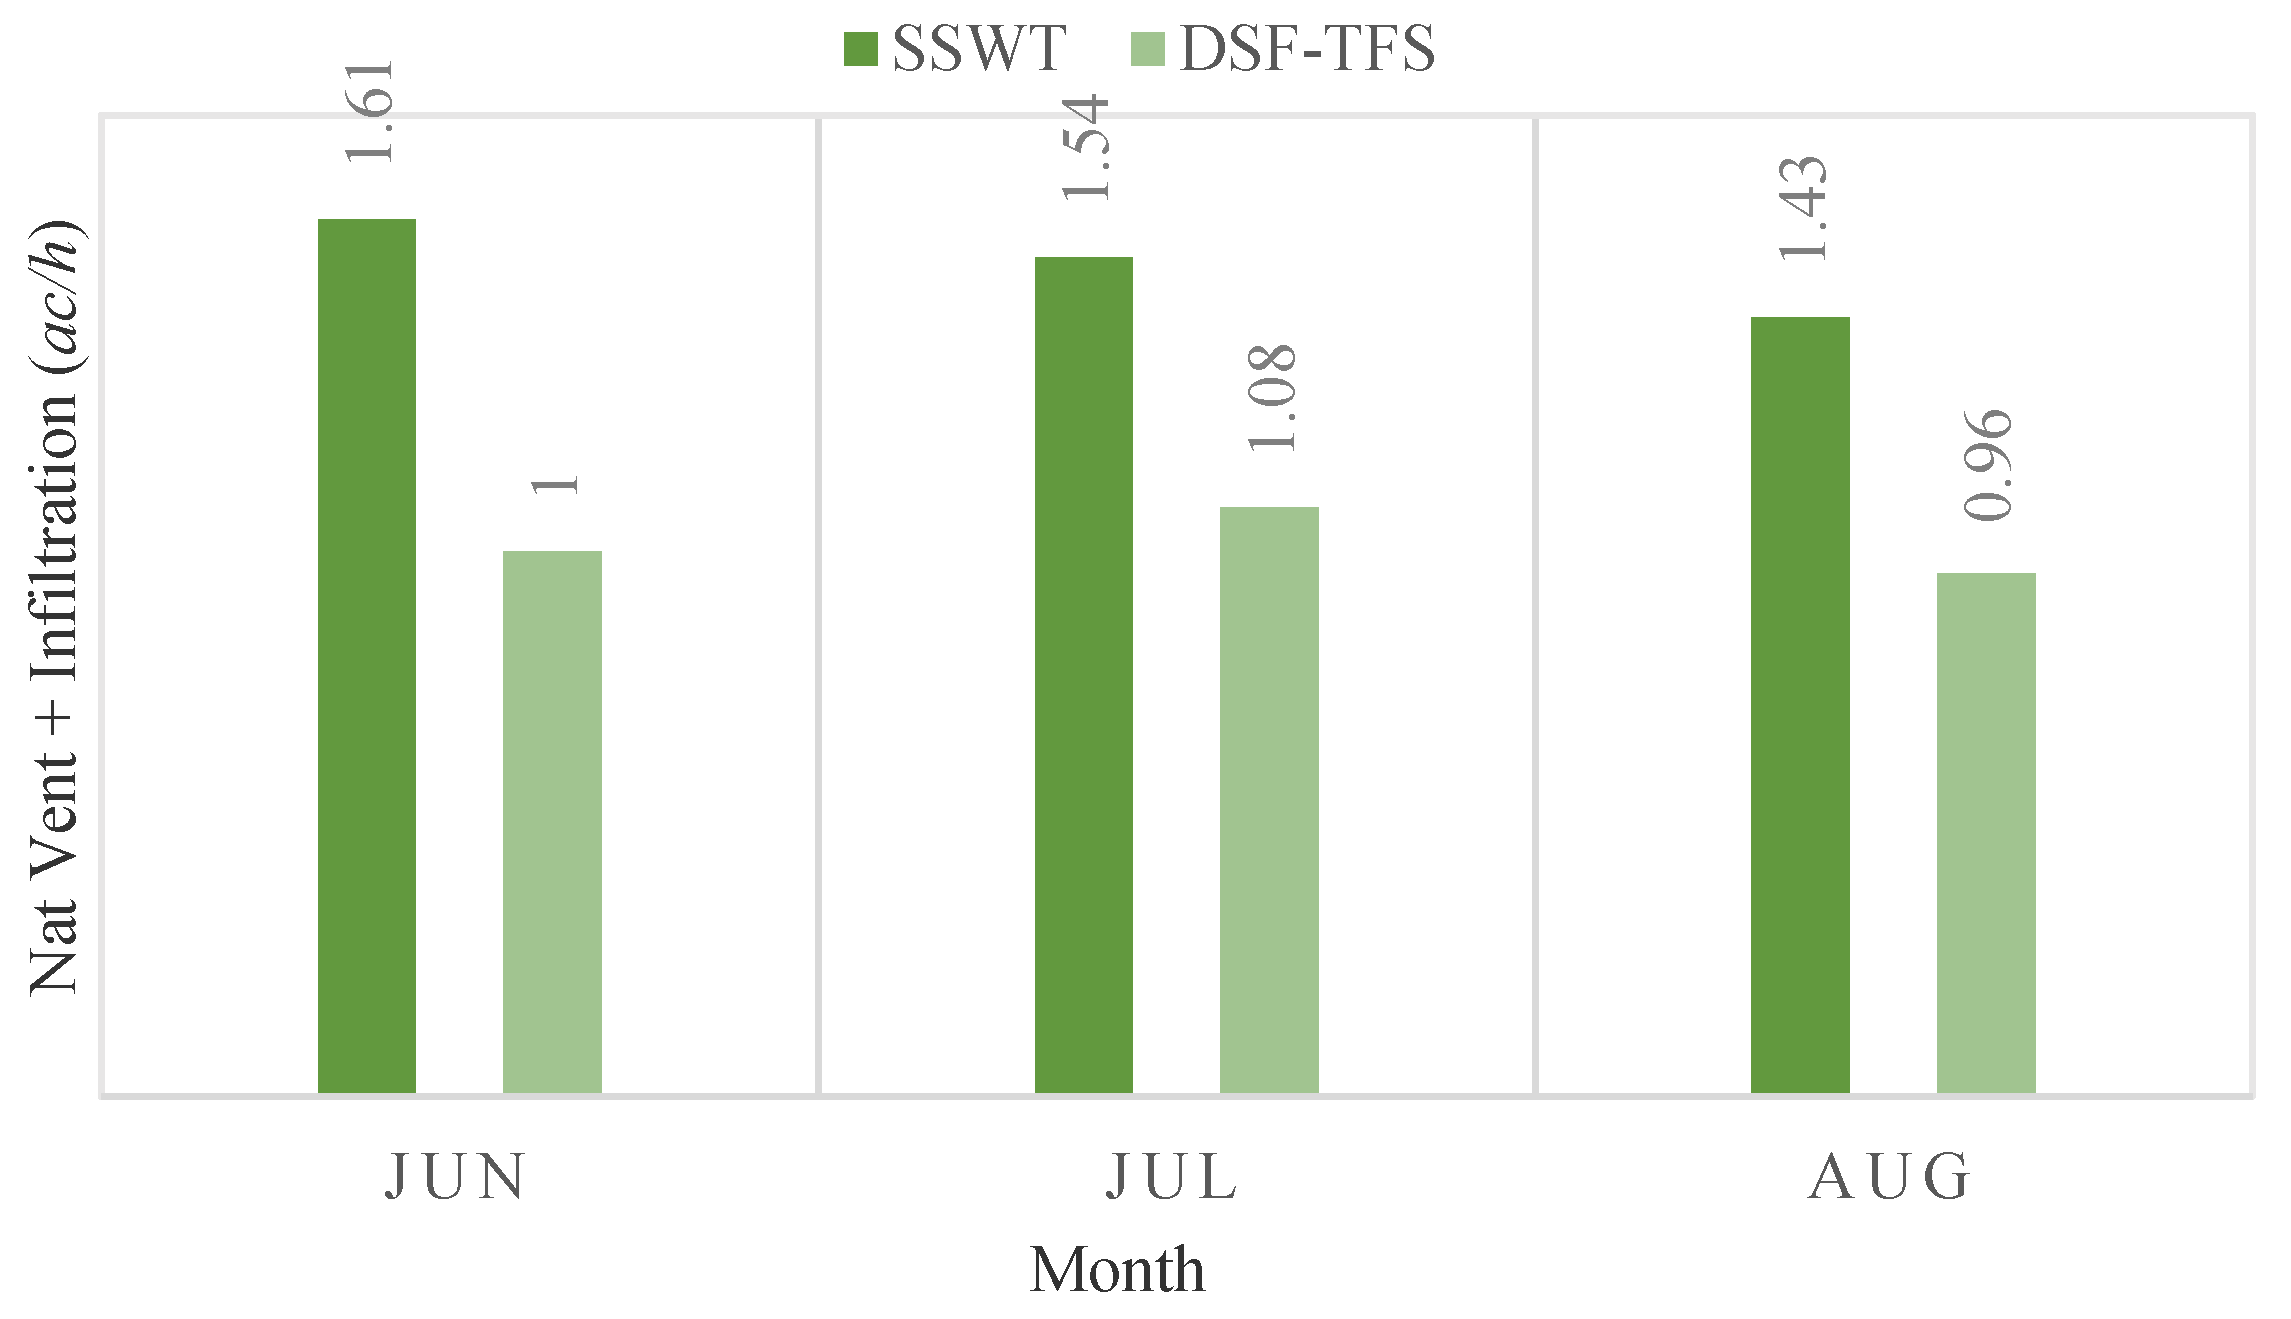
Specifications for inlet and outlet openings, equipment, and people occupancy (based on design assumptions) were set into the software. Simulation outputs were hourly, daily, and monthly graphed. Then, monthly outputs in the minimum and maximum levels were discussed (Figure 10).
According to Figure 10, there is a downward trend of ventilation and wind flow rates from the beginning to the end of June. The peak is also seen at the end of July and early August, which is when the air conditioning rate dropped significantly. The ventilation rate in the DSF-TFS was dramatically higher at the beginning of July, which is even higher than the wind tower. However, in August, it reduced by almost half and reached its minimum level in September. Furthermore, it can be stated that the performance of the DSF-TFS was maximal in early July. It should be noted that this amount reached its lowest level in August and September. In a preliminary summary, it was observed that all systems had similarly good ventilation performance at the beginning of July, with the same rate falling in the other two months. In order to clarify the results of these systems, charts were compared monthly in each system (Figure 11).
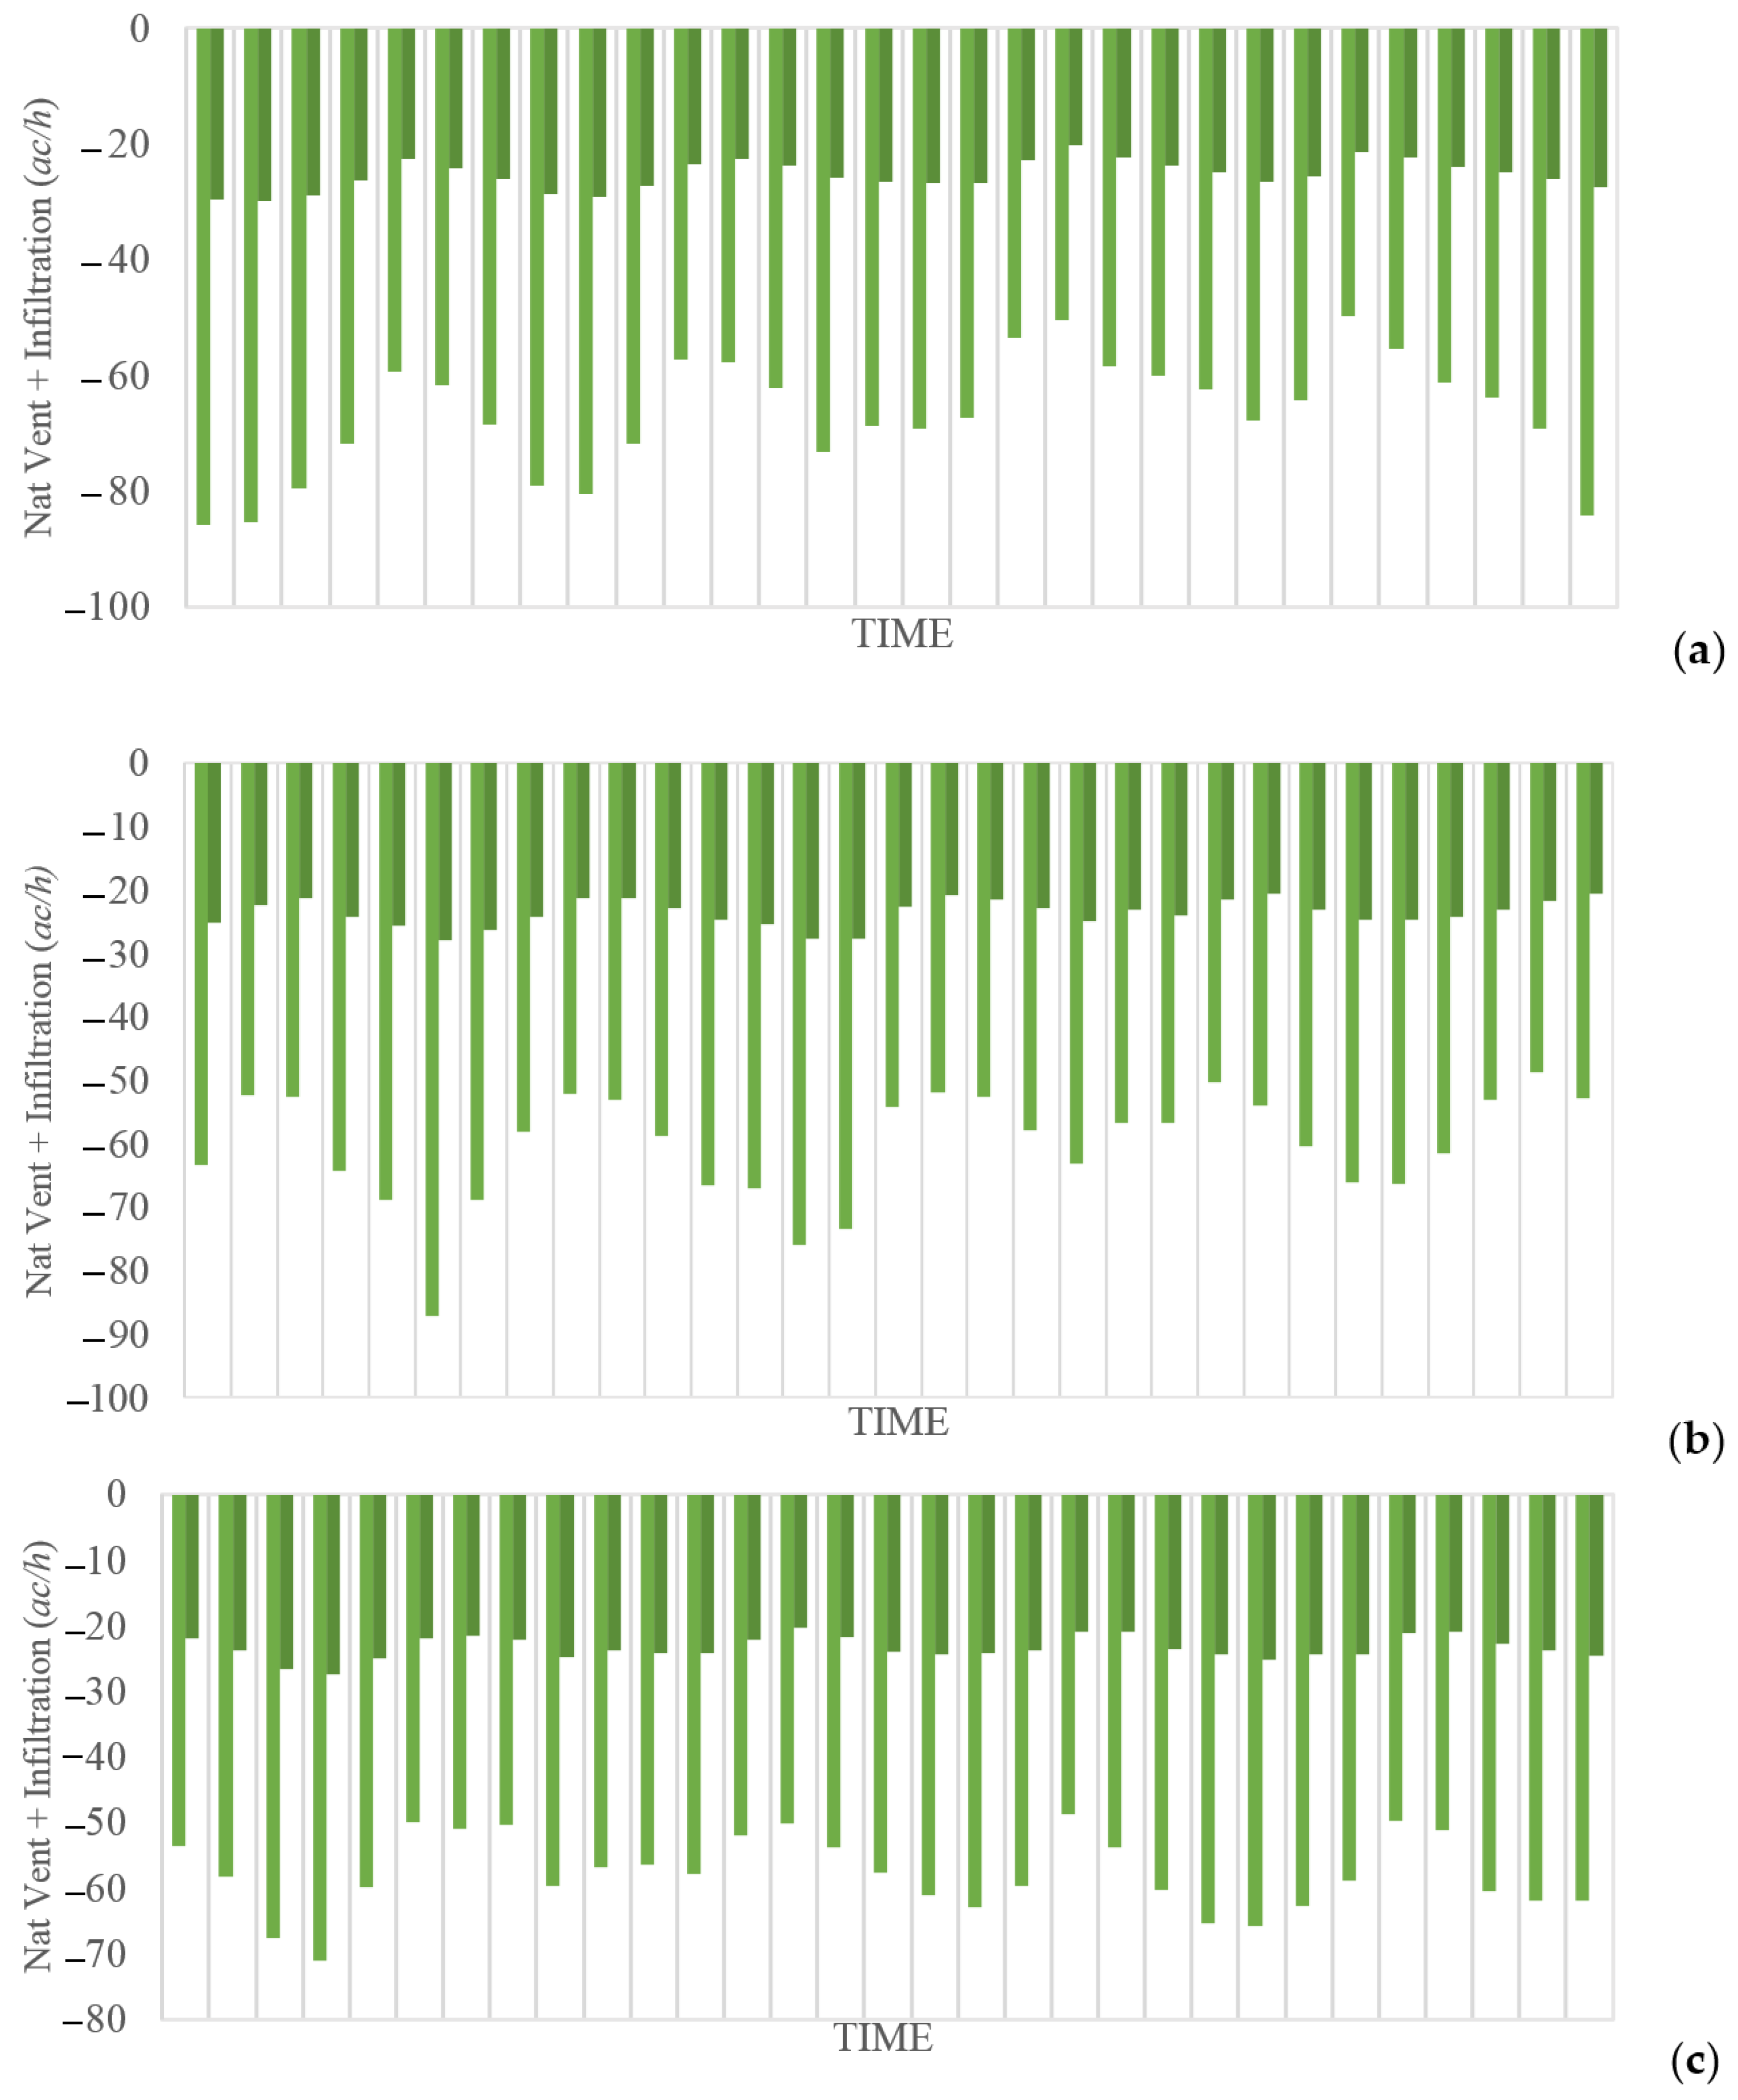
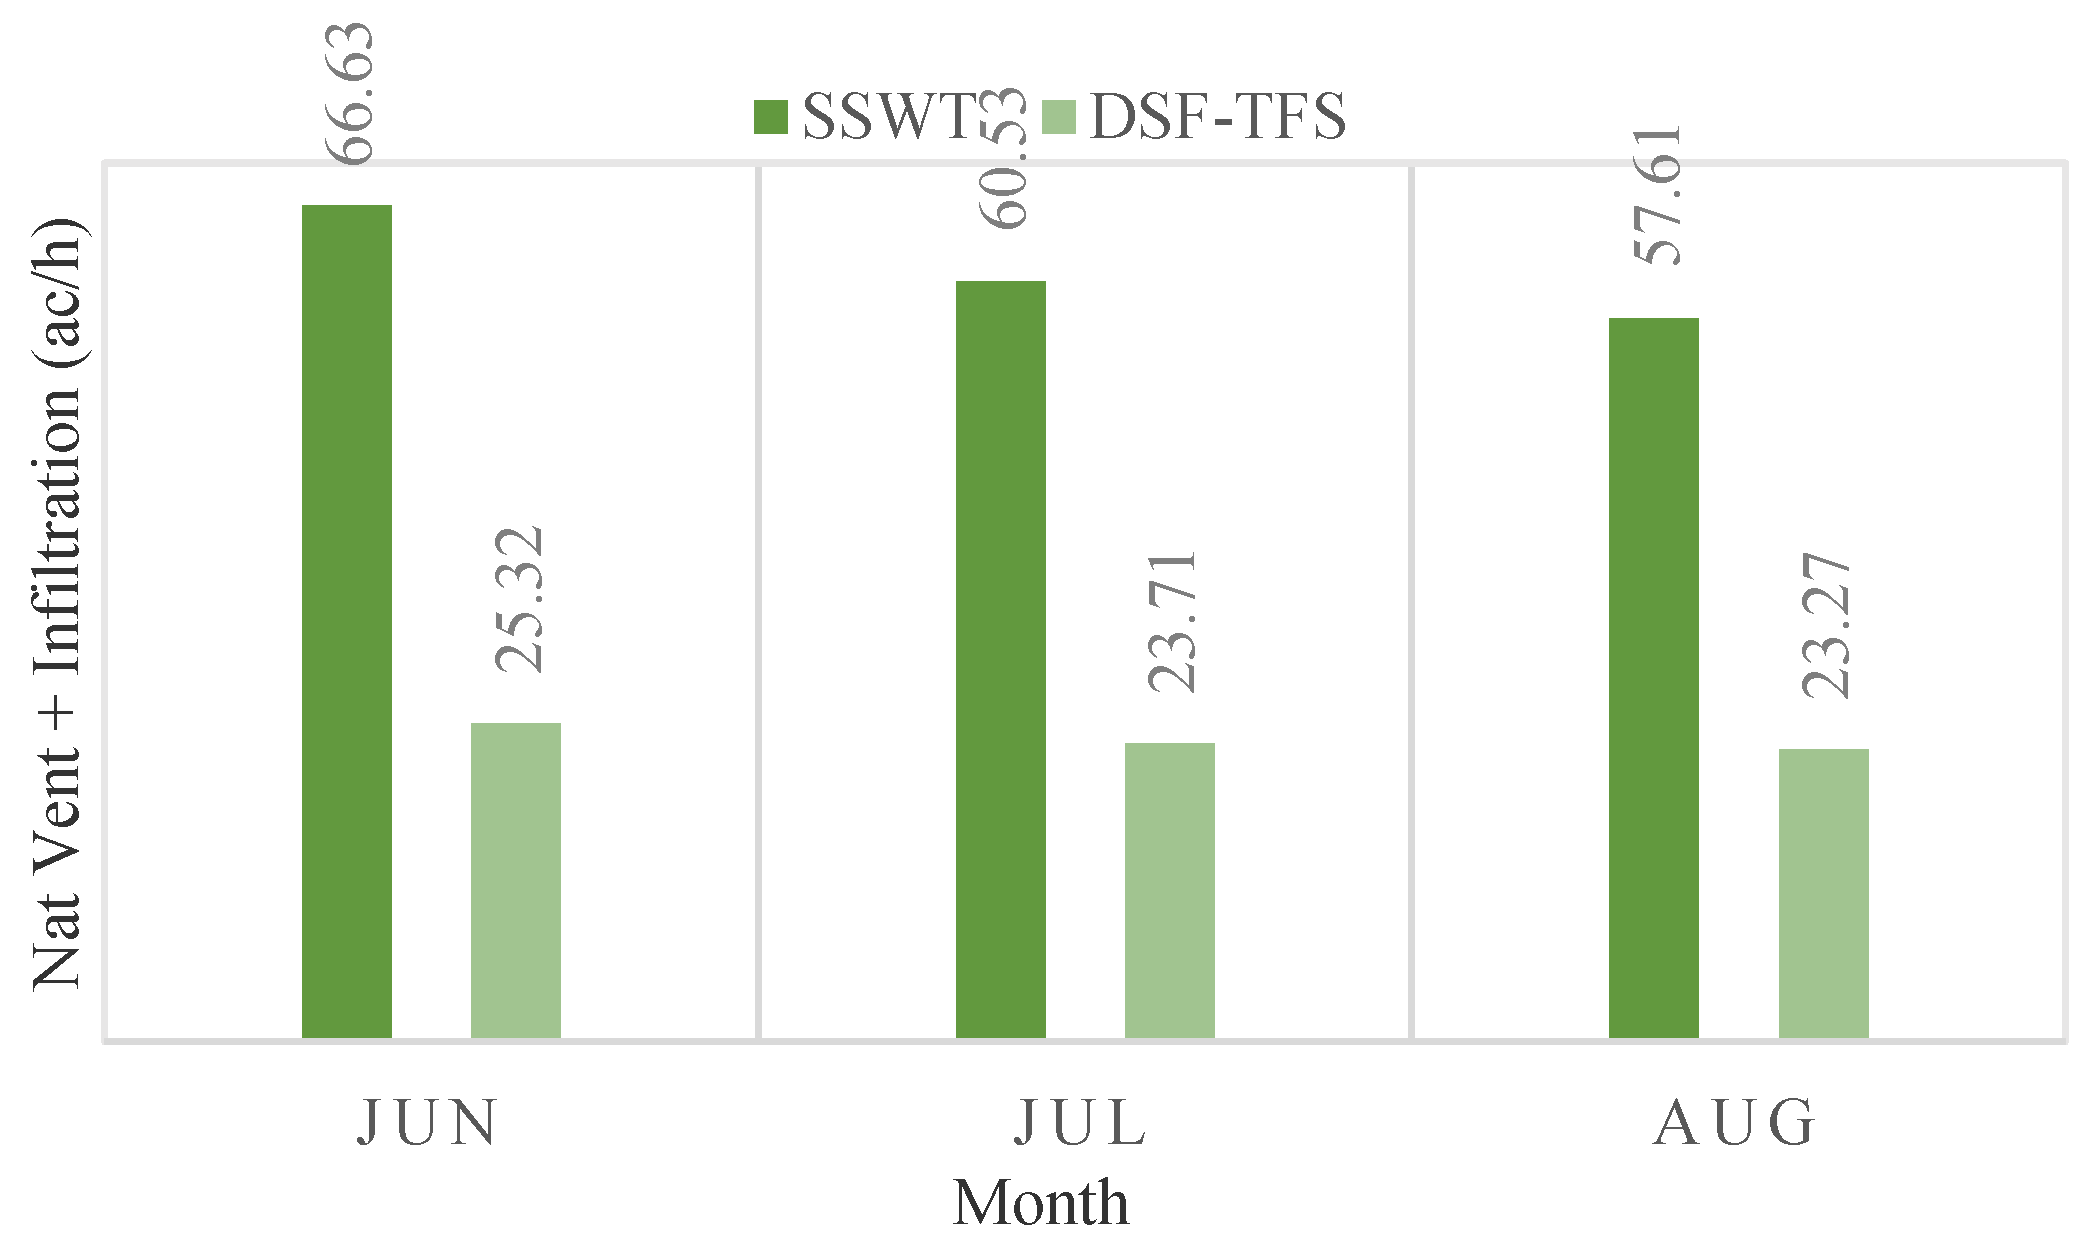
As shown in Figure 11, each ventilation system in each month had a uniform behavior, i.e., the two types of ventilation systems behaved uniformly throughout a day in June and August. However, the single-sided wind tower shows a series of highs and lows throughout the month compared to other systems. The fluctuation of the ventilation rate recorded a coming up and down pattern every 5 days. It may be because of the pressure difference caused by the temperature difference outside and inside. Of course, these fluctuations can be seen in two other types of systems but with a milder pattern. In addition, by drawing the regression line equation in the diagrams presented, it was noticed that in July and August, the cross and DSF-TFS had the same and balanced performance. In addition, the wind tower had an upward trajectory in June and August that shows the better performance of this system. Moreover, this performance fell in September. In addition to summarizing the performance of systems, it is important to determine which system has optimal performance in numerical and percentage terms. For this purpose, the average operating rate of the ventilation rate was calculated every three months for each system. Then, this value was compared on a graph, and the results were presented as a percentage unit for each system (Figure 12).

5. Proposed Strategies and Scenarios

To conduct the evaluation, the hypothetical systems were designed and established as a studied building. The wind towers’ performance during summer was examined. In this study, the effect of one residential building with the ventilation wind towers as the proposed strategies was considered in order to not only develop and test the ventilation systems but also improve the ventilation throughout zones.
One of the most important passive cooling systems features the use of wind towers; this type of cooling system has been used in many parts of the world through traditional or modern ways with the same performance. This means that the favorable wind is directed from the rooftop into the building and used for cooling. The wind towers can function in three ways: directing airflow downward using direct wind entry, directing airflow upwards using a wind-assisted temperature gradient, or directing airflow upwards using a solar-assisted temperature gradient. In other words, the function of a wind tower is to catch a cool breeze that prevails at a higher level above the ground and to direct it into the interior of the buildings. The standpoint positive of wind towers is that if there is no wind flow, a wind tower will be able to use the solar ventilation system’s effect through indoor and outdoor temperature differences. Furthermore, a wind tower is a traditional Iranian architectural element to create natural ventilation in buildings [35].
The second phase of the research has been conducted in which, based on the results of the first phase, it was found that the wind tower had the best and optimum performance of natural ventilation compared with the DSF system. In this way, to improve natural ventilation performance, two different geometries of wind towers were proposed in which these various forms were applied on the top of exterior forms of towers including “four-sided” and “multi-opening” (octagon) (Figure 13). The aim of the wind tower geometries was to increase the indoor airflow rates. The height of the wind tower is 2.60 m with a 1.10 × 1.30 m cross-section. In the following, for four sides of each wind tower, considering the width and height proportions of 1 × 0.9 m2, respectively, the inlet openings area comes to Ainlet = 3.6 m2 in which for both towers, the area of the opening is as Ainlet = 7.2 m2. Moreover, in the case of multi-opening mode, having the width and height proportions of 1 × 0.45 m2, respectively, the inlet opening area is Ainlet = 3.6 m2 in which Ainlet = 7.2 m2 with a wind angle of θ = 45°. The wind flow movement throughout the building and the specifications of the windows are examined in Figure 14.
The volume of airflow can be calculated through the pressure difference of the air inlet and outlets. In addition, for the calculation of efficiency of the outlets’ area, we used Equations (1) and (2), respectively:
q =   C D A e V H   Δ   C P
1 A e 2 = ( 1 A i 2 + 1 A o 2 ) A e =   A i   A o   A i 2 + A o 2 .
Furthermore, external pressure coefficients for vertical walls of rectangular plan buildings are given in Table 4, and the most popular parametric equation for buildings is that of Swami and Chandra [36,37]. The Swami and Chandra equation of wind pressure coefficients (Cp) by favorable wind directions of about 45 degrees (northwest to southeast) with depth-to-breadth short-side ratios of D/B ≈ 2/5 is [38]:
C p = 0.21 ( 45 ° ) I n ( 1.248 0.703 s i n θ 2 1.175   s i n 2   θ + 0.131   s i n 3   ( 2 G θ ) + 0.769   c o s θ 2 + 0.07 G 2 s i n 2 θ 2 + 0.171 c o s 2 θ 2   )
where θ is the incident angle of wind measured from the surface normal, G = ln (S) is the natural log of the side ratio, and S is the ratio of building length to width. The equation introduced by ASHRAE [39] could be used to define the wind velocity and boundary layer in stories. From Equation (4), the wind velocity at different points could be calculated. In the following, Table 4 shows urban and atmosphere boundary layer parameters in urban spaces:
V H = V m   ×   ( δ m H m ) a m   ×   ( H δ ) a
In the above equation and using Table 4, calculate the region’s wind gradient height (δ) and texture coefficient ( a ). According to the actual situation in which the sample case was built, the third category was used to make the simulation configuration more accurate, producing values of 370 and 0.22, respectively.
Table 4 defines four types of terrains. Category (1) is exposed open terrain with a few or no obstructions in which the average height of any object surrounding the structure is less than 1.5 m. This category includes open seacoasts and flat treeless plains. Category (2) consists of open terrain with well-scattered obstructions having height generally between 1.5 and 10 m. Category (3) consists of terrain with numerous closely spaced obstructions having the size of building structures up to 10 m in height with or without a few isolated tall structures. This category includes well-wooded areas, and shrubs, towns, and industrial areas fully or partially developed. Category (4) includes terrain with numerous large high closely spaced obstructions. This category includes large city centers, generally with obstructions taller than 25 m and well-developed industrial complexes. In the following, the simulation of the two proposed wind towers was analyzed and the results are shown in Figure 15.
Based on Figure 15, natural ventilation was simulated in the summer season: the months of June, July, and August. Thus, the two wind towers, at first, had an equal flow rate, but the multi-opening wind tower showed a significant performance on the amount of wind volume within interior zones, which means a better behavior to ventilate zones. It seems that the geometry of the wind tower caused remarkable differences in the amount of inlet wind volume. Figure 16 compares the ventilation behavior of the two types of wind towers each month.
Figure 16 shows the rates of natural ventilation in the four-sided wind tower during June, July, and August with values of 1.89, 1.65, and 1.46 ac/h as well as in the multi-opening wind tower with values of 1.89, 1.705, and 1.51 ac/h, respectively. Thus, it was found that the performance of the multi-opening system was better in all months during the summertime than in the four-sided system. The total value of the ventilation rate in the four-sided system is 4.97 ac/h, and in the multi-opening system, it is 5.5 ac/h.

6. Discussion of Results

Natural ventilation is the airflow between the outside and the inside of the building, which originates from pressure and temperature differences. This phenomenon causes a positive pressure on the windward side and a negative pressure on the leeward side of buildings. In various situations, the potential of natural ventilation is reduced by urban planning restrictions, outdoor and indoor space layout, the position of the neighbor blocks, and low wind velocity. Therefore, it is preferable to use architectural solutions to overcome the lack of local wind resources and get cool, clean air to the inside of the buildings.
Exploring the construction technology in Rasht, the only existing approach to achieve natural ventilation is typical: by opening the windows during warm days. In the meantime, there are many relevant research papers on the same topic and in the same study area as that of the present study, which suggested some techniques. An illustration of it is that Mahmoudi and Pourmusa [41] studied the condition of the airflow and its characteristics on the building blocks such as the distance of neighboring buildings, building orientations, and location of the windows. This research has been performed on Golsar Street. They recommended that the buildings should be arranged in an irregular pattern on the case study site rather than long continuous urban corridors. Saghafi and Fakhari [42] investigated the effect of the solar chimney on the ventilation rate in four cities—Rasht, Tabriz, Isfahan, and Bandar Abas—through simulation. The results indicated that the solar chimney could have better performance and optimal ventilation in Isfahan, which has a hot and dry climate.
In the same way, Baghaei Daemei et al. [43] examined the single-side and cross-ventilation systems on a residential building in Rasht. They indicated that the natural ventilation is influenced by the ratios of the wind area to the height and length of the building and the ratio of the opening to the room length. Rezazadeh and Medi [44] conducted a study on the double-skin facade system to improve indoor thermal comfort in a hypothetical office building in Rasht. They concluded that a combination of natural ventilation and mechanical systems could increase human comfort. Sedigh Ziabari et al. [45] performed a study to calculate the annual natural ventilation and the energy consumption in an office building in Rasht through the DesignBuilder simulator. They demonstrated appropriate variations of the building’s window-to-wall ratio (WWR) for different cardinals.
The present study has offered additional concepts to achieve the goals of using wind potential for cooling in comparison with the previous research papers, without any serious altering on the actual elements of the sample building such as the placement of windows (inlet area size) or the number of windows.

7. Conclusions

The simulation results showed that the SSWT was able to perform more efficiently and optimally than the DSF-TFS. In this way, the SSWT had the ventilation rates for each month by about 66.63, 60.53, and 57.61 ac/h, respectively, which means that the natural ventilation performance in SSWT over three months is about 62%, 85%, and 87% better than that of DSF-TFS, respectively. Moreover, the SSWT has a ventilation rate of about 118.14 ac/h and the DSF-TFS has a ventilation rate of about 72.3 ac/h. As the part one of the paper concluded, the SSWT had a 38% superior performance in ventilation compared with the DSF-TFS. Thereafter, two types of wind tower system, four-sided and multi-opening, were proposed. The opening areas of the two systems are the same (Ainlet = 1.8 m2), and the proportions of the outlet openings area for those wind towers are considered to be equal as well (Ainlet = Aoutlet 1.8 m2). The simulation results indicated that the rate of natural ventilation in the four-sided system is 4.97 ac/h, and in the multi-opening system, it is is 5.5 ac/h. In terms of comparison, the multi-opening system had a more appropriate ventilation performance than the four-sided system by ≈1.5% in June and ≈3% in July and August. Eventually, the multi-opening system was able to enhance the indoor ventilation rate by approximately 10% during summertime. This means that this positive effect only occurred with the change in the number of openings on each inlet and outlet sides.

8. Future Work and Recommendations

Progress has been made in the improvement of natural ventilation toward promoting human thermal comfort and reducing energy consumption, but many important research questions and technical investigation needs remain. This research’s mission has included the development and testing of new concepts and techniques for natural ventilation utilities to not only achieve practical objectives in human thermal comfort but also sustainability. Given the urgent need for the better use of renewable energies, future work and recommendations are suggested here for either governments or designers that should be taken into account in order to achieve a sustainable design in the building sector:
Prevent dense development, compact urban forms, and reduce construction barriers so that the airflow has the opportunity to move fairly around the city.
The executive managers in each organization should always consider the policy in the defined territory and make decisions with the condition of compatibility with the policy of the organizations. Therefore, the spatial layout of cities’ policies should amended by governments based on the local climate.
Designers ought to provide solutions for construction technology either at the early design stage or at the use phase to gain a plentiful amount of renewable resources in buildings.

Author Contributions

Conceptualization, R.A. and A.D.; Methodology, A.B.D.; Software, A.B.D.; Validation, A.D., V.M.R.; Formal Analysis, V.M.R.; Investigation, A.B.D.; Resources, A.J., R.A.; Writing—Original Draft Preparation, A.J. and S.B.; Writing—Review and Editing, A.J. and S.B.; Visualization, V.M.R.; Supervision, A.B.D. All authors have read and agreed to the published version of the manuscript.

Funding

This research received no external funding.

Informed Consent Statement

Not applicable.

Data Availability Statement

Data is contained within the article.

Acknowledgments

The authors would like to acknowledge the editor and the anonymous reviewers for their helpful comments and suggestions during the review process of this paper.

Conflicts of Interest

The authors declare no conflict of interest.

References

  1. Wu, Z.; Li, N.; Wargocki, P.; Peng, J.; Li, J.; Cui, H. Adaptive thermal comfort in naturally ventilated dormitory buildings in Changsha, China. Energy Build. 2019, 186, 56–70. [Google Scholar] [CrossRef]
  2. Khelil, S.; Zemmouri, N. Biomimetic: A new strategy for a passive sustainable ventilation system design in hot and arid regions. Int. J. Environ. Sci. Technol. 2019, 16, 2821–2830. [Google Scholar] [CrossRef]
  3. Hesaraki, A.; Myhren, J.A.; Holmberg, S. Influence of different ventilation levels on indoor air quality and energy savings: A case study of a single-family house. Sustain. Cities Soc. 2015, 19, 165–172. [Google Scholar] [CrossRef]
  4. O’Donovan, A.; O’Sullivan, P.D.; Murphy, M.D. Predicting air temperatures in a naturally ventilated nearly zero energy building: Calibration, validation, analysis and approaches. Appl. Energy 2019, 250, 991–1010. [Google Scholar] [CrossRef]
  5. Edward, N.G. Designing High-Density Cities for Social and Environmental Sustainability; Earthscan: London, UK, 2009. [Google Scholar]
  6. Arfaei, A.; Hançer, P. Effect of the Built Environment on Natural Ventilation in a Historical Environment: Case of the Walled City of Famagusta. Sustainability 2019, 11, 6043. [Google Scholar] [CrossRef] [Green Version]
  7. Krarti, M. Chapter 6—Integrated Design and Retrofit of Buildings. In Optimal Design and Retrofit of Energy Efficient Buildings, Communities, and Urban Centers; Krarti, M., Ed.; Butterworth-Heinemann: Oxford, UK, 2018; pp. 313–384. [Google Scholar]
  8. De Dear, R.; Brager, G. Developing an adaptive model of thermal comfort and preference. ASHRAE Trans. 1998, 104, 145–167. [Google Scholar]
  9. Azimi, N.; Azadeh, S.R.; Rodd Bazani, M.Z. Geographical analysis of city form in Iran. Urban Studies 2013, 2, 89–100. (In Persian) [Google Scholar]
  10. Afsharnia, A. Assessing the Act of Iran’s Supreme Council of Urbanization and Architecture about Land Use per Capita. Int. J. Arch. Urban Dev. 2014, 4, 53–66. (In Persian) [Google Scholar]
  11. Tahbaz, M.; Jalilian, S. Compatibility Indicators with Climate in Rural Housing of Gilan province. J. Hous. Rural Environ. 2011, 30, 23–42. (In Persian) [Google Scholar]
  12. General Directorate of Roads and Urban Development (GDRUD). Criteria for Preventing the Urban Growth Boundary. 1999. Available online: https://gilan.mrud.ir (accessed on 14 May 2019). (In Persian).
  13. Yaran, A.; Mehranfar, A. Proper climatic types in low-height residential contexts A comparative study of cities with temperate climate temperatures: Washington D.C., Richmond, Virginia Beach, Antalya, Rasht, Seoul, and Niigata. Mon. Sci. J. Bagh Nazar 2014, 10, 3–14. (In Persian) [Google Scholar]
  14. Prajongsan, P.; Sharples, S. Enhancing natural ventilation, thermal comfort and energy savings in high-rise residential buildings in Bangkok through the use of ventilation shafts. Build. Environ. 2012, 50, 104–113. [Google Scholar] [CrossRef]
  15. Daemei, A.B.; Osmavandani, P.H.; Nikpey, M.S. Study on Vernacular Architecture Patterns to Improve Natural Ventilation Estimating in Humid Subtropical Climate. Civ. Eng. J. Tehran 2018, 4, 2097–2110. [Google Scholar] [CrossRef] [Green Version]
  16. EnergyPlus. Engineering Reference, EnergyPlus™ Version 9.4.0 Documentation, U.S. Department of Energy. 2020. Available online: https://energyplus.net/documentation (accessed on 29 September 2020).
  17. Baghaei Daemei, A.; Eghbali, S.R.; Khotbehsara, E.M. Bioclimatic design strategies: A guideline to enhance human thermal comfort in Cfa climate zones. J. Build. Eng. 2019, 25, 100758. [Google Scholar] [CrossRef]
  18. Wang, Y.; Chen, Y.; Li, C. Energy performance and applicability of naturally ventilated double skin façade with Venetian blinds in Yangtze River Area. Sustain. Cities Soc. 2020, 61, 102348. [Google Scholar] [CrossRef]
  19. Shameri, M.A.; Alghoul, M.A.; Sopian, K.; Fauzi, M.; Zain, M.; Elayeb, O. Perspectives of double skin façade systems in buildings and energy saving. Renew. Sustain. Energy Rev. 2011, 15, 1468–1475. [Google Scholar] [CrossRef]
  20. Srisamranrungruang, T.; Hiyama, K. Balancing of natural ventilation, daylight, thermal effect for a building with double-skin perforated facade (DSPF). Energy Build. 2020, 210, 109765. [Google Scholar] [CrossRef]
  21. Hou, K.; Li, S.; Wang, H. Simulation and experimental verification of energy saving effect of passive preheating natural ventilation double skin façade. Energy Explor. Exploit. 2020. [Google Scholar] [CrossRef]
  22. Kim, S.Y.; Song, K.D. Determining photosensor conditions of a daylight dimming control system using different double-skin envelope configurations. Indoor Built Environ. 2007, 16, 411. [Google Scholar] [CrossRef]
  23. Gratia, E.; De Herde, A. Natural cooling strategies efficiency in an office building with a double-skin façade. Energy Build. 2004, 36, 1139–1152. [Google Scholar] [CrossRef]
  24. Gratia, E.; Herde, A.D. Greenhouse effect in double-skin façade. Energy Build. 2007, 39, 199–211. [Google Scholar] [CrossRef]
  25. Edae Jiru, T.; Haghighat, F. Modeling ventilated double skin facade—A zonal approach. Energy Build. 2008, 40, 1567–1576. [Google Scholar] [CrossRef]
  26. Mingotti, N.; Chenvidyakarn, T.; Woods, A.W. The fluid mechanics of the natural ventilation of a narrow-cavity double-skin façade. Build. Environ. 2011, 46, 807–823. [Google Scholar] [CrossRef]
  27. Da Silva, F.M.; Gomes, M.G.; Rodrigues, A.M. Measuring and estimating airflow in naturally ventilated double skin facades. Build. Environ. 2015, 87, 292–301. [Google Scholar] [CrossRef]
  28. Dama, A.; Angeli, D.; Larsen, O.K. Naturally ventilated double-skin facade in modeling and experiments. Energy Build. 2017, 144, 17–29. [Google Scholar] [CrossRef] [Green Version]
  29. Souza, L.C.O.; Souza, H.A.; Rodrigues, E.F. Experimental and numerical analysis of a naturally ventilated double-skin façade. Energy Build. 2018, 165, 328–339. [Google Scholar] [CrossRef]
  30. Wang, Y.; Chen, Y.; Li, C. Airflow modeling based on zonal method for natural ventilated double skin facade with Venetian blinds. Energy Build. 2019, 191, 211–223. [Google Scholar] [CrossRef]
  31. Choi, H.A.Y.; Kang, K.; Yoon, S.; Kim, T. Cooling energy performance and thermal characteristics of a naturally ventilated slim double-skin window. Appl. Therm. Eng. 2019, 160, 114113. [Google Scholar] [CrossRef]
  32. Casini, M. 7—Advanced insulation glazing. In Smart Buildings; Casini, M., Ed.; Woodhead Publishing: Sawston, UK, 2016; pp. 249–277. [Google Scholar] [CrossRef]
  33. Parra, J.; Guardo, A.; Egusquiza, E.; Alavedra, P. Thermal Performance of Ventilated Double Skin Façades with Venetian Blinds. Energies 2015, 8, 4882–4898. [Google Scholar] [CrossRef]
  34. Boake, T.M. Understanding the General Principles of the Double Skin Facade System. 2003. Available online: https://www.academia.edu/3437914/Understanding_the_General_Principles_of_Double_Skin_Facade_Construction (accessed on 1 November 2003).
  35. Hughes, B.R.; Calautit, J.K.; Ghani, S.A. The development of commercial wind towers for natural ventilation: A review. Appl. Energy 2012, 92, 606–627. [Google Scholar] [CrossRef]
  36. Swami, M.V.; Chandra, S. Procedures for Calculating Natural Ventilation Airflow Rates in Buildings; ASHRAE Final Report FSEC-CR-163-86; ASHRAE Research Project: Atlanta, GA, USA, 1987. [Google Scholar]
  37. Swami, M.V.; Chandra, S. Correlations for pressure distribution on buildings and calculation of natural-ventilation airflow. ASHRAE Trans. 1988, 94, 243–266. [Google Scholar]
  38. Muehleisen, R.T.; Patrizi, S. A new parametric equation for the wind pressure coefficient for low-rise buildings. Energy Build. 2013, 57, 245–249. [Google Scholar] [CrossRef]
  39. American Society of Heating, Refrigerating, & Air-Conditioning Engineers. ASHRAE Handbook: Fundamental, American Society of Heating, Refrigerating and Air Conditioning Engineers; ASHRAE: Atlanta, GA, USA, 2009. [Google Scholar]
  40. Kishor, C.; Mehta, P.E.; William, L.; Coulbourne, P.E. Wind Loads: Guide to the Wind Load Provisions of ASCE 7-10; ASCE Press: Reston, VA, USA, 2013. [Google Scholar]
  41. Mahmoudi, M.; Pourmusa, M. Wind Energy Potential Evaluation and Its Fundamental Role in Air Conditioning and Humidity Annihilation. Case study: Rasht County (Golsar Region). Armanshahr Arch. Urban Dev. 2010, 3, 147–156. [Google Scholar]
  42. Saghafi, M.; Fakhari, M. The Effect of Solar Chimney on Building Ventilation in Different Climates of Iran. Naqshejahan Basic Stud. New Tech. Arch. Plan. 2012, 2, 43–54. [Google Scholar]
  43. Daemei, A.B.; Limaki, A.K.; Safari, H. Opening Performance Simulation in Natural Ventilation Using Design Builder (Case Study: A Residential Home in Rasht). Energy Procedia 2016, 100, 412–422. [Google Scholar] [CrossRef] [Green Version]
  44. Rezazadeh, N.; Medi, H. Thermal Behavior of Double Skin Facade in Terms of Energy Consumption in the Climate of North of Iran-Rasht. Space Ontol. Int. J. 2017, 6, 33–48. [Google Scholar]
  45. Ziabari, S.S.; Zolfagharzadeh, H.; Asadi Malek Jahan, F.; Salavatian, S. Comparative Study on the Influence of Window To Wall Ratio on Energy Consumption and Ventilation Performance in Office Building of Temperate Humid Climate: A Case Study in Rash. Space Ontol. Int. J. 2019, 8, 33–42. [Google Scholar]
Figure 1. Conceptual framework of the research.
Sustainability 13 00679 g001
Figure 2. (a) Temperature range; (b) Wind rose diagram of Rasht city.
Sustainability 13 00679 g002
Figure 3. Sample case location on map.
Sustainability 13 00679 g003
Figure 4. The sixth floor plan of the sample case.
Sustainability 13 00679 g004
Figure 5. Locating the wind tower on the floor (isometric and plan view).
Sustainability 13 00679 g005
Figure 6. Comparison of daily airflow and natural ventilation rates during the three summer months for a wind tower.
Sustainability 13 00679 g006
Figure 7. Functions of the airflow in the twin face system.
Sustainability 13 00679 g007
Figure 8. Position of the Double-Skin Facade Twin Face System (DSF-TFS) in the plan.
Sustainability 13 00679 g008
Figure 9. Comparison of daily airflow and natural ventilation rates during the three months for DSF-TFS.
Sustainability 13 00679 g009
Figure 10. Average amount of natural ventilation rate monthly.
Sustainability 13 00679 g010
Figure 11. Comparison charts for each month based on both Single-Sided Wind Tower (SSWT) and DSF-TFS: (a) June; (b) July; and (c) August.
Sustainability 13 00679 g011
Figure 12. Average airflow rate in each system during summertime.
Sustainability 13 00679 g012
Figure 13. A schematic isometric view for the proposed wind towers.
Sustainability 13 00679 g013
Figure 14. Wind flow illustration and openings layout.
Sustainability 13 00679 g014
Figure 15. Simulation results of two proposed wind tower flow rates.
Sustainability 13 00679 g015
Figure 16. Comparison of the wind flow rate of the two types of wind towers in each month.
Sustainability 13 00679 g016
Table 1. Simulation additional details.
Natural Ventilation and Infiltration
Infiltration unitsac/h
Airtightness methodTemplate slider
Airtightness scaleExcellent
Outside air definition methodMin fresh air per person 1
OperationScheduled 2
Wind factor 31
Control modelConstant 4
Modulate Opening Areas
Lower value of TinTout (deltaC)5.0
Upper value of TinTout (deltaC)15
Limit value of opening modulation factor0.01
Free Aperture
Opening positionLeft
Glazing area open100%
Discharge coefficient0.65
1 Min Fresh Air is the minimum fresh air rate per person (l/s/person). The airflow rate in m3/s is calculated as m3s = Min Fresh Air × Number People/1000; 2 The schedule scenarios were introduced when people occupy zones; 3 For full treatment of wind effects, set it to 1; 4 This option allows modeling a window that is opened for fresh air regardless of inside/outside temperature/enthalpy.
Table 2. Specification of case study and boundary conditions used for the simulation.
Year of built completion1988
Total floor area300 m2
Case study area110 m2
Number of stories6
Floor to floor height3.24 m
External walls150 mm concrete block—24 mm of plaster inside and outside
Internal walls100 mm concrete block—24 mm of plaster inside and outside
Glazing6 mm single reflective glass
Windows O.K.B 10.80 m
Windows height1.50 m
Infiltration rate4.5 m3/h-m2
Equipment5 W/m2
Lighting15 W/m2
Occupancy (people/m2)4/120 = 0.03—Occupation include parents and two kids
Office equipment gain (W/m2)2 × 300/120 = 5
1 Oucapenci Kingston Benchmark.
Table 3. Relevant research on natural ventilation strategies in humid climates.
Authors (Date)MethodAimsClimate
Gratia and de Herde [23]SimulationNatural ventilationOceanic climate
Gratia and de Herde [24]SimulationNatural ventilationOceanic climate
Edae Jjiru and Haghighat [25]SimulationNatural ventilationHumid
Mingotti et al. [26]Experiment and simulationNatural ventilation and energy consumptionOceanic climate
da Silva et al. [27]ExperimentNatural ventilationMediterranean
Dama et al. [28]Experiment and simulationNatural ventilationMaritime
Souza et al. [29]Experiment and simulationNatural ventilationSubtropical highland (oceanic climate)
Wang et al. [30]Experiment and simulationNatural ventilation and energy consumptionHumid
Choi et al. [31]Experiment and simulationNatural ventilation and energy consumptionHumid
Table 4. Boundary layer profile for different approach terrains [40].
Categories Tributary   Area   ( a ) The Region Wind Gradient Height in Meters (δ)
Terrain category 1
(open sea coasts and flat treeless plains)
0.10210
Terrain category 2
(rural areas and weather stations)
0.14270
Terrain category 3
(forest areas and suburbs)
0.22370
Terrain category 4
(huge urban areas)
0.33460
Publisher’s Note: MDPI stays neutral with regard to jurisdictional claims in published maps and institutional affiliations.