Article

Sustainable Configuration of the Tunisian Olive Oil Supply Chain Using a Fuzzy TOPSIS-Based Approach

1
OLID Research Unit, Faculty of Economics and Management of Sfax, University of Sfax, Airport Road Km 4, Sfax 3018, Tunisia
2
Department of Industrial Engineering, College of Engineering, Taif University, P.O. Box 11099, Taif 21944, Saudi Arabia
*
Author to whom correspondence should be addressed.
Sustainability 2021, 13(2), 722; https://doi.org/10.3390/su13020722
Submission received: 2 January 2021 / Revised: 8 January 2021 / Accepted: 8 January 2021 / Published: 13 January 2021

Abstract

:
Agricultural production of olive oil is a sector with high significance. The olive sector is a very important sector for several countries in the world, in particular, for Tunisia. In addition, the impacts of olive oil production and extraction on economic, environmental, and social issues are considerable. The main objective of this work is to propose a better configuration of the Tunisian olive oil supply chain (OOSC) from a sustainable development (SD) perspective. The proposed approach consists of applying a fuzzy technique for order preference by similarity to ideal solution (TOPSIS) method as a multi-criteria approach. The proposed approach is applied twice. In the first application, the objective is to compare five possible scenarios for the olive agricultural phase. In the second application, the objective is to compare three possible scenarios for the olive oil transformation phase. The major findings of this research include the following: (1) The best scenario for the agricultural phase is the intensified organic system, which is based on biodynamic olive growing. (2) The best scenario for the transformation phase (oil extraction) is the continuous two-phase extraction system. Consequently, the efficient way for the by-products processing phase is the use of wet pomace for the preparation of biodynamic compost.

1. Introduction

1.1. Background and Research Motivation

This research starts from two major ascertainments. Firstly, the olive oil industry is an important productive and economic sector in the Mediterranean countries. The associated production process is characterized by several different practices and techniques for agricultural production of olives and for their transformation processing into olive oil [1]. However, despite the economic importance of this food product in several countries and the social impacts caused by the olive oil industry, in particular, the high added value and job creation, this industry causes various economic, environmental, and social impacts, in terms of depletion of resources, air emissions, waste generation, etc. These economic, social, and environmental impacts vary mainly due to the practices and techniques used in olive growing and oil extraction. From this perspective, sustainability study of the olive oil supply chain (OOSC) is vital. Indeed, the aim of sustainable development (SD) is to balance economic, environmental, and social needs, and therefore prosperity for this and future generations. SD consists of a long-term, integrated approach to developing and achieving a healthy community by jointly addressing economic criteria, environmental criteria, and social issues criteria, whilst avoiding the overconsumption of key natural resources. For this reason, numerous studies, such as [2,3,4,5,6,7], have proposed and developed multi-criteria decision analysis (MCDA) methods for studying SD in various areas and disciplines. In fact, the main objective of MCDA methods has been to synthesize information that expresses often conflicting views concerning the same set of objects.
The second ascertainment is about the country of origin. In fact, in numerous studies about olive oil attributes, the concept of country of origin was highlighted as a significant feature for olive oil and other products, such as French wines and cheeses; German beer; Swiss and Belgian chocolate; and Italian wine, cheese, and pasta. Moreover, recent studies on food products have also shown the importance of the country of origin and suggested that a certain product image reflects the image of the region or country of production [8]. Therefore, each olive oil producing country should study their SD as a specific case study. Although Tunisia is the fourth largest producer of olive oil after Spain, Italy, and Greece, and the third largest exporter after Italy and Spain [9], in Tunisia, sustainability studies of the OOSC are very limited.

1.2. Literature Overview

Today, the study of OOSC sustainability is attracting researchers more and more, and therefore it is becoming a crucial subject nowadays. Several research works are found in the literature and have dealt with this subject. Additionally, the olive oil sector generates nuisances for the environment, which require restructuring and modernization of olive cultivation, and using appropriate technologies for olive oil extraction. Such technologies help to produce quality oil at a lower cost with less negative impacts on the environment [10]. Several other researchers, such as [1,11,12,13], have argued that to ensure sustainability of the OOSC the focus must be especially on the agricultural production phase and the oil transformation phase. Hence, in this article, we concentrate on these two phases and also the by-products processing phase since it is closely linked to the two mentioned phases. In fact, these three phases are considered to be the most important phases of the OOSC.
Recchia et al. [14] applied multi-criteria analysis to assess different scenarios of the olive oil production chain in Italy (agricultural phase, transport of olives, and transformation phase) from an economic and environmental point of view. Salomone and Ioppolo [1] carried out a scenario analysis for the Italian OOSC (agricultural phase, transformation phase, and by-products processing phase) by applying a life cycle assessment (LCA) methodology to identify the processes that caused the most important environmental problems and ultimately design a more efficient and environmentally friendly local olive oil production chain. Riesgo and Gallego-Ayala [3] carried out a study that aimed to measure the sustainability of olive farms in Spain (analysis of the different agricultural scenarios) and identified the most sustainable olive growing system. To this aim, these authors applied the technique for order preference by similarity to ideal solution (TOPSIS) method. In addition, Cappelleti et al. [15] presented a multi-criteria approach in a fuzzy context (application of the fuzzy TOPSIS method) and evaluated different scenarios for the agricultural phase and oil transformation in Italy, taking into account the same economic, environmental, and social criteria.
This literature review analysis shows that, first, the issue of sustainability of the OOSC is most often a specific study by country. Secondly, this issue is not well studied in Tunisia, and therefore it seems that would be interesting to study the sustainability of the OOSC in the context of Tunisia. Third, the small number of case studies and modeling efforts that exist have focused on the development of MCDA methods with fuzzy concept integration and aimed to incorporate sustainability criteria into the OOSC models.

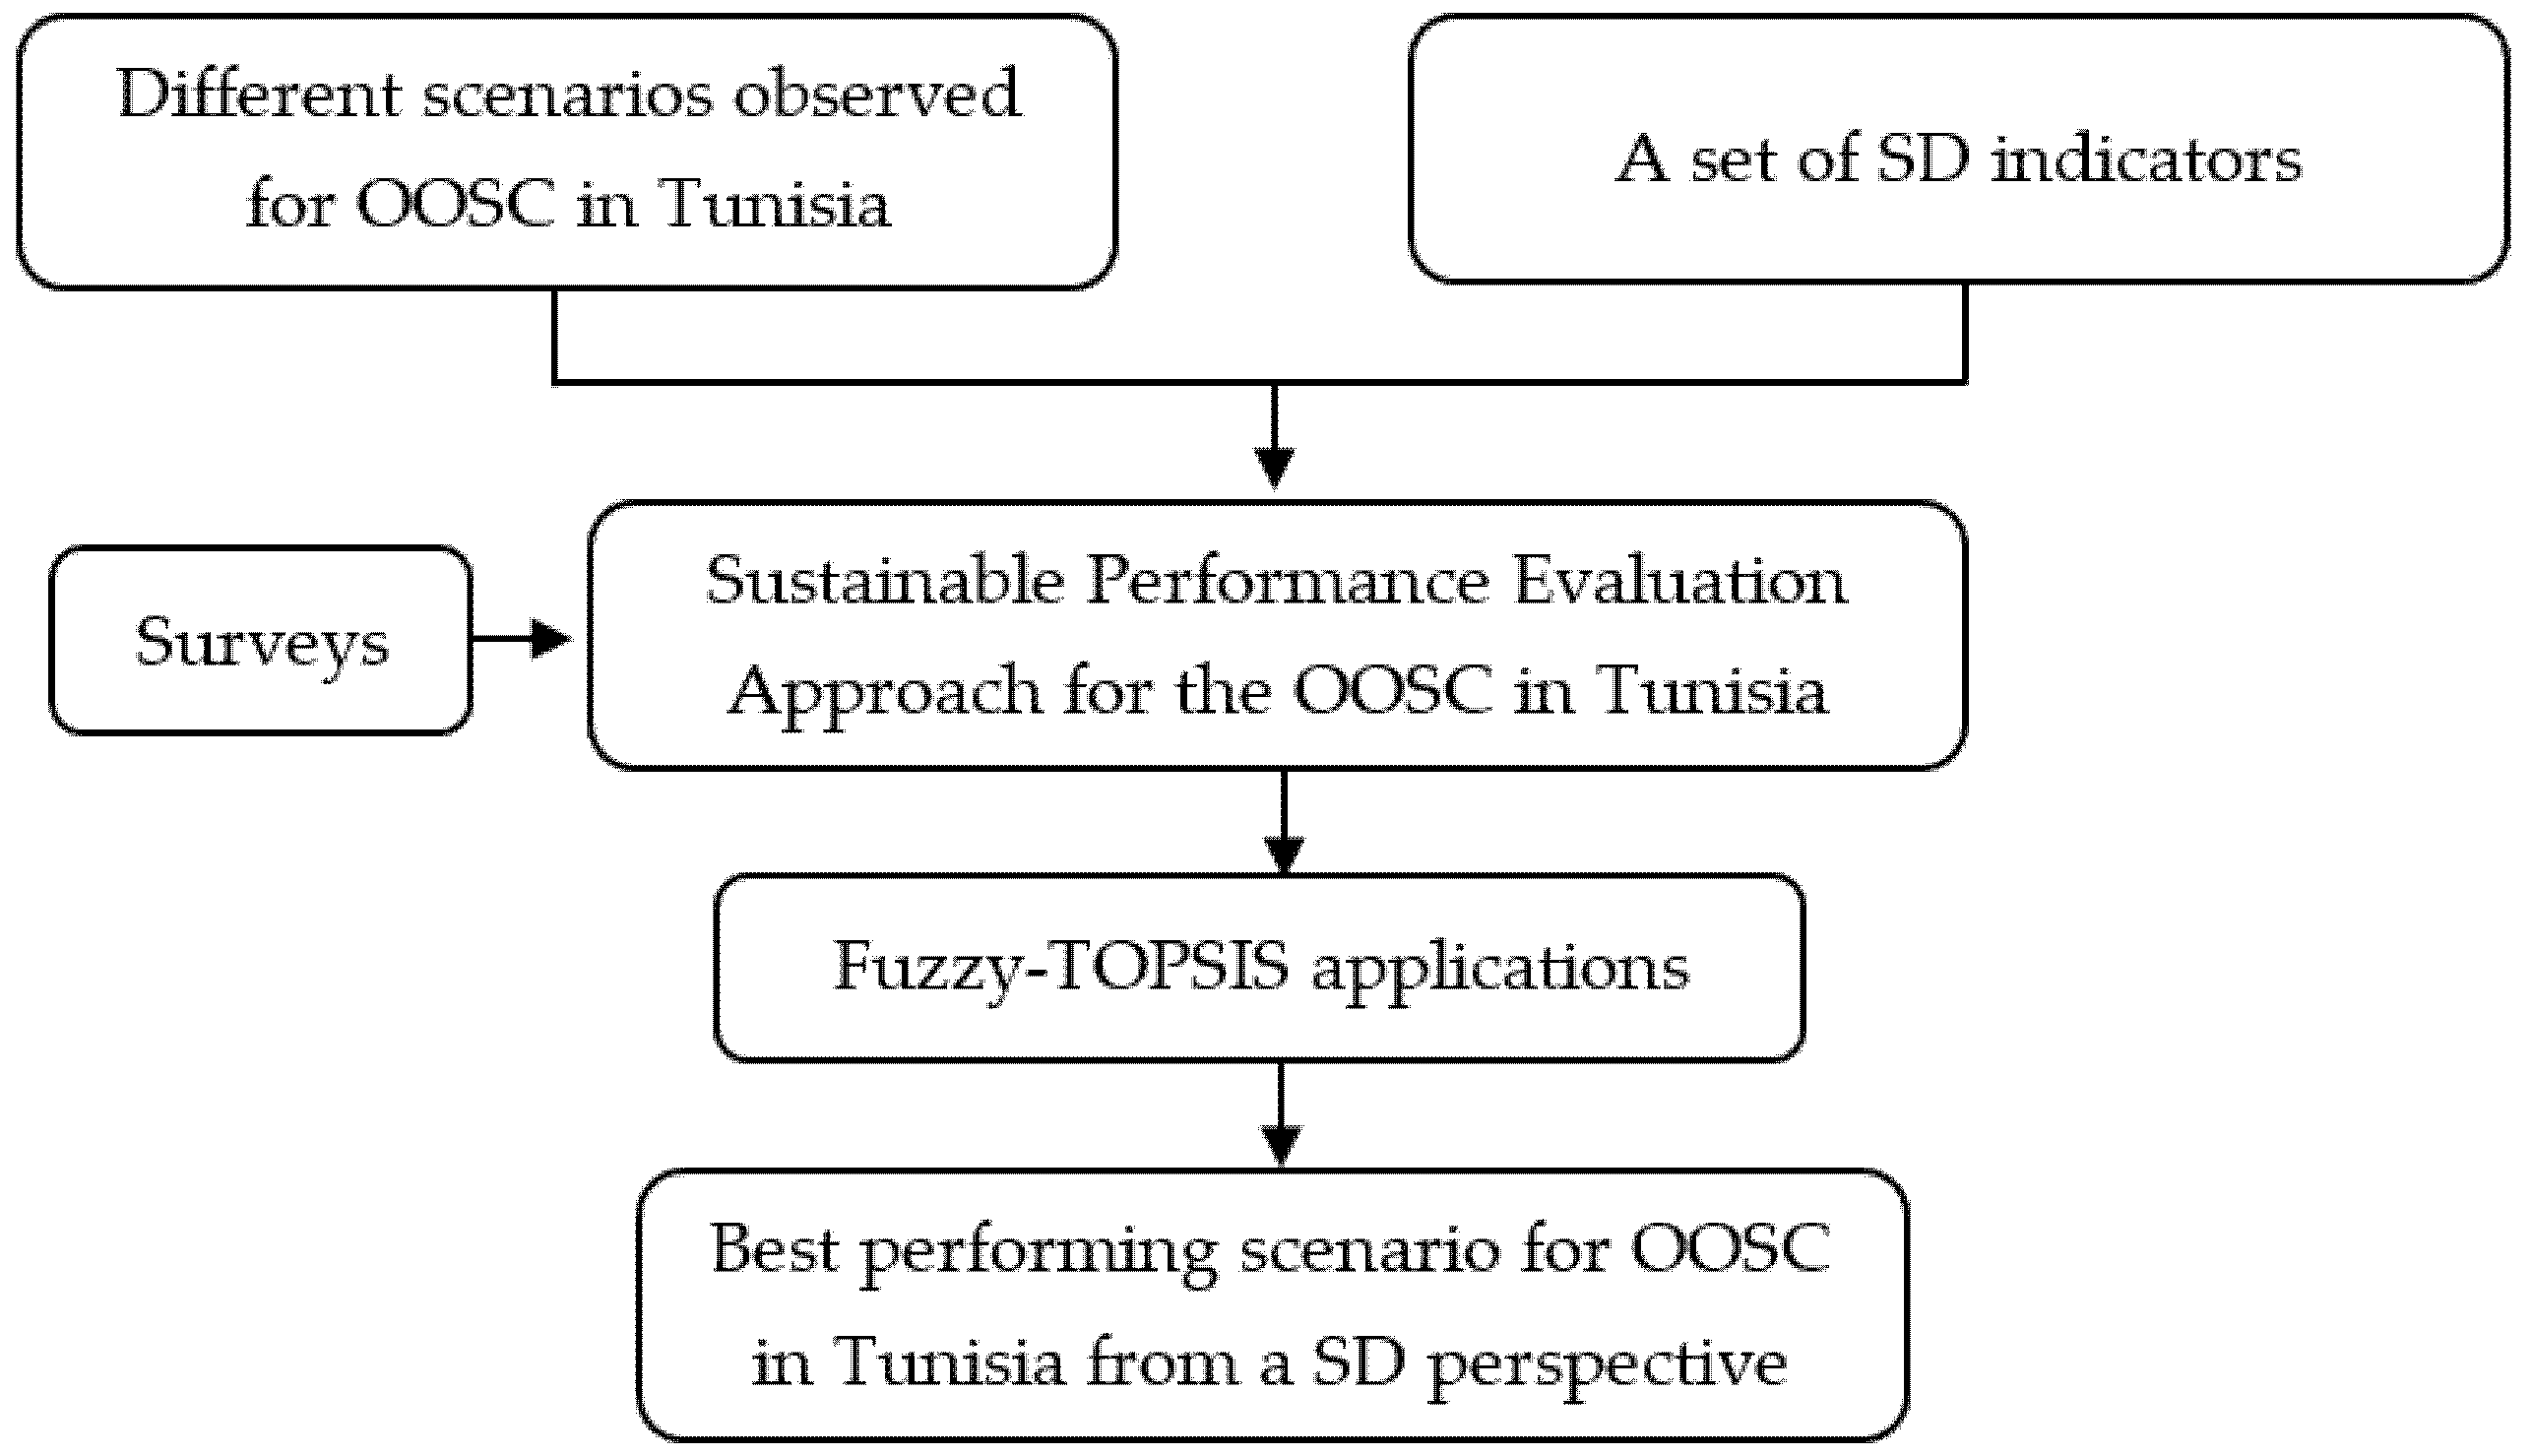
1.3. Adopted Methodology and Objective of the Study

MCDA methods are successfully applied in different fields and disciplines. More than 50 MCDA methods are cited in the literature, such as analytic hierarchy process (AHP), technique for order of preference by similarity to ideal solution (TOPSIS), elimination and choice translating reality (ELECTRE), and preference ranking organization method for enrichment evaluations (PROMETHEE), etc. Thus, for a specific decision case study, how to select the proper methods and its parameters is a problem. Salabun et al. [16] performed a comparative analysis among different MCDA methods and they showed the detailed influence of values of particular parameters on the final form and the similarity of the final rankings obtained by these MCDA methods. Watrobski et al. [17] developed a generalized framework for multi-criteria method selection. This framework was implemented as an expert system solution, supporting the selection of the suitable MCDA methods for a particular decision situation. Using this solution, which is available at http://www.mcda.it, the obtained recommendations for our study are fuzzy AHP and fuzzy TOPSIS.
In this study, the TOPSIS method is used. Indeed, TOPSIS is amongst the well-known MCDA methods that considers both positive-ideal and negative-ideal solutions in decision-making. According to Behzadian et al. [18], TOPSIS methodology has been successfully applied to a wide range of application areas and industrial sectors with varying terms and subjects. One potential reason for this popularity is the fact that the TOPSIS method appears easier to understand and simpler to implement as compared with outranking methods such as PROMETHEE and ELECTRE that seem to be substantially more complicated, as well as less transparent to decision makers than the TOPSIS method.
Triantaphyllou and Lin [19] indicated that fuzzy decision-making processes were best used as decision tools. Individual decision makers could reach their own solution after applying any one of them. The extension of the classical TOPSIS method with regard to fuzzy logic, namely fuzzy TOPSIS, has also been successfully implemented in various application areas [5,18,19,20,21]. Similarly, as a classical TOPSIS method, the fuzzy variant has received much interest from researchers and has gained a lot of popularity. Literature review studies have been conducted with regard to the TOPSIS method such as by Behzadian et al. [18], and very recently by Palczewski and Salabun [21], who claimed that the combination of the TOPSIS method with fuzzy logic led to a higher chance for successful sustainability analysis. Fuzzy logic has been shown to be notably convenient to cope with vagueness and uncertainty, and it is an appropriate tool for expressing uncertain or imprecise decision information.
It should be noted that there are two approaches to identify fuzzy models with partially incomplete data, i.e., the monolithic approach, which assumes creating one model, and the structured approach with a decomposed problem on several interrelated models. Shekhovtsov et al. [22] confirmed that both approaches could solve problems with very similar accuracy and the difference between them were statistically insignificant.
The main objective of this study is to propose the best configuration of the Tunisian OOSC, from a SD perspective using the fuzzy TOPSIS method as an approach based on multi-criteria for comparing various possible olive agricultural scenarios and olive transformation processing scenarios. Thereby, the structure of this article is organized as follows: In Section 1, we presented a literature review related to sustainability of the OOSC; in Section 2, we present the Tunisian OOSC and the theoretical steps of the proposed approach; in Section 3, we present the application of the proposed approach; in Section 4, we present the results analysis; and finally, conclusion and some perspectives are presented in the last section.

2. Materials and Methods

2.1. Study Area

2.1.1. Tunisian Olive Oil Supply Chain

In Tunisia, the olive sector is a major component of the agricultural and food sectors. It contributes to the national goals of economic growth, food security, job creation, increased export earnings, and preservation and valorization of natural resources that are increasingly rare and vulnerable [23]. In addition, according to [24], more than one-tenth of the Tunisian population earns all or part of their income from olive farming.
Tunisia is a southern Mediterranean country best known for growing olive trees and exporting olive oil, after the European Union [25]. Tunisia is the fourth largest producer of olive oil after Spain, Italy, and Greece, and the third largest exporter after Italy and Spain [9]. With production initially intended for export, the Tunisian olive oil industry is a special case [26]. In fact, Tunisia, a founding member of the International Olive Council since its creation in February 1956, has the second largest olive-growing area in the world, with 1,825,000 ha (about a third of the cultivated area in the country), with 16% of the world olive-growing area, and more than 80 million olive trees, of which 99% are for oil extraction. The age structure of the Tunisian olive groves, according to Ghedira [25], includes the following: 18% young plantations (1 to 20 years old), 75% plantations in production (20 to 70 years), and 7% older plantations (over 70 years old). However, only 5% of the olive growing areas are cultivated on an irrigated system [27].
With a powerful industrial base, including more than 1750 oil mills, 15 refineries, 10 olive pomace oil extraction units, and more than 40 modern bottling plants, the national sector contributes significantly to rural exodus slowdown and revenue income [28]. Thus, the distribution of olive trees in Tunisia is 30% in the north, 45% in the center, and 25% in the south. The south accounts for 50% of the olive production as compared with only 29% in the center and 21% in the north. In addition, the oil content of olives produced in the south is slightly higher than in other regions. The south contributes to 55% of the total olive oil production as compared with 27% from the center and 18% from the north [25]. Thus, the advantage of northern olive trees is explained by higher densities of olive trees per hectare. Indeed, Tunisia is the depository of a rich varietal heritage. However, despite this wealth, only two varieties are ubiquitous in the arable lands, which are Chemlali located mainly in the south, and Che’toui which dominates in the north. The Chemlali cultivar represents 80% of the Tunisian production of olive oil and is grown in the center and south of the Tunisia country, areas with low rainfall (<250 mm per year). The Chetoui cultivar is widespread in the north, whether in the plains or mountain areas. It covers 176,000 hectares and represents about 20% of the Tunisian olive oil production. Other cultivars present in Tunisia include Oueslati, Gerboui, Zalmati, Zarazi, Barouni, and Chemchali de Gafsa [9].
During the last decade, the processing sector has witnessed the creation and modernization of mills, along with a gradual elimination of traditional mills. As a result, the trituration capacity has increased from 8000 t/day in 1986 to more than 40,000 t/day in recent years. Nevertheless, in spite of the modernization of the sector, additional efforts still remain to be made, since traditional oil mills still exist and account for about 35% of the trituration capacity [25]. As a result, the first export agreements were concluded with the European Union during the 1980s. Since then, this market has become the traditional customer for Tunisian olive oil, with more than 80% of exports. Today, the European Union is still the priority market for Tunisian olive oil, but there are many other destination markets. Thus, in addition to classic destinations such as Italy and France, Spain and Portugal have become new European destinations, as has the United States, which is now a classic market for Tunisia, since 52% of olive oil that is consumed is of Tunisian origin. South America, sub-Saharan Africa, and North Africa, as well as the Middle East and the Gulf countries, Asia, and Australia have also been conquered by Tunisian olive oil in recent years. Today, Tunisian olive oil is exported to all five continents. Exports are very often in bulk and, recently, exports of organic and bottled olive oil have increased. They now account for about 12 and 10 percent of exports, respectively [9].

2.1.2. Tunisian Olive Oil Supply Chain

This study concerns the following three phases: the production phase, the transformation phase, and the by-products management phase.
For the production phase, each of its treatments can be conducted by different ways depending on the following: (1) type of plantation, i.e., extensive systems or intensive systems; (2) the irrigation system, i.e., rainfed or irrigated agriculture; (3) The cultivation practices, i.e., conventional, organic, or integrated; and (4) the soil management, pruning, and harvest, i.e., manual or mechanized.
For the transformation phase, there are three main types of oil mills: traditional oil mills, continuous centrifugation mills with three-phase systems, and continuous centrifugation mills with two-phase systems. In recent decades, significant changes in olive oil production methods have taken place. The traditional process (press and super-press) has been gradually replaced by the continuous modern process. The latter is, then, divided into “three-phase” and “two-phase” processes, depending on the method of the olive oil separation used [29]. One can consult [30] for more details about the three olive oil extraction systems.
For the by-products management phase, it should be noted that oil is only 20% of the olive mass; the remaining 80% is waste. As a result, extraction of olive oil is characterized by the generation of enormous quantities of pomace and olive mill wastewater. Olive cake varies according to the olive crushing system used. In fact, the resultant pomace of a discontinuous system and continuous three-phase system is dry pomace. Whereas, for the continuous two-phase system, it is wet pomace. Indeed, the management of these two types of pomace differs. For dry pomace, the first stage of treatment is pomace oil extraction, after drying, to make the pomace oil which is sold for production of soap and the exhausted pomace which is sold as fuel; the second stage is oil refining (i.e., neutralization, discoloration, and deodorization) to extract refined olive oil. For wet pomace treatment, the pulp and the stone are removed; the pulp is used for compost production and the stone is sold as fuel and for animal feed.
Olive mill wastewater is the liquid effluents generated by the crushing of olives in order to obtain the oil. They constitute a real environmental problem for the producing countries of the Mediterranean basin [31]. In addition, it should be noted that the olive mill wastewater produced by a continuous two-phase system has a chemical composition which is extremely different from the olive mill wastewater produced by a discontinuous system and a continuous three-phase system. The wastewater from washing olives in the supply chain is almost the only liquid discharge produced, since during oil extraction, the production of olive mill wastewater is very low. The olive mill wastewater is generally discharged into drainage basins throughout the Tunisian territory; the two main basins are in Sfax and El Kalaa, where they are dried by natural evaporation. However, despite the shallow depths adopted in these basins, evaporation is not satisfactory, because a thin dandruff of oil is formed on the basin surfaces, which hinders the evaporation phenomenon [25]. In addition to this solution, in Tunisia, another solution is applied that is more reliable, which is the direct application of this olive mill wastewater on soil.

2.2. The Proposed Approach

2.2.1. Objective of the Proposed Approach

The main objective of this research work is to create an OOSC in Tunisia that ensures the prudent use of natural resources, protects the global ecosystem, and generates economic prosperity and balanced social development. In this regard, the methods for cultivating olive trees and producing olive oil, as well as the methods for managing the use of olive by-products must be considered with total respect for the environment, while ensuring economic profitability and social well-being, that means, directed to a sustainable supply chain.
As previously mentioned, several researchers, such as [1,10,11,12,13,32], have argued that to ensure sustainability of the OOSC the focus must be especially on the agricultural production phase and olive oil transformation phase. Hence, the idea of concentrating, in this article, on these two phases and also the by-products processing phase since it is closely linked by the two mentioned phases. Note that transport and distribution and marketing phases are eliminated from this study, since they are almost common for all scenarios of the comparative study.
In fact, the final goal of this research work is to propose a better configuration of the OOSC in Tunisia which meets the SD requirement as much as possible, that means, to offer a sustainable OOSC configuration that aims to ensure, as much as possible, economic profitability, environment respect, and social well-being.
Therefore, the proposed approach is based on a comparative study of the different Tunisian scenarios existing for the agricultural production phase and for the olive oil processing phase and, consequently, also for the by-product processing phase. To do this we apply the fuzzy TOPSIS method following a survey carried out in order to identify the best performing scenario for each phase from a SD perspective among the different possible scenarios. Figure 1 illustrates the flowchart of the proposed approach.

2.2.2. Fuzzy Logic

Fuzzy logic makes a link between numerical modeling and symbolic modeling [33]. Its fundamental concept is to use linguistic terms, instead of numerical values, to model the uncertainties of human judgments. This means that, for example, for the selection of suppliers, performance or weights of supplier criteria or best scenario evaluations are made using linguistic variables. In fact, fuzzy logic helps decision makers avoid assigning precise numbers by allowing them to make judgments using linguistic terms.
Fuzzy sets are characterized by a membership function μ z ˜ (x) which measures the degree to which an element belongs to the fuzzy set and assigns each element a value between 0 and 1 which can be represented as:
μ z ˜   ( x ) :   X     [ 0 , 1 ]
However, for a fuzzy set Z ˜ , X is the universe of discourse for which each element is assigned the value between 0 and 1.
Membership functions can have different forms, however, in the literature, trapezoidal or triangular fuzzy numbers are the most frequently used. These membership functions, therefore, make it possible to represent fuzzy sets graphically. Therefore, for this article, the triangular fuzzy number approach is applied because it is widely adopted in the literature.
Thereby, a triangular fuzzy number Z ˜ defined on ℝ represented by a triplet (a, b, c). Then, the membership function μ z ˜ (x) of triangular fuzzy number x ˜ is given as follows:
μ z ˜ ( x ) = { 0 i f   x < a x a b a i f   a x b c x c b i f   b < x c 0 i f   x > c
Let x ¯ = ( a 1 , b 1 , c 1 ) and y ¯ = ( a 2 , b 2 , c 2 ) two fuzzy numbers. The distance between them is given by the following equation:
d ( x ¯ , y ¯ ) = 1 3 [ ( a 1 a 2 ) 2 + ( b 1 b 2 ) 2 + ( c 1 c 2 ) 2 ]
The concept of linguistic variables plays an essential role in fuzzy logic field. Thus, a linguistic variable, as the name suggests, is a variable defined on the basis of words or phrases instead of numbers.
In fuzzy logic, conversion scales are applied to transform linguistic terms into fuzzy numbers. In this article, a scale from 1 to 9 is applied to evaluate criteria and alternatives. Table 1 presents the linguistic variables and fuzzy evaluations for alternatives and criteria. The triangular fuzzy number values chosen for the linguistic variables take into account the fuzziness and the distance between the variables, as expressed by Equations (1) and (2). According to Sodhi and Prabhakar [34], the intervals are chosen in order to have a uniform representation from 1 to 9 for the fuzzy triangular numbers used for the five linguistic ratings. For instance, one can also choose (4,5,6) instead of (1,1,3) to represent very low if one wishes so, however in that case, the “1 to 9” ratings would begin from 4 instead of 1. The normalization step takes care of such shifting of the rating scale. The common practice in the literature is to start the ratings scales from 1.

2.2.3. Fuzzy TOPSIS Method

Fuzzy TOPSIS is a multi-criteria evaluation method, which can be used to evaluate multiple alternatives against selected criteria. Its basic concept is that the chosen alternative must have the shortest distance to the fuzzy positive ideal solution, and the furthest distance to the fuzzy negative ideal solution (which degrades all criteria).
Triantaphyllou and Lin [19] initially proposed the fuzzy TOPSIS method as part of integrating fuzzy logic into a set of multi-criteria decision methods, among them the TOPSIS method. Subsequently, for the theoretical development of fuzzy TOPSIS, Chen [35] proposed the fuzzy version of the TOPSIS method in the context of group decision making using fuzzy triangular numbers. Since Chen’s contribution in 2000, more development of this method has attracted the attention of researchers in theory and practice. Thus, this method is widely used in several fields of study including the food supply chain. For instance, fuzzy TOPSIS was used in several fields in the literature such as financial performance evaluation [36], supplier selection [5,37,38], optimal site selection [39,40], renewable energy infrastructure [41], quality management [42], construction and infrastructure [43,44], and maintenance planning [45], etc.
Cappelletti and al. [15] analyzed combinations of agricultural techniques and olive oil extraction processes from a sustainable development perspective and identified the best alternative by applying the fuzzy TOPSIS method. Kozarevic and Puska [7] carried out a study, in which the objective was to show an innovative way to process the collected data and to measure the practices and performances of supply chain using the fuzzy TOPSIS method. The methodology was applied for companies in the food industry to measure the influence of an independent variable of supply chain practice on the dependent variable of supply chain performance.
According to the above literature review, all the evaluations, as well as the weights are defined by linguistic variables in the fuzzy TOPSIS method. The method consists of the following six steps:
Step 1 
Construction of the collective preference fuzzy decision matrix
This collective preference is obtained by aggregating the stakeholders’ opinions. Suppose that we have p decision makers or stakeholders, where each decision maker k {1, …, p} gives an appreciation matrix of a set of objects in linguistic form. An object can be a location, a scenario, a supplier, etc. After transforming the matrix from linguistic form to fuzzy form, we seek to obtain an aggregate matrix of all p opinions.
In fact, if the fuzzy evaluation of the kth decision maker, about the ith alternative on the jth criterion, let x ˜ ijk = (aijk, bijk, cijk), where i = 1, 2, …, m and j = 1, 2, …, n, then, to calculate the aggregate fuzzy evaluations x ˜ ij for the case of the triangular fuzzy numbers of each alternatives i with respect to each criterion j are given by x ˜ ij = (aij, bij, cij), we use the following formulas:
a ij = min k { a ij k } , b ij = 1 p k = 1 p b ij k , c ij = max k { c ij k }
Suppose we have m alternatives Ai (i = 1, 2, …, m) which have to be evaluated using n criteria Cj (j = 1, 2, …, n) the corresponding evaluation matrix is given in Table 2.
W = ( w ˜ 1, w ˜ 2, w ˜ n) represents the weights vector of different criteria.
x ˜ ij and w ˜ j are triangular fuzzy numbers with x ˜ ij = (aij, bij, cij) and w ˜ j = (wj1, wj2, wj3).
x ˜ ij represents the appreciation of each alternative Ai with respect to each criterion Cj and w ˜ j represents the weight of criterion Cj.
Step 2 
Normalization of the fuzzy decision matrix
The normalized values of the triangular fuzzy numbers belong to [0, 1]. The normalized fuzzy decision matrix is given in the general case by the following formula:
R ˜ = [ r ˜ ij ]   m × n ,   i   =   1 , 2 ,   ,   m   and   j   =   1 , 2 ,   ,   n
However, for triangular fuzzy numbers x ˜ ij = ( a ij, b ij, c ij) the normalized values are calculated as follows:
For benefit criteria,
r ˜ ij =   ( a i j c j * ,   b i j c j * ,   c i j c j * )
with c j * = max {cij}.
For cost criteria,
r ˜ ij   =   ( a j c i j ,   a j b i j ,   a j a i j )
with aj = min {aij}.
Step 3 
The weighting of the normalized fuzzy decision matrix
Taking into account the different weights for each criterion, the weighted normalized fuzzy decision matrix is calculated by multiplying the importance weights of the criteria by the normalized values.
These normalized values of the decision matrix V ˜ are defined as follows:
V ˜ = [ v ˜ ij ]   m × n   with   v ˜ ij   =   r ˜ ij × w j ,   for   i =   1 , 2 ,   ,   m   and   j =   1 , 2 ,   ,   n
with w j the fuzzy weight for the criterion Cj.
x ˜ × y ˜ = ( a 1 × a 2 ,   b 1 × b 2 ,   c 1 × c 2 )
Step 4 
Calculation of fuzzy positive ideal solution and fuzzy negative ideal solution
The fuzzy positive ideal solution (FPIS) noted A+ and the fuzzy negative ideal solution (FNIS) noted A are composed, respectively, of the best performance values and the worst performance values of the alternatives. They are defined as follows:
A + = ( v ˜ 1 + ,   v ˜ 2 + ,   ,   v ˜ n + )   with   v ˜ j + = max   i   { v i j } i   =   1 , 2 ,   ,   m   and   j   =   1 , 2 ,   ,   n
A = ( v ˜ 1 ,   v ˜ 2 ,   ,   v ˜ n )   with   v ˜ j = min   i   { v i j } i   =   1 , 2 ,   ,   m   and   j   =   1 , 2 ,   ,   n
Step 5 
The calculation of the distances of each alternative compared to FPIS and FNIS
These distances are calculated as follows:
d i + = j = 1 n d ( ν ˜ i j , v ˜ j + ) i   =   1 , 2 ,   ,   m   and   j   =   1 , 2 ,   ,   n
d i = j = 1 n d ( ν ˜ i j , v ˜ j )   i   =   1 , 2 ,   ,   m   and   j   =   1 , 2 ,   ,   n
However, distance between two triangular fuzzy numbers is defined as already mentioned in Equation (2).
Step 6 
Calculation of proximity coefficients and classification of alternatives
The closeness coefficient (CCi) of each alternative Ai represents the distance to the fuzzy positive ideal solution A+ and to the fuzzy negative ideal solution, A simultaneously. It is given by:
c c i = d i d i + d i + ,   i   =   1 , 2 ,   ,   m
An alternative Ai with a proximity coefficient (CCi) close to 1, indicates that this alternative is close to FPIS and far from FNIS. Indeed, the ranking of alternatives is realized in descending order of CCi. The alternative which has the greatest CCi will be the most adequate or satisfactory choice.

3. Results

The proposed approach is based on three input types include the following: (1) six SD indicators; (2) the different scenarios observed in Tunisian OOSC, i.e., five different scenarios observed for the olive agricultural production phase and three different scenarios observed for the olive oil transformation phase; (3) the evaluations of the different scenarios according to the different indicators using the results of one survey for each phase.

3.1. The Selected Sustainability Indicators

In this study, six indicators were selected from the literature. These are quality and financial performance for the economic dimension, environmental management, and pollution for the environmental dimension, and work rights and societal commitment for the social dimension. The six indicators are defined as follows:
Financial performance This is defined according to Orlitzky [46], as “the financial viability (profitability) of a firm and is the extent to which an enterprise achieves its economic objectives”.
Quality Baumann [46] believes that this indicator is evaluated by the quality of the products/services offered, the quality of suppliers to meet the expectations of their customers. and the quality of production.
Environmental management This indicator is evaluated according to [47] by the number of investments in environmental protection, the number of certifications related to the environment protection, compliance with environmental regulations, and the involvement of employees in the environment protection.
Pollution Also, according to [47], this indicator includes air pollution (especially greenhouse gas emissions, etc.), water pollution (such as direct discharges, surface water), soil pollution (such as releases of heavy metals, phenols, dioxins, or hydrocarbons), and other pollution (such as visual pollution, radiation, noise or odors).
Work rights The same author [47] considers that this issue includes the fight against forced labor and child labor, freedom of association, and non-discrimination (on race, sex, or otherwise).
Societal commitment This indicator can be thought of as the company actions within society at large. This indicator refers, in fact, to integration into society, recruitment into company, and the relationships that may exist among companies.

3.2. Dataset

In order to achieve the desired objective, a data collection step was adopted that was based on surveys carried out. Moreover, data concerning olive farms and oil extraction factories are generally unavailable or not updated. To fill this gap, we used surveys that were conducted in the region of Sfax covering technical, economic, environmental, and social aspects of olive farms and oil mills, which allowed us to set up the basis of data required for the planned study.
In this research, two surveys were carried out during the period September 2017–March 2018. The first survey concerned 30 farmers in the region of Sfax (in Tunisia) to study the agricultural phase. The second survey concerned 32 managers of oil extraction factories also located in Tunisia. These surveys concerned a significant number of stakeholder perceptions that were used to assess sustainability in the execution of the multi-criteria method. Indeed, it was vital to have relevant input data to obtain accuracy and precision of performance criteria.
A questionnaire was designed for each phase, to collect information for the evaluation of the above-mentioned indicators. However, a majority of ratings could not be measured accurately since some decision makers gave their judgment using linguistic terms such as small, medium, and large. Hence, the idea of using the fuzzy concept with the TOPSIS method.

3.3. Identification of Possibles Scenarios

Differences were appreciated during the study of the OOSC in Tunisia and the surveys carried out identified different scenarios of this chain which were the most representative of the current situation in the region of Sfax, and in Tunisia in general. The system limits of these scenarios take into account the differences observed at the level of the OOSC and include the following three main phases: the agricultural production phase, the olive oil transformation phase, and the by-products processing phase.

3.3.1. Agricultural Scenarios

Let us start with the agricultural production phase, for this phase, different olive growing systems coexist depending on the following:
  • Plantation type, i.e., extensive or intensive system;
  • Irrigation, i.e., rainfed or irrigated agriculture;
  • Cultivation practices, i.e., conventional or organic practices;
  • Soil management, pruning, and harvesting, i.e., manual or mechanized.
The olive growing systems, in Tunisia, are classified according to the plantation type as follows:
  • Extensive olive growing, i.e., densities <60 trees/ha;
  • Intensive olive growing, i.e., densities between 150 et 600 trees/ha;
  • Hyper-intensive olive growing, i.e., densities of 600 to 1666 trees/ha.
As a result, the agricultural scenarios considered are as follows:

Scenario 1 (ASc1): Intensive System

In Tunisia, modern agriculture is relatively intensive. Intensification is a package, it includes intensifying the density of olive trees per hectare and also intensifying the factors of production, for example, more concentration of the compost (fertilization), additional irrigation, more pruning, etc. The main characteristics of this olive growing system in Tunisia are the following: the orchard size is generally 5 to 10 hectares, full production is achieved after 8 to 10 years with a production generally between 2 to 5 T per hectare, its economic life is in the order of 30 to 40 years but the cost of production remains high. In Tunisia, the harvest is manual (by stalk shaker), in fact, for this cultivation system, the density exceeds 150 trees/ha. Cultivation practices are conventional, since the system uses chemical fertilizer, and it is also an irrigated system with mechanized soil management, manual pruning and harvesting, and mechanized fertilization.

Scenario 2 (ASc2): Hyper-Intensive System

The problem of alternation is frequently observed, caused by the need to strictly control growth and fruiting. Thus, in order to overcome these constraints, during the last decade, this new olive growing system has emerged with the goal of mechanizing olive harvesting by adapting the tree to the machine. This system represents a new productive olive growing mode, regular and mostly mechanized.
Its main characteristics are as follows:
  • An increased planting density (>1000 olive trees per hectare);
  • Intensive soil management, with the systematic use of chemical fertilizers and pesticides;
  • Maximization of productivity thanks to the mechanization of the harvest, which reduces its duration (between 2 and 3 h per hectare).
In Tunisia, this system has a density up to 1666 feet/ha, it is conventional since it uses chemical fertilizers, and is also irrigated with mechanized tillage, a pruning and a mechanized harvest, and in some cases manual, a mechanized fertilization with fertigation. For this olive growing system, full production is reached after four years and the potential rate of return in full production is around 8 to 12 t per hectare.

Scenario 3 (ASc3): Conventional Extensive System

An extensive or traditional olive growing system is characterized by very old agricultural practices, and it persists in all olive-growing countries. This cultivation system is characterized by low production, and manual olive harvesting which requires extensive use of labor, leading to very high production costs. In addition, these farms are most often with few inputs and few chemicals. Olive trees are often older than in modern systems. In Tunisia, the olive sector is essentially based on traditional farms, most often family-owned and managed by the oldest, and often not limited to the cultivation of olive trees only.
These orchards cultivated in conventional extensive are characterized by a low density (less than 60 trees/ha), trees generally old (more than 50 years), low agricultural inputs such as fertilizers or pesticides, a manual harvest, and generally, it is a rainfed system.

Scenario 4 (ASc4): Organic Extensive System

Organic farming is a method of agricultural production which is characterized by the absence of the use of synthetic chemistry. Organic olive growing is rainfed and extensive, with high labor use and low planting densities, typically 17 trees/ha. Olive trees are often older than in modern systems. In fact, this system is practically like the extensive conventional system described above except for being an organic system and not a conventional one (no use of chemicals). Likewise, the workforce is mostly unskilled and represents the bulk of production costs, especially for harvesting and pruning.

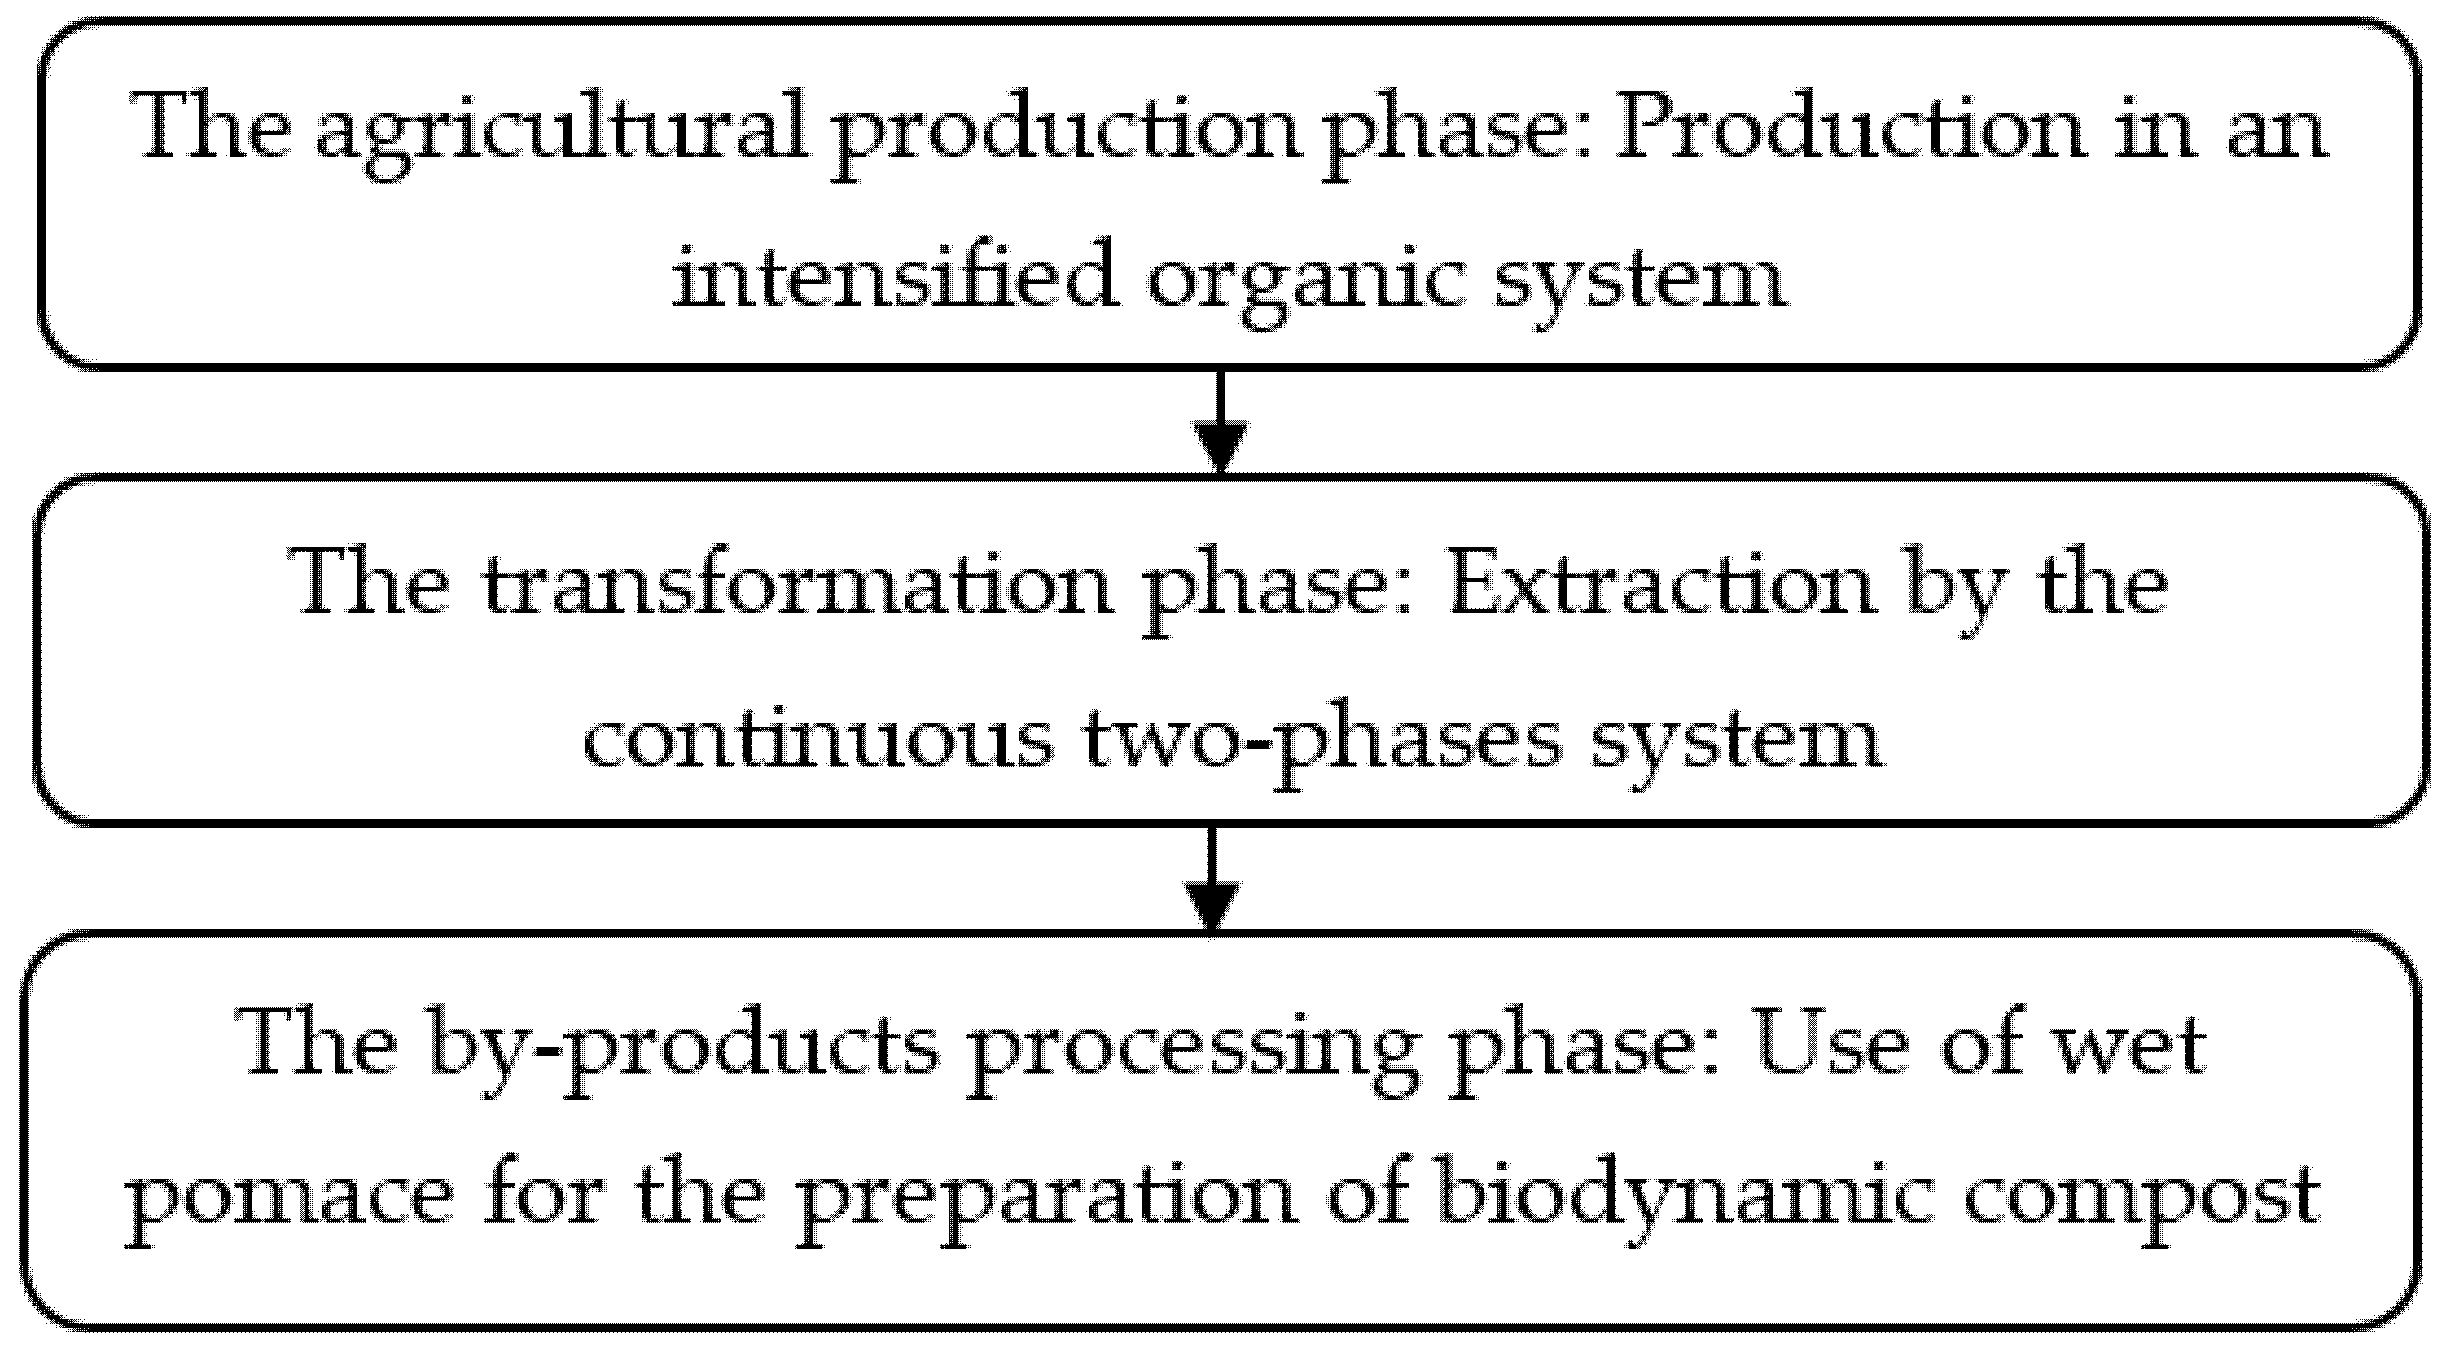
Scenario 5 (ASc5): Intensified Organic System

A new commercial category has attracted attention in recent years, that is, “olive oil extra virgin biodynamic” on some labels which designates an extra virgin olive oil that has been obtained by the processes of biodynamic agriculture. This type of agriculture is based on the theories of Rudolf Steiner, who emphasizes the balance and interrelation of soils, plants, and animals as a system of self-nutrition without external intervention (to the extent possible). Thus, this agriculture seeks to intensify exchanges between olive trees (for the olive sector) and their environment. This type of agriculture is similar to organic farming, since there is no use of chemicals. However, what differentiates biodynamic farming from organic farming is that the former uses plant and mineral preparations as a complement to compost and uses a seed calendar based on the movements of the stars.
Traditional agriculture emphasizes physical, chemical, or biological reality. Biodynamic agriculture, on the other hand, recognizes the existence of subtle energy forces in nature and promotes their expression through specialized “dynamic” practices. A distinctive feature of biodynamic agriculture is the use of nine biodynamic preparations described by Rudolf Steiner to improve soil quality and stimulate plant life. “They [biodynamic preparation] consist of mineral, plant, or animal manure extracts, usually fermented and applied in small proportions to compost, manures, the soil, or directly onto plants, after dilution and stirring procedures called dynamizations” (Diver, 1999). These preparations noted (BD) are numbered 500−508. The application of this cultivation system found in Tunisia is an advanced organic system, it is slightly intensified with a density of 34 trees/ha and rainfed but with additional irrigation when needed, with mechanized tillage, manual pruning and harvesting and mechanized fertilization with fertigation.

3.3.2. Transformation Scenarios

For the olive oil transformation phase, three extraction systems coexist in Tunisia. Therefore, the transformation scenarios considered are as follows: traditional system, continuous three-phase system, and continuous two-phase system. These systems are defined in Section 2.1.

3.4. Fuzzy TOPSIS Application

Next, we present the scenarios/indicators evaluation process. In fact, in this section, on the basis of the data collected (from the survey), an analysis was carried out to assess the sustainability of olive farm systems and oil mill systems subject to this study, and to carry out a comparison among the different observed agricultural scenarios, as well as the transformation scenarios.

3.4.1. Application for Agricultural Phase

First, we begin with the proposed approach application for the agricultural phase. For this case, there are five agricultural scenarios, in Tunisia, to be evaluated, therefore, i = 1, …, 5 represents the alternatives, which are as follows:
  • Scenario 1 (ASc1), an intensive system;
  • Scenario 2 (ASc2), a hyper-intensive system;
  • Scenario 3 (ASc3), a conventional extensive system;
  • Scenario 4 (ASc4), an organic extensive system;
  • Scenario 5 (ASc5), an intensified organic system.
In this article, in order to be able to obtain a triangular fuzzy aggregate matrix of all opinions, we apply the aggregation method to obtain an evaluation consensus for the stakeholders surveyed. We add the weights of the evaluation criteria (the selected indicators) as follows: (1) Evaluations of weights must relate to the linguistic variables defined in Table 1. (2) As our indicators are divided into two indicators for each dimension of SD, the distribution between each two indicators of the same dimension is done equally. (3) Among the three dimensions of SD, the distribution is made according to the opinions of the stakeholders surveyed (olive growers for this first case). Among the olive growers, 92% give the following ratings: the economic dimension takes the rating “very high”, the environmental dimension takes the rating “high”, and the social dimension takes the rating “medium”. In the first survey, only two olive growers did not give the same evaluations. Therefore, the weighted aggregated fuzzy matrix is given in Table 3.
The calculus detail is given in Supplementary Materials. Table S1 presents the detail of the aggregated fuzzy matrix used in the agricultural phase. Table S2 presents the weighted aggregated fuzzy matrix for agricultural phase. The normalization of the decision matrix is done according to Equation (5) and the results of this step are given in Table S3. The calculation of the weighted normalized fuzzy decision matrix is done according to Equations (8) and (9) and the corresponding results are given in Table S4. The determination of the fuzzy positive ideal solution (FPIS) and the fuzzy negative ideal solution (FNIS) are achieved by applying, respectively, Equations (10) and (11) and the results are detailed in Table S5. Calculation of the distances of each alternative Ai from FPIS and FNIS by applying Equations (12) and (13) and the obtained results are presented, respectively, in Tables S6 and S7. Finally, the calculation of the closeness coefficient (CCi) of each alternative and alternative rankings are calculated according to Equation (14) and the final obtained results are given in Table 4. From Table 4, we can see that ASc5 (scenario 5 for agricultural phase) which corresponds to the intensified organic system is the most sustainable system, followed by the organic system, and then the intensive system. While the hyper-intensive system and the conventional extensive system are the least durable systems.

3.4.2. Application for Transformation Phase

The proposed approach is also applied to the transformation phase. In Tunisia, there are three transformation scenarios to be evaluated, i = 1, …, 3 represent the alternatives, which are as follows:
  • Scenario 1 (TSc1), traditional extraction system;
  • Scenario 2 (TSc2), three-phase extraction system;
  • Scenario 3 (TSc3), two-phase extraction system.
We add the weights of the evaluation criteria (the selected indicators) in the same way as for the agricultural phase. In the second survey, 90% of the managers of oil extraction factories give the following evaluations: the economic dimension takes the evaluation “very high”, the environmental dimension takes the evaluation “high”, and the social dimension takes the “medium” evaluation. Only three managers of oil extraction factories did not give these same evaluations. Therefore, the final weighted aggregated fuzzy matrix for the transformation phase is given in Table 5.
The calculus detail is given in Supplementary Materials. Table S8 presents the detail of the aggregated fuzzy matrix used in the transformation phase. Table S9 presents the weighted aggregated fuzzy matrix for the transformation phase. The normalization of the decision matrix is done according to Equation (5) and the results of this step are given in Table S10. The calculation of the weighted normalized fuzzy decision matrix is done according to Equations (8) and (9) and the corresponding results are given in Table S11. The determination of the fuzzy positive ideal solution (FPIS) and the fuzzy negative ideal solution (FNIS) are achieved by applying, respectively, Equations (10) and (11) and the results are detailed in Table S12. Calculation of the distances of each alternative Ai from FPIS and FNIS by applying Equations (12) and (13) and the obtained results are presented, respectively, in Tables S13 and S14. Finally, the calculation of the closeness coefficient (CCi) of each alternative and the alternative rankings are calculated according to Equation (14) and the final obtained results are given in Table 6. From this table, we can see that TSc3 (scenario 3 for the transformation phase) which corresponds to the two-phase continuous system is the most durable system followed by the three-phase continuous system, and then the traditional system.

4. Discussion

The best proposed configuration does ensure sustainability of the OOSC. This proposed best configuration is illustrated in Figure 2.

4.1. Configuration of the Agricultural Phase

For the agricultural production phase, first, it should be mentioned that the more the density increases the more the environmental impact increases, and therefore the high-density systems obtained the last rank in the ranking made in this study. Thus, the organic production system is considered to be an environmentally sustainable and economically viable system. This system, as compared with the conventional system, has better performance for reducing the environmental burden of agricultural practices, primarily due to lower environmental impacts on resource depletion, reflecting higher efficiency in reducing fossil fuel consumption, especially during weed and pest control activities.
Olive production in the world is often characterized by significant interannual fluctuations which are explained by the alternation of production. Therefore, increasing the number of trees per hectare represents a possibility of improving productivity, by achieving a stable level of production to meet global commitments. It should be noted that this concept of intensive olive growing is not limited to the high number of trees per hectare, but also encompasses factors of production such as fertilization, localized irrigation, and the choice of the appropriate size for better profitability as compared with extensive cultivation. In addition, production in intensive olive growing is much higher than in extensive production systems. Nevertheless, some factors limit the expansion of this system, in particular, the availability of water and certain other production factors such as finance and labor.
All this explains why the intensified organic system remains to be the best choice. It is a small intensified system, in which density is higher than that applied for the extensive system (24 plants/ha instead of 17/ha) in addition to the promotion of the production factor, in particular, composting favored by the application of the preparations of biodynamic agriculture, the application of complementary irrigation, etc.
Riesgo and Gallego-Ayala [3] used a hybrid MCDA model and integrated the AHP and TOPSIS to rank the olive farms in terms of their sustainability in Andalusia (Spain). They concluded that “intensive olive farms” were the most sustainable. Their result was the same as our finding in the agricultural phase. However, Cappelletti el al. [15], using a Fuzzy TOPSIS method, affirmed that the traditional farming method, which has existed in Italy for centuries, named centuries-old olive orchard, was the most sustainable. This difference between the results seems to be logical, because each country has its own traditions that can influence sustainability.

4.2. Configuration of the Transformation Phase

For the transformation phase, the first thing to mention is that, according to the study carried out, the industrial oil yield varies depending on the extraction system used. In fact, the oil yield generated by the two-phase system is higher than the other two systems. As well, the acidity level of the oil produced by the continuous systems is better than that of the oil extracted by the traditional system.
From an environmental point of view, the two-phase system is considred to be environmentally friendly, due to the reduced water and energy requirements and the reduced pollution load as compared with the other two systems. When extracting olive oil, water consumption varies depending on the extraction system used. In fact, to produce 1 Kg of olive oil, the three-phase system requires 3.6 L of water, while the traditional system consumes 2.45 L, and the two-phase system consumes only 2 L (according to the survey carried out). This is explained by the injection of water during the crushing of the olives by the three-phase system.
For energy consumption, the three-phase system is the system that consumes more energy with a value of 0.32 kWh per kg of olive oil. Energy consumption for the discontinuous system and the two-phase system is 0.21 kWh and 0.25 kWh, respectively. Concerning the by-products, to produce one kg of olive oil, the discontinuous system produces 1435 kg of dry pomace and 2675 kg of vegetable water, the three-phase system produces 1.85 kg of dry olive cake and 4551 kg of vegetable water, while the two-phase system produces 2.645 kg of wet pomace and 0.569 kg of vegetable water mainly from washing of olives and equipment.
As a result, the two-phase system solves most of the environmental problems of the olive oil processing industry. In contrast, the three-phase system produces large volumes of wastewater, due to the use of a large amount of water, representing the most critical aspect of this process. The major drawback for the continuous two-phase system is the mixture of vegetable water and olive pomace, i.e., the wet pomace, which is more difficult to exploit.
Olive oil by-products are pomace and vegetable water. Their characteristics and quantities strongly depend on the oil extraction system used, and therefore their management differs. This is why the by-product processing phase is closely linked to the olive oil transformation phase.
In general, in order to ensure the sustainability of the OOSC, great care is needed for these three main phases, agricultural production, the transformation of olive into oil, and the by-products processing. Given all the problems facing the Tunisian olive oil (OO) sector, a restructuring and modernization of this sector is necessary, as well as the use of appropriate technologies for all the OOSC to produce a better oil quality at a lower cost, while reducing costs, negative impacts on the environment, and ensuring social well-being.
Regarding the transformation phase, there are no similar studies to compare with our results, with the exception of Cappelletti el al. [15] who declared that the innovative de-pitted system derived from a patent (“Moliden-Leone” patent no. 0001416964, Italy) was the most sustainable oil transformation process.

4.3. Final Proposed Configuration

In this article, a better configuration for the OOSC in Tunisia is proposed in order to achieve sustainability objectives, and therefore ensure a sustainable OOSC. The proposed configuration involves biodynamic olive growing followed by a continuous two-phase system that produces an olive oil with very good quality and a tastier taste (rich in natural antioxidants, polyphenol, etc.) while preserving the environment and ensuring social well-being.
In fact, for the agricultural phase, biodynamic olive growing (the intensified organic scenario) is an agricultural production method which has everyday benefits, given that it respects the environment and human health and the agricultural ecosystem. It does not use synthetic chemicals, conserves biodiversity, does not waste natural resources, and generates healthy products for human well-being. In addition, it ensures economic performance since it allows for better quality oil. For the olive oil transformation phase, the continuous two-phase extraction system is the best scenario, since it achieves the best quality of olive oil sought and good economic profitability, in addition to effectively contributing to the preservation of the environment, as well as social well-being. For the by-product processing phase, the continuous two-phase extraction system releases only wet pomace as a by-product, which can be successfully used in the preparation of compost for the biodynamic olive growing system. Thus, a large part of these by-products could be upgraded. Therefore, by applying the scenarios proposed for the agricultural phase and the transformation phase, the problem of by-product processing is also solved in a very suitable way. As proposed, sustainable and economically viable by-product management in the olive oil sector is an emerging challenge.

5. Conclusions

The integration of SD principles into the supply chain amounts to voluntary incorporation into the supply chain management of economic, environmental, and social dimensions, reconciling economic profitability with respect to the natural environment and social performance.
Agriculture is one of the pillars of the Tunisian economy and olive cultivation is one of the main economic and agricultural sectors. Thus, development policies in the olive sector must establish a sustainable OOSC, which aims to ensure economic profitability while preserving the natural environment and social well-being. In this article, a better configuration of the OOSC in the Tunisian context is proposed to ensure its sustainability.
On the basis of the different scenarios observed in the Tunisian OOSC and the SD indicators selected, we proposed an approach in matrix form which is used to evaluate the various potential scenarios for the olive oil production phase and the oil transformation phase from a SD point of view. By applying a fuzzy framework based on the fuzzy TOPSIS method, we have identified the best scenarios for each of these phases which ensure its sustainability.
This allowed us to propose a strategic plan that manifests in a better configuration of a sustainable OOSC in Tunisia. This best configuration is composed of an intensified organic cultivation system for the agricultural production phase, a continuous two-phase extraction system for the oil transformation phase, and a highly efficient recovery of by-products manifesting in their reuse for the preparation of biodynamic compost of the intensified organic system of the agricultural phase.
However, this research has some limitations. Firstly, indicators reflecting sustainability, used in the proposed approach, were selected from the literature among several others; this remains to be a choice which could be reviewed or modified. In order to promote this research work, we also propose to go beyond the proposal of a better configuration of the sustainable OOSC in Tunisia by studying the possibility of implementing this configuration. During the research, some improvement areas were identified. Future work directions should concentrate on research include the following: (1) The study of other phases of the OOSC such as olive oil exportation, olive oil internal distribution, etc. (2) The real implementation of the proposed OOSC configuration under a pilot project to determine feasibility, time, cost, risk, and plan before carrying out a similar larger scale project.

Supplementary Materials

The following are available online at https://www.mdpi.com/2071-1050/13/2/722/s1, Table S1: Aggregated fuzzy matrix for agricultural phase, Table S2: Weighted aggregated fuzzy matrix for agricultural phase, Table S3: Normalization of weighted aggregated fuzzy matrix for agricultural phase, Table S4: Normalized weighted aggregated fuzzy matrix for agricultural phase, Table S5: FPIS and FNIS determination for agricultural phase, Table S6: FPIS matrix for agricultural phase, Table S7: FNIS matrix for agricultural phase, Table S8: Aggregated fuzzy matrix for transformation phase, Table S9: Weighted aggregated fuzzy matrix for transformation phase, Table S10: Normalization of weighted aggregated fuzzy matrix for transformation phase, Table S11: Normalized Weighted Aggregated Fuzzy Matrix for transformation phase, Table S12: FPIS and FNIS determination for transformation phase, Table S13: FPIS matrix for transformation phase, Table S14: FNIS matrix for transformation phase.

Author Contributions

Conceptualization, A.J. and W.H.; methodology, A.J., W.H. and A.M.A.; validation, W.H. and A.M.A.; formal analysis, A.J. and W.H.; investigation, A.J.; resources, A.J.; data curation, A.J. and W.H.; writing—original draft preparation, A.J.; writing—review and editing, W.H. and A.M.A.; visualization, A.M.A.; supervision, W.H.; project administration, W.H. and A.M.A.; funding acquisition, A.M.A. All authors have read and agreed to the published version of the manuscript.

Funding

This research was supported and funded by the Taif University Researchers Supporting project number (TURSP-2020/229), Taif University, Taif, Saudi Arabia. The authors are grateful for this financial support.

Institutional Review Board Statement

Not applicable.

Informed Consent Statement

Not applicable.

Data Availability Statement

Data is contained within the article.

Acknowledgments

This research was supported by the Taif University Researchers Supporting project number (TURSP-2020/229), Taif University, Taif, Saudi Arabia. Firstly, the authors are grateful for this financial support. Secondly, the authors would like to thank all workers and managers of the Olive Tree Institute of Sfax (Tunisia), especially Saida Elfkih assistant professor in the Department of Sustainability of Olive Tree Growing Systems and Product Quality. Finally, the authors would like to thank the editor and the anonymous reviewers, whose insightful comments and constructive suggestions helped us to significantly improve the quality of this paper.

Conflicts of Interest

The authors declare no conflict of interest.

References

  1. Salomone, R.; Ioppolo, G. Environmental impacts of olive oil production: A Life Cycle Assessment case study in the province of Messina (Sicily). J. Clean. Prod. 2012, 28, 88–100. [Google Scholar] [CrossRef]
  2. Ozkaya, G.; Erdin, C. Evaluation of sustainable forest and air quality management and the current situation in Europe through operation research methods. Sustainability 2020, 12, 10588. [Google Scholar] [CrossRef]
  3. Riesgo, L.; Gallego-Ayala, J. Multicriteria analysis of olive farms sustainability: An application of TOPSIS models. In Handbook of Operations Research in Agriculture and the Agri-Food Industry; International Series in Operations Research & Management Science; Plà-Aragonés, L., Ed.; Springer: New York, NY, USA, 2015; Volume 224, pp. 327–353. [Google Scholar]
  4. Rigo, P.D.; Rediske, G.; Rosa, C.B.; Gastaldo, N.G.; Michels, L.; Neuenfeldt Júnior, A.L.; Siluk, J.C.M. renewable energy problems: Exploring the methods to support the decision-making process. Sustainability 2020, 12, 10195. [Google Scholar] [CrossRef]
  5. Roghanian, E.; Sheykhan, A.; Abendankashi, E.S. An application of fuzzy TOPSIS to improve the process of supply chain management in the food industries: A case study of protein products manufacturing company. Decis. Sci. Lett. 2014, 3, 17–26. [Google Scholar] [CrossRef]
  6. Henke, I.; Cartenì, A.; Di Francesco, L. A sustainable evaluation processes for investments in the transport sector: A combined multi-criteria and cost–benefit analysis for a new highway in Italy. Sustainability 2020, 12, 9854. [Google Scholar] [CrossRef]
  7. Kozarević, S.; Puška, A. Use of fuzzy logic for measuring practices and performances of supply chain. Oper. Res. Perspect. 2018, 5, 150–160. [Google Scholar] [CrossRef]
  8. Ilak Peršurić, A.S. Segmenting olive oil consumers based on consumption and preferences toward extrinsic, intrinsic and sensorial attributes of olive oil. Sustainability 2020, 12, 6379. [Google Scholar] [CrossRef]
  9. Jackson, D.; Paglietti, L.; Ribeiro, M.; Karray, B. Tunisie: Analyse de la Filière Oléicole. Organisation des Nations Unies pour L’alimentation et L’agriculture. 2015. Available online: http://www.fao.org/3/a-i4104f.pdf (accessed on 10 November 2020).
  10. Guermazi, Z.; Gharsallaoui, M.; Enzo, P.; Gabsi, S.; Benincasa, C. Integrated approach for the eco design of a new process through the life cycle analysis of olive oil: Total use of olive by-products. Eur. J. Lipid Sci. Technol. 2017, 119, 1–31. [Google Scholar] [CrossRef]
  11. Avraamides, M.; Fatta, D. Resource consumption and emissions from olive oil production: A life cycle inventory case study in Cyprus. J. Clean. Prod. 2008, 16, 809–821. [Google Scholar] [CrossRef]
  12. Proietti, S.; Sdringola, P.; Regni, L.; Evangelisti, N.; Brunori, A.; Ilarioni, L.; Nasini, L.; Proietti, P. Extra Virgin Olive oil as carbon negative product: Experimental analysis and validation of results. J. Clean. Prod. 2017, 166, 550–562. [Google Scholar] [CrossRef]
  13. Pattara, C.; Salomone, R.; Cichelli, A. Carbon footprint of extra virgin olive oil: A comparative and driver analysis of different production processes in Centre Italy. J. Clean. Prod. 2016, 127, 533–547. [Google Scholar] [CrossRef]
  14. Recchia, L.; Boncinelli, P.; Cini, E.; Vieri, M.; Pegna, F.G.; Sarri, D. Green Energy and Technology with Applications to Agro-Engineering Problems; Springer: Berlin/Heidelberg, Germany, 2011; pp. 99–128. [Google Scholar]
  15. Cappelletti, G.M.; Grilli, L.; Nicoletti, G.M.; Russo, C. Innovations in the olive oil sector: A fuzzy multicriteria approach. J. Clean. Prod. 2017, 159, 95–105. [Google Scholar] [CrossRef]
  16. Salabun, W.; Wątróbski, J.; Shekhovtsov, A. Are MCDA methods benchmarkable? A comparative study of TOPSIS, VIKOR, COPRAS, and PROMETHEE II Methods. Symmetry 2020, 12, 1549. [Google Scholar] [CrossRef]
  17. Watrobski, J.; Jankowski, J.; Ziemba, P.; Karczmarczyk, A.; Ziolo, M. Generalised framework for multi-criteria method selection. Omega 2019, 86, 107–124. [Google Scholar] [CrossRef]
  18. Behzadian, M.; Otaghsara, S.K.; Yazdani, M.; Ignatius, J. A state-of the-art survey of TOPSIS applications. Expert Syst. Appl. 2012, 39, 13051–13069. [Google Scholar] [CrossRef]
  19. Triantaphyllou, E.; Lin, C.T. Development and evaluation of five fuzzy multi-attribute decision-making methods. Int. J. Approx. Reason. 1996, 14, 281–310. [Google Scholar] [CrossRef] [Green Version]
  20. Ziemba, P.; Becker, A.; Becker, J. A consensus measure of expert judgment in the fuzzy TOPSIS method. Symmetry 2020, 12, 204. [Google Scholar] [CrossRef] [Green Version]
  21. Palczewski, K.; Salabun, W. The fuzzy TOPSIS applications in the last decade. Procedia Comput. Sci. 2019, 159, 2294–2303. [Google Scholar] [CrossRef]
  22. Shekhovtsov, A.; Kolodziejczyk, J.; Sałabun, W. Fuzzy model identification using monolithic and structured approaches in decision problems with partially incomplete data. Symmetry 2020, 12, 1541. [Google Scholar] [CrossRef]
  23. Karray, B. Enjeux de la filière oléicole en Tunisie et Axes de développement dans le nouveau contexte politique. Notes D’analyse CIHEAM 2012, 66, 33. [Google Scholar]
  24. Vassiliou, A.; Kabourakis, E.; Papadopoulos, D. Ethical traceability and communicating food. In Traceability and Ethical Traceability in the Greek Olive Oil Chain; Springer: Dordrecht, The Netherlands, 2008; pp. 167–191. [Google Scholar]
  25. Ghedira, A. The olive sector in Tunisia. Olivae Off. J. Int. Olive Counc. 2017, 124. Available online: http://www.onagri.nat.tn/uploads/filieres/huile-olive/Journal-officiel-du-conseil-oleicole-international.pdf (accessed on 4 July 2020).
  26. Niklis, D.; Baourakis, G.; Thabet, B.; Manthoulis, G. Trade and logistics: The case of the olive oil sector. Mediterra 2014, 11, 203–226. [Google Scholar]
  27. Conseil Oléicole International (COI). L’oléiculture en Tunisie. Marché Oléicole 2016, 106, 6. [Google Scholar]
  28. Conseil Oléicole International (COI). Communiqué de Presse Hammamet; Tunisie, 2016. Available online: http://docplayer.fr/66306488-Communique-de-presse-conseil-oleicole-international-hammamet-tunisie-juillet-2016.html (accessed on 6 October 2020).
  29. Zabaniotou, A.; Rovas, D.; Monteleone, M. Management of olive grove pruning and solid waste from olive oil extraction via thermochemical processes. Waste Biomass Valoriz. 2015, 6, 831–842. [Google Scholar] [CrossRef]
  30. Olive Oil Extraction Systems. Available online: https://www.extraevo.com/olive-oil-extraction-systems/ (accessed on 10 December 2020).
  31. Souissi, M. Gestion des Sous-Produits de L’olivier: Cas de la Région de Sfax; Editions Universitaires Européennes: Saarbrücken, Germany, 2018; pp. 1–104. [Google Scholar]
  32. Tsarouhas, P.; Achillas, C.; Aidonis, D.; Folinas, D.; Maslis, V. Life Cycle Assessment of olive oil production in Greece. J. Clean. Prod. 2015, 93, 75–83. [Google Scholar] [CrossRef]
  33. Zouggari, A. Une Approche Couplant Logique Floue et Capitalisation des Connaissances pour la Résolution du Problème de Choix des Fournisseurs. Ph.D. Thesis, Automation, Signal and Image Processing, Computer Engineering at Paul Verlaine University-METZ, Metz, France, 2011. [Google Scholar]
  34. Sodhi, B.; Prabhakar, T.V. A simplified description of fuzzy TOPSIS. arXiv 2012, arXiv:1205.5098. [Google Scholar]
  35. Chen, C.T. Extensions of the TOPSIS for group decision-making under fuzzy environment. Fuzzy Sets Syst. 2000, 114, 1–9. [Google Scholar] [CrossRef]
  36. Akkoç, S.; Vatansever, K. Fuzzy performance evaluation with AHP and TOPSIS methods: Evidence from turkish banking sector after the global financial crisis. Eurasian J. Bus. Econ. 2013, 6, 53–74. [Google Scholar]
  37. Lima-Junior, F.R.; Osiro, L.; Carpinetti, L.C.R. A comparison between Fuzzy AHP and Fuzzy TOPSIS methods to supplier selection. Appl. Soft Comput. J. 2014, 21, 194–209. [Google Scholar] [CrossRef]
  38. Memari, A.; Dargi, A.; Akbari Jokar, M.R.; Ahmad, R.; Abdul Rahim, A.R. Sustainable supplier selection: A multi-criteria intuitionistic fuzzy TOPSIS method. J. Manuf. Syst. 2019, 50, 9–24. [Google Scholar] [CrossRef]
  39. Guo, S.; Zhao, H. Optimal site selection of electric vehicle charging station by using fuzzy TOPSIS based on sustainability perspective. Appl. Energy 2015, 158, 390–402. [Google Scholar] [CrossRef]
  40. Kahraman, C.; Kutlu Gundogdu, F.; Cevik Onar, S.; Oztaysi, B. Hospital location selection using spherical fuzzy TOPSIS. In Proceedings of the 11th Conference of the European Society for Fuzzy Logic and Technology, Prague, Czech Republic, 9–13 September 2019; Volume 1, pp. 77–82. [Google Scholar]
  41. Baumli, K.; Jamasb, T. Assessing private investment in african renewable energy infrastructure: A multi-criteria decision analysis approach. Sustainability 2020, 12, 9425. [Google Scholar] [CrossRef]
  42. Ahmed, M.; Mallick, J.; AlQadhi, S.; Ben Kahla, N. Development of concrete mixture design process using MCDM approach for sustainable concrete quality management. Sustainability 2020, 12, 8110. [Google Scholar] [CrossRef]
  43. Saeli, M.; Micale, R.; Seabra, M.P.; Labrincha, J.A.; La Scalia, G. Selection of novel geopolymeric mortars for sustainable construction applications using fuzzy topsis approach. Sustainability 2020, 12, 5987. [Google Scholar] [CrossRef]
  44. Kim, S.-Y.; Thuc, L.D. Sustainable location selection for investing in public–Private partnership infrastructure projects: From a developing country’s perspective. Sustainability 2020, 12, 5914. [Google Scholar] [CrossRef]
  45. Selim, H.; Yunusoglu, M.G.; Yilmaz Balaman, Ş. A dynamic maintenance planning framework based on fuzzy TOPSIS and FMEA: Application in an international food company. Qual. Reliab. Eng. Int. 2016, 32, 795–804. [Google Scholar] [CrossRef]
  46. Orlitzky, M.; Schmidt, F.L.; Rynes, S.L. Corporate social and financial performance: A meta-analysis. Organ. Stud. 2003, 24, 403–441. [Google Scholar] [CrossRef]
  47. Baumann, E. Modèles D’évaluation des Performances Économique, Environnementale et Sociale dans les Chaînes Logistiques. Ph.D. Thesis, Productique, Institut National des Sciences Appliquées de Lyon, Lyon, France, 2011. [Google Scholar]
Figure 1. Flowchart of the proposed approach.
Sustainability 13 00722 g001
Figure 2. The best proposed configuration for Tunisian OOSC.
Sustainability 13 00722 g002
Table 1. Fuzzy ratings for linguistic variables.
Fuzzy NumbersAlternatives AssessmentWeights Assessment
(1,1,3)Very Poor (VP)Very Low (VL)
(1,3,5)Poor (P)Low (L)
(3,5,7)Fair (F)Medium (M)
(5,7,9)Good (G)High (H)
(7,9,9)Very Good (VG)Very High (VH)
Table 2. The evaluation matrix of the fuzzy TOPSIS method.
CriteriaC1C2C3Cn
lternatives
A1 x ˜ 11 x ˜ 12 x ˜ 13 x ˜ 1n
A2 x ˜ 21 x ˜ 22 x ˜ 23 x ˜ 2n
A3 x ˜ 31 x ˜ 32 x ˜ 33 x ˜ 3n
Am x ˜ m1 x ˜ m2 x ˜ m3 x ˜ mn
Table 3. Weighted aggregated fuzzy matrix for agricultural phase.
Economic, Environmental, and Social Criteria Financial PerformanceQualityEnvironmental ManagementPollutionWork RightsSocial Commitment
Weights assessment(7,9,9)(7,9,9)(5,7,9)(5,7,9)(3,5,7)(3,5,7)
ASc1(5,8,9)(5,7,9)(3,6,9)(1,3,5)(5,7,9)(5,8.5,9)
ASc2(5,8.33,9)(3,5.66,9)(3,6.33,9)(1,1,3)(5,8.33,9)(5,7,9)
ASc3(3,5,7)(5,7,9)(1,4,7)(3,5.6,9)(1,4.6,7)(5,7,9)
ASc4(3,5,7)(7,9,9)(3,6.5,9)(7,9,9)(1,4.5,7)(3,6.5,9)
ASc5(5,7,9)(7,9,9)(7,9,9)(7,9,9)(5,7,9)(5,7,9)
Table 4. Rankings of scenarios for the agricultural phase.
Alternatives d i + d i c c i Rankings
ASc17.0718.710.5513
ASc210.2176.2270.3784
ASc311.2025.7300.3385
ASc46.5719.7150.5962
ASc51.66614.8790.8991
Table 5. Weighted aggregated fuzzy matrix for the transformation phase.
Economic, Environmental, and Social CriteriaFinancial PerformanceQualityEnvironmental ManagementPollutionWork RightsSocial Commitment
Weights assessment(7,9,9)(7,9,9)(5,7,9)(5,7,9)(3,5,7)(3,5,7)
TSc1(1,3.5,7)(1,4.3,7)(5,6.16,9)(3,5,7)(1,4.6,7)(3,6.6,9)
TSc2(3,6.5,9)(5,7.5,9)(1,3.5,7)(1,2.5,5)(5,7.25,9)(3,5.5,9)
TSc3(5,8.6,9)(5,8.6,9)(3,6,9)(5,7,9)(5,8.6,9)(3,5.6,9)
Table 6. Rankings of scenarios for the olive oil transformation phase.
Alternatives d i + d i c c i Rankings
TSc110.234.2340.2923
TSc28.2076.5470.4432
TSc30.714.7350.9941
Publisher’s Note: MDPI stays neutral with regard to jurisdictional claims in published maps and institutional affiliations.

