Abstract
We used the carbon carrying capacity as an indicator of environmental productivity, clarified the emission reduction thresholds and measures for achieving a carbon neutral tourism destination, and proposed a simple, objective, and universal method for estimating the carbon budget of forest tourism scenic spots with function of both carbon sinks and carbon emissions. According to the Intergovernmental Panel on Climate Change Guidelines for Greenhouse Gas Inventories and the Climate Friendly Parks tool, a carbon emissions list with a clear border and relatively complete content was established to characterize the negative impact of tourism activities on the environment. Forest resource inventory data and the CO2Fix method could be used to accurately calculate the carbon sinks of forest tourism scenic spots. In 2019, the total CO2 emissions in Shenyang National Forest Park were 1841.445 t. The amount of CO2 sequestered by the forest was 1336.787 t, accounting for 72.59% of the total CO2 emissions. Thus, tourism had a net CO2 deficit of 504.658 t. Electricity consumption, garbage disposal, raw coal consumption, infrastructure construction, and land-use changes of forestland were the top five sources of CO2 emissions. The augmentation of the carbon pool could be improved by 65.358% of the total budget through forest management. The reduction aims of 133.41%–150.32% could be easily reached through emissions-cutting measures. Based on these results, we suggest several measures for low-carbon sustainable tourism.
1. Introduction
National forest parks not only bear the important responsibility of protecting key eco-environments and landscapes, but must also meet the needs of public sightseeing and recreation [1]. The number of visitors to the China Forest Park has increased rapidly. In 2019, the number reached 1.8 billion, accounting for 20% of the total number of domestic tourists. China’s forest tourism has been conducted following the traditional tourism model. Energy use in tourism activities, especially fossil fuel energy, has produced a large amount of greenhouse gas emissions [2]. This contrasted starkly with global efforts to curb CO2 emissions in all sectors. To reduce the pressure on the environment, the United Nations World Tourism Organization has endorsed carbon-free destinations as an avenue to deal with the problem of increasing emissions due to tourism, which is likely to become an important new concept and tool within the sustainable tourism paradigm. Potential tourism destinations may profit from following a three-step procedure to achieve carbon neutrality: measurement, decarbonizing, and offsetting [3]. Countries such as Norway and New Zealand developed carbon balance strategies for tourism development and have adopted effective measures to reduce greenhouse gas emissions. The CO2 emissions in forest scenic areas can usually be compensated for by projects such as afforestation or forest management. Controlling CO2 emissions is an inevitable step for China to achieve its carbon reduction targets, and it will profoundly affect all sectors, including forest tourism. Determining the carbon carrying capacity threshold is the first step in forest tourism carbon management. Management of carbon emissions and carbon offsets are important ways of promoting the sustainable development of forest tourism.
The carrying capacity is the maximum that environmental resource levels can support before unacceptable changes occur in the system [4,5], and is an indicator of environmental productivity. Carbon carrying capacity is the ability of the regional carbon sinks to offset CO2 emissions during a certain period, and is contingent on the interactions between travel activities and the forest environment. It would be impossible to determine the carbon carrying capacity of an area over the long run because the consequences of both tourism activity and the biological evolution of forests are inherently difficult to quantify and may fluctuate. However, for a certain period, using environmental carrying capacity indicators to judge whether the scale or intensity of tourism activities is too great is still of positive significance. A forest tourism scenic spot has the dual attributes of being a carbon source and a carbon sink. Transportation, accommodations, and tourism services in forest scenic spots generate CO2 emissions. A series of problems that are related to CO2 emissions, such as climate disturbances and a decrease in biodiversity, pose a challenge to the ecological environment of the forest. CO2 emissions can characterize the negative impacts of tourism activities on the ecological environment well [6]. However, forest ecosystems serve as carbon sinks, and the forest, water areas, and plantation in forest scenic area have a CO2 sequestration capacity. The measures we can take to curb climate change include reducing greenhouse gas emissions and increasing CO2 absorption. Within forest tourism scenic spots, we need to comprehensively consider the CO2 emissions and sinks, calculate the threshold of the carbon carrying capacity, and use this threshold as the goal for low-carbon emission reduction measures. Regional CO2 sequestration analysis and the subsequent integration of possible CO2 sinks into a portfolio of measures may be vital to establishing effective regional CO2 policies [7].
In order to monitor CO2 emissions and determine appropriate emission reduction measures for specific areas, it is necessary to comprehensively consider CO2 emissions and absorption [8]. Many studies have focused on the carbon carrying capacity of natural tourism scenic spots. However, these studies did not devote enough attention to the boundaries of the CO2 emissions in the scenic spot and the specific items on the emission inventory.
One of the difficulties in estimating the tourism carbon carrying capacity is to define the boundaries of the CO2 emissions in the forest scenic spot. In 2004 the Environmental Protection Agency, working under the auspices of the Climate Friendly Parks initiative, developed the Climate Leadership in Parks (CFP) tool to estimate the greenhouse gas (GHG) emissions in national parks. The resulting inventory included three scopes. Scope 1 included direct emissions inside the boundary from transportation, fuel use, and waste water treatment. Scope 2 included the emissions outside the boundary from electricity production. Scope 3 included emissions due to visitors using personal vehicles within the park. The World Resources Institute (WRI) has adopted a classification to delimit the scope of GHG inventories. Scopes 1 and 2 are like those of the CFP, but scope 3 emissions are defined as upstream emissions due to electricity and fossil fuel use and upstream and downstream emissions associated with key urban materials such as food and cement [9].
Villalba used a life cycle-based approach, which was consistent with the WRI’s scope 3 extended GHG emissions inventory, to estimate the total emissions of Yosemite National Park. Scope 3 included the upstream and downstream emissions, which accounted for 29.98% of the total emissions in 2011 [10]. Ding studied the carbon budget of Hongcun, a rural tourist destination, using different measurement calibers (whether it measured CO2 emissions from external traffic out of scenic spots). Without considering external traffic, the net CO2 emissions were 13.47 t. When external traffic was considered, the CO2 emissions increased to 89,090 t. Thus, the statistical boundary of the CO2 emissions had a great influence on the estimation results [11]. Chan estimated the amount of CO2 emitted from tourism activities related to the Oak Valley Resort in Wonju, Korea, in 2006. The total annual carbon emissions were estimated to be 8453 t yr−1, and the boundary of the transportation carbon emissions extended from the visitors’ homes to the scenic area [12]. Zhang established a list of CO2 emissions, including tourists and residents around the scenic spot, to estimate the carbon emissions of the tourism in the Wutai Mountain scenic spot [13].
Scholars have proposed different metrics. The total GHG emissions attributed to a certain area may be developed based on the definition of the spatial boundary or on a life cycle perspective [9,14]. However, the life cycle metric is suitable for estimating tourism industry GHG emissions. For areas with clear geographical boundaries, such as the Oak Valley Resort and Yosemite National Park, the spatial boundary should be used for the estimate, not a life cycle perspective; otherwise, the scenic area’s CO2 emissions would be overestimated.
Another difficulty in tourist destination carbon emissions inventory calculations is carbon source identification. Approaches focused on direct emissions, such as energy use and waste disposal within the geographic boundaries, are frequently used [11,15]. However, only emissions due to the use of fossil fuel energy and waste disposal ignore several important carbon emission sources. Scholars have broadened the scope of research on carbon sources and have proposed a detailed carbon budget for tourism areas. Walz et al. presented a detailed regional CO2 budget for the Alpine tourist region. The total CO2 emissions were 109,300 t in 2005. About 79.3% of these emissions originated from heating activities, 17.9% from mobility, 2.8% from machines, and 0.1% from other activities [7]. Tang et al. proposed a factor decomposition model for analyzing destination carbon emissions. The total energy consumption was measured through both direct and indirect energy consumption. The direct energy consumption included transportation, accommodations, catering, sight-seeing, shopping, and entertainment carbon emissions. The indirect GHG emissions were the carbon emissions produced during the construction of the buildings and roads [16]. The accounting of the CO2 emission inventory includes the CO2 emissions generated during the development and construction stage, which provided ideas for the improvements to the quality of the carbon emission inventory made in this study.
The accuracy of existing studies with regard to estimating forest carbon sinks needs to be improved. Chan used light detection and ranging remote sensing data to estimate carbon sequestration in forests. This is an advanced method, but it is very difficult to perform in social science research [12]. Most studies are based on preliminary estimates of the annual net changes in the global or national carbon pools based on existing studies, and they estimate the amount of carbon sequestration using a comparison between the destination land area and the existing literature research area [11,13]. These research methods can produce inaccurate results. Some documents only estimate the carbon sink of vegetation, without considering the contribution of soil carbon sequestration [12,17]. Therefore, a great deal of work needs to be done to improve the estimation of carbon sinks in forest tourist attractions.
Forest tourism scenic spots have the dual attributes of being carbon sources and carbon sinks. A single level analysis can easily lead to one-sided research conclusions. Therefore, it is necessary to combine the two in research. In this study, the following improvements were made: (1) a clear boundary and comprehensive CO2 emission inventory was established that is suitable for research on carbon emissions in forest tourism scenic spots; (2) A new theoretical approach was used to measure the reasonable environmental impact threshold of tourism activities and to assess the carbon carrying capacity of the area. This will impact forest tourism scenic spots and improve the response to national environmental regulations.
2. Study Area and Data Collection
Shenyang is located in the central part of Liaoning Province and is the capital city of Liaoning Province (41°11′45″–43°3′13″ N, 122°25′9″–123°48′24″ E). Shenyang National Forest Park is in the peri-urban area of the city of Shenyang. The 933.3 ha forest park consists of hotels, restaurants, picking farms, and an international ski resort. It is covered by 577 ha of natural secondary forest, and tourists can enter the scenic area by car and bus. In 2019, almost 190,000 tourists visited the park, 72% of which came from Shenyang and surrounding cities (see Figure 1).
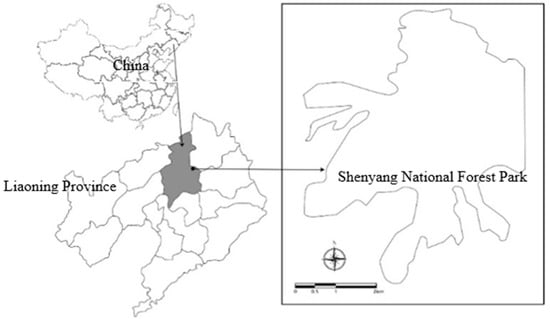
Figure 1.
The location of Shenyang National Forest Park.
The data used in this study were primarily obtained through field investigations. The survey objects and data were as follows. First, the forest resources inventory data, the total area and construction type of the infrastructure such as hotels and roads, the annual energy consumption and waste disposal, and the annual public transportation energy consumption within the boundary of the park were obtained from the Park Administrative Committee. Second, the tourism enterprises inside the scenic area, such as catering, accommodations, shopping, and entertainment, provided the annual energy consumption data. Third, the tourist energy consumption data for the traffic inside the park were obtained using the random sampling method. A total of 372 respondents completed the survey questionnaires. The other tourist energy consumption data, such as consumption through restaurants and entertainment, were obtained during the second stage of the research.
3. Methods
3.1. Research System
The CO2 budget of forest tourism scenic spots includes two aspects: carbon emissions and carbon sinks. In order to establish a budget that reflects the typical regional structures, we used a bottom-up approach and used data collected within the region. In this study, the geographical boundary of the forest tourism scenic area was used as the CO2 emission estimation boundary and the direct CO2 emissions and embodied emissions in the scenic area were used as the accounting content of the carbon emission inventory. First, the direct CO2 emissions included emissions that occurred in the scenic spots due to infrastructure construction, daily operations of the park’s administrative committee and enterprises, and tourist activities. Second, the embodied CO2 emissions refer to the important indirect CO2 emissions in scenic spots. Due to the breadth, depth, and complexity of the indirect carbon emissions, it was unrealistic to adopt a full life cycle method to calculate the CO2 emissions. There is currently a lack of research on indirect CO2 emissions in scenic spots; however, similar research on city CO2 emissions and the CFP tool provide a clear research methodology. Considering the data acquisition situation, only the main indirect CO2 emissions need to be studied. The CO2 emissions related to electricity and heating were not within the boundary of the scenic spot, but their upstream production consumed a large amount of fossil fuels, so they were recognized as the main source of CO2 emissions. Moreover, they have generally been classified as the embodied emissions of the study area [18]. The calculation of the indirect carbon emissions related to the water supply, wastewater, and waste also followed this idea and these sources were classified as embodied emissions. This does not include the indirect CO2 emissions produced in the materialization stage, such as in the supply of various tourism commodities, raw materials for catering, and construction materials.
The other aspect of research on the carbon carrying capacity of forest tourism scenic spots is measuring the regional carbon removal capacity, that is, the carbon sinks. The ecosystems with carbon sink functions in scenic spots include forest ecosystems, grassland ecosystems, agricultural ecosystems, and water ecosystems. Among them, forest ecosystems were the main factors. The calculation of these carbon sinks requires the comprehensive estimation of the above-ground biomass carbon pools, the underground biomass, and the annual changes in the soil carbon pools. Consequently, a research system for calculating the carbon carrying capacity of forest tourism scenic spots was constructed (Figure 2).
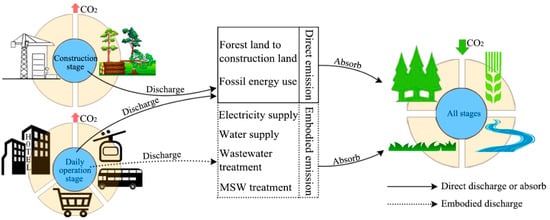
Figure 2.
Framework of the carbon carrying capacity in forest scenic spots.
3.2. Method of Determining the Annual CO2 Emissions Inventory of Forest Scenic Spots
According to the city CO2 emissions method and the CFP tool, the annual CO2 emissions of forest tourism scenic spots can be expressed as Equation (1):
where Cannual-emissions is the annual emissions of the scenic spot; CC is the average annual CO2 emissions of the infrastructure construction stage; and CE is the annual CO2 emissions from energy consumption, which occurred in both the infrastructure construction stage and the daily operation stage. CD is the annual embodied emissions, including indirect emissions due to electricity, water, wastewater, and municipal solid waste (MSW) treatment.
Cannual-emissions = CC + CE + CD
3.2.1. Cc Annual Average CO2 Emissions in the Infrastructure Construction Stage
CC is the annual average CO2 emissions in the construction stage, which includes two parts: the emissions due to land use conversion from forest land to settled land, and direct energy consumption during the construction of buildings and roads inside the park. This is expressed by Equation (2):
CC = CH + CR + CF
Then, it can be expressed in more detail as Equation (3):
where CH and CR are the average annual CO2 emissions related to houses and roads during the construction stage, respectively (kg CO2), and CF is the average annual CO2 emissions due to land use conversion from forest land to settled land (kg CO2). Sh is the area covered by different types of buildings (m2); Ch is the average annual CO2 emissions per unit area (kg CO2 m−2 yr−1) of the different types of housing during the construction stage; Sr is the area of the different types of roads (m2); Cr is the average annual CO2 emissions per unit area (kg CO2 m−2 yr−1) during the construction of different types of roads; Sf is the area converted from forest land to settled land (m2); and Cf is the average annual loss of biomass due to the conversion of forest land to settled land per unit area (kg C m−2). N is 20 years. TC is 12/44 for the conversion of C from CO2 based on the ratio of their molecular weights.
CF is the annual average CO2 emissions due to the conversion of forest land to settled land, and it is described in detail below. First, according to the Intergovernmental Panel on Climate Change (IPCC) Guidelines for national greenhouse gas inventories, 20 years is the default length of carbon stock changes caused by land use conversion from forest land to settled land. Second, the net loss of the total forest ecosystem carbon stocks was used to estimate the CO2 emissions into the atmosphere. These consisted of the above-ground biomass and the below-ground biomass and the changes in the soil carbon pools. As was suggested by Wu et al. [19], the conversion of forest land to farmland and grassland (picking farm and lawns inside the forest tourism scenic spot) can cause the overall loss of above-ground and under-ground biomass, reducing the soil carbon storage by 60 and 36%, respectively, compared to natural secondary forests. The average total loss of carbon emissions caused by biomass loss was 23.691 t C ha yr−1, and the average carbon emissions from the soils were calculated to be 51.124 t C ha yr−1 according to the CO2Fix model. Table 5 shows the data sources input during the calculation process.
CH+CR are the annual average CO2 emissions during the infrastructure construction stage, which were calculated based on data compiled from the literature. In this study, the average annual CO2 emissions during the construction period were calculated based on the model for building life cycle carbon emissions [20,21,22]. Shenyang National Forest Park is in northeastern China, where the service life of houses is 50 years. The average annual CO2 emissions during the construction phase of wooden structures, light steel structures, and steel–concrete structures were 0.069, 0.111, and 0.135 kg CO2 m−2yr−1, respectively. The service life of roads and viewing platforms are 20 years. The average annual CO2 emissions during the construction of asphalt roads, concrete roads and platforms, and cement based composite roads were 1.318, 2.033, and 0.210 kg CO2 m−2 yr−1, respectively.
3.2.2. CE Energy Consumption CO2 Emissions
The CE includes two parts: direct CO2 emissions from fossil fuel energy consumption and indirect energy consumption through electricity in the scenic area. All the energy consumed by the park management, tourism enterprises, and tourists generate carbon emissions. First, through a survey of the park’s administrative committee and tourism enterprises, the annual consumption data for raw coal, gasoline, diesel, liquefied petroleum gas (LPG), and electricity were obtained and the CO2 emissions were estimated. Second, through a random sampling survey of tourists, the average travel distance of individual tourists traveling in scenic spots was obtained, and the carbon emissions due to the tourists’ transportation energy consumption was calculated. The energy consumption of the public transportation used by tourists in the scenic area, such as buses and cruise ships, was counted in the energy consumption data of the enterprises in the scenic area. CE can be expressed as Equation (4):
where CE is the annual energy consumption CO2 emissions (kg CO2); B is the annual energy consumption (kg or kW·h); EF is the carbon emissions coefficient (kg CO2 kg−1 or kW·h); j represents the administrative committee, tourism enterprises, and tourists in the scenic spot, and i represents the five energy sources: raw coal, gasoline, diesel, LPG, and electricity.
3.2.3. CD Water and MSW Embodied CO2 Emissions
CD is the annual water and MSW embodied emissions including three parts: indirect CO2 emissions related to the water supply, wastewater treatment, and MSW treatment. Through a survey of the park’s administrative committee and tourism enterprises, the annual water consumption data and garbage removal data were obtained. This paper summarizes the energy consumption embodied CO2 emissions related to water extraction, water production, and water transport based on the existing literature [23]. During the water treatment process in the sewage treatment plant, the biological treatment process generates CO2 emissions. CO2 emissions are also generated due to the electricity consumption during the treatment process. Based on the existing literature, the CO2 emissions from wastewater treatment are 0.837 kg CO2 m−3. Since 2017, the treatment of garbage in Shenyang has transitioned to centralized cleaning, incineration, and power generation. According to the literature, the calculated CO2 emissions coefficient per unit of garbage is 0.561 kg CO2 kg−1 [24].
Equation (5) for calculating the embodied CO2 emissions related to the water supply, garbage treatment, and sewage treatment is:
where CD is the embodied CO2 emissions (kg CO2) related to the water supply, garbage treatment, and sewage treatment in the scenic area; S is the water, sewage discharge, and garbage removal (m3 or kg) used in the scenic area each year; and EF is the CO2 emissions coefficient (kg CO2 m−3 or kg−1) for the water supply, sewage treatment, and garbage treatment.
3.3. Method of Measuring the Annual CO2 Sinks of Forest Tourism Scenic Spots
The area accounted for by grassland, arable land, and water in Shenyang National Forest Park is very small, so the influences of carbon sinks can be almost ignored. The carbon removal function of the tourist area depends on the forest ecosystem. Therefore, in this study, only the carbon sinks in the forest ecosystem were measured, and the carbon storage was calculated using the CO2Fix3.2 model. The CO2Fix model is a model that quantifies the C stocks and fluxes in forests, plantations, and multistate agroforestry [25]. It calculates the changes in the C pools in the biomass, soil (litter and humus), and wood products with a time-step of one year using the carbon accounting approach, in which the accumulated biomass is converted into C sequestration and storage [26]. The forest resources in the scenic spot are public welfare forests, in which logging is prohibited. Therefore, the wood products carbon pool was not considered, and only the biological carbon pool and the soil carbon pool were measured. The model requires data for the stem volume growth, the associated fraction allocation of the biomass compartments (foliage, branches, and roots), and the climate. The input data used for the model were obtained from the following. First, the tree species and age were obtained from the forest inventory data provided by the Shenyang National Forest Park’s administrative committee. Second, the tree biomass and litter parameters were obtained according to comparison data collected in a similar climatic zone in northern China. The current annual increment (CAI) of the trees was based on previous research data collected by our research team members [27,28,29,30]. According to the logistic growth equations for calculating the relationship between the biomass density and forest age of various forest types [31], we obtained the initial carbon density. The data for the growth rate of the branches, leaves, and roots relative to the trunk used in the CO2Fix model were obtained from Ben’s research [32]. The C stocks in the living biomass were estimated using a cohort module approach. Third, the average monthly temperature, annual precipitation, and evapotranspiration for the soil module input data was obtained from the World Bank web and the details are provided in Table 5. The output data was the biomass carbon storage, soil carbon storage, and forest ecosystem carbon storage per hectare. It could be obtained by Equation (6):
where Ct is the carbon storage of the forest ecosystem for one year; Ct + 1 − Ct is the annual change in the forest ecosystem’s carbon storage; and TC is 12/44.
Cannual-sinks = (Ct+1 − Ct) ÷ TC
3.4. Evaluation of the Status of the Carbon Budget
The CO2 budget focuses on CO2 emissions and sinks within the forest park and can be obtained by Equation (7). Based on the discussions in Section 3.2 and Section 3.3, we can calculate the carbon balance situation of the forest scenic spot:
The difference between Cannual-emissions and Cannual-sinks is the conclusion of the budget. If Cannual-emissions is less than Cannual-sinks, there is a carbon surplus (CES). If Cannual-emissions is greater than Cannual-sinks, there is a carbon deficit (CED). In order to achieve the goal of carbon-free destinations, CED was the quantitative target for reducing the CO2 emissions of forest scenic spots.
4. Results
In 2019, the annual CO2 emissions from Shenyang National Forest Park were 1841.445 t CO2. The calculation process was as follows.
4.1. Results of the CO2 emissions inventory of CC
In 2019, the CO2 emissions during the infrastructure construction stage were 303.77 t CO2, accounting for 16.496% of the total emissions inventory (Table 1).

Table 1.
Annual average CO2 emissions of the infrastructure construction stage of the scenic spot.
4.2. Results of the CO2 Emissions Inventory of CE
4.2.1. CO2 Emissions from Tourists Driving Personal Vehicles in the Scenic Area
In 2019, 190,000 people visited the Shenyang National Forest Park. According to the tourist questionnaire, the average distance the tourists traveled in the scenic area and the number of vehicles entering the park were calculated. The CO2 emissions from tourists’ personal vehicles within the scenic area were 16.472 t CO2 (Table 2), accounting for 0.895% of the total emissions inventory.
Table 2.
CO2 emissions list for transportation within the scenic spot.
4.2.2. CO2 Emissions Related to the Energy Consumption of the Park Operations
According to the annual energy consumption of the administrative committee and enterprises in the scenic spot, it was estimated that the CO2 emissions generated by the energy consumption related to park operations were 1107.175 t CO2, accounting for 60.125% of the total emissions inventory (See Table 3).
Table 3.
CO2 emissions list for the administrative committee and enterprises in the scenic spot.
4.3. Results of the CO2 Emissions Inventory of CD
Based on the annual tap water consumption and garbage removal reported by the scenic spot administrative committee, the embodied CO2 emissions of CD were 414.117 t CO2, accounting for 22.489% of the total emissions inventory (See Table 4).
Table 4.
Embodied CO2 emissions list for water supply, wastewater, and MSW treatment.
4.4. Results of the Annual Carbon Sinks in the Forest Scenic Spot
The CO2Fix model version 3.2 was parameterized using the biomass and soil input data. The details are presented in Table 5. From this, we calculated the status of the carbon sinks in the forest ecosystem of the forest scenic spot in 2019.
Table 5.
CO2 sinks in the forest ecosystem in 2019.
4.5. Regional CO2 Budget and Abatement Countermeasures for Forest Tourism Scenic Spots
4.5.1. Regional CO2 Budget of the Forest Scenic Spot
The CO2 budget indicates that the emissions were greater than the sinks; the deficit was about CED = 504.658 t CO2. Although the CO2 sinks in the forest ecosystems accounted for 1336.787 t, the total emissions were 1841.445 t CO2 in 2019.
Based on the composition of the carbon emissions, about 303.77 t CO2 were from the infrastructure construction stage (16.496%), 1123.558 t CO2 were from energy consumption (61.015%), and 414.117 t CO2 were from embodied CO2 emissions (22.489%). Furthermore, among them, electricity consumption, MSW removal, raw coal consumption, conversion of forest land into construction land, and direct CO2 emissions during the construction phase were among the top five on the carbon emission list, and thus, these factors should be the focus of the abatement countermeasures (Figure 3).
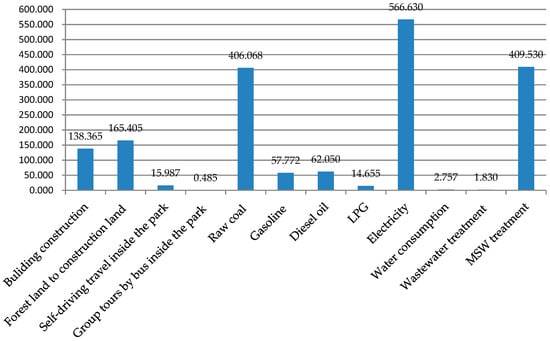
Figure 3.
Total CO2 emissions list.
4.5.2. Countermeasures and Their Impacts
Overall, the catalogue of measures encompasses about ten measures, of which the selection of five measures is discussed in this paper (Figure 3).
The management of secondary forests will improve the carbon balance of forest tourism scenic spots. The measures taken to improve forest management will increase the annual growth rate of the forest. If the growth rate increases by 5%, while the other input conditions remain unchanged [37], the results of the CO2Fix3.2 model indicate that the carbon sink will increase by 329.833 t CO2 and the carbon balance budget will increase by 65.358%.
Many emission reductions measures could improve the carbon balance of forest tourism scenic spots. In accordance with the findings on the CO2 budget, measures related to electricity consumption will the most efficient. Shenyang National Forest Park has a total indoor building area of 13,540 m2 and an outdoor road and landscape area of 96,650 m2. According to the lighting power density value (LPD limit, Wm−2) specified in the City Night Lighting Technical Specifications, the general commercial business lighting power density is 12 W m−2 and the road lighting density is 0.6 W m−2. Thus, for a daily lighting time of 4 hours, it is estimated that the electricity consumption is 321,816.120 kW·h. If LED lighting is used, it is estimated that the electricity consumption by lighting will be decreased by 50% [38]. After these renovations, it is expected that CO2 emissions will be reduced by 181.665 t CO2 and will improve the carbon balance by 35.997%.
The contribution of garbage disposal to the list is 22.240%. Shenyang National Forest Park has an average daily waste production of 2 t, of which perishable organic waste accounts for 33.7–40.6%. If it is composted for fermentation and used as fertilizer for the picking farm and trees, it is estimated that the CO2 emissions will be reduced by 138.012–166.269 t CO2, and the carbon balance budget will be improved by 27.347–32.947%.
The raw coal consumption of Shenyang National Forest Park is about 213.72 t per year. If the calorific value remains unchanged and raw coal is replaced with natural gas, the annual natural gas consumption will be 114,870 m3 and the CO2 emissions will be 248.175 t, which will improve the carbon balance budget by 49.177%.
In addition, the CO2 emissions due to land use changes from forest land to settled land were 303.77 t CO2, contributing 16.496% to the inventory in 2019. For the conversion of forest land to construction land, the 20-year interval is taken as the default length of the carbon pool change transition period after the land use changes. Since the construction period was concentrated from 2000 to 2010, the impact of the carbon emissions of the forest land use change will decrease after 2020, and the decline from 2020 to 2022 will be 105.434–162.508 t CO2. If there is no additional infrastructure construction, the carbon budget balance will be improved by 20.892–32.202% (See Figure 4).
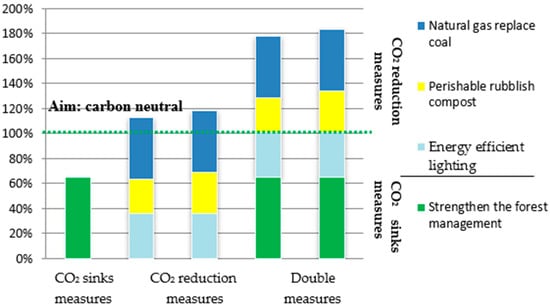
Figure 4.
Different counter measures for improving the total budget.
5. Discussion
The regional CO2 budget is an important basis for identifying the most efficient measures and policies for improving the CO2 budget on a regional level and for quantifying their impacts in the future. The methodological framework of this study is laid out according to the IPCC guidelines for greenhouse gas inventories and the CFP tool. In order to increase the accuracy of the information and to establish a better basis for the comparison of future budgets for the same scenic spot, a bottom-up approach was used in this study. The emissions and sinks were drawn from various local information sources, which may reduce the comparability of the results to those of other studies. However, the results are accurate enough for a small-scale CO2 budget study and will provide assistance for scenic spots managers to take specific emission reduction measures.
First, the system boundary defined in this study does not include the relevant CO2 emissions related to commodities transported outside the scenic area, that is, the CO2 emissions of commodity production and transportation were not considered. There are significant uncertainties in the commodities outside the scenic area, and its proportion of the total emissions was not large. This does not affect the accuracy of the emission inventory. Second, the emissions only considered the traffic within the study area. As a forest park, it is a popular holiday destination. Large numbers of tourists travel long distances to visit the park, but only a small proportion of the total travelling emissions occur within the region, and the larger proportion that occur outside the park were not accounted for in this study. Third, the contribution rate of the carbon emissions from the construction stage of the scenic spot and the changes in the use of forest land to the emissions was 16.496%, so they are important emissions, but they have often been overlooked in previous studies of the carbon emissions of scenic spots.
6. Conclusions
The bottom-up CO2 budget for the Shenyang National Forest Park is a relatively complete CO2 budget of a forest scenic spot in northern China.
The carbon deficit of Shenyang National Forest Park in 2019 was 504.658 t CO2. The number of tourists and the tourism intensity of Shenyang National Forest Park reached a medium level in the forest scenic spots in northern China. The conclusions of this study indicate that there was indeed a high carbon emission phenomenon in this forest scenic spot.
The analysis of the carbon emission inventory found that electricity consumption, garbage removal, and raw coal consumption caused the most CO2 emissions. Measures such as the use of energy saving lighting, the composting of perishable garbage, and the use of natural gas instead of raw coal will improve the carbon balance budget by 112.521–118.121%. This would achieve the carbon balance goal and generate a carbon reduction surplus.
Increasing the carbon sinks through forest management measures will improve the carbon budget by 65.358%. The double measures to increase forest carbon sink and reduce emissions will improve the carbon balance budget the most and will enable forest tourism scenic spots to achieve a carbon reduction surplus of 393.023–421.283 t CO2.
Through measures such as protective development, recycling, and cleaner production, the carbon emissions of scenic spots can be minimized and green tourism and low carbon scenic spots can be achieved.
Author Contributions
K.C. is the corresponding author. Conceptualization, D.H. and K.C.; software, D.H. and M.Y.; formal analysis, T.Z. and X.S.; investigation, T.Z. and Z.X.; data curation, D.H.; writing—original draft preparation, D.H.; writing—review and editing, K.C.; funding acquisition, D.H. All authors have read and agreed to the published version of the manuscript.
Funding
This research was funded by Liaoning Social Science Fund Key Project in China (L18AGL002), Basic Scientific Research Project of Colleges and Universities in Liaoning (WSNQN201704), Shenyang Social Science Fund in China (17058), Research Project of Economic and Social Science Development of Liaoning (20201swtkt-23), National Social Science Fund Key Project (17AJY015), and National Social Science Fund (20BGL173).
Institutional Review Board Statement
Not applicable.
Informed Consent Statement
Not applicable.
Data Availability Statement
The data presented in this study are available on request from the corresponding author. The data are not publicly available due to privacy.
Acknowledgments
We should like to thanks all the staff of Shenyang National Forest Park.
Conflicts of Interest
The authors declare no conflict of interest.
References
- Liu, T.M.; Tien, C.M. Assessing Tourists’ Preferences of Negative Externalities of Environmental Management Programs: A Case Study on Invasive Species in Shei-Pa National Park. Sustainability 2019, 11, 2953. [Google Scholar] [CrossRef]
- Scott, D.; Amelung, B.; Becken, S.; Geron, J.P.; Gössling, B.; Simpson, M.C. Climate Change and Tourism: Responding to Global Challenges. Clim. Chang. Tour. Responding Glob. Chall. 2007, 12, 168–181. [Google Scholar] [CrossRef]
- Gössling, S. Carbon neutral destinations: A conceptual analysis. J. Sustain. Tour. 2009, 17, 17–37. [Google Scholar] [CrossRef]
- Fernando, J.; Garrigós, S.; Narangajavana, Y.; Daniel, P.M. Carrying capacity in the tourism industry: A case study of Hengistbury Head. Tour. Manag. 2004, 25, 275–283. [Google Scholar] [CrossRef]
- Arrow, K.; Bolin, B.; Costanza, R.; Dasgupta, P. Economic Growth, Carrying Capacity, and the Environment. Environ. Dev. Econ. 1996, 1, 104–110. [Google Scholar] [CrossRef]
- Zha, J.P.; He, L.M.; Guo, H.F. Evaluation method of carbon emission performance and marginal CO2 abatement costs for tourism scenic area. Areal Res. Dev. 2017, 36, 145–150. [Google Scholar] [CrossRef]
- Walz, A.; Calonder, G.P.; Hagedorn, F.; Hagedorn, C.; Limdström, C.; Stoeckli, V. Regional CO2 budget, countermeasures and reduction aims for the alpine tourist region of Davos, Switzerland. Energy Policy 2008, 36, 811–820. [Google Scholar] [CrossRef]
- Winiwarter, W. National greenhouse gas inventories: Understanding uncertainties versus potential for improving reliability. Water Air Soil Pollut. Focus 2007, 7, 443–450. [Google Scholar] [CrossRef]
- Koch, J.R.J.; Bhatia, P. The Greenhouse Gas Protocol: A Corporate Accounting and Reporting Standard, Revised Edition. 2004. Available online: https://www.researchgate.net/publication/258261856 (accessed on 15 January 2021).
- Villalba, G.; Tarnay, L.; Campbell, E.; Gabarrell, X. A life-cycle carbon footprint of Yosemite National Park. Energy Policy 2013, 62, 1336–1343. [Google Scholar] [CrossRef]
- Ding, Y.L. The Research of Net Carbon Emissions Evaluating and Offsets in Rural Tourism Destination from the Perspective of Carbon Neutral. Ph.D. Thesis, Nanjing Normal University, Nanjing, China, 2015. [Google Scholar]
- Chan, Y.S.; Woo, C.; Suk-Hwan, H. Estimating the annual carbon budget of a weekend tourist resort in a temperate secondary forest in Korea. Urban. For. Urban. Green. 2015, 14, 413–419. [Google Scholar] [CrossRef]
- Zhang, X.J. Study on the Emission and Absorption of Carbon for Tourism Industry on Wutai Mountain Scenic Spot. Master’s Thesis, Shanxi University, Taiyuan, China, 2016. [Google Scholar]
- Kennedya, D.; Steinberger, J.; Gasson, B.; Hansen, Y.; Hillman, T.; Havránek, M.; Pataki, D.; Phdungsilp, A.; Ramaswami, J.; Mendez, G.V. Methodology for inventorying greenhouse gas emissions from global cities. Energy Policy 2010, 38, 4828–4837. [Google Scholar] [CrossRef]
- Wang, Z.M.; Zhang, X.L.; Qiu, X.Y. Estimation of net carbon emissions and construction of low carbon scenic area based on carbon neutralization—A case study of Jiaoshan in Zhenjiang city. J. Nanjing Norm. Univ. Nat. Sci. Ed. 2016, 254. [Google Scholar] [CrossRef]
- Tang, C.C.; Zhong, L.S.; Ng, P. Factors that influence the tourism industry’s carbon emissions: A tourism area life cycle model perspective. Energy Policy 2017, 10, 704–718. [Google Scholar] [CrossRef]
- Wang, L.G. Stakeholders Making Behaviors in Forest-Tourism: The Perspective of Carbon Offset. Ph.D. Thesis, Jiangxi Agriculture University, Nanchang, China, 2012. [Google Scholar]
- Dong, H.J.; Geng, Y. Study on carbon footprint of the household consumption in Beijing based on input-output analysis. Resour. Sci. 2012, 34, 494–501. [Google Scholar]
- Wu, J.G.; Zhang, X.Q.; Xu, Y.D. Impact of land-use change on soil carbon storage. Chin. J. Appl. Ecol. 2004, 4, 593–599. [Google Scholar]
- Shang, C.J.; Chu, C.L.; Zhang, Z.H. Quantitative assessment on carbon emission of different structures in building life cycle. Build. Sci. 2011, 12, 66–70. [Google Scholar] [CrossRef]
- Wang, J. Calculation and analysis of life cycle CO2 emission of Chinese urban residential communities. Master’s Thesis, Tsinghua University, Beijing, China, 2009. [Google Scholar]
- Cui, C. Evaluation and application for pavement energy consumption using the life cycle assessment methodology. Master’s Thesis, Zhenzhou University, Zhenzhou, China, 2004. [Google Scholar]
- Jiang, S. Scientific Concept of Water-Energy Nexus and Coupling Simulation. Master’s Thesis, China Institute of Water Conservancy and Hydropower Science, Beijing, China, 2017. [Google Scholar]
- Li, H.; Jing, Y.Y.; Li, Y.Y. Carbon emission and its reduction strategies during municipal solid waste treatment. China Environ. Sci. 2011, 2, 259–264. [Google Scholar]
- Schelhaas, M.J.; van Esch, P.W.; Groen, T.A.; de Jong, B.H.J.; Kanninen, M.; Liski, J.; Masera, O.; Mohren, G.M.J.; Nabuurs, G.J.; Palosuo, T.; et al. CO2FIX V 3.1 A Modelling Framework for Quantifying Carbon Sequestration in Forest Ecosystems. 2004. Available online: https://www.researchgate.net/publication/40124193 (accessed on 15 January 2021).
- Pandey, K.K.; Bhosale, T.A.; Awasthi, A.K.; Gupta, G.; Maurya, D. Oak (Quercus Floribunda): A Prominent indigenous multipurpose tree for carbon storage and sequestration potential. Curr. World Environ. 2015, 10, 823–829. [Google Scholar] [CrossRef]
- Wu, K.; Yin, M.F.; Zhou, Y.B.; Guo, Y.T.; Liu, Y.Y.; Yin, W.D.; Shang, S.D.; Wu, C.L. Current annual growth rate of forest volume in Baishilazi national nature reserve. J. Northwest. For. 2010, 6, 203–206. [Google Scholar]
- Zhen, W.; Huang, M.; Zhai, Y.L.; Chen, K.; Gong, Y.Z. Variation of forest vegetation carbon storage and carbon sequestration rate in Liaoning Province. Chin. J. Appl. Ecol. 2014, 5, 1259–1265. [Google Scholar]
- Yin, M.F.; Zhao, L.; Chen, X.F.; Gao, S.; Hou, C.S. Carbon storage maturity age of Larix olgensis and Japanese larch. Chin. J. Appl. Ecol. 2008, 12, 2567–2571. [Google Scholar]
- Yin, M.F.; Yang, L.; Yin, W.D.; Lei, Q.G.; Tan, X.B.; Zhang, H.Y.; Li, Z.W. Dynamic changes of carbon storage in trunk volume of Pinus tabulaeformis, Robinia pseudoacacia and Populus euramericana. J. Beijing For. Univ. 2011, 5, 65–68. [Google Scholar]
- Xu, B.; Guo, Z.D.; Piao, S.L.; Fang, J.Y. Biomass carbon stocks in China’s forests between 2000 and 2050: A prediction based on forest biomass-age relationships. Sci. China Life Sci. 2010, 53, 776–783. [Google Scholar] [CrossRef] [PubMed]
- Jong, B.H.D.; Masera, O.; Olguín, M.; Martínez, R. Green house gas mitigation potential of combining forest management and bioenergy substitution: A case study from Central Highlands of Michoacan, Mexico. For. Ecol. Manag. 2001, 242, 398–411. [Google Scholar] [CrossRef]
- Dong, L.H. Developing individual and stand-level biomass equations in northeast China forest area. Ph.D. Thesis, Northeast Agricultural University Harbin, Heilongjiang, China, 2015. [Google Scholar]
- Lv, J.W.; Le, Q.; Wang, Z.; Zhang, G.J. Carbon sequestration potential in Fujian’s forest ecosystems. Acta Ecol. Sin. 2010, 8, 2188–2196. [Google Scholar]
- Bekele, L.; Dan, B.K.; Mats, O. Factors controlling soil organic carbon sequestration under exotic tree plantations: A case study using the CO2Fix model in southwestern Ethiopia. For. Ecol. Manag. 2007, 6, 124–131. [Google Scholar] [CrossRef]
- Zhang, X.P.; Wang, X.P.; Zhu, B.; Zong, Z.J.; Peng, C.H.; Fang, J.Y. Litter fall production in relation to environmental factors in Northeast China’s forests. Chin. J. Plant. Ecol. 2008, 5, 1031–1040. [Google Scholar] [CrossRef]
- Sun, H.Z.; Qu, H.J.; Hao, Y.; Shi, Y.L.; Ren, Q.S. Several patterns for improvement of secondary forests. J. Northeast. For. Univ. 2004, 3, 103–104. [Google Scholar] [CrossRef]
- Chen, B.J.; Li, D.Z.; Li, Q.M. Comprehensive benefit analysis on energy-saving renovation of existing residential buildings in hot summer and cold winter zone. Build. Sci. 2017, 8, 42–48. [Google Scholar] [CrossRef]


Publisher’s Note: MDPI stays neutral with regard to jurisdictional claims in published maps and institutional affiliations. |
© 2021 by the authors. Licensee MDPI, Basel, Switzerland. This article is an open access article distributed under the terms and conditions of the Creative Commons Attribution (CC BY) license (http://creativecommons.org/licenses/by/4.0/).