Article

Analysis of Spatio-Temporal Variation Characteristics of Main Air Pollutants in Shijiazhuang City

College of New Energy and Environment, Jilin University, Changchun 130012, China
*
Author to whom correspondence should be addressed.
Sustainability 2021, 13(2), 941; https://doi.org/10.3390/su13020941
Submission received: 3 December 2020 / Revised: 7 January 2021 / Accepted: 12 January 2021 / Published: 18 January 2021

Abstract

:
Air pollution has become one of the important concerns of environmental pollution in the Beijing–Tianjin–Hebei region. As an important city in Beijing–Tianjin–Hebei, Shijiazhuang has long been ranked in the bottom ten in terms of air quality in the country. In order to effectively grasp the influencing factors and current distribution of air pollution in Shijiazhuang City, this paper collects data on the top air pollutants in Shijiazhuang from 2017 to 2019, analyzes the characteristics of time changes in the region, and uses the Kriging interpolation method to affect the air pollutants in this area. The spatial distribution characteristics are studied. The results show (1) From 2017 to 2019, the environmental quality of Shijiazhuang City showed a decreasing trend except for O3. (2) Seasonal changes show that NO2, PM2.5, and CO show as winter > autumn > spring > summer, PM10, SO2 show as winter > spring > autumn > summer, and O3 concentration changes as summer > spring > autumn > winter. (3) The daily change trends of NO2, SO2, PM10 and PM2.5 are similar, while the change trends of O3 and NO2 are opposite. (4) The correlations between air quality index (AQI) and concentrations suggest that PM10, PM2.5, and CO contribute the most to undesirable pollution levels in this area, while NO2, SO2, and O3 contribute less to undesirable pollution. We have concluded that the particulate pollution in Shijiazhuang City has been effectively controlled, thanks to the relevant measures introduced by the government, but the O3-based compound pollution is gradually increasing, so particulate pollution and O3 pollution need to be treated together. The research results of this article have important practical significance for urban or regional air environment monitoring and prevention.

1. Introduction

With the rapid development of China’s social economy, the continuous acceleration of urbanization and the increase of energy consumption, the threat of urban air pollution to the public living environment and physical and mental health has become increasingly prominent [1,2,3,4,5], and it has become more and more concerned and researched hot issues. Studying the temporal and spatial characteristics of urban air pollution helps to understand the overall situation of urban air pollution, grasp the source area of urban air pollution, and provide scientific reference and basis for formulating practical and reasonable air pollution control policies and measures, and for the sustainable development of cities, it has far-reaching significance and influence.
Studies have pointed out that China’s population-weighted average fine particulate matter (PM2.5) concentration is the highest among the 10 most populous countries in the world, and it increased significantly from 1990 to 2010 [6]. The “Environ-mental Performance Index: 2016 Report” released by Yale University also shows that China’s air quality is the second lowest in the world, even behind India and only slightly better than Bangladesh [7]. Epidemiological studies have shown that particulate matter (PM10 and PM2.5) and some gaseous pollutants (CO, SO2, NO2, and O3) can cause respiratory infections and lung cancer, and even shorten life span [8,9,10]. Therefore, China’s air pollution problem has attracted more and more attention from the government and researchers.
Relevant scholars have conducted research on the air quality index (AQI) and the temporal and spatial trends of single or multiple pollutants in the atmosphere and their influencing factors for different spatial scales and time dimensions. Li Xiaoyu et al. [11] studied the temporal and spatial distribution characteristics and influencing factors of air pollutants in Yinchuan in 2015, and concluded that inhalable particulate matter (PM10), PM2.5, and SO2 were generally high in winter and low in summer. Xiao et al. [12] pointed out that the atmospheric pollutants NO2 and SO2 in North China showed obvious distribution characteristics of high in winter and low in summer. A large number of studies have shown that there are obvious seasonal differences in the time distribution of air pollutants [13,14,15], and the phenomenon of heavy pollution in winter is generally present. Pollutants also have a certain change pattern every day. For example, Nishanth shows that the nighttime concentration of NOX is generally higher than the daytime concentration. On the contrary, the daytime concentration of O3 is relatively high [16,17,18]. Due to differences in topography, landforms, human activities, etc., AQI and primary pollutants are spatially strongly regional. For example, Zhang Jianzhong et al. [19] pointed out that the AQI in Beijing area gradually decreased from southeast to northwest.
In recent years, the air pollution in the Beijing–Tianjin–Hebei region has attracted much attention, but Shijiazhuang, as the capital city of Hebei Province, has little research on the spatial-temporal characteristics, influencing factors of AQI and various pollutants. Therefore, this article takes Shijiazhuang as an example to discuss the spatial distribution characteristics of the six pollutants and AQI from 2017 to 2019, the temporal change rule, and the correlation between AQI and the six pollutants, with a view to providing data support for air pollution control and ecological environmental protection in the area.

2. Materials and Methods

2.1. Research Area and Data Sources

Shijiazhuang is located in the south-central part of Hebei Province, with a central point of 38°04′ N and 114°28′ E. Shijiazhuang has a total area of 20,235 square kilometers, of which the urban area is 2206 square kilometers. Shijiazhuang is located on the eastern edge of the Eurasian continent in low and middle latitudes, close to the Bohai Sea, which belongs to the Pacific Ocean, and has a temperate monsoon climate. The seasonal changes in solar radiation are significant, and the total precipitation in the four seasons is 401.1–752.0 mm.
This study uses the AQI and mass concentrations of six pollutants from 1 January 2017 to 31 December 2019, from 7 air quality monitoring stations in Shijiazhuang (Figure 1). Among them, O3 data uses the eight-hour moving average of ozone (O3-8 h), while carbon monoxide (CO), sulfur dioxide (SO2), nitrogen dioxide (NO2), PM10, and PM2.5 all use hourly monitoring data (the effective number of days in 2018 is 360 days, in 2019 it is 364 days). This article preprocessed all data according to the “Ambient Air Quality Monitoring Specification” to eliminate spatial and temporal abnormal values to ensure data quality. The number of valid data meet the relevant regulations in the “Ambient Air Quality Standard” (GB 3095-2012). The seasons in Shijiazhuang are divided into spring (March to May), summer (June to August), autumn (September to November), and winter (December to February of the following year).
There are a total of seven atmospheric monitoring stations in Shijiazhuang City, which are staff hospital, high-tech zone, northwest water source, southwest higher education, Century Park, People’s Hall, and Mountain Fenglong. The corresponding environmental functional areas of the site are shown in the Table 1.

2.2. AQI

The Average Air Quality Index (AQI) is a dimensionless index. The standard (GB3095-2012) is calculated based on China’s ambient air quality and includes six pollutants, namely SO2, NO2, PM10, PM2.5, O3, and CO (Table 2). The larger the index, the more serious the air pollution, and the greater the harm to human health. The sub-index of each pollutant is first marked as IAQIP based on the fractional concentration.
IAQI P   =   IAQI Hi IAQI L 0 BP Hi BP L 0 ( C P BP L 0 ) + IAQI L 0
In Equation (1), IAQIp is the air quality sub-index of pollutant P, CP is the mass concentration of pollutant P, BPHi is the upper limit pollutant concentration value close to CP in Table 1, BPLo is the lower limit of pollutant concentration close to CP in Table 2, IAQIHi is the air quality sub-index corresponding to BPHi in Table 1, IAQILo corresponds to BPLo in Table 1. When the AQI is higher than 50, the highest pollutant air quality index is the main pollutant. If there are two or more pollutants with the highest air quality sub-index, they are listed as major pollutants. In addition, pollutants with an IAQI higher than 100 are excessive pollutants. A higher AQI indicates that severe and concentrated air pollution will not only affect human outdoor activities, but also affect their health.Air quality index(AQI) classification standards is shown in Table 3.

2.3. Analysis of Temporal and Spatial Distribution Characteristics

When processing the AQI, O3, CO, PM10, PM2.5, SO2, and NO2 data obtained from each air quality monitoring station, the arithmetic mean of the concentration of each monitoring point from 0 to 23 is selected as the daily average value, then use the calculation of the daily average value of each monitoring point to get the monthly arithmetic average, and so on to calculate the annual average. In the spatial analysis, the annual average value is used. The Kriging interpolation method is used to make a pollution distribution interpolation map using Surfer 15 software, and the six pollutant concentrations and AQI spatial distribution characteristics in Shijiazhuang City are analyzed. Use SPSS (Statistical Product and Service Solutions) to analyze the correlation between AQI and 6 pollutants using hourly averages of seven sites from 2017 to 2019.

3. Results and Discussion

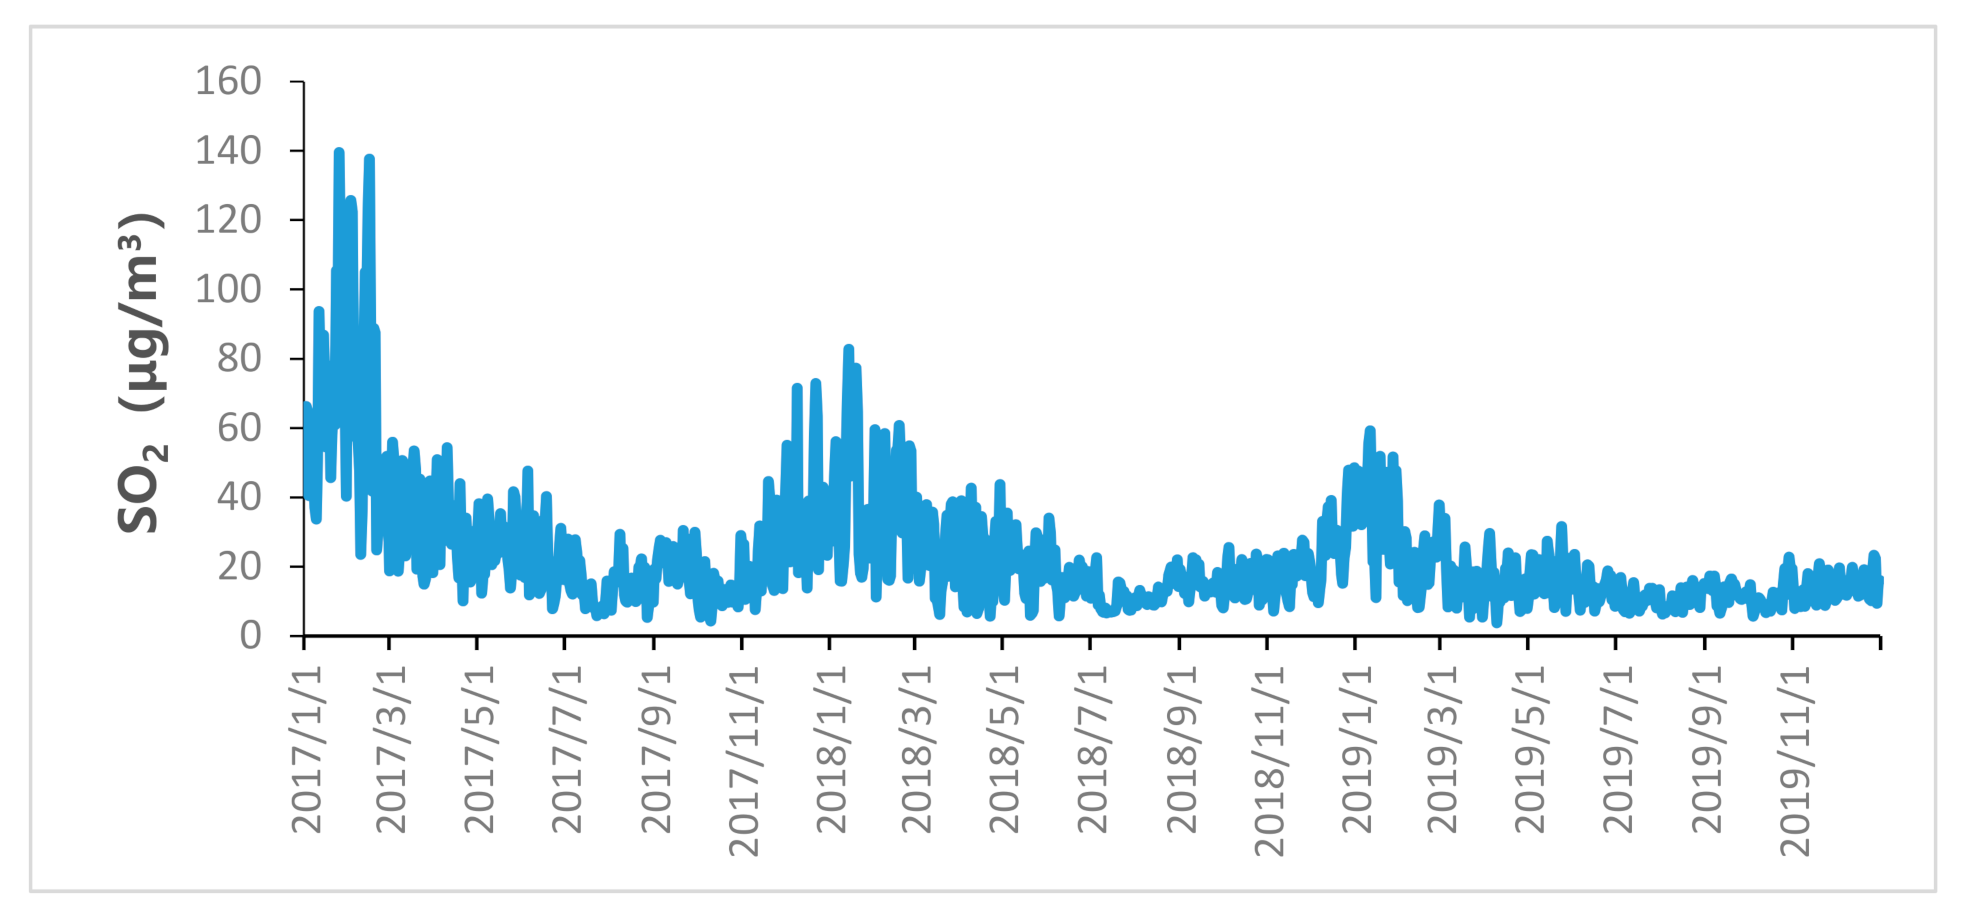
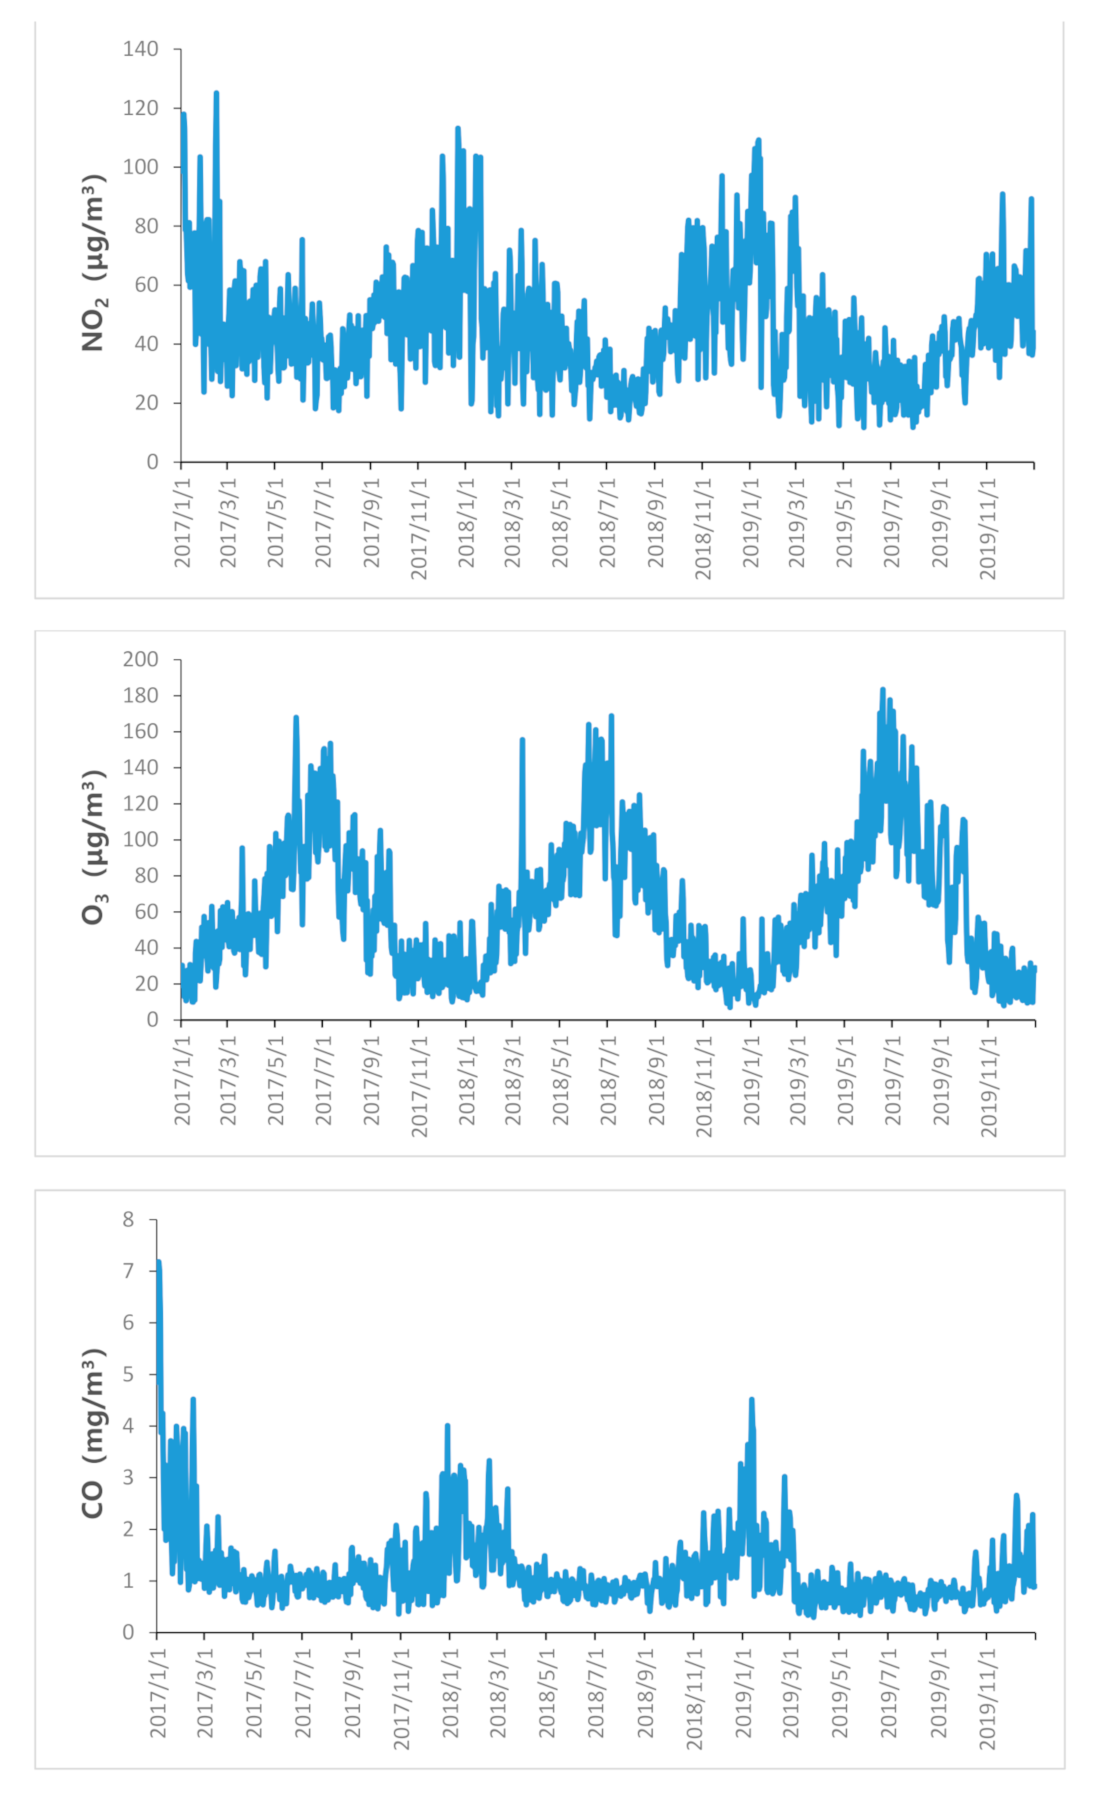
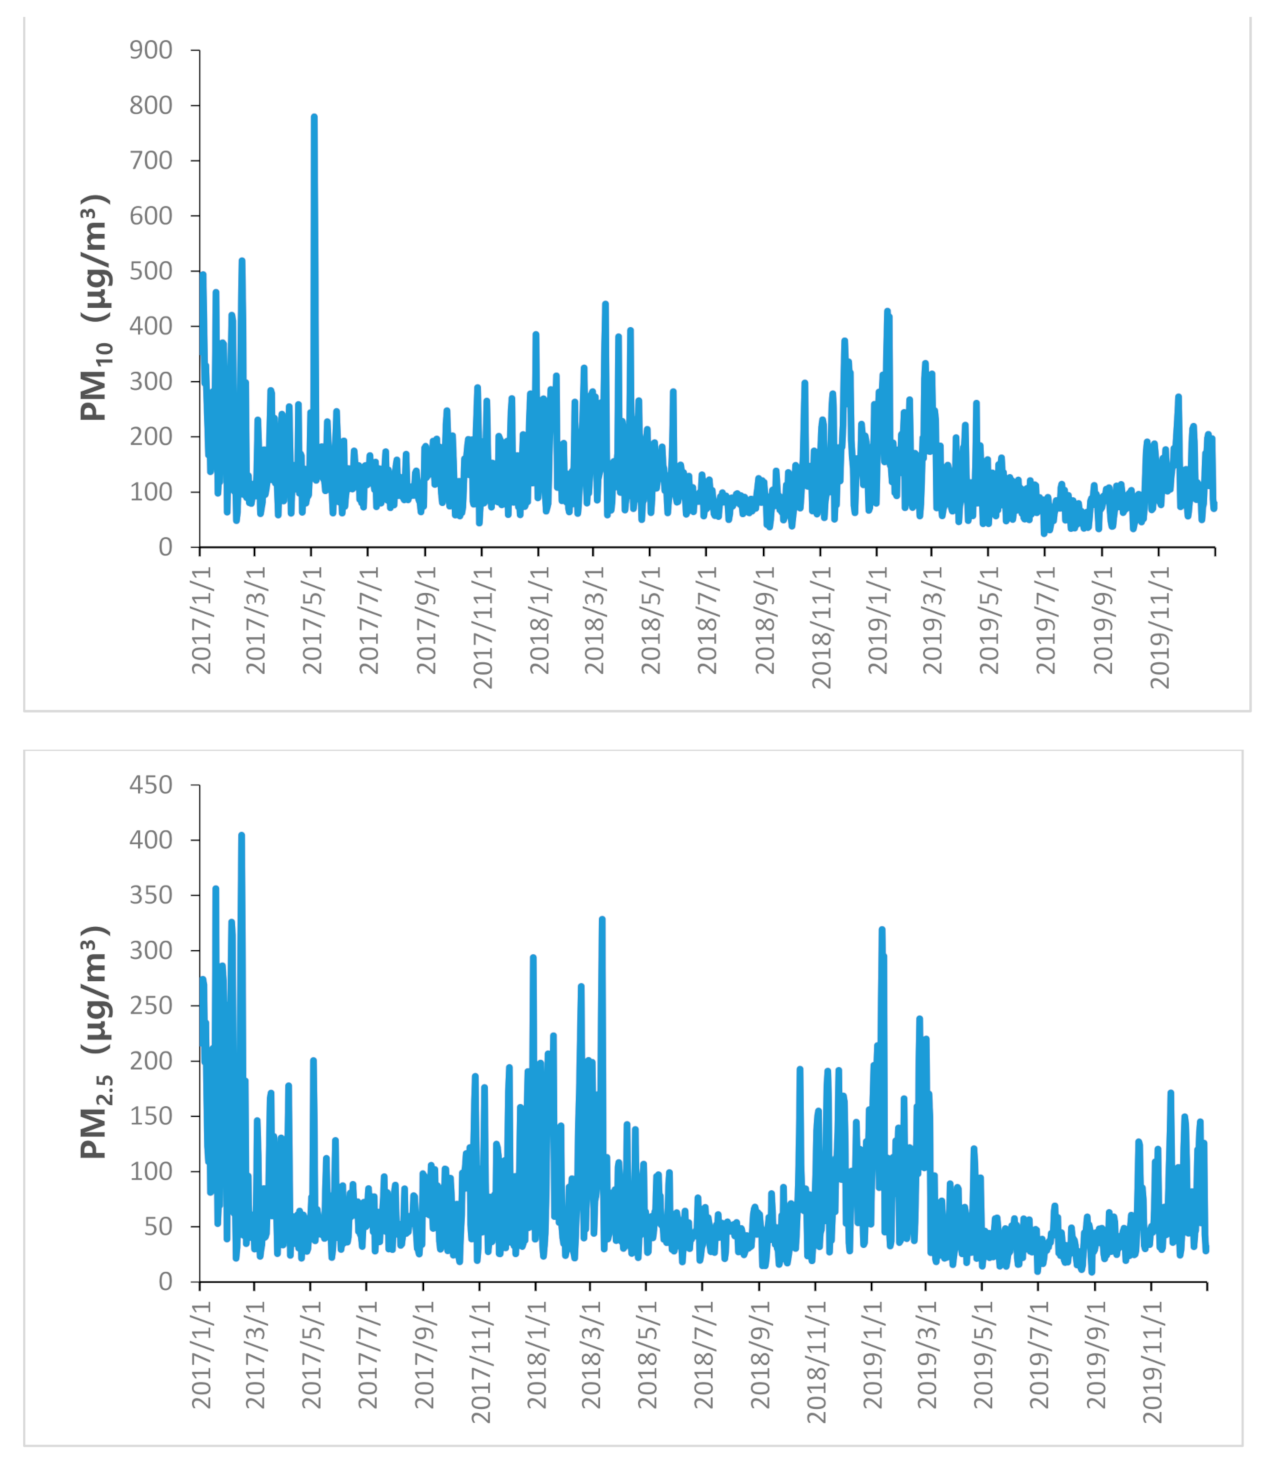
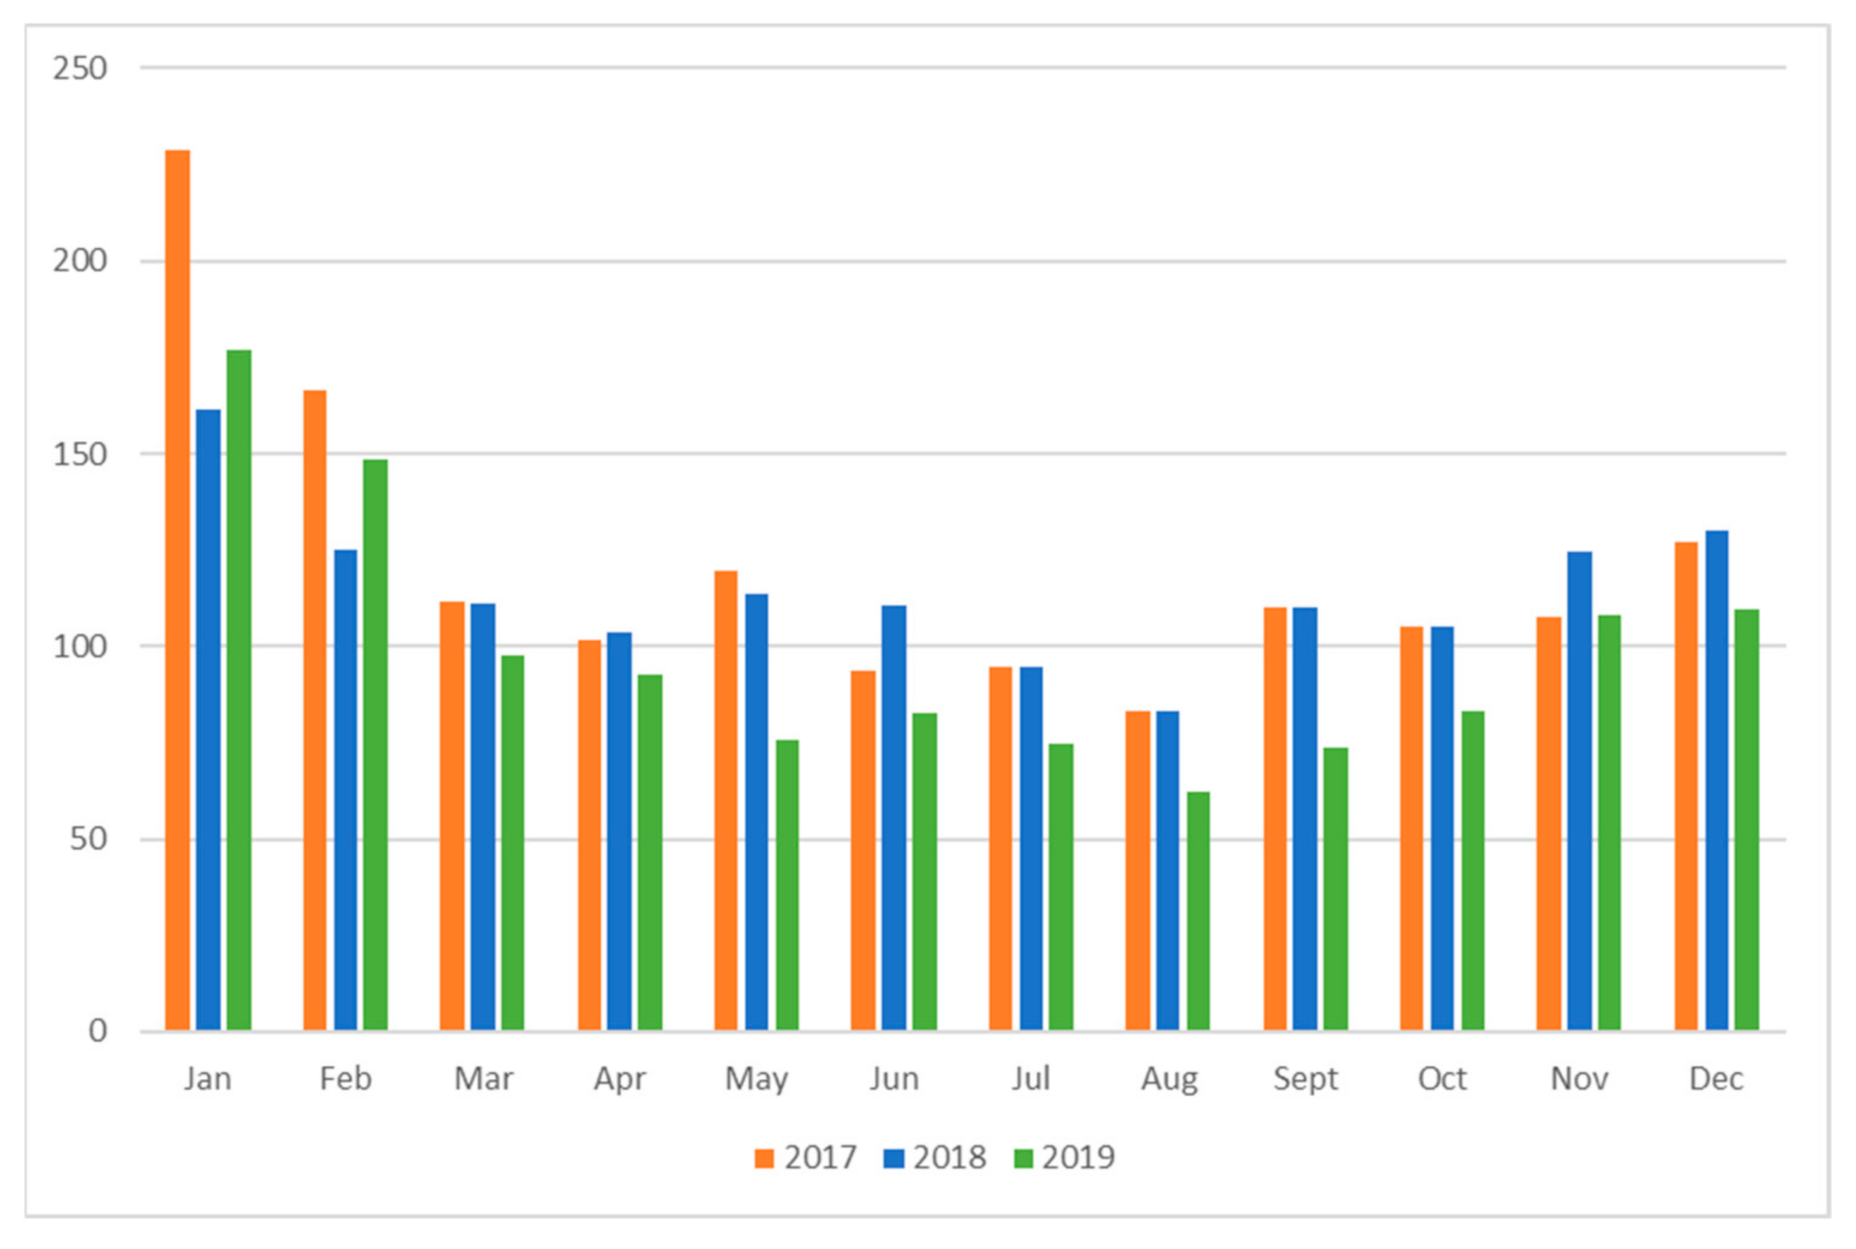
3.1. Annual Variation

Figure 2 shows the annual changes of six pollutants and AQI in Shijiazhuang City from 2017 to 2019. From 2017 to 2019, the SO2 concentration in Shijiazhuang changed to 31.00 μg/m3, 21.45 μg/m3, and 16.13 μg/m3; NO2 concentration changed to 50.22 μg/m3, 44.12 μg/m3, and 42.51 μg/m3; O3 changed to 58.12 μg/m3, 62.98 μg/m3, and 65.58 μg/m3; CO change is 1.33 mg/m3, 1.21 mg/m3, and 1.01 mg/m3; PM2.5 change is 81.85 μg/m3, 70.64 μg/m3, and 60.67 μg/m3; PM10 The changes are 153.00 μg/m3, 132.77 μg/m3, and 114.89 μg/m3. O3 shows an increasing trend year by year, and the remaining pollutants show a decreasing trend. Among them, SO2 decreased most significantly. Annual average concentrations of SO2 decrease by 47.9% from 2017 to 2019. NO2 decreased by 15.4% from 2017 to 2019, and O3 increased by 12.8% from 2017 to 2019. In 2019, the annual average concentration of PM2.5 meets the concentration requirements (67 μg/m3) in the “Shijiazhuang City’s 2019 Comprehensive Air Pollution Control Work Plan”, but it is still 1.7 times of the secondary standard 35 μg/m3 in the “Ambient Air Quality Standard” GB3095-2012.
The AQI index has been declining year by year, and it has decreased by 18.3% from 2017 to 2019. Figure 3 shows the changes in air quality days from 2017 to 2019. It can be seen that from 2017 to 2019, the number of days with good air quality has increased year by year, with 183, 212, and 251 days, accounting for 50.1%, 58.8%, and 68.9%, respectively. The gradual optimization of air quality in Shijiazhuang is related to the measures taken by Shijiazhuang to reduce production capacity and relocate from the city, remediate scattered coal and clean replacement, prevent and control motor vehicle pollution, comprehensive control of dust pollution from non-point sources, in-depth control of industrial pollution, and response to severely polluted weather. From the perspective of the station situation, site MF is in a scenic area. The number of excellent and good days is more than 260 days from 2017 to 2019. The number of excellent and good days in site NW has improved the most. The number of good days in 2017–2019 increased by 56.3%. This has strengthened the renovation of coal-fired boilers and the treatment of open-air barbecues in this area, reducing the emission of pollutants. Due to the continuous advancement of atmospheric control measures in Shijiazhuang City, the number of excellent and good days at each site in 2019 is not much different.

3.2. Seasonal Variations

Figure 4 shows the seasonal changes in the concentration of six pollutants in Shijiazhuang City from 2017 to 2019. Among them, NO2, PM2.5, and CO showed the order of winter > autumn > spring > summer. The average concentration of NO2 is 29.44 μg/m3 in summer, 55.27 μg/m3 in winter, and the concentration of PM2.5 is 95.82 μg/m3 in winter and 44.96 μg/m3 in summer. The concentration of the two pollutants is not much different in spring and autumn, and the concentration difference of CO in four seasons is not obvious. The higher concentrations of NO2 and PM2.5 in winter are presumed to be due to the increase of coal burning caused by heating in winter, the low temperature and mixed layer height and the weak vertical diffusion ability of the atmosphere [20,21,22].
The performance of PM10 and SO2 is winter > spring > autumn > summer (Figure 5). PM10 is 160.73 μg/m3 in winter, 90.00 μg/m3 in summer, SO2 is 30.72 μg/m + in winter, and 13.17 μg/m3 in summer. In summer, there is more precipitation and strong vertical diffusion ability. However, the wind speed in winter and spring is relatively high, which is easy to form sand and dust weather, and the amount of coal burning increases, resulting in a significantly higher PM10 concentration in winter and spring than in spring and autumn [23,24]. The highest temperature in summer is conducive to the conversion of SO2. In winter, the increase in SO2 caused by coal burning and the lower temperature mean that the concentration of SO2 in the atmosphere differs significantly between winter and summer.
The change of O3 concentration is summer > spring > autumn > winter (Figure 5), which is obviously different from other pollutants. The average concentration is 104.22 μg/m3 in summer and 36.98 μg/m3 in winter. The formation of O3 is sensitive to temperature. In summer, the high temperature and sunlight are the strongest. The photochemical reaction of nitrogen oxides and volatile organic compounds in the air is very active. O3 has the highest concentration value during the summer. Due to the weakening of solar radiation in winter, the photochemical reaction ability to produce O3 is reduced, and air pollution such as smog and haze is prone to occur during the heating season in winter, resulting in low air visibility and reduced ultraviolet radiation. Therefore, the O3 concentration is significantly lower than that in summer. The higher O3 concentration in spring may be caused by the high concentration of O3 in the upper troposphere transporting through sedimentation and advection [25].
During the study period, the average AQI in summer was 86.61 and that in winter was 152.67. The annual average AQI in 2017 was 120.85, and in 2019 was 98.82 (Figure 6). The decrease trend is obvious, but considering the large range of AQI values, there are still high AQI values every year.

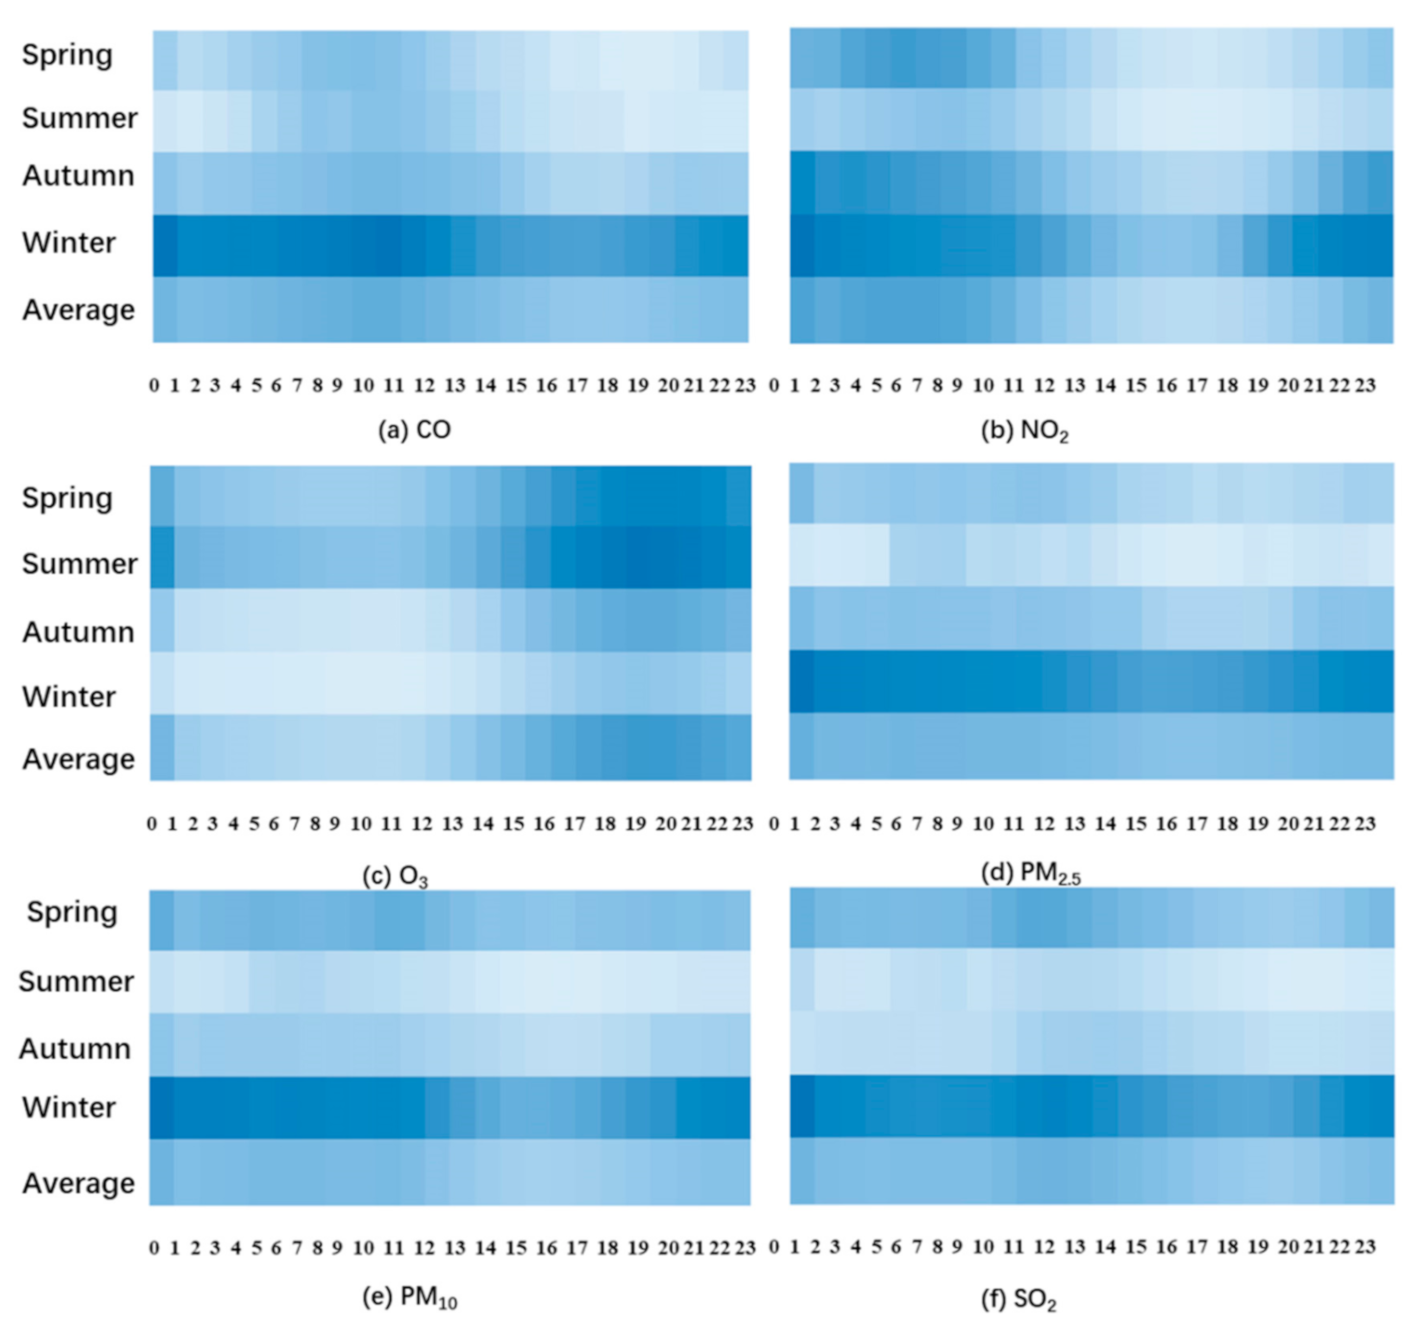
3.3. Diurnal Variations of Pollutant Concentrations

Figure 7 shows the daily changes of six pollutants from 2017 to 2019. It can be seen from the figure that the daily variation of the concentration of the six pollutants fluctuates significantly, and the trend of NO2, SO2, PM10, and PM2.5 has a high degree of similarity. The peak of pollutants mostly occurs during the period at 9:00–10:00 in the morning, and the concentration value gradually decreases to the lowest in the day in the afternoon, and then gradually rises after 18:00, showing periodic changes. This change is related to geographical location, meteorological conditions, pollutant emissions, and human life. The atmospheric inversion radiation in Shijiazhuang City usually starts at night and disappears around early morning. In the afternoon, the temperature is higher, atmospheric convection increases, and pollutants near the ground diffuse rapidly [26], which is the main factor in the daily variation of pollutants. Secondly, in the early morning, people and motor vehicles travel intensively, and the heavy traffic flow leads to heavy exhaust emissions and heavy road dust pollution. In the afternoon, the increase in temperature makes the catalysis of NO2 and other O3 precursors intensified, resulting in the characteristics of NO2, SO2, PM10, and PM2.5 “early peak and midday valley”.
The daily variation of O3 mass concentration is a single peak, and the production of O3 is mainly affected by precursors such as NO, NO2, and VOCs. This article does not monitor the concentration of VOCs in the atmosphere, and only discusses the relationship between NO2 concentration and O3 concentration. The photochemical reaction of NO2 promotes the formation of O3, and the photochemical reaction of NO decomposes O3 into O2. The photochemical reaction mechanism of NOx is shown in Formulas (2)–(4):
NO2 + hν (λ < 420 nm) NO + O
O·+ O2 + M O3 + M
NO + O3 NO2 + O2
A large number of precursors appeared during the morning peak period from 8:00 to 9:00, and the increase in light promoted the photochemical reaction, so the O3 concentration began to rise, and the O3 concentration from 12:00 to 19:00 was significantly higher than that in the other periods. Due to the photochemical reaction caused by solar radiation, the concentration of O3 increases, resulting in an afternoon peak [27]. O3 concentration is low at night, mainly due to the lack of solar radiation at night, the rate of O3 formation in the atmosphere through photochemical reaction is very small; on the other hand, because the mixed layer near the ground continuously consumes O3, its concentration continues to decrease. Therefore, the diurnal variation trend of NO2 concentration is exactly the opposite of that of O3, showing a variation characteristic that the concentration during the day is lower than that at night [28,29].

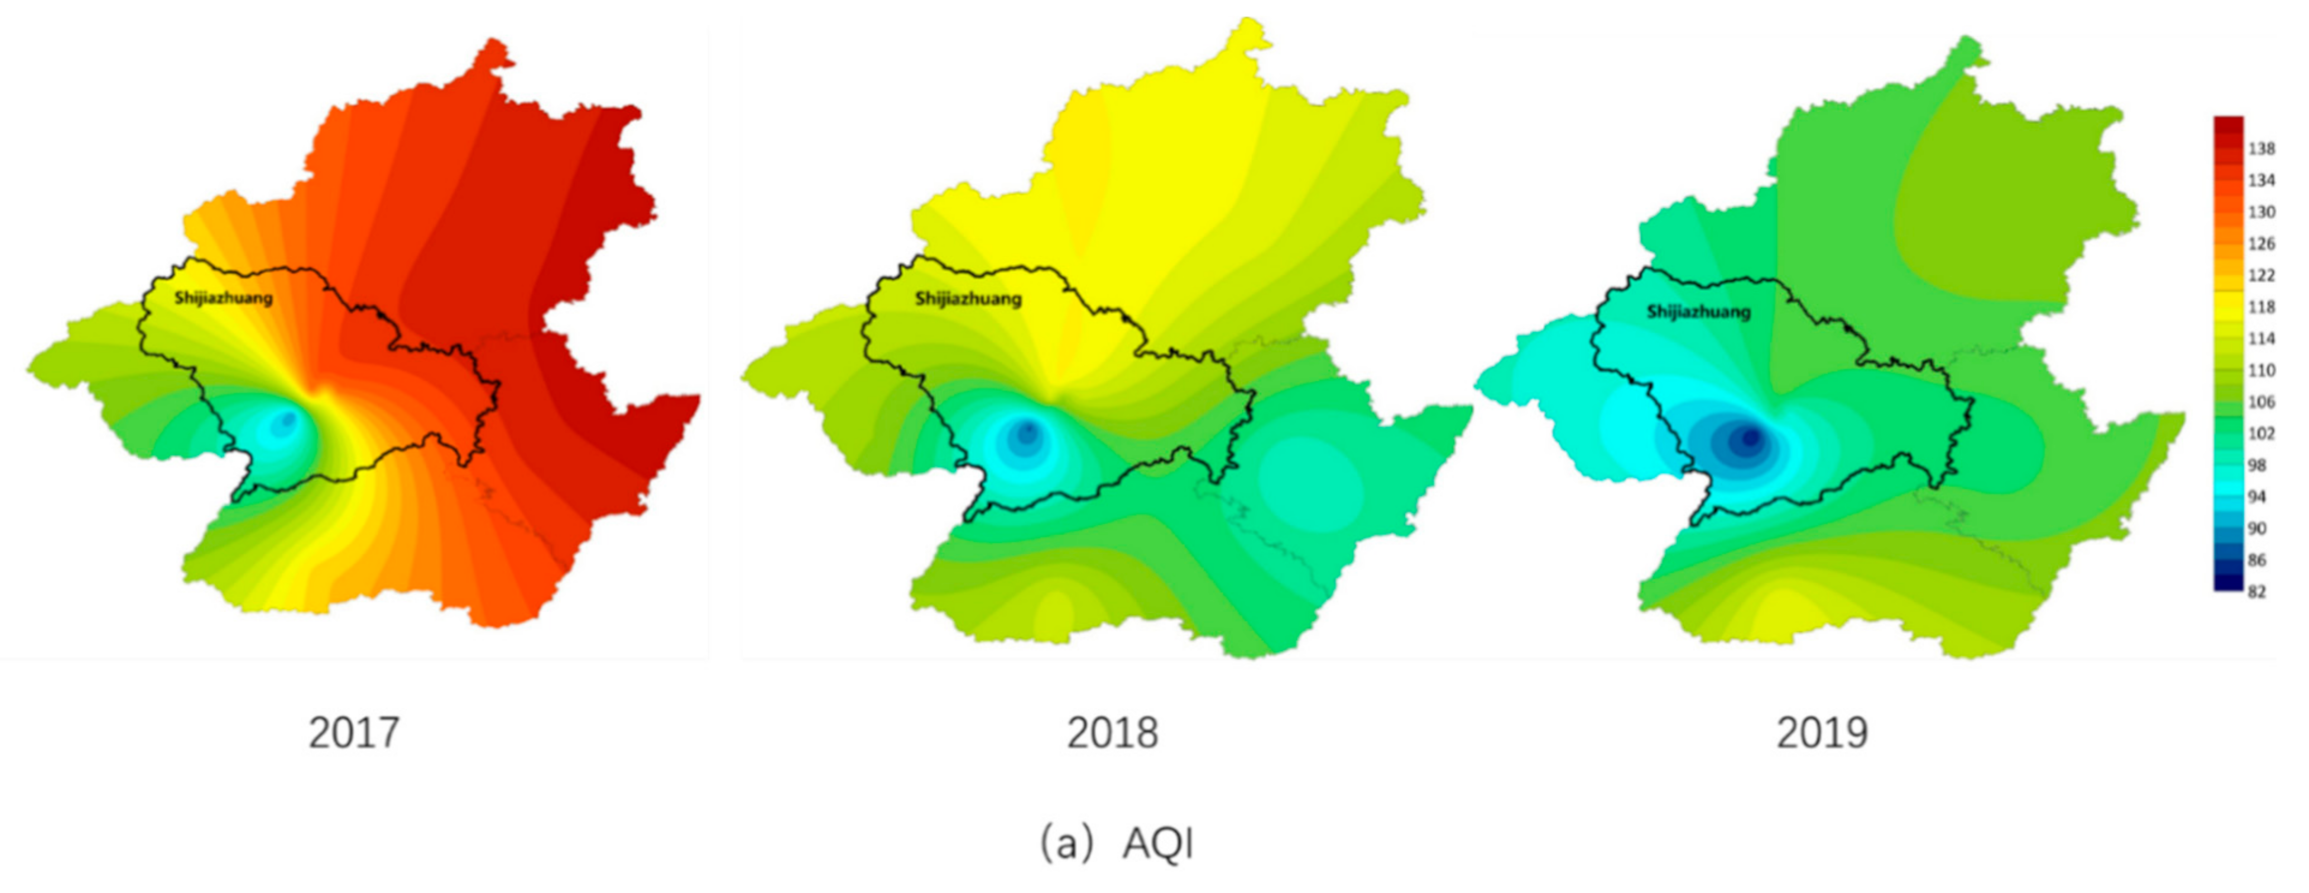
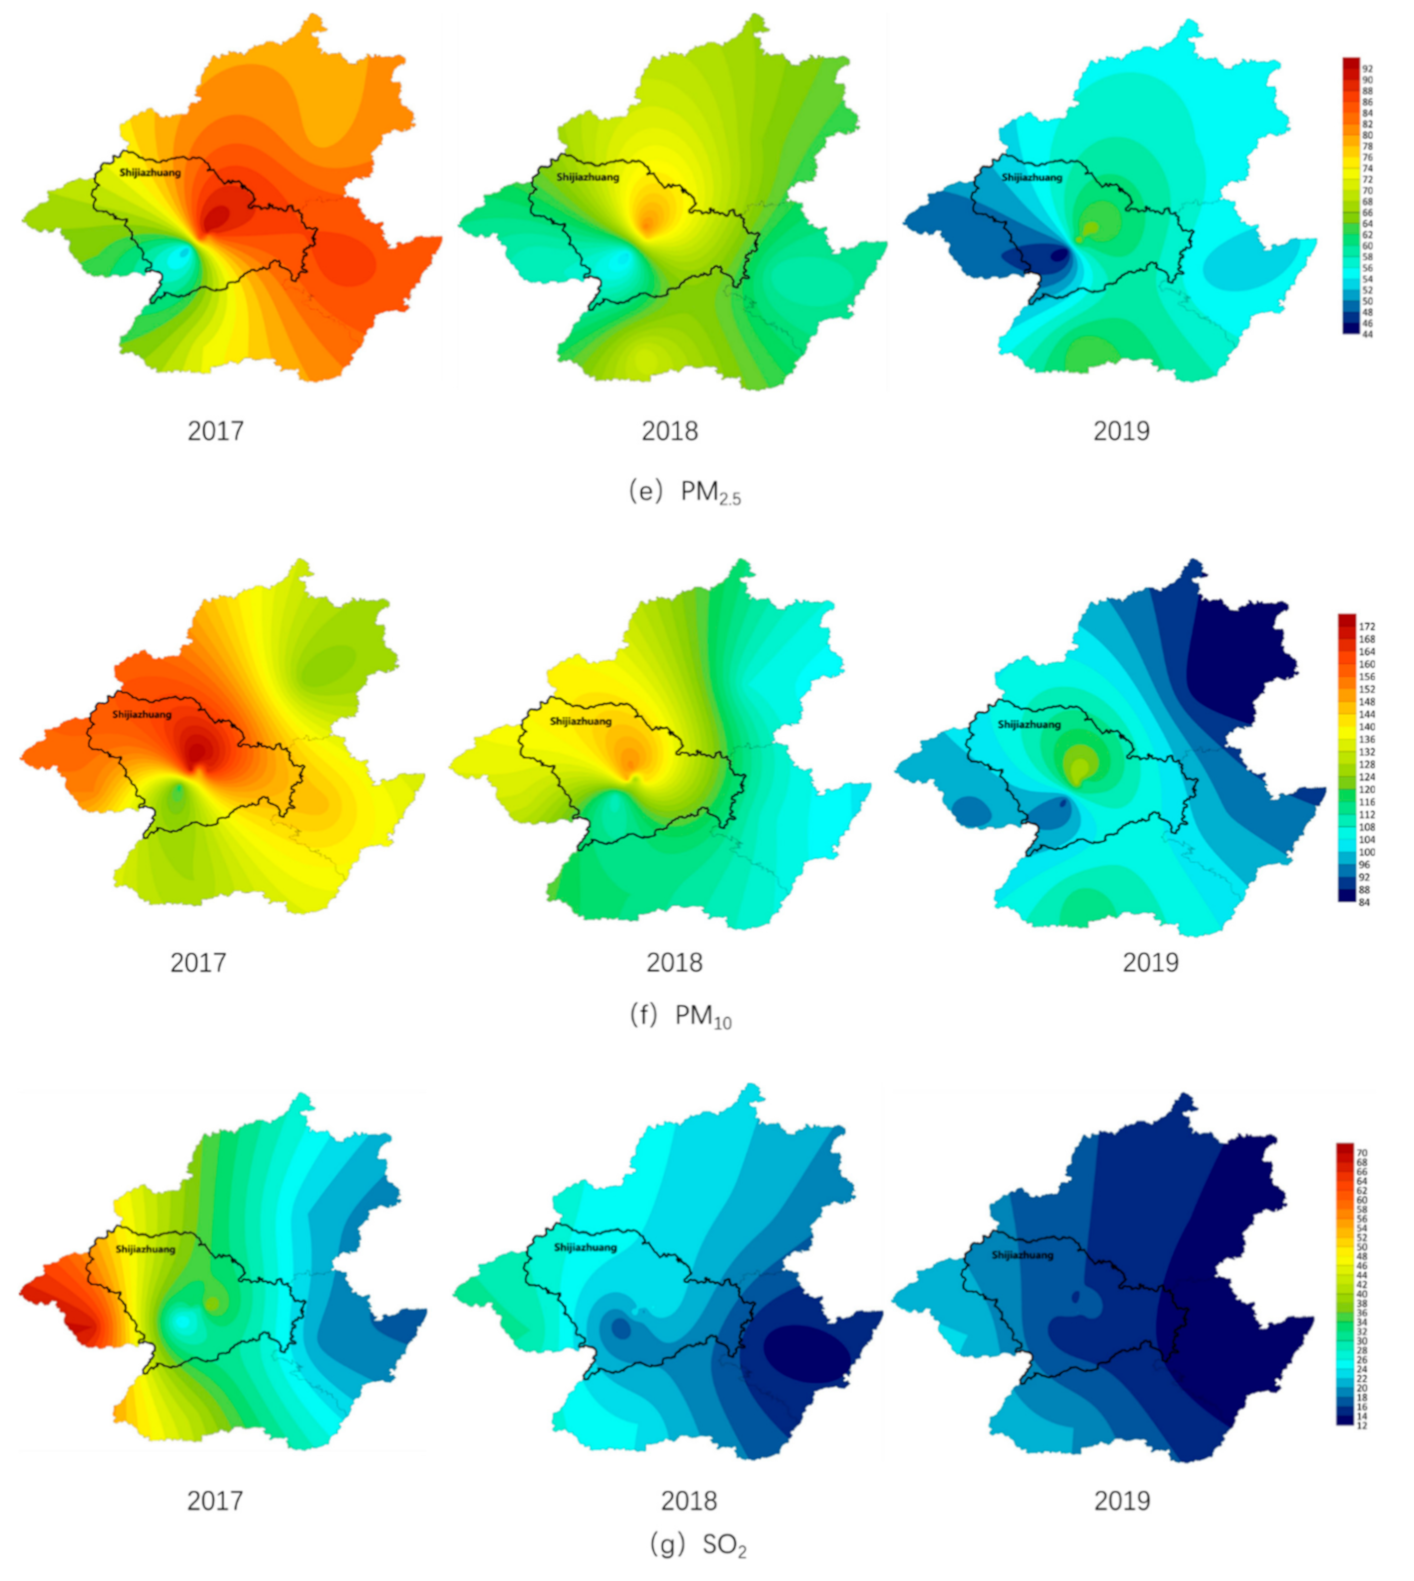
3.4. Difference in Spatial Distributions of Pollutant Concentrations and AQI

Figure 8 analyzes the spatial changes of six pollutants and AQI in Shijiazhuang City from 2017 to 2019. The distribution of AQI, NO2, PM2.5, and PM10 are similar, showing a low distribution in the south and a high distribution in the north. The main analysis is that the northeast of Shijiazhuang is an industrial zone with relatively many pollution sources, and large vehicles appear frequently, causing more particulate matter and NO2 emissions. CO and O3 generally show a trend of increasing from the center to the surroundings. The reason for the analysis is that central heating is adopted in the downtown area, and the fireworks control is very strict, while the surrounding villages mostly use scattered coal for heating, and there is a phenomenon of fireworks, which leads to higher CO concentrations in the surrounding areas. O3 is affected by the precursors NO2 and VOCs. The traffic control measures in the downtown area are very strict compared with the surrounding areas, and most of the industries involving VOCs emissions are built in the surrounding areas of the city, so the O3 concentration in the city center is lower than the surrounding areas.
From 2017 to 2019, all pollutants except O3 showed a decreasing trend. Since 2013, the Chinese government has formulated the Action Plan of Air Pollution Prevention and Control, which plans to reduce the concentration of PM2.5 and other pollutants in China’s provincial capitals and other major cities in 2017. Shijiazhuang City has actively taken measures to strengthen the management of motor vehicle pollution, coal burning, and pollutant discharge enterprises. Studies have shown that PM2.5, SO2, and NOx decreased by 33%, 59%, and 21% [30]. After successfully implementing the Action Plan of Air Pollution Prevention and Control, the Chinese government recently implemented the three-year (2018–2020) Action Plan for winning the Blue Sky Defence Battle to continue to improve China’s environment. It can be seen that Shijiazhuang actively responds to the national environmental improvement plan to play an important role in the decrease of pollutants from 2017 to 2019.The concentration of O3 increases year by year, the reason is that the air pollution control measures in Shijiazhuang City have reduced the concentration of air particles or aerosols. Therefore more solar radiation reaches the lower atmosphere which leads to a more violent photochemical reaction, producing more ozone [31,32,33]. In addition, O3 concentration is not only related to NO2, but also related to VOCs. The increasing trend of O3 may be caused by the increase of VOCs emissions in the atmosphere of Shijiazhuang City. There are two main sources of VOCS, one is anthropogenic emissions [34], and the other is plant emissions. Due to the large number of industries involved in VOCs emissions around cities, the living emissions of urban residents have increased, followed by the increase in urban green areas, and the increase in VOCs emitted by plants and agricultural planting in the suburbs. At the same time, O3 pollution in China presents the characteristics of continuous and regional pollution, mainly in central and southern Liaoning, Beijing–Tianjin–Hebei and surrounding areas, the Yangtze River Delta, Wuhan urban agglomerations, the area of Shaanxi, and the Chengdu–Chongqing, and Pearl River Delta regions. Shijiazhuang is located in Beijing–Tianjin–Hebei region, and may be affected by regional transmission, which needs to be further discussed in subsequent studies.
It is worth noting that changes in the concentration of O3 are also related to climate and meteorology. Changes of local meteorological conditions [35], El Niño Southern Oscillates [36], and the Asian monsoon [37] will also change the aerosol and organic matter in the atmosphere, including biological VOCs, which can form secondary organic aerosols and change the concentration of O3 [38].

3.5. Correlation Analysis

This article uses the daily average value of the six pollutants and AQI in Shijiazhuang City from 2017 to 2019 for correlation analysis. It can be seen from Figure 9 that AQI is positively correlated with PM2.5 (r = 0.962), PM10 (r = 0.95), SO2 (r = 0.544), NO2 (r = 0.599), and CO (r = 0.827). The correlations between AQI and concentrations suggest that PM10, PM2.5, and CO contribute the most to undesirable pollution levels in this area, while NO2, SO2, and O3 contribute less to undesirable pollution. AQI value is mainly affected by PM2.5 and PM10, and also confirms the similarity of the above distribution of AQI, PM2.5, and PM10. O3 has a negative correlation with other pollutants, among which the negative correlation with NO2 is relatively high (r = −0.541), which confirms the above conclusion that the daily concentration changes of NO2 and O3 are opposite and that more solar radiation reaches the lower atmosphere and leads to more intense photochemical reactions to generate more O3 when the concentration of particulate matter in the air is low.
At the same time, we count the number of days with PM2.5 or PM10 as the main pollutant and the number of days with O3 as the main pollutant in Shijiazhuang City from 2017 to 2019 (Table 4). From 2017 to 2019, the number of days with PM2.5 or PM10 as the primary pollutant in Shijiazhuang City gradually decreased, and the number of days with O3 as the primary pollutant gradually increased. It shows that Shijiazhuang City has played a certain effect on the prevention and control of particulate matter, and the environmental quality has been improved to a certain extent, but it is accompanied by an increase in O3 pollution. This indicates that the next step in Shijiazhuang’s atmospheric control work should be O3, and corresponding measures should be taken to control the concentration of O3.

3.6. Ozone Pollution Control Measures

From 2017 to 2019, the air quality of Shijiazhuang City has shown a gradual improvement process. The concentration of particulate matter, SO2, and other bituminous coal pollutants has decreased, and the number of days with particulate matter as the primary pollutant has gradually decreased, but the concentration of composite pollutants O3 has increased. The number of days with O3 as the primary pollutant has increased. Therefore, the pollution characteristics have shown a trend of changing from “coal type” to “complex type”, and the focus of atmospheric control should shift to controlling ozone precursors.
According to the pollution characteristics analyzed in this article, local measures should be taken to carry out peak-shift production of enterprises involving VOCs emissions, strengthen traffic optimization of key urban sections, and carry out inspections of urban motor vehicle congestion sections and sensitive areas. For road sections and sensitive areas where frequent congestion occurs, strengthen on-site guidance, scientifically arrange routes, rationally organize vehicle traffic, and improve road traffic efficiency. Strengthen the supervision and inspection of catering service business premises, ensure that all oil fume purification facilities are installed, and urge the installed stores to replace and clean the purification equipment regularly to ensure stable and up-to-standard emission of oil fume and reduce non-point source emissions of VOCs.

4. Conclusions

From 2017 to 2019, except for O3, the environmental quality of Shijiazhuang City showed a decreasing trend. Among them, the decreasing trend of SO2 was the most obvious, down 47.9%, the smallest decrease of NO2 was 15.4%, and the increase of O3 was 12.8%. The AQI index has been declining year by year, and compared with 2017, it has dropped by 18.3% in 2019. From 2017 to 2019, the number of days with good air quality has increased year by year, with 183, 212, and 251 days, accounting for 50.1%, 58.8%, and 68.9%, respectively.
Seasonal changes show that NO2, PM2.5, CO, PM10, and SO2 are the highest in winter and lowest in summer, and the O3 concentration changes are highest in summer and lowest in winter.
From the perspective of diurnal variation, the trends of NO2, SO2, PM10, and PM2.5 are relatively similar, showing “early peaks and midday valleys” changes. This change is related to geographical location, meteorological conditions, pollutant emissions, and human life. The daily change of O3 mass concentration is a single peak type, which is the opposite of the change trend of NO2, showing the change characteristics of the concentration during the day than at night.
The overall distributions of AQI, NO2, SO2, PM10, and PM2.5 are very similar, showing a gradual decrease from northeast to southwest. On the contrary, the spatial distribution of O3 concentration shows a gradual increase from northeast to southwest. The correlations between AQI and concentrations suggest that PM10, PM2.5, and CO contribute the most to undesirable pollution levels in this area, while NO2, SO2, and O3 contribute less to undesirable pollution.

Author Contributions

Y.T.: Writing original draft, writing review and editing. J.Q.: Conceptualization, data and curation. J.W.: Formal analysis, writing—original draft, writing—review and editing. C.F.: Formal analysis, data curation, writing—original draft, writing—review and editing. All authors have read and agreed to the published version of the manuscript.

Funding

This research was funded by Ecology and Environment Department of Jilin Province. The project numbers are 2018-19 and 2019-08.

Institutional Review Board Statement

Not applicable.

Informed Consent Statement

Informed consent was obtained from all subjects involved in the study.

Data Availability Statement

Expert opinion data and any other data are contained within the article.

Acknowledgments

The authors would like to thank Shijiazhuang ecological environment monitoring center of Hebei Province for supporting us. Additionally, the authors would like to thank the group members of Laboratory 537 and 142 of Jilin University.

Conflicts of Interest

The authors declare that they have no known competing financial interests or personal relationships that could have appeared to influence the work reported in this paper.

References

  1. Wang, Z.; Li, Y.; Chen, T.; Zhang, D.; Sun, F.; Pan, L. Spatial-temporal characteristics of PM2.5 in Beijing in 2013. Acta Geogr. Sin. 2015, 70, 111–120. [Google Scholar]
  2. Liu, J.; Gui, H.; Xie, P.; Liu, W. Recent progress of atmospheric haze monitoring technology. J. Atmos. Environ. Opt. 2015, 10, 93–101. [Google Scholar]
  3. Zhang, Y.; Chen, X.; Xie, G.; Zhang, J.H.; Zhang, C.S.; Shi, Y. Pollution status and spatial distribution of PM2.5 in China. Resour. Sci. 2015, 37, 1339–1346. [Google Scholar]
  4. Zhang, Y.L. Dynamic effect analysis of meteorological conditions on air pollution: A case study from Beijing. Sci. Total Environ. 2019, 684, 178–185. [Google Scholar] [CrossRef] [PubMed]
  5. Chai, F.H.; Gao, J.; Chen, Z.X.; Wang, S.; Zhang, Y.; Zhang, J.; Ren, C. Spatial and temporal variation of particulate matter and gaseous pollutants in 26 cities in China. Environ. Sci. 2014, 26, 75–82. [Google Scholar] [CrossRef]
  6. Brauer, M.; Freedman, G.; Frostad, J.; Van Donkelaar, A.; Martin, R.V.; Dentener, F.; Cohen, A.; van Dingenen, R.; Estep, K.; Amini, H.; et al. Ambient air pollution exposure estimation for the global burden of disease 2013. Environ. Sci. Technol. 2016, 50, 79–88. [Google Scholar] [CrossRef]
  7. Dong, Z.F.; Hao, C.X.; Li, H.X.; Ge, C.Z.; Wang, J.N. Analysis of the environmental performance index: 2016 report. Environ. Prot. 2016, 44, 52–57. [Google Scholar]
  8. Kim, K.-H.; Jahan, S.A.; Kabir, E. A review on human health perspective of air pollution with respect to allergies and asthma. Environ. Int. 2013, 59, 69–78. [Google Scholar] [CrossRef]
  9. Kan, H.; Chen, R.; Tong, S. Ambient air pollution, climate change, and population health in China. Environ. Int. 2012, 42, 90–96. [Google Scholar] [CrossRef]
  10. Hu, J.; Huang, L.; Chen, M.; Liao, H.; Zhang, H.; Wang, S.; Zhang, Q.; Ying, Q. Premature Mortality Attributable to Particulate Matter in China: Source Contributions and Responses to Reductions. Environ. Sci. Technol. 2017, 51, 65–74. [Google Scholar] [CrossRef]
  11. Li, X.; Qu, X.; Zhao, X.; Liu, Y. Variation characteristics and influencing factors of atmospheric pollutants in Yinchuan. J. Arid Land Resour. Environ. 2018, 32, 28–33. [Google Scholar]
  12. Xiao, Z.Y.; Jiang, H.; Cheng, M.M. Characteristics of atmospheric NO2 over China using OMI remote sensing data. Acta Sci. Circumstantiae 2011, 31, 2080–2090. [Google Scholar]
  13. Pandey, B.; Agrawal, M.; Singh, S. Assessment of air pollution around coal mining area: Emphasizing on spatial distributions, seasonal variations and heavy metals, using cluster and principal component analysis. Atmos. Pollut. Res. 2014, 5, 79–86. [Google Scholar] [CrossRef] [Green Version]
  14. Guan, D.B.; Su, X.; Zhang, Q.; Peters, G.P.; Liu, Z.; Lei, Y.; He, K.B. The socioeconomic drivers of China’s primary PM2.5 emissions. Environ. Res. Lett. 2014, 9, 024010. [Google Scholar] [CrossRef] [Green Version]
  15. Bai, J.H.; de Leeuw, G.; De Smedt, I.; Theys, N.; Van Roozendael, M.; Sogacheva, L.; Chai, W.H. Variations and photochemical transformations of atmospheric constituents in North China. Atmos. Environ. 2018, 189, 213–226. [Google Scholar] [CrossRef]
  16. Li, J.C.; Gao, Q.X.; Li, L.; Zheng, Y.F.; Gao, W.K. Enlightenment and suggestions on the air quality of Beijing, Tianjin and Hebei revealed by primary pollutants. Res. Environ. Sci. 2018, 31, 1651–1661. [Google Scholar]
  17. Li, K.; Jacob, D.J.; Liao, H.; Shen, L.; Zhang, Q.; Bates, K.H. Anthropogenic drivers of 2013–2017 trends in summer surface ozone in China. Proc. Natl. Acad. Sci. USA 2019, 116, 42–49. [Google Scholar] [CrossRef]
  18. Ebenstein, A.; Fan, M.Y.; Greenstone, M.; He, G.J.; Zhou, M.G. New evidence on the impact of sustained exposure to air pollution on life expectancy from China’s Huai River Policy. Proc. Natl. Acad. Sci. USA 2017, 114, 10384–10389. [Google Scholar] [CrossRef] [Green Version]
  19. Zhang, J.; Sun, J.; Wang, G.; An, L.; Wang, W. Relation between the spatial-temporal distribution characteristics of air quality index and meteorological conditions in Beijing. Meteorol. Environ. Sci. 2014, 37, 33–38. [Google Scholar]
  20. Li, M.; Tang, G.; Huang, J.; Liu, Z.; An, J.; Wang, Y.-S. Characteristics of Winter Atmospheric Mixing Layer Height in Beijing-Tianjin-Hebei Region and Their Relationship with the Atmospheric Pollution. Environ. Sci. 2015, 36, 1935–1943. [Google Scholar]
  21. Silver, B.; Reddington, C.L.; Arnold, S.R.; Spracklen, D.V. Substantial changes in air pollution across China during 2015–2017. Environ. Res. Lett. 2018, 13, 114–123. [Google Scholar] [CrossRef]
  22. Song, R.; Yang, L.; Liu, M.; Li, C.; Yang, Y. Spatiotemporal distribution of air pollution characteristics in Jiangsu Province, China. Adv. Meteorol. 2019, 6, 56–70. [Google Scholar] [CrossRef] [Green Version]
  23. Jia, M.W.; Zhao, T.L.; Zhang, X.Z.; Wu, X.H.; Tang, L.L.; Wang, L.M.; Chen, Y.S. Seasonal variations in major air pollutants in Nanjing and their meteorological correlation analyses. China Environ. Sci. 2016, 36, 2567–2577. [Google Scholar]
  24. Ji, D.; Wang, Y.; Wang, L.; Chen, L.; Liu, Z. Analysis of heavy pollution episodes in selected cities of northern China. Atmos. Environ. 2012, 50, 338–348. [Google Scholar] [CrossRef]
  25. Yang, Y.; Wang, L.; Yang, L.; Tao, H. The relevance between the characteristics of O3 and meteorological factors in Lan Zhou. Pollut. Prev. 2019, 11, 50–52. [Google Scholar]
  26. Tang, G.; Zhang, J.; Zhu, X. Mixing layer height and its implications for air pollution in Beijing, China. Atmos. Chem. Phys. 2016, 16, 2459–2475. [Google Scholar] [CrossRef] [Green Version]
  27. Yu, Z.; Liu, S.; Wang, Y.; Hu, N. Observation of atmospheric pollutants in the urban area of Hangzhou. Sci. Technol. Eng. 2016, 16, 95–104. [Google Scholar]
  28. Song, R.; Yang, Y.; Yang, L.; Liu, M.; Li, C. Spatiotemporal distribution characteristics of primary air pollutants in winter in Nanjing in recent years. Environ. Sci. Technol. 2020, 43, 72–77. [Google Scholar]
  29. Lv, R.; Zhang, J.; Xue, Y.; Jiang, X.; Huang, F. The Relevance between the Polluton Characteristics of O3 and Meteorological Factors in Chengde. Acta Sci. Nat. Univ. Nankaiensis 2020, 53, 85–90. [Google Scholar]
  30. Zheng, B.; Tong, D.; Li, M.; Liu, F.; Hong, C.; Geng, G.; Li, H.; Li, X.; Peng, L.; Qi, J.; et al. Trends in China’s anthropogenic emissions since 2010 as the consequence of clean air actions. Atmos Chem. Phys. 2018, 18, 14095–14111. [Google Scholar] [CrossRef] [Green Version]
  31. Fang, X.K.; Park, S.; Saito, T.; Tunnicliffe, R.; Ganesan, A.L.; Rigby, M.; Li, S.L.; Yokouchi, Y.; Fraser, P.J.; Harth, C.M.; et al. Rapid increase in ozone-depleting chloroform emissions from China. Nat. Geosci. 2018, 12, 89–93. [Google Scholar] [CrossRef]
  32. Daellenbach, K.R.; Bozzetti, C.; Křepelová, A.; Canonaco, F.; Wolf, R.; Zotter, P.; Fermo, P.; Crippa, M.; Slowik, J.G.; Sosedova, Y. Characterization and source apportionment of organic aerosol using offline aerosol mass spectrometry. Atmos. Meas Tech. 2016, 9, 23–39. [Google Scholar] [CrossRef] [Green Version]
  33. Richmond-Bryant, J.; Saganich, C.; Bukiewicz, L.; Kalin, R. Associations of PM2.5 and black carbon concentrations with traffic, idling, background pollution, and meteorology during school dismissals. Sci. Total Environ. 2009, 407, 3357–3364. [Google Scholar] [CrossRef] [PubMed]
  34. Liu, J.; Lu, K.; Liu, X. The Analysis and Countermeasures of Ozone Pollution of the Ambient Air in Jiaozuo City. J. Jiaozuo Univ. 2020, 4, 92–94. [Google Scholar]
  35. Leung, D.M.; Tai, A.P.K.; Mickley, L.J.; Moch, J.M.; van Donkelaar, A.; Shen, L.; Martin, R.V. Synoptic meteorological modes of variability for fine particulate matter (PM2.5) air quality in major metropolitan regions of China. Atmos. Chem. Phys. 2018, 18, 6733–6748. [Google Scholar] [CrossRef] [Green Version]
  36. Zhao, S.; Zhang, H.; Xie, B. The effects of El Niño–Southern Oscillation on the winter haze pollution of China. Atmos. Chem. Phys. 2018, 18, 1863–1877. [Google Scholar] [CrossRef] [Green Version]
  37. Cai, W.; Li, K.; Liao, H.; Wang, H.; Wu, L. Weather conditions conducive to Beijing severe haze more frequent under climate change. Nat. Clim. Chang. 2017, 7, 257–262. [Google Scholar] [CrossRef]
  38. Maji, K.J.; Sarkar, C. Spatio-temporal variations and trends of major air pollutants in China during 2015–2018. Environ. Sci. Pollut. Res. 2020, 6, 1–17. [Google Scholar] [CrossRef]
Figure 1. The geography of monitoring stations in Shijiazhuang.
Sustainability 13 00941 g001
Figure 2. Annual changes of six pollutants and AQI in Shijiazhuang City from 2017 to 2019.
Sustainability 13 00941 g002aSustainability 13 00941 g002bSustainability 13 00941 g002c
Figure 3. Air Quality Days in Shijiazhuang from 2017 to 2019.
Sustainability 13 00941 g003
Figure 4. The percentage of air quality days at monitoring sites in Shijiazhuang from 2017 to 2019.
Sustainability 13 00941 g004
Figure 5. Seasonal changes of six pollutants. The darker color in the figure means the greater the concentration, and the abscissa is 0–23 o’clock in a day in Shijiazhuang City.
Sustainability 13 00941 g005
Figure 6. AQI monthly variation of Shijiazhuang from 2017 to 2019.
Sustainability 13 00941 g006
Figure 7. Diurnal variation of concentrations of six pollutants from 2017 to 2019: (a) SO2, (b) NO2, (c) O3, (d) CO, (e) PM10, (f) PM2.5.
Sustainability 13 00941 g007
Figure 8. Spatial distributions of annual average mass concentrations of the six pollutants and AQI from 2017 to 2019 (CO unit: mg/m3; other pollutant units: μg/m3).
Sustainability 13 00941 g008aSustainability 13 00941 g008bSustainability 13 00941 g008c
Figure 9. Correlation between pollutants and AQI.
Sustainability 13 00941 g009
Table 1. The site corresponds to the environmental functional area and geographic coordinates.
Monitoring StationCoordinatesEnvironmental Function Area
Staff Hospital114.4548° E 38.0513° NResidential area
High-tech Zone114.6046° E 38.0398° NIndustrial area
Northwest Water114.5019° E 38.1398° NCultural and Educational area
Southwest Higher Education114.4586° E 38.0058° NCultural and Educational area
Century Park114.5331° E 38.0178° NCommercial traffic area
People’s Hall114.5214° E 38.0524° NCultural and Educational area
Mountain Fenglong114.3541° E 37.9097° NScenic area
Table 2. Pollutant concentration limits.
IAQISO2 (24-h Average, μg/m3)SO2 (1-h Average, μg/m3)NO2 (24-h Average, μg/m3)NO2 (1-h Average, μg/m3)PM10 (24-h Average, μg/m3)CO (24-h Average, mg/m3)CO (1-h Average, mg/m3)O3 (1-h Average, μg/m3)O3 (8-h Average, μg/m3)PM2.5 (24-h Average, μg/m3)
00000000000
505015040100502516010035
1001505008020015041020016075
1504756501807002501435300215115
20080080028012003502460400265150
3001600/56523404203690800800250
4002100/7503090500481201000/350
5002620/9403840600601501200/500
Table 3. Air quality index (AQI) classification standards.
AQIAir Quality
0–50Excellent
51–100Good
101–150Light pollution
151–200Medium pollution
201–300Heavy pollution
>300Severe pollution
Table 4. Number of days with O3 and PM10 or PM2.5 as the main pollutant.
Number of Days with PM10 or PM2.5 as the Main PollutantNumber of Days with O3 as the Main Pollutant
201726192
2018214111
2019193131
Publisher’s Note: MDPI stays neutral with regard to jurisdictional claims in published maps and institutional affiliations.

