Article

Study on Tourism Flow Network Patterns on May Day Holiday

College of Geography and Environmental Science, Northwest Normal University, Lanzhou 730070, China
*
Author to whom correspondence should be addressed.
Sustainability 2021, 13(2), 947; https://doi.org/10.3390/su13020947
Submission received: 8 December 2020 / Revised: 14 January 2021 / Accepted: 15 January 2021 / Published: 18 January 2021

Abstract

:
The development of tourism is based on tourism flow and studying a tourism flow network can help to elucidate its mechanism of operation. Transportation network is the path to realize the spatial displacement of tourism flow. This study used “Tencent migration” big data to explore the spatial distribution characteristics and rules of tourism flow in China, providing suggestions for the development of tourism. The results demonstrate that the 361 cities studied can be divided into three types: destination-oriented, tourist-origin-oriented, and destination-oriented and tourist-origin-oriented. There are significant differences in the quantity of flow, the area of concentration, and the factors affecting the flow in the three types of cities. The larger the flow of tourism between cities, the higher the network level, and the wider the network range. The high-level nodes are closely related, while the peripheral nodes are more widely distributed, with weak attractiveness and inconvenient traffic, forming a “core-edge” structure. Different network patterns are established for different modes of transportation. The degree of response of different types of transportation to distance is the main factor influencing the network patterns of diverse paths. These findings have practical implications for the choice of appropriate travel destinations and transportation modes for tourists.

1. Introduction

Since the National Day in 1999, holiday tourism has become a unique phenomenon in China’s economic and social life [1,2,3], which is based on the exclusion of the impact of some crisis events on tourism (the COVID-19 event [4], etc.) According to the National Tourism Administration, the May Day holiday in 2018 saw 147 million domestic tourists, generating CNY 87.16 billion in domestic tourism income. The promotion of tourism and statutory holidays have long fueled the passion of people for tourism, causing “overtourism” in many destinations [5]. However, tourism can lead to phenomena of imbalance and an ineffective configuration of the market, and produce a series of problems, such as heavy traffic, scenic overload, issues with accommodation, declining quality of services, an increase in potential safety hazards [6]. The hotel industry under the change of institutional logic is also affected [7], directly affecting the quality of the tourism. There has been some research into tourists’ emotional experiences, including how tourists may be attracted through appeal to emotions and the services provided at destinations [8,9,10,11], place attachment, and residents’ attitudes and intentions toward tourism behavior [12]. How to effectively regulate holiday tourism to promote sustainable development and prevent significant negative impacts is a crucial issue that warrants the attention of national and local governments.
Tourism activity and industry are based on tourism flow, which connects the origins and destinations of tourists [13]. The relationship of tourist origins and destinations impacts the patterns of competition between tourism hotspots, having a profound influence on tourism flow. Researching tourism flow networks helps to elucidate the drivers of tourism flow and the mechanisms behind the operation of tourism networks [14,15]. The quantity, direction, and spatial pattern of tourism flow are related to the country and local tourism industries’ development conditions and strategy formulation. The application of complexity and network science to the tourism domain is slowly increasing and has already shown its validity and usefulness from an academic perspective [16]. This study used “Tencent migration” big data to extract tourism flow data, and divided tourism flow into three types: airplane, train, and car. This study mainly addressed three problems. Firstly, the problem of obtaining large-scale tourism flow data should be solved to overcome the defects of small scales and limited sample sizes in research. Secondly, tourism flow is the movement of tourists between origin (O) and destination (D). Answering the questions “Where does it come from?”, “Where does it go?”, and “How does it go?” requires clearly distinguishing the source of tourists (O) from the destination (D), as well as the route to determine movement. Thirdly, it is necessary to determine the characteristics of China’s tourism flow network, explore the relationship between the total network and sub-network (i.e., the network under different path conditions), and study the mechanisms of path differentiation.

2. Literature Review

2.1. Research Progress

Tourism flow is the phenomenon of tourists’ collective spatial movement caused by tourism demand, which has the basic characteristics of quantity, direction, network, path, etc. The quantity and direction of tourism flow are major indices for its evaluation and fundamental to the tourism network. Tourism flow paths represent tourists’ mobility and realistic paths connecting tourist origins and destinations. Most research into spatial and temporal tourism flow has focused on the “tourists–excursion–scenic spot” pattern. Some interrelated studies have focused on the spatial patterns [17,18,19], spatio-temporal evolution [20,21,22,23], and influencing factors [24,25] of tourism flow and the demand for tourism [26,27]. Such research has significantly helped to clarify the concept of tourism flow, constructing the research directions and paradigm for tourism flow. The study of the network structure of tourism flow is mainly based on big data [28,29,30], which is the basis of technological developments that have led to the continuous updating of research data. The impact of technological development on tourism is also reflected in aspects of services and stakeholders [31,32], which in turn affect the tourism experience [33]. Studies demonstrate that tourism flow network structure characteristics are deeply influenced by tourism resource endowment, transportation development, the development level of regional economies, tourism service reception levels, etc. [34].
In the early days, the development of transportation was mainly aimed at improving operation speed and efficiency. With the maturity of technology and changes in demand, the next goal in transportation became its safety [35,36]. Rapid transit not only expands the tourist market [37], speeds up the economic development of the destination [38], and improves tourism efficiency [39], but also leads to changes in the spatial structure of tourism flow [40]. In particular, the “space–time compression effect” of high-speed rail makes important destinations more prominent in the tourism flow network and even leads to the “Matthew effect,” while disadvantaged destinations experience the “corridor effect,” and the phenomenon of “urban integration” in neighboring cities intensifies [41]. Due to the improvement of accessibility, not only is the number of scenic spots along the high-speed railway line increased, but the formation of cross-regional tourism is also promoted [42].
The above research provides new perspectives and means for the cognitive tourism flow network, but there are still shortcomings. Firstly, these studies lack clear and accurate assessments of tourism flow, and especially lack descriptions of tourism flow path dependence; they cannot answer the questions “Where does tourism flow come from?”, “Where does tourism flow through travel?”, or “How does tourism flow?” The second issue is that the studies on tourism flow networks generally use “attribute data” rather than “relational data.” Especially for large-scale areas, similar scenic spot tracking cannot be used to solve the data source problem. As a result, the statistics of national or local tourism authorities, questionnaire survey data, or digital footprint data (network travel notes, network observations, social picture websites such as Flickr pictures, the Baidu index, and other data) are generally used. Because of limited sample sizes, it is difficult to fully reflect the characteristics of large-scale tourism flow networks and their temporal and spatial changes.

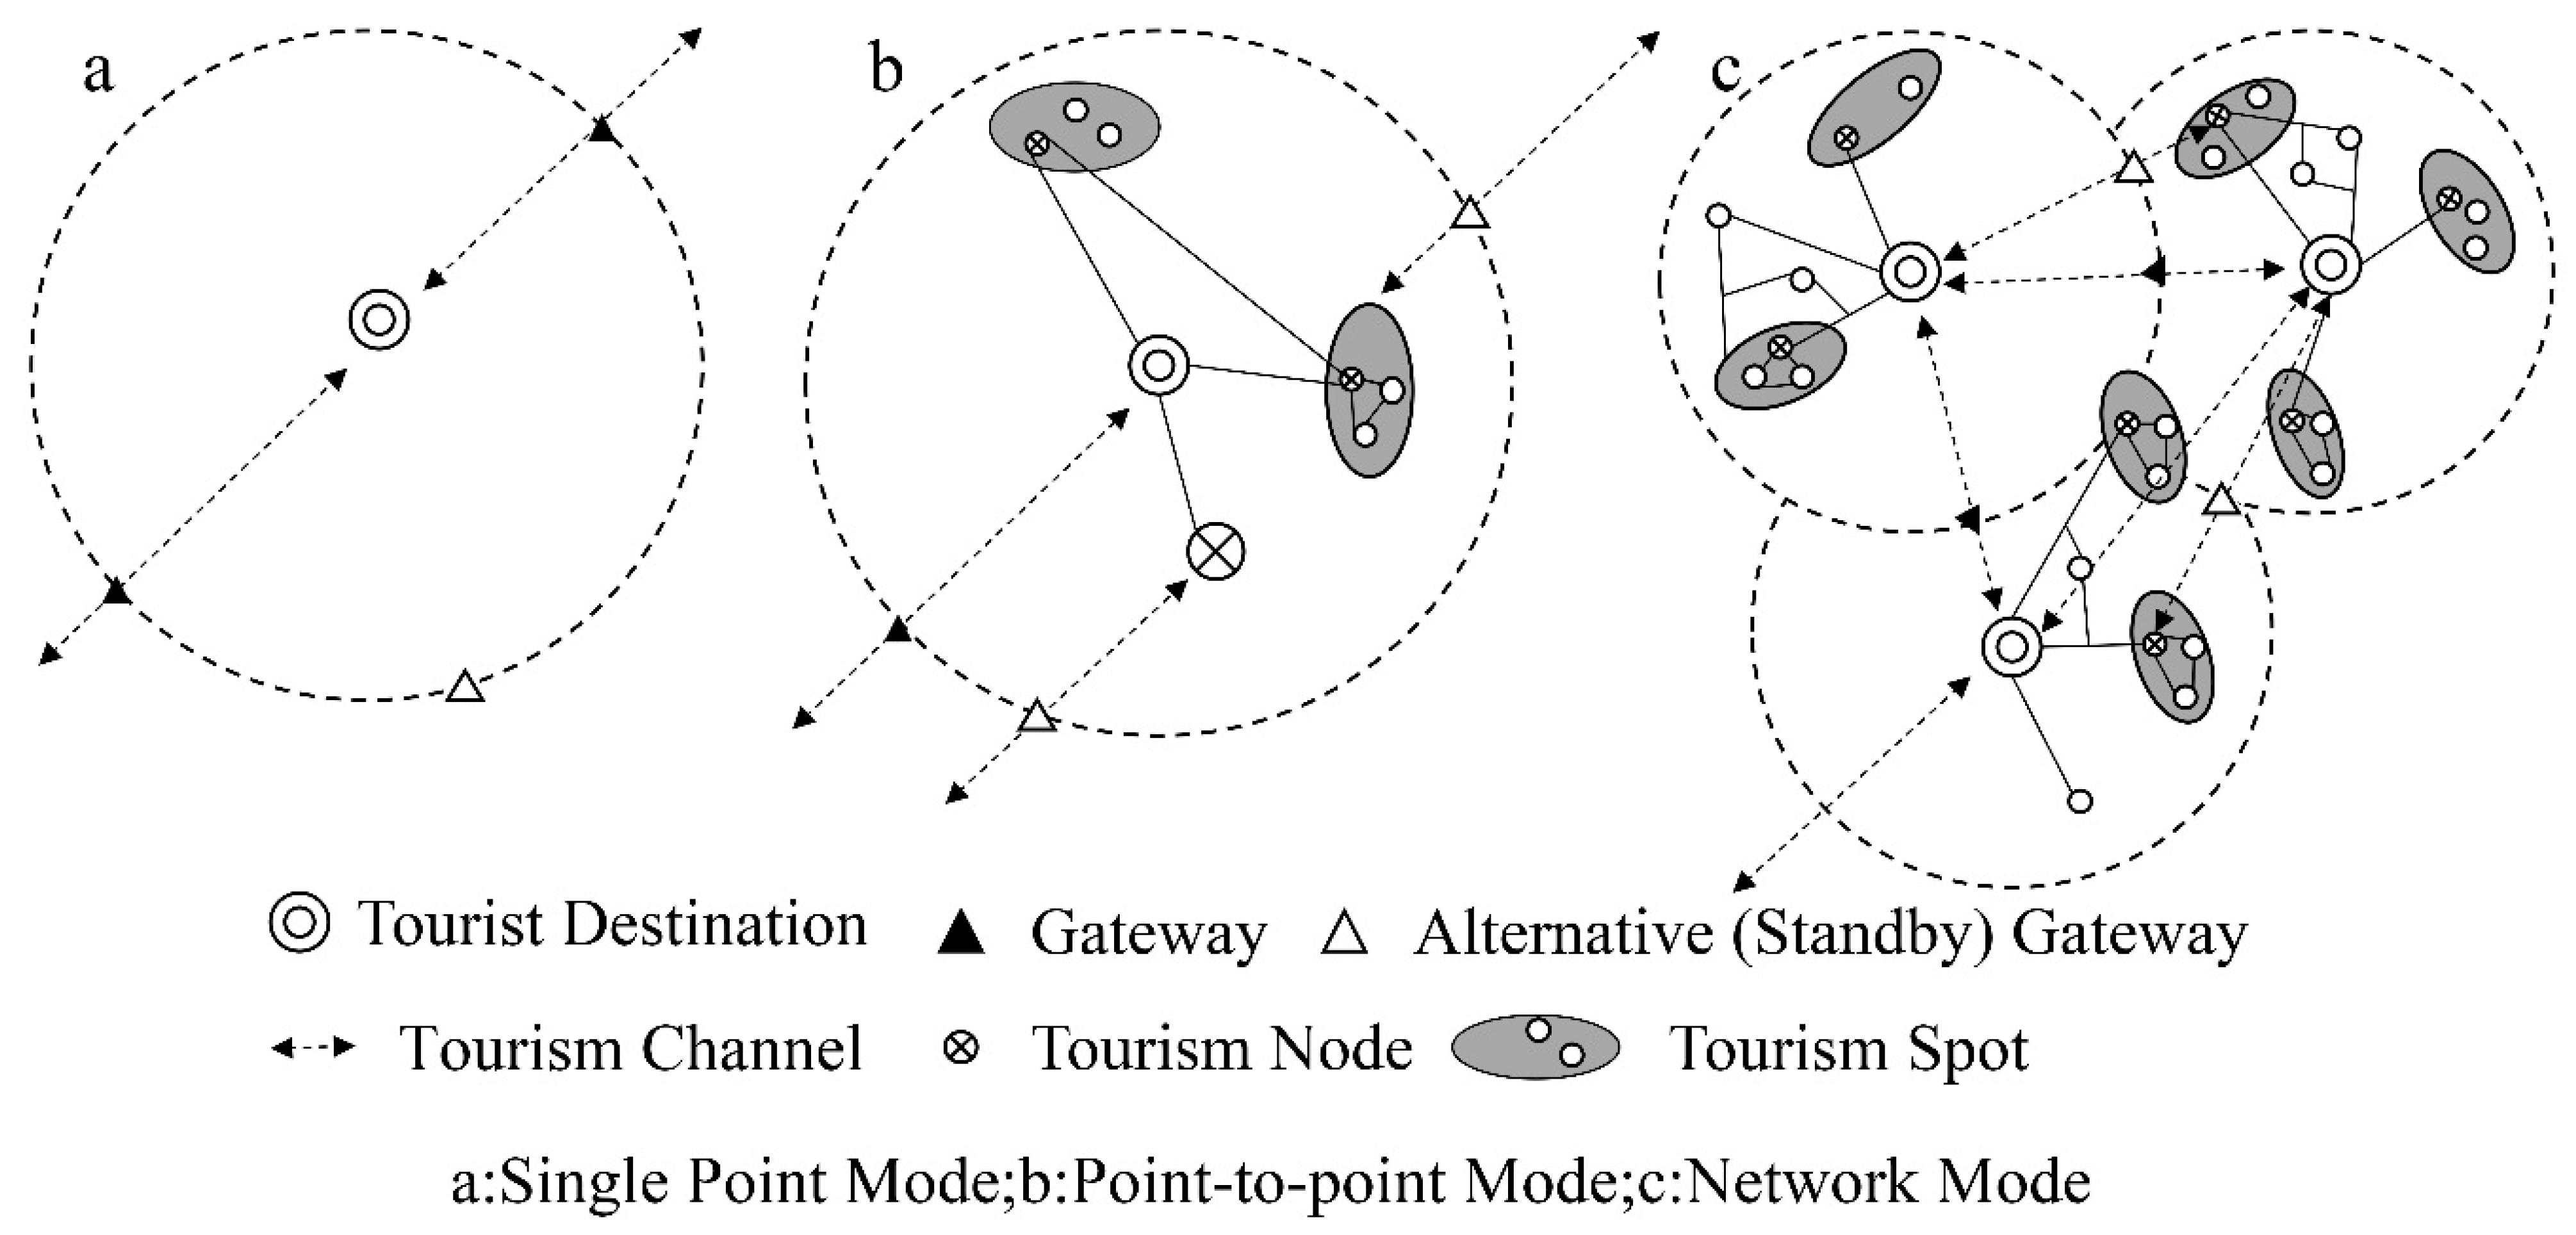
2.2. Theoretical Basis

Tourism flow is the phenomenon of the movement of tourists in a tourist activity, generally expressed in the three dimensions of time, the quantity of flow, and the direction of flow. The flow quality, flow potential, flow direction, flow effect, flow force, and flow quantity are the focus in tourism [13]. In contrast to simple population flow, tourism flow shows directional and spatial differences between the tourist stage and return stage. The tourists and their tourism actions are interdependent and interactive; the behavior is not only individual but also group based. All types of material flow and non-material flow occur between them. That is, the tourism phenomenon can be considered as a tourism social network organization consisting of various tourism relations. The “mosaic theory” holds that any economic behavior is realized in the process of interaction within the social network. The core subjects of tourism activities—tourists, travel agencies, destinations, etc.—are embedded in a certain social and cultural framework. Therefore, tourism behavior is not an isolated process [43] but a complex network relationship.
Tourism flow is spatial movement between tourist origins (O) and destinations (D). The O–D system and its interactions constitute the tourism flow network; O and D are the nodes in the network. The traditional study of tourism flow often defines the main tourist destinations (D) as the core. It is believed that tourism flow often proceeds from the core area to the edge area but, in the tourism network, O and D can become the core. Any discussion of the mechanism, process, and mode of tourism flow should be from the perspective of the tourism O–D system, not the O or D point of view alone. We should transition from the “single-point level” to the “multi-point level” and “tourism-network level” to explore tourism flow. Because of the different functions of the nodes, there are differences in the quantity and direction of the tourism flow. Because of the different paths of the O and D connections, there are also differences in the network level, structure, and hinterland range of the tourism flow.
According to the formation, development, and maturity of tourist destination systems, Dredge [44] presented three spatial structure models of tourism destination: the single-node model, multi-node model, and chain-node layout model, which are in accordance with the single-point level, point-to-point level, and network-system level of the O–D system. At the single-point level, tourists come from the tourist origin to the destination and visit the only tourist node. Tourism activities are concentrated in a small range and are relatively independent, forming a single path between O and D (Figure 1a). As tourism develops, some attractive tourism resources are developed, and multiple nodes co-exist; the tourism destination model gradually changes to the multi-node layout model (or point-to-point level) (Figure 1b). With the continuous development of tourism, tourism nodes gradually increase, different types of tourist sites begin to form, and the tourist destination system progresses to a mature stage with a reasonable structure, complete function, and good stability, forming a complex network structure (Figure 1c).
Nodes, paths, and gateways are the key control factors in the tourism flow network structure [45]. The nodes consist of two interdependent major components: the attraction complexes and the service components. The former are mainly composed of scenic spots (groups), and the latter of various service facilities. Depending on the importance of attractiveness, the core can control the classes of the entire network. Tourist paths guide tourists to move between attraction complexes and service components. The gateway is located on the travel path between regions and is the entrance to the destination area. The geographical spatial transfer of tourism flow cannot be separated from the support of the transportation network. Cities play two important functions in the spatial diffusion of tourism flow: tourism terminals (i.e., tourist destinations) and transit stations. Lundgren divided tourist destinations into four types: urban, peripheral urban, peripheral rural, and natural environment destinations [46].
Generally speaking, urban destinations experience the dual activities of traveling and entering, and have the support of developed transportation network systems, which produce large-scale tourism flows to each. Because of the small sizes of the populations and weak central functions, peripheral urban destinations prefer the net inflow of tourism flows. The peripheral rural destinations, which have sparse populations and weak node functions, depend on the tourism landscape formed by the broad natural geographical environment to attract a net inflow of tourism flow. Natural environment destinations whose populations are very low and far from the tourist origins mainly include national or regional parks and nature reserves; they are also net inflow areas. Hierarchical agglomeration and hierarchical diffusion occur among different classes of tourist destinations. The tourism flow of urban destinations has a broad source of tourists, moving between the three local, regional, and national classes of nodes, with vertical upward agglomeration, through the O–D system, to complete the spatial transfer of tourism flow. The peripheral urban destinations aim to spread vertically down along the three different classes of nodes: national central cities, region cities, and village cities.
Like urban networks, tourist networks are based on “flow space,” which generally includes three levels: the first level is the infrastructure network that connects the space, which is the channels that realize the flow connections; the second level is a network that consists of nodes, and is the “gateway” of mobile flow; the third level is dominated by travel agencies and companies, so space can be joined through a dominant interests–functional space logic [47]. The complexity and multiple scales of the O–D system necessitate flexible hierarchies to accommodate different locations, sizes, and market characteristics. As a result, when the spatial scale is transformed, the O–D system’s spatial organization also changes, forming a tourism flow network with different levels (Figure 2). The transportation network is a realistic channel for the spatial movement of tourism flow, which determines accessibility between the O–D system in the tourist network and affects the spatial scale, flow direction, and distribution of tourism flow. Different traffic modes have different “space–time compression” effects. Different spatial relations of the O–D system and different “travel ratios” of tourists lead to the differentiation of the tourism flow network, and the tourism flow network hierarchy, structure, hinterland range, etc., change with the form of traffic.
The transportation network is the most basic system supporting tourism flow. The three basic characteristics of it are accessibility, connectivity, and meandering. Accessibility is based on the transportation mode and distance. In a transportation network, the accessibility depends on the number of points and their spatial organization. Generally speaking, the number of nodes in an air transportation network is always lower than that in railway and road transportation networks, while the lengths of lines (i.e., transportation distances) show a contrary pattern. As a result, the accessibility of air transportation is generally lower than that of railway and road transportation. It is this differentiation that leads to the differentiation of tourism flow networks. According to the transportation location theory, changes in transportation modes, distances, freight, and other transportation conditions often lead to changes in economic activity and location choice. Firstly, the route indices for different transportation modes are different, which affects the connectivity and economic distances of the routes. For different modes of transportation, the operating costs decrease with increases in distance—that is, freight rates tend to decrease in the following order: aviation > high-speed railways > ordinary railways > automobiles, fundamentally affecting the suitable transportation ranges (or economic distances) of different modes of transportation. Automobile transportation is a mainly short-distance form of transportation, train transportation is mainly medium and long distance, and air transportation is suitable for long distances. The differences in economic transport distances are determined by spatial proximity and the strengths of various flows, which lead to differences in the hinterlands of tourism flow networks. Therefore, for the air and train modes of transportation, a high-level tourism flow network always connects high-level cities over a large range, while for the mode of automobiles, the high-level networks are mainly intercity commuting networks.
The resulting tourism flow and flow range also have obvious differences, thus causing differences in the tourism flow network structure in the paths. Therefore, this study analyzes the tourism flow network under different transportation modes at the city scale in order to determine the accessibility and flow differences in each city for the three transportation modes. In the tourism flow network, time plays a more obvious role than space, so relative spatial proximity can be obtained by reducing travel time. The speed of air transport confers it with an absolute advantage, but high-speed rail has broken its monopoly, as a competitor, to a certain extent affecting the structure of the tourist flow network, hierarchy, and hinterland range. Thus, the reliance on air transport and the formation of the tourist flow network have been impacted by the high-speed rail network, which can itself also lead to the construction of a regional and even national tourist flow network; it is more difficult to expand road transportation to large area networks due to its relatively high attenuation sensitivity in terms of time. Considering the average speeds of the different modes of transportation—1000 km/h for planes, 300–350 km/h for high-speed rail, and 60–120 km/h for cars—and within a reasonable range of economic distances, one-day travel can be basically realized between node cities in the national tourism flow network, and 1–2 h travel circles can be formed between node cities in the local tourism flow network.

3. Materials and Methods

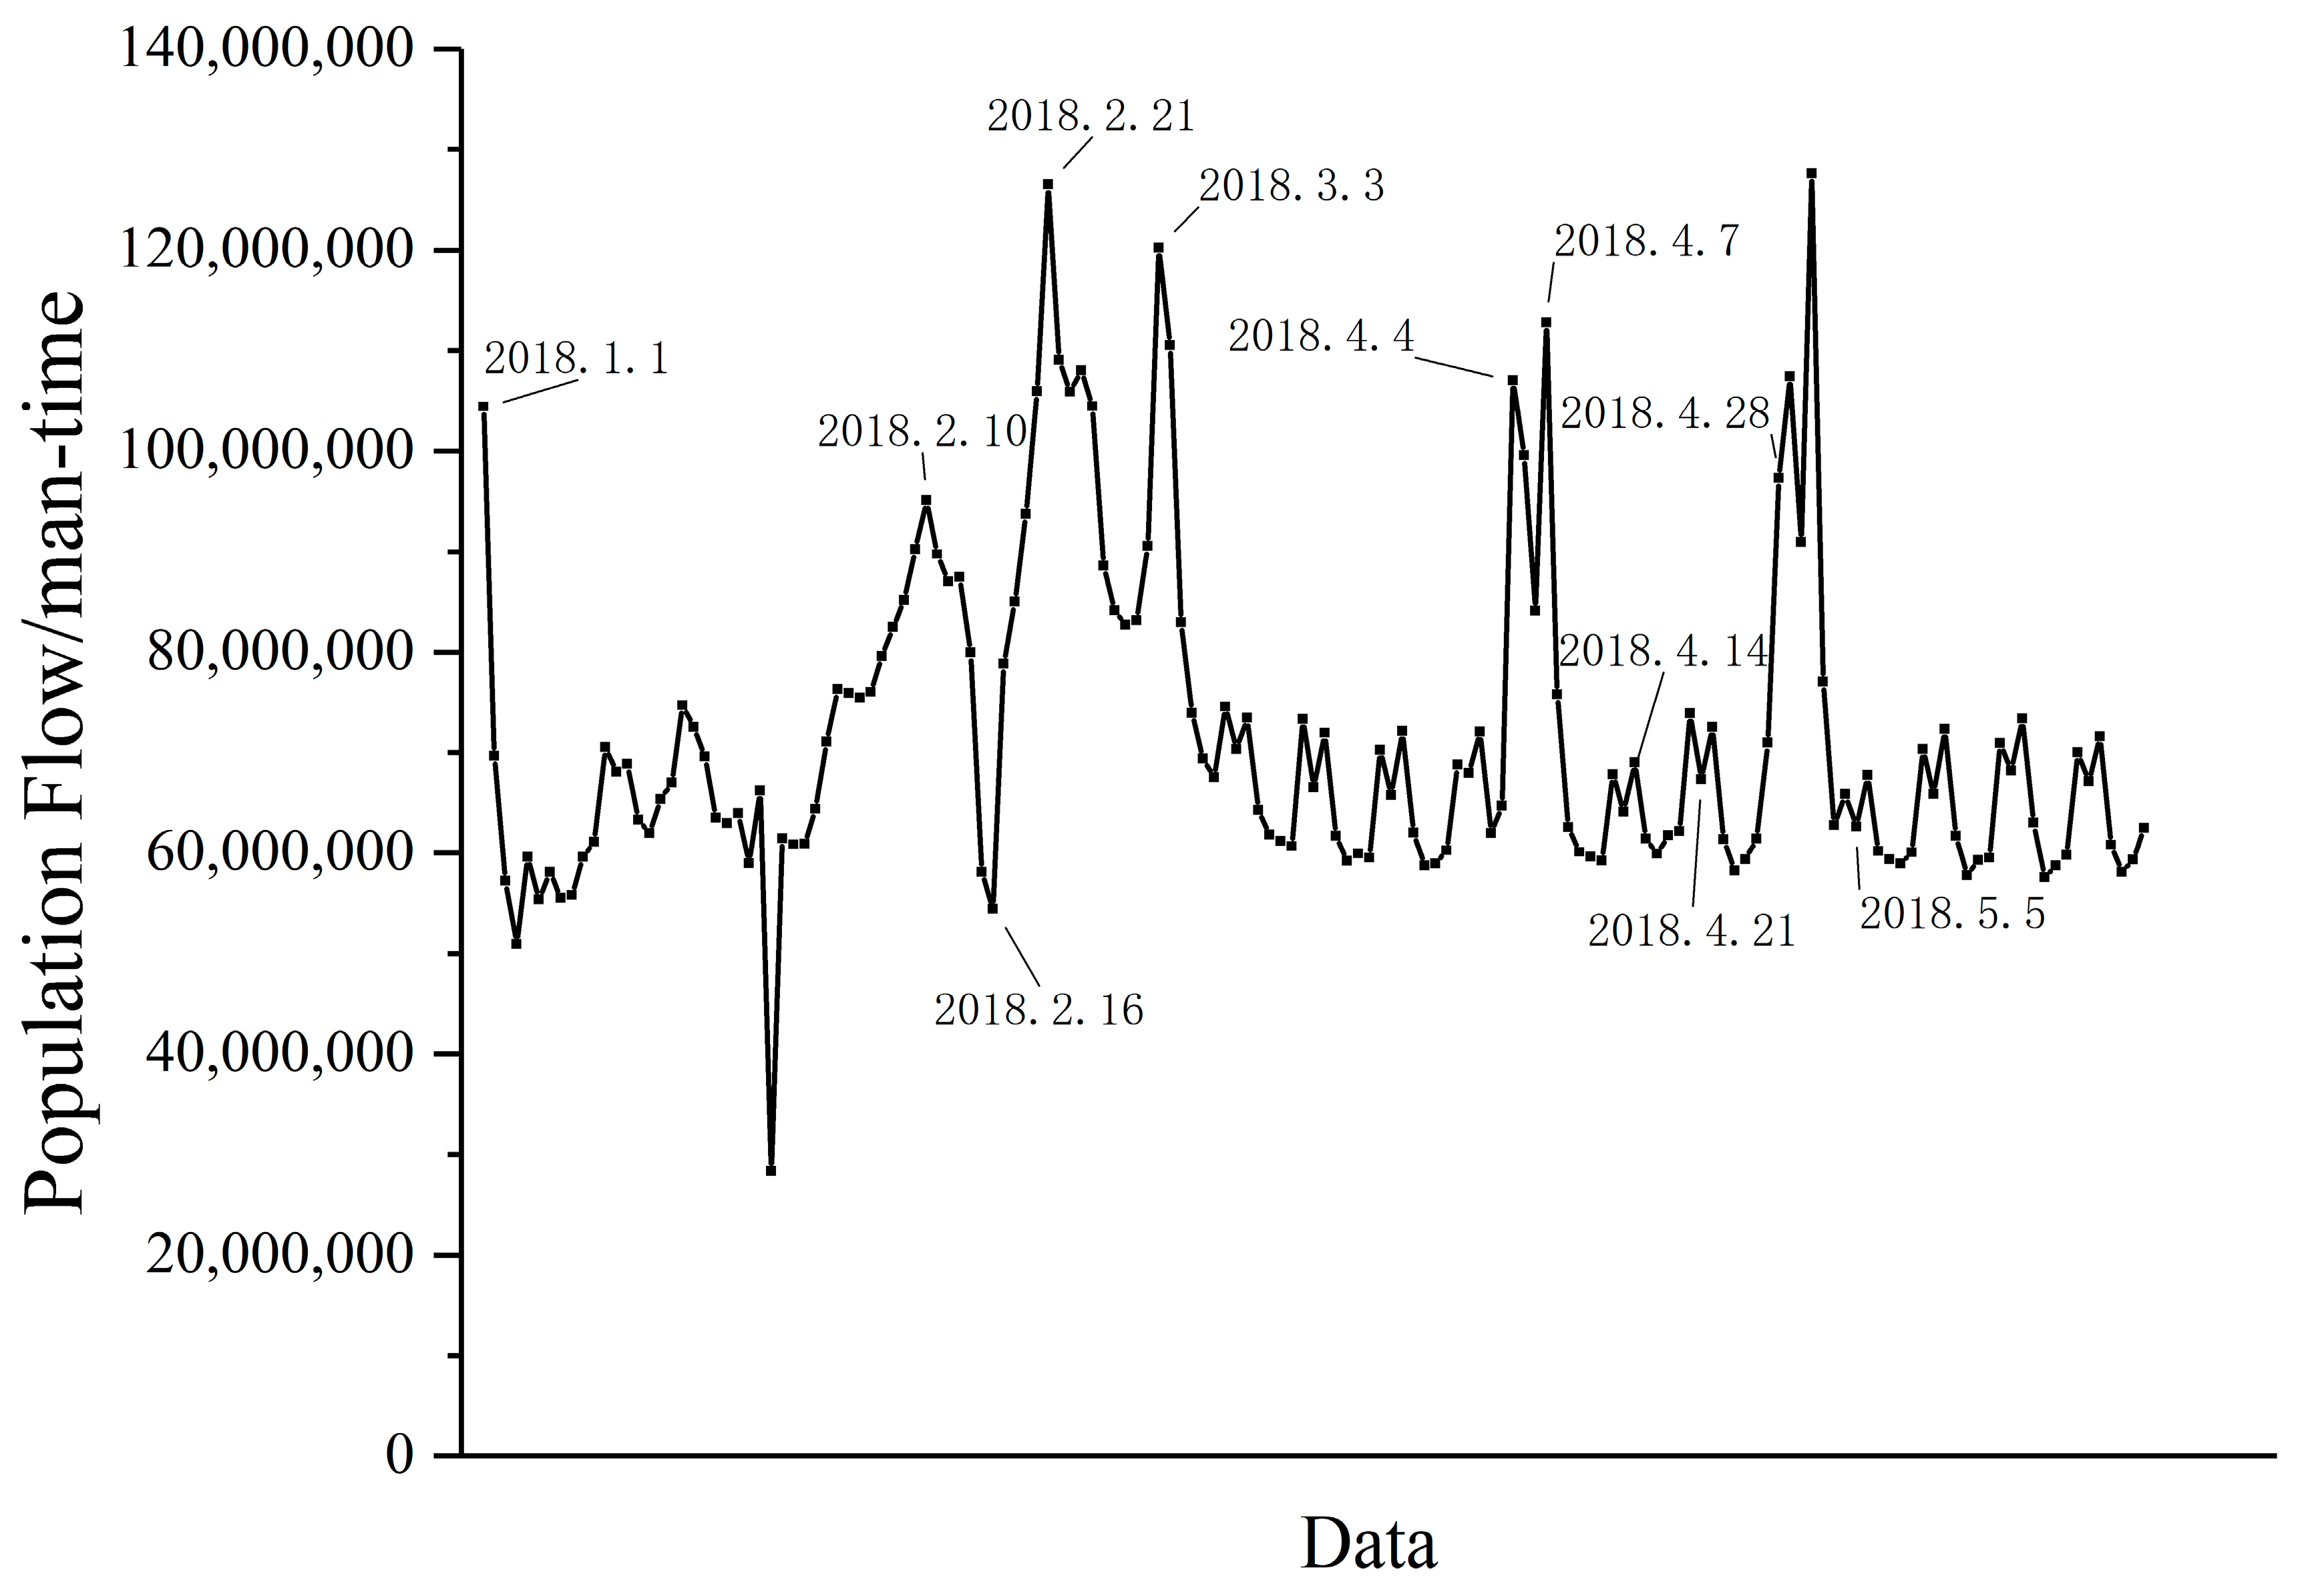
3.1. Data Sources and Processing

The key issue in tourism flow research is how to effectively and accurately obtain tourism data. Tourism flow data is the fundamental problem limiting research into tourism flow in terms of accuracy, reliability, and scientific merit [48]. The spatial movement of tourists is a discipline that is refined from tourists’ attribution. Tourism flow not only considers individual attributes (liquidity) but also considers the movement of tourists from source to destination that occurs through activity. Therefore, we should construct relational data for the tourism flow network. Qualitative descriptions obtained through traditional questionnaires and statistics data are not sufficient to constitute “relational data.” However, with the development of big data and geographic information technology, location-based services (LBS) and location-sharing services (LSS) have gradually incorporated geographic big data into our daily lives. Because of the strong real-time nature and dynamics of big data, they make continuous large-scale investigations possible, provide basic data for researchers to use to further study the tourism flow network, and compensate for the disadvantages of traditional data. Tencent migration big data have the following advantages over Baidu migration data: (1) Baidu migration data have an update period of 1 h, so many links in the population migration figures are dismantled, making it difficult to determine the beginning and end of the migration points; the update period for Tencent migration big data is one day, and relatively few of the complete contact lines are split, allowing a truer reflection of the migration status and spatial patterns. (2) Baidu migration data only record the total population flow between cities on a daily basis, whereas Tencent migration big data additionally record different modes of transportation (aircraft, trains, and cars) for population migration; because of the characteristics of different modes of transportation, the urban spatial contact intensity and network patterns show different characteristics.
This study adopted population migration data from the Tencent migration big data platform, reproducing the daily population migration between 361 cities in the country since February 2015. Collected Tencent migration data attributes include the longitude and latitude coordinates of starting and destination cities, as well as the proportional uses of the aircraft, train, and automobile modes of transportation. The data have the characteristics of being captured in real time, through dynamic and large-scale continuous observations.
Apart from around special festivals (e.g., Spring Festival, Ching Ming Festival, Labor Day, and National Day), the daily trends of intercity population migration in China are relatively stable. Looking at Tencent’s migration big data from 1 January to 31 May 2018, we can clearly observe differences between daily and holiday population mobility (Figure 3).
The flow is relatively stable under normal daily conditions. During the holidays (New Year’s Day, Spring Festival, Ching Ming Festival, and May Day) the quantity of flow soared, obviously closely related to the tourism flow. Thus, based on the Tencent migration big data platform, having obtained migration data for a total of 16 days across two periods, 14 April to 21 April 2018 and 28 April to 5 May 2018, data on population movement were obtained for 361 cities across the country. Both periods included Saturdays and Sundays, while in the preceding periods, representing the normal situation of population movement, the second period included May Day holiday. Since there is normal population movement on May Day in addition to that of the tourist population, in order to further determine May Day tourist population data, the following algorithm was used: actual tourism flow population = May Day net migration population − normal station net migration population:
P = P(4.28–5.5 net migration population)P(4.14–4.21 net migration population)
If there is a migration phenomenon between cities, it means that there is a tourism flow in the O–D system. In ArcGIS 10.2, the straight-line connection between two cities’ coordinates was used as the tourism flow path between them, so as to depict the “edge” of the tourism flow network. Base maps were derived from the Ministry of Natural Resources’ Standard Map Services (http://bzdt.ch.mnr.gov.cn/).
On the basis of the inflow (outflow) Xi, 361 cities across the country were divided into three categories: destination-oriented (D type), tourist-origin-oriented (O type), and destination-oriented and tourist-origin-oriented (D&O type). The average value and standard deviation are the indices used to describe the general level and dispersion of the data, respectively. The standard deviation is the average of the distance from the average of each data. In order to better distinguish the type of urban settlement, the sum of the average and standard deviation was chosen to measure urban tourism flow. Xi is the inflow (output), X ¯ is the average inflow (outflow), and σ is the standard deviation of the inflow (outflow). When Xi > X ¯ + σ, where Xi is the inflow (outflow), the inflow (outflow) is the main factor of urban tourism flow and represents a typical D(O)-type city; if the inflow and outflow of the city meet the above two conditions, the city is classified as D&O type. However, the number of typical cities is limited. According to the net flow to distinguish other remaining cities’ types, if the net flow is greater than 0, the city is an ordinary D-type city; otherwise, it is ordinary O type.

3.2. Analytical Methods

A differential index (R) for tourism flow inflow (outflow) was used to reveal imbalance in flow:
R = i n i - o u t i i n i + o u t i
Ini and outi are the inflow and outflow of city i’s tourism flows. R is [−1, 1]. If R is positive, the city’s tourism flow is net inflow, and the closer it is to 1, the stronger the city’s tourism attraction is. If R is negative, the greater the city flows out of other cities are, the closer it is to −1, and the stronger the city’s tourist power is. If R is close to 0, the capacity for attracting tourism flows and travelling is generally the same.

4. Results

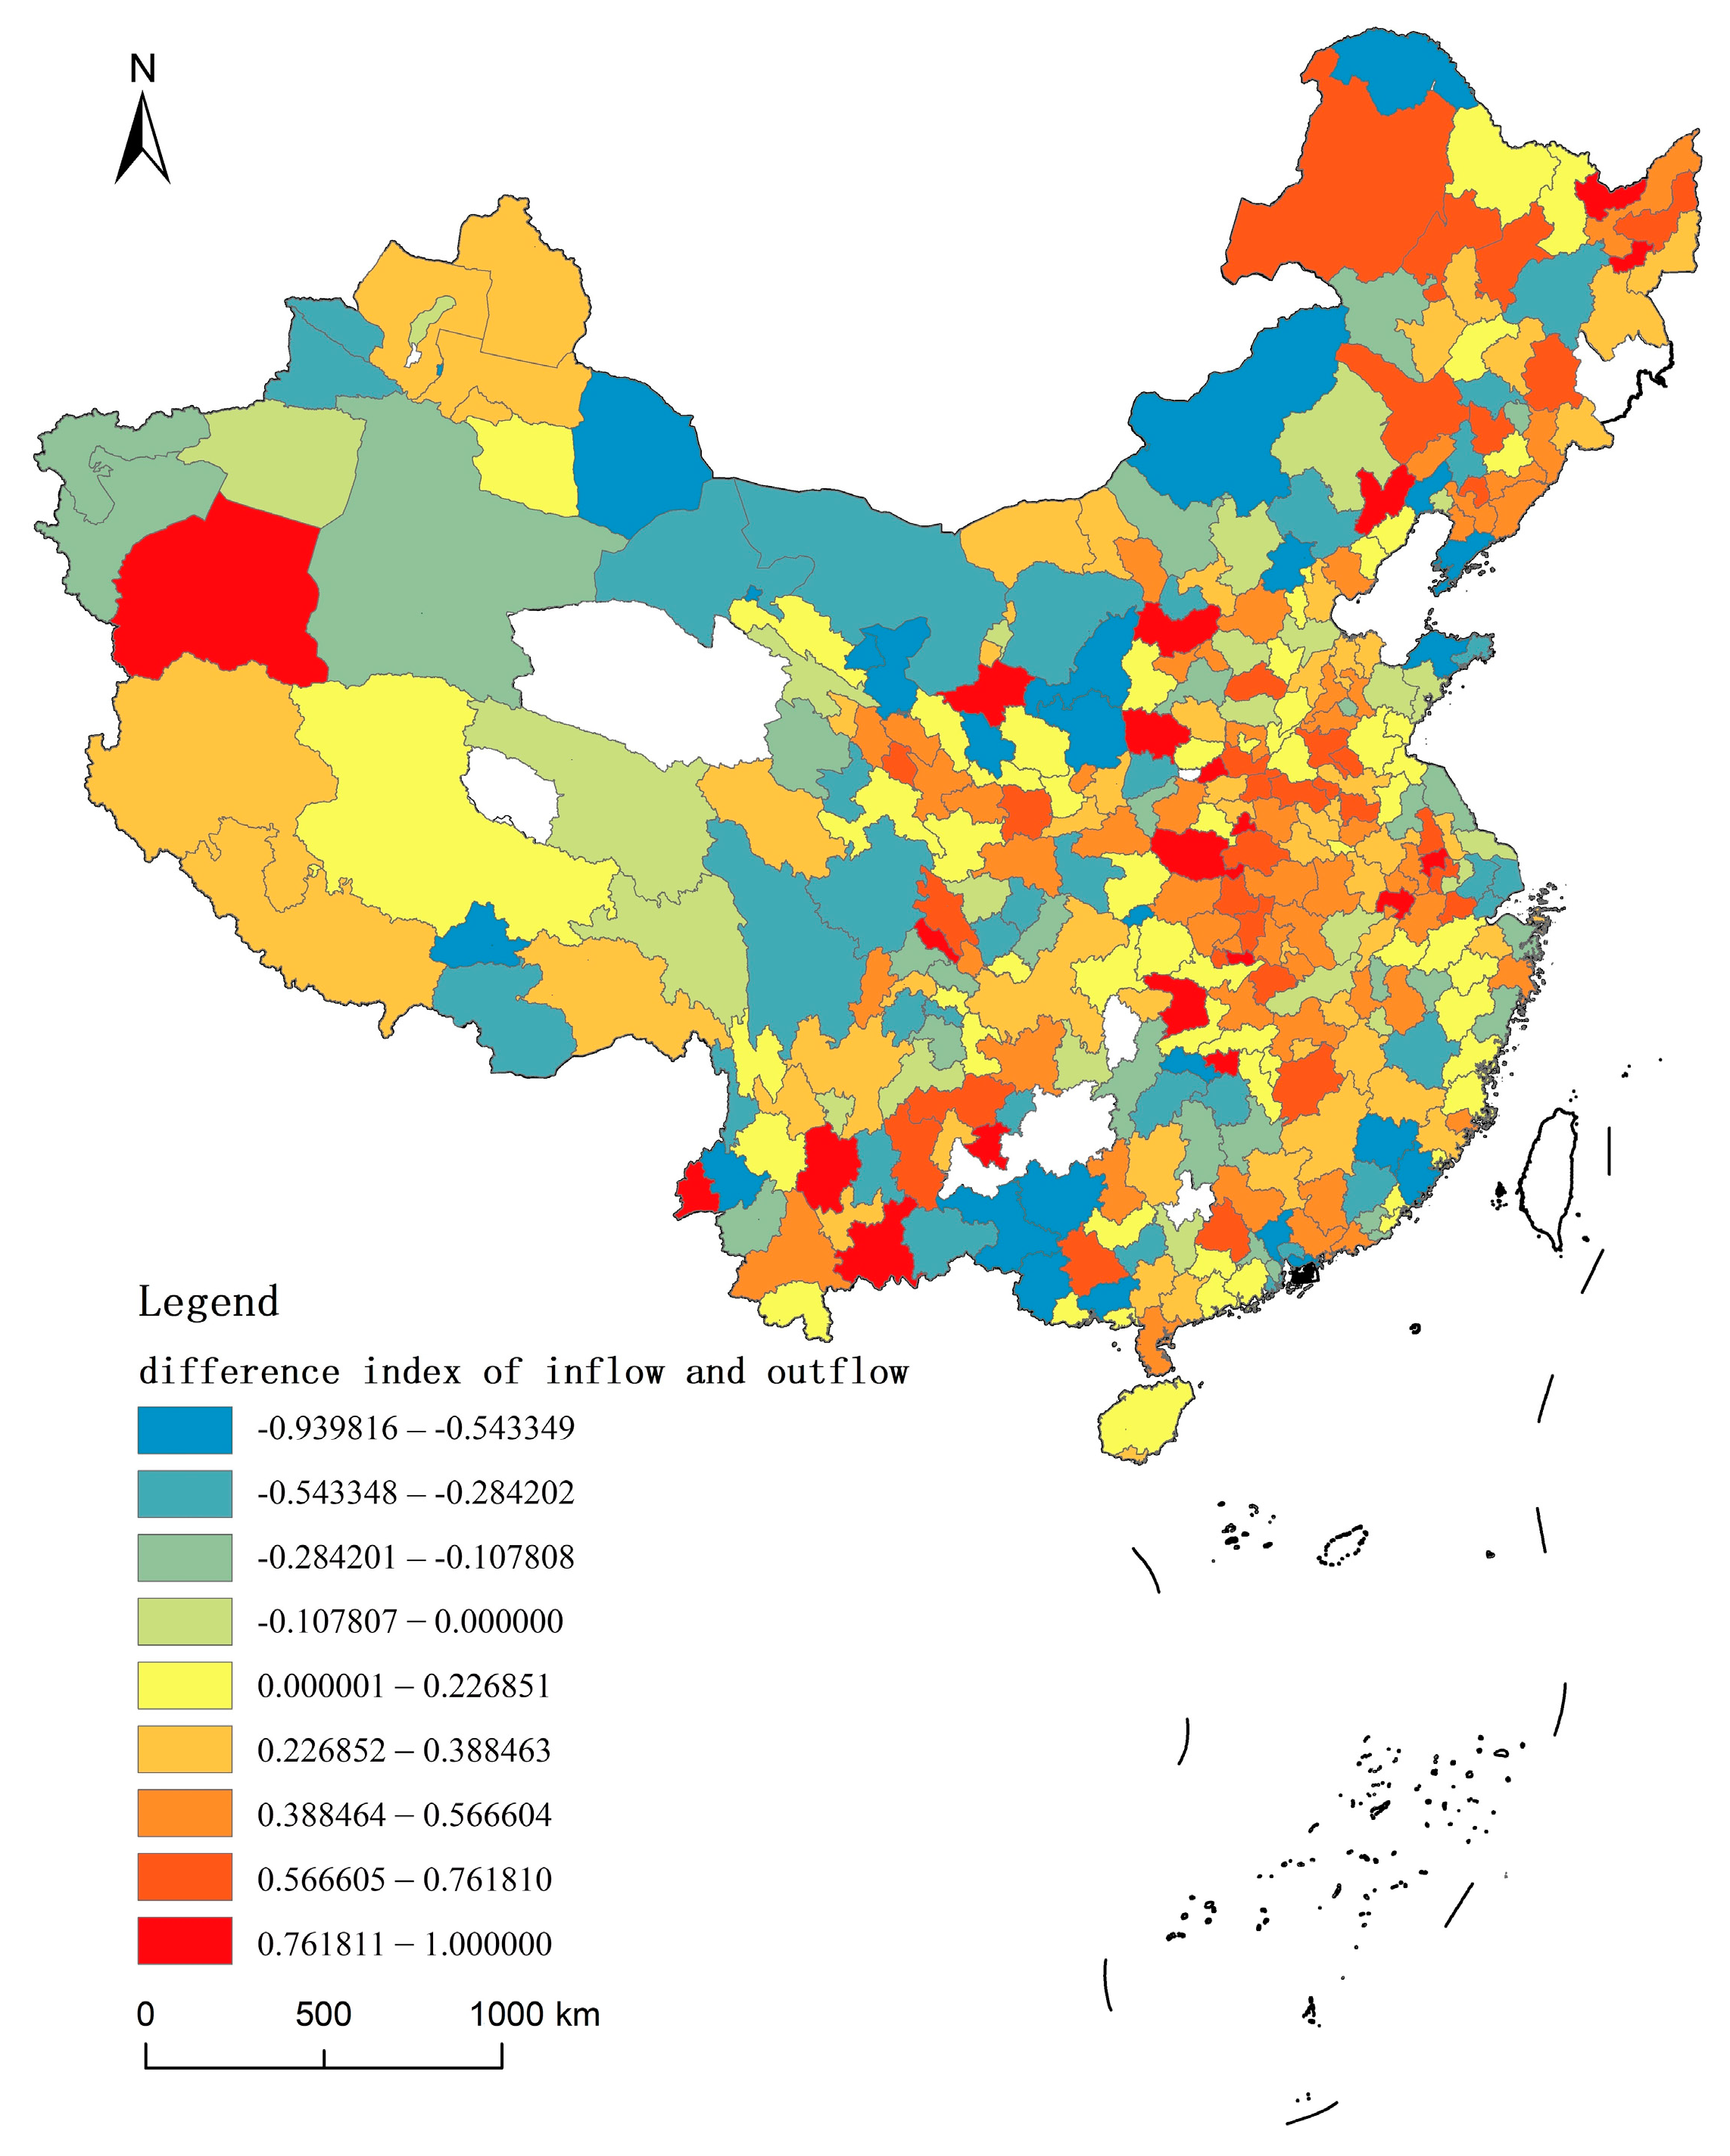
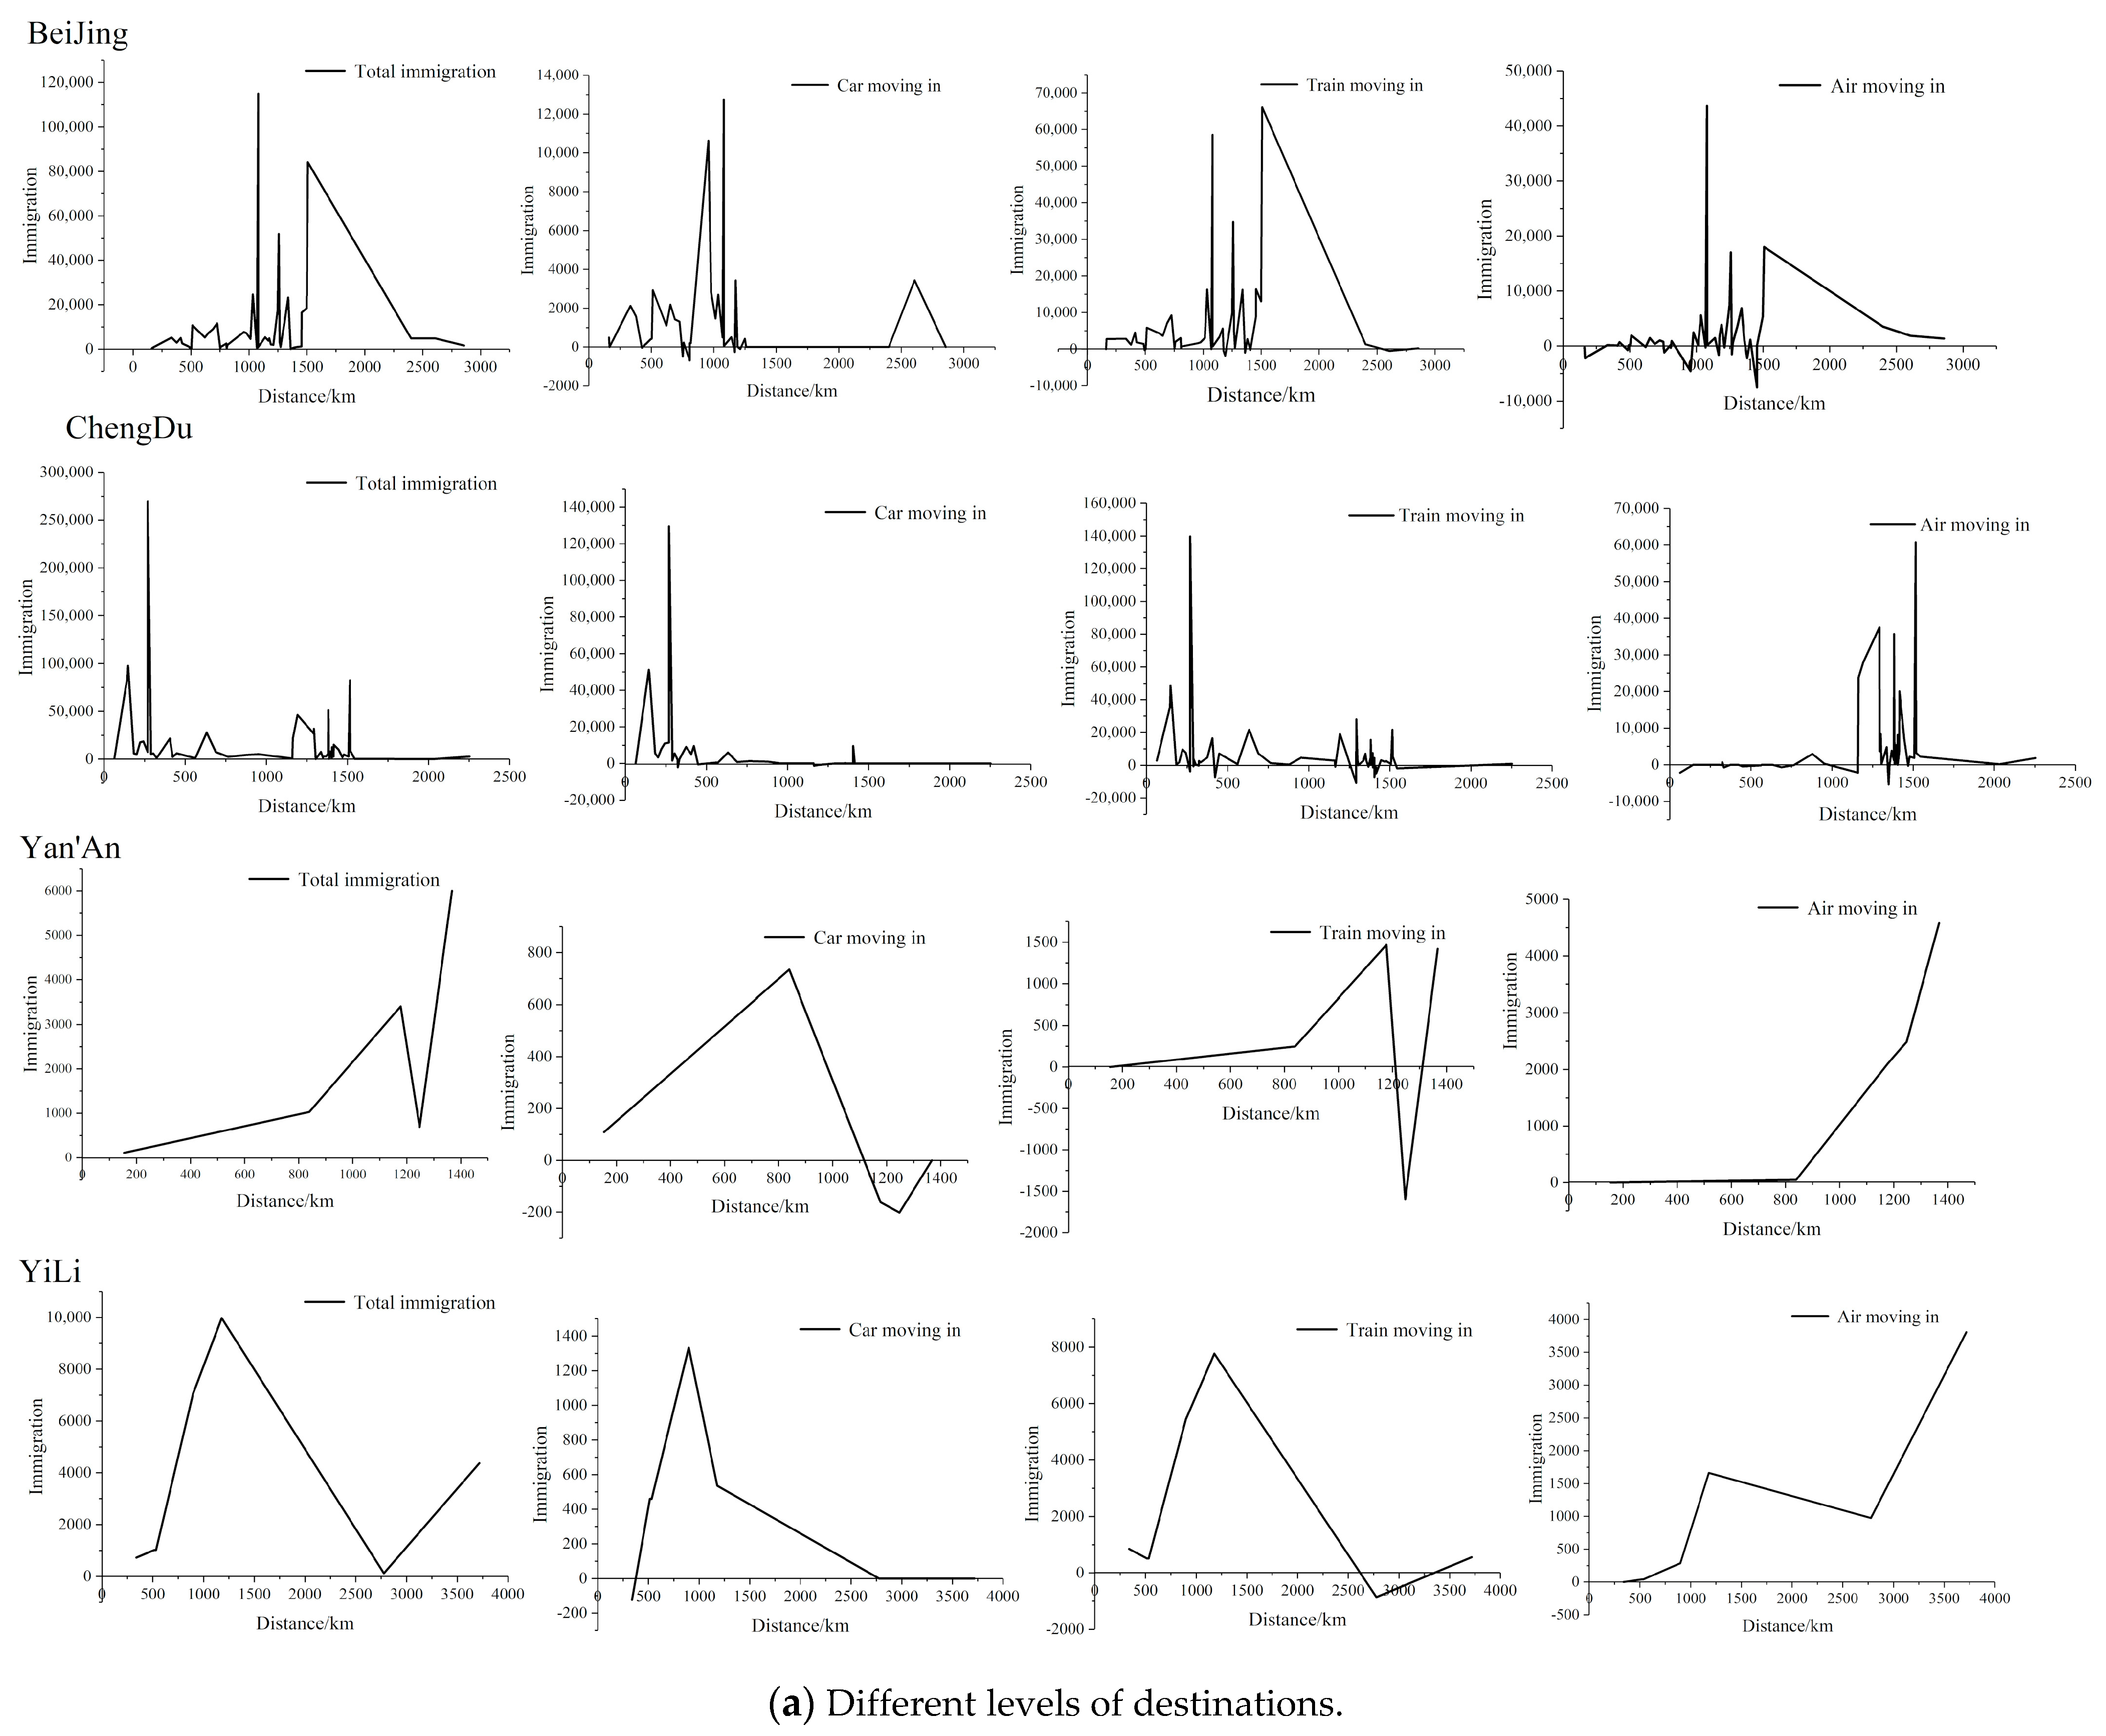
4.1. The Asymmetry of the Flow Potential of Tourist Destinations and Origins

Flow potential refers to the diffusion trends and potential of tourism flows, which are often influenced by many factors, such as resource conditions, tourism behavior preferences, etc., and usually have the characteristics of “tending higher and increasing higher” [13]. The net inflow (outflow) of the city was calculated according to the scale of the inflow (outflow) tourism flow, respectively. The D and O cities identified through the above method were divided into four levels by using the natural break point method to visualize the distribution of tourist destinations and tourist origins (Figure 4).
Of the 361 cities, 13 cities—Beijing, Shanghai, Chengdu, Hangzhou, Chongqing, Wuhan, Zhengzhou, Changsha, Guangzhou, Suzhou, Ningbo, Shenyang, and Shenzhen—are D&O type. Meanwhile, 235 are destination oriented (D type). Nanjing, Nanning, Xi’an, Tianjin, Jinan, Urumqi, Hefei, Xiamen, Mianyang, Sanya, and Qingdao are typical D-type cities. A total of 113 cities are tourist-origin-oriented (O type); among them, Dongguan, Kunming, Chongzuo, Harbin, and Guiyang are more typical. Besides Beijing, Shanghai, Guangzhou, and Shenzhen, the D&O cities also include the provincial capitals and developed cities in the east. These not only have superior transportation locations, but also have unique tourism resources, which attract tourists from all over the country. Besides, the relatively high level of economic development of these cities promotes the mobility of tourism flow and transition to D&O type cities, with functions as tourist destinations and tourist origins. The D-type cities are concentrated in the central and eastern regions, such as Nanjing, Yangzhou, Sanya, and other typical tourist cities. There are no major tourist destinations other than Lanzhou and Urumqi in the western region. Provincial capitals with convenient traffic conditions and general cities with rich tourism resources are also D type. According to the quantity of tourism flow, we can determine the strength of the external attraction of urban tourism resources and the types of destination preferred by tourists on May Day. The distribution of O and D cities varies greatly. Most of them are distributed in the southwest, and a small number are in the northern coastal areas, which is different from the traditional economically developed cities and densely populated areas with strong travel power. This may be attributable to the remote locations of these areas and the amount of tourism flow. In addition, some cities are regional traffic fortresses, such as Chongzuo, which plays a role in tourism flow transit and shows characteristics of a tourist origin.
In order to further analyze the tourism flow quantity, direction, and type in each city, the amount of tourist inflow and outflow in each city was calculated (Figure 5). It can be observed that the difference index for the inflow and outflow of the tourism flow in each city is significant; regional differentiation is obvious, according to the distribution characteristics of the three zones in the eastern, central, and western parts. The cities in the east and west show more outflow, while those in the central region show more inflow. The inflow and outflow of the cities in the central and western regions exhibit larger differences. Some typical tourist cities show more tourist outflow, such as Shanghai, Guangzhou, Shenzhen, Suzhou, Zhuhai, and other cities. There are flow differences in the north–south direction for the central region; the southern cities mainly show net inflow, while the northern cities mainly exhibit outflow. This is slightly different from the population distribution pattern. There are also many cities in the remote western areas, such as Hotan, Chuxiong, and Dehong, that also have large inflow. This indicates that in tourism flow, the population flows to some cities with abundant tourism resources, which breaks the traditional pattern of population distribution. In addition, the urban economies of the eastern coastal areas are developing rapidly, their travel power is strong, and the population agglomeration effect is remarkable, which lead to the outflow of typical tourist cities being larger than the inflow, such as in Beijing, Shanghai, Guangzhou, and Shenzhen.
The differences in distribution of the inflow and outflow in cities with large net inflow are not necessarily large, such as in Xi’an, Taiyuan, and Lanzhou. Although these cities have more inflow, their outflow is relatively large, which has a strong relationship with the geographical locations and traffic locations of these cities. On the contrary, Chongzuo, Jinzhou, and other cities have lower inflow and outflow but have higher inflow relative to outflow, having become typical tourist destination cities. For Beijing, Shanghai, Guangzhou, Shenzhen, and other cities, the inflow and outflow are higher than for other cities, which is closely related to their strong “centrality.” Dalian, Yan’an, Hotan, Linfen, Zhenjiang, and other cities are typical tourist destinations with rich tourism resources. Among the D&O cities—except Beijing, Shanghai, Guangzhou, and Shenzhen—there are no significant differences in flow directions, which indicates that the tourism flow attraction and travel power of these cities are strong.
To further explore the reasons for the disparity between the inflow and outflow in urban tourism, this study looked at several 5A, 4A, and 3A scenic spots assessed before 2018 and the number of three-star-and-above hotels documented on the Ctrip Travel website to characterize the intensity of tourist attraction and tourism reception capacity, and to characterize the city’s travel power according to per capita disposable income in 2018 (Table 1). Since the statistical yearbook data of each province are inconsistent, cities in Liaoning, Jilin, Heilongjiang, Hubei, Hunan, Guizhou, Tibet, Shaanxi, and Yunnan provinces were disregarded. Finally, there were 142 D&O cities, 76 D cities, and eight O cities with complete data, altogether making up more than half of the total cites (of any type). We can observe that D&O cities are different from D and O cities, and the inflow and outflow of D&O cities are large, but there is no significant correlation with tourism attraction, reception capacity, and travel force elements. These cities show long-lasting attraction and contributions to population flow. D-type cities are significantly related to all elements, and the correlation with the number of three-star hotels and above is greater than that with highly rated scenic spots, indicating that the tourist reception capacity of the city is an important factor encouraging tourists to travel. The correlation between the number of 4A-level scenic spots and tourism flow is greater than that between 5A-level scenic spots and tourism flow. It shows that on the basis of the attraction of famous scenic spots, tourists tend to be more attracted to other scenic spots. In addition, there is a significant correlation between the inflow of such cities and their per capita disposable income, indicating that tourists contribute greatly to the economic development of the region. Among the O cities, the per capita disposable income has a significant positive correlation with the outflow, which is lower than the correlation between the number of scenic spots and the number of hotels in the city. This shows that, given the satisfaction of basic living demands, travel tendencies are not related to the expenditure abilities of the tourists; there are other factors affecting the tourists’ travel, such as subjective, emotional influences on their willingness to do so.

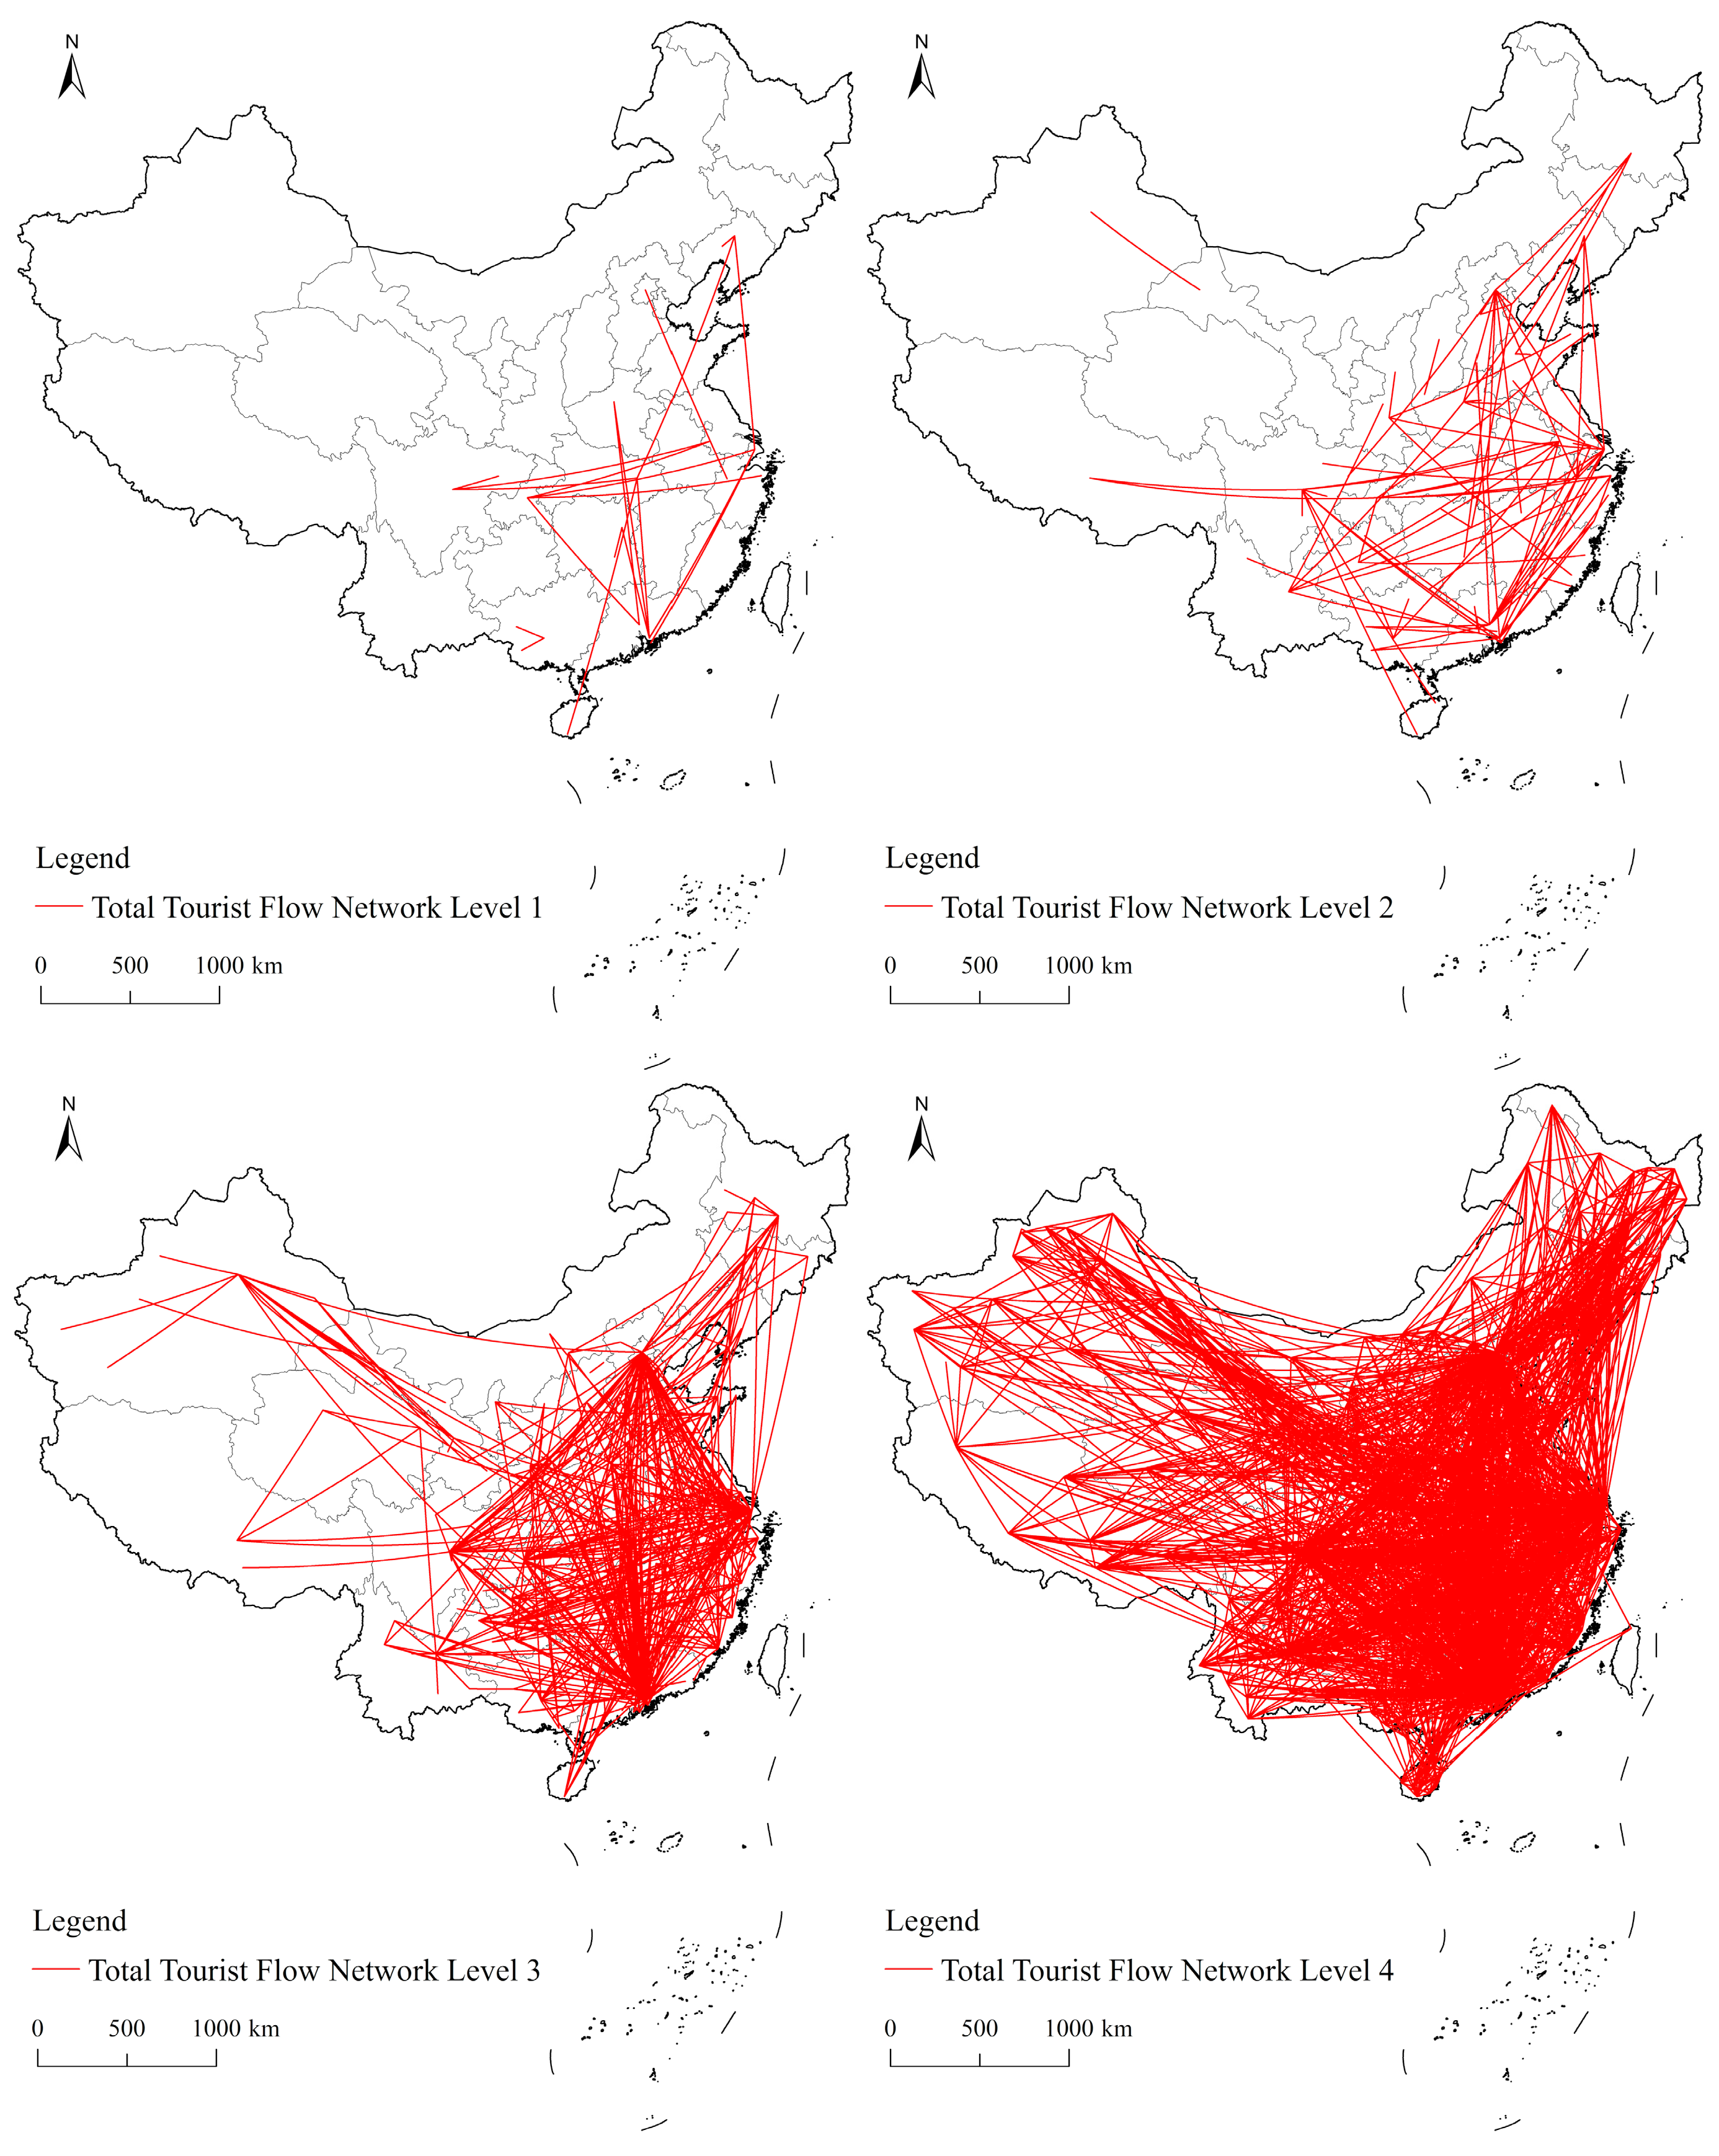
4.2. Complexity of Tourism Flow Networks

According to the natural break point method, the tourism flow network in China was divided into four levels (Figure 6). Beijing, Shanghai, Guangzhou, and Shenzhen are more prominent than other cities in the first-class network, with a large tourism flow and high connection with other cities. Chengdu, Chongqing, Kunming, Zhengzhou, Suzhou, and Wuhan form secondary nodes, which have become the core tourist cities of southwest, north, central, and east China, respectively, and maintain close ties with most cities in the country, but their contact ranges have contracted, and tourism flows have decreased. Xi’an, Hefei, Qingdao, Jinan, and other cities are three-level nodes, and their scope of contact has further narrowed. The higher the network node level, the wider the network range and the lower the network density. With a decrease in network node centrality, the contact range tends to shrink; that is, the tourism circle tends to shrink. The connection between high-level node cities is close, and other cities with weak attraction and inconvenient transportation are distributed in the periphery, forming a “core-edge” structure.

4.3. Differentiation of Tourism Flow Networks

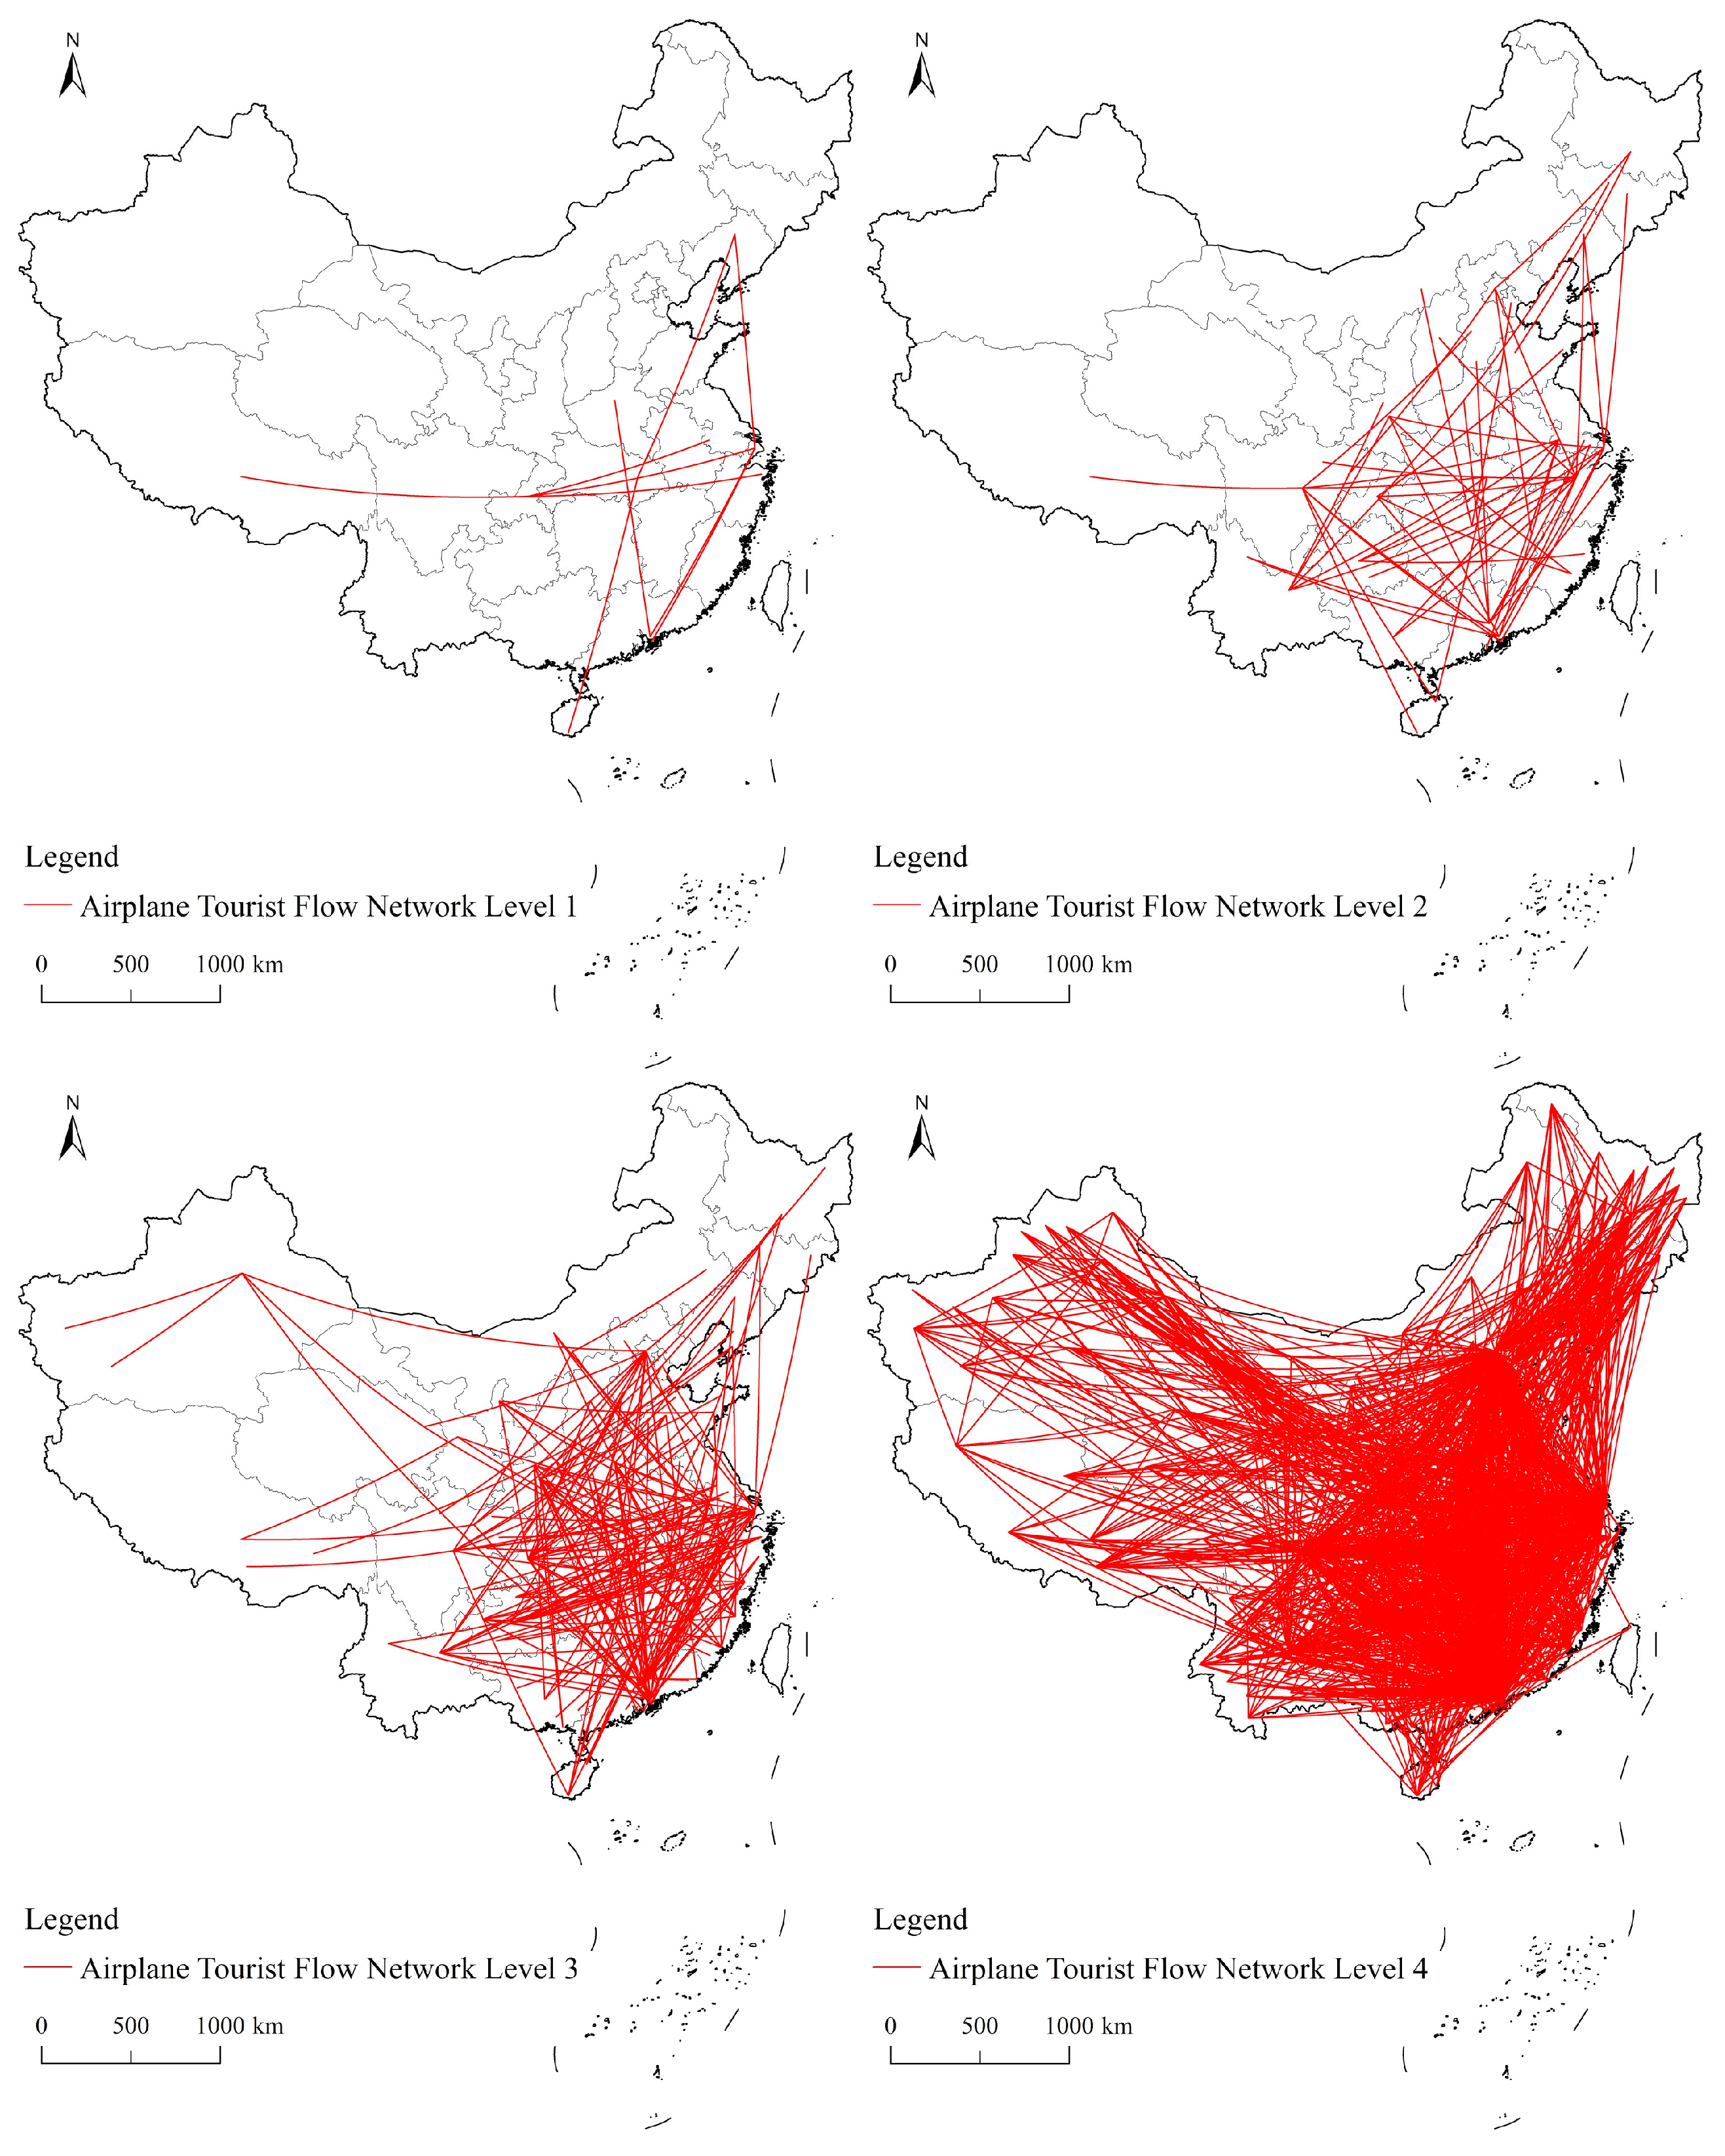
4.3.1. Tourism Flow Network Resulting from Air Transport

In air transportation (Figure 7), the first-class tourism flow mainly occurs between national and regional tourism destination cities: Beijing–Shanghai, Beijing–Wuhan, Shanghai–Guangzhou, Shanghai–Chongqing, Guangzhou–Zhengzhou, Hangzhou–Wuhan, and Hangzhou–Lhasa. Except for Lhasa in the west, the rest are developed, first-tier cities in the east and middle. The network density is very low, but the quantity of tourism flow is very large. From the picture, it resembles a kite flying eastward, and the Shanghai–Lhasa line is like the traction line of a kite. That is to say, in the vast western region, only the world-famous tourist city of Lhasa can participate in the first-class tourist network pattern. In the secondary network (regional-level network), the tourism flow mainly links to the central cities of various regions, such as Beijing, Shanghai, Hangzhou, Suzhou, Guangzhou, Shenzhen, Kunming, Guiyang, Chongqing, Chengdu, Xi’an, Shenyang, and Harbin. The network coverage extends to the northeast, southwest, and northwest, but it is mainly distributed south of the Yangtze River; in particular, the network density and connectivity between the Yangtze River Delta, the Pearl River Delta, and the Chengdu-Chongqing urban area are lager. Kunming, in the southwest, has close ties with the neighboring southwestern, southern, and eastern parts of China. By contrast, Harbin and Xi’an, in the north, only have links to Beijing and Shanghai or have even failed to join a network. That is to say, the large regional urban network is more reflected in the southwest, South China, and East China, or the traditional southern region. The third-level network (local network) continuously extends into the inland area, and many inland provincial capital cities continue to participate and form connections with the node cities in the first- and second-level networks, leading to a more complex and dense network structure. Urumqi, in the northwest, and Shenyang, in the northeast, exhibit center status. In the continuous improvement of the network structure, relatively independent regional small networks (such as northwestern and southwestern city networks) are forming and growing into the main network structure. Kunming has strengthened its links not only with the east, but also with provincial tourism cities such as Lijiang and Xishuangbanna.

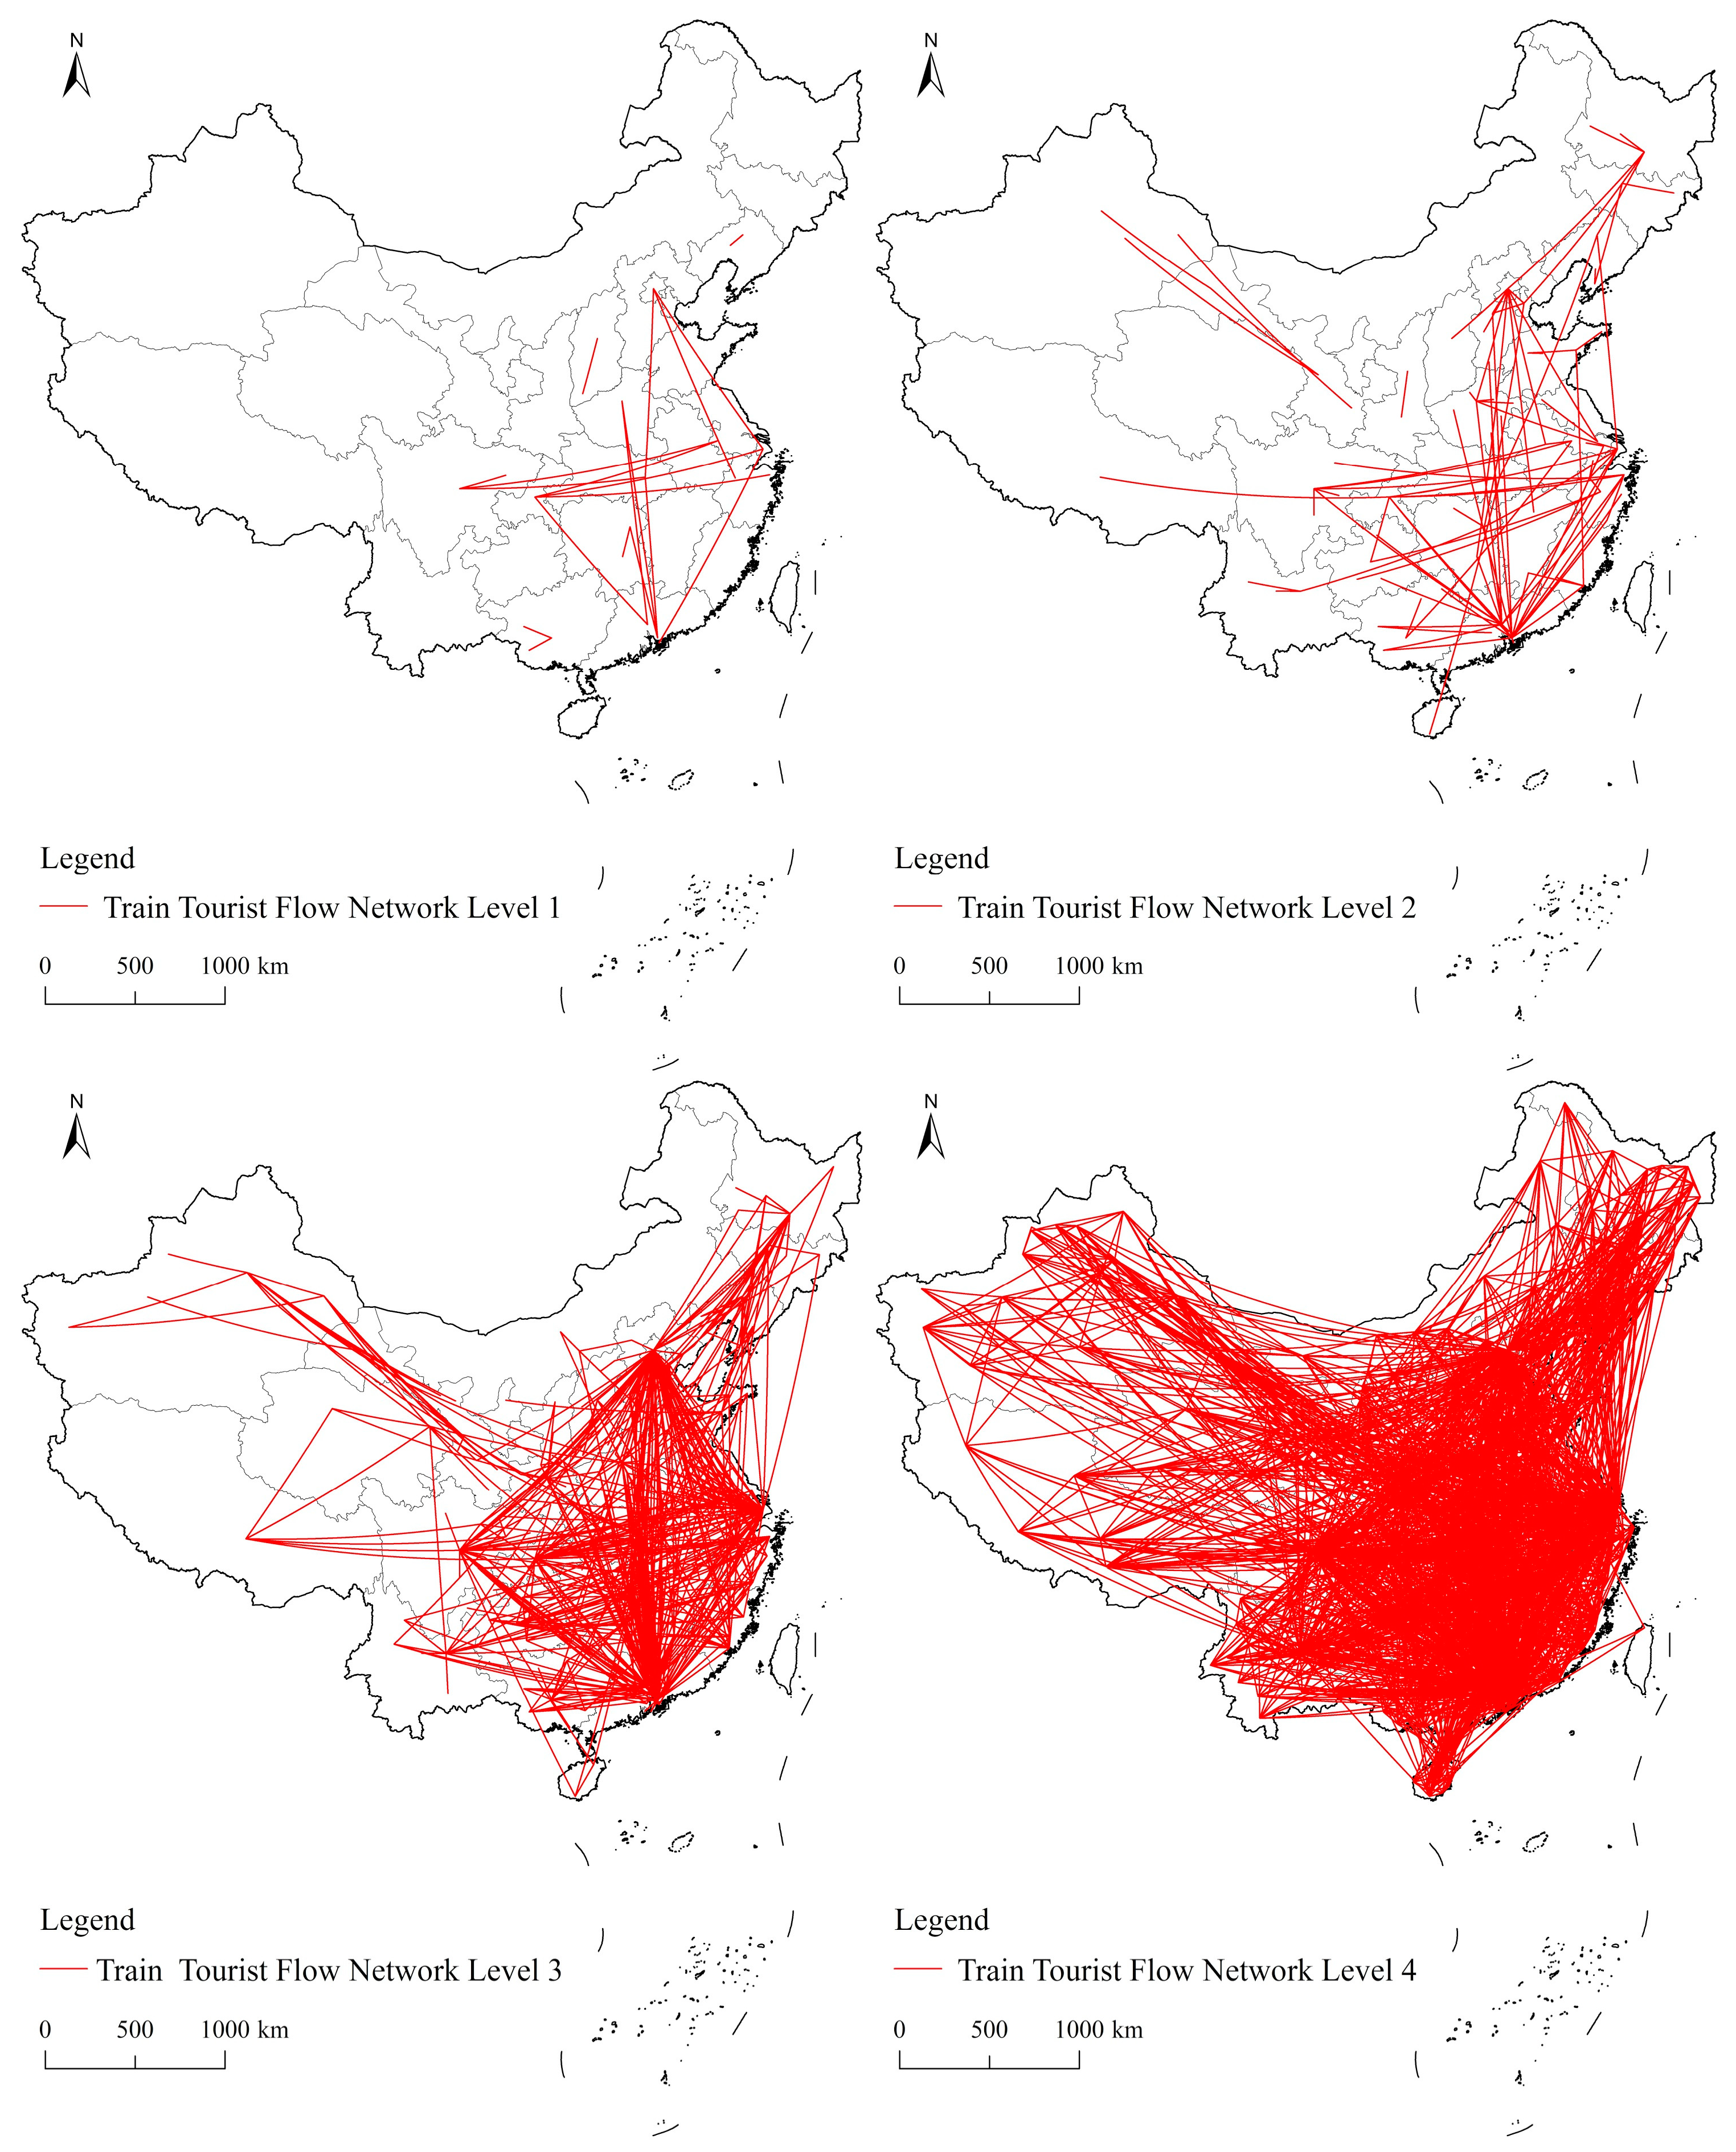
4.3.2. Tourism Flow Network Resulting from Rail Transport

Railways not only play roles as passageways but also play roles as hubs. Cities where high-speed railway stations are located have essentially become the main tourist destinations and sources of tourists. Their traditional transit tourism functions are quietly changing. The cities along the railway line (especially the national “eight vertical and eight horizontal” lines) have not only distributed many tourism flows but have also become important nodes in the tourism flow network pattern.
Similar to the air transport network (Figure 8), the first-level tourism network is mainly constructed from Beijing, Shanghai (Ningbo), Guangzhou (Shenzhen), Chengdu (Chongqing), and Harbin. The most significant change compared with the same-level air travel flow network is that the western Chengdu and Chongqing replace Ihasa, and the northeast Harbin replaces Shenyang, participating together in the first-level network and making it more extensive. The central regions of Wuhan and Zhengzhou have strong centrality, which is clearly related to the pattern of China’s railway network (especially the high-speed railway network) and the status of railway hub. In the secondary train tourism flow network, the core cities in the Yangtze River Delta, Pearl River Delta, Beijing–Tianjin–Hebei, and Chengdu–Chongqing city groups are essentially nodes constructing the tourism flow network, in which the Yangtze River Delta network mainly covers East China; the Pearl River Delta mainly covers South China and Central China; the Chengdu–Chongqing urban agglomeration network mainly radiates into southwest, South China, and East China; and the Beijing–Tianjin–Hebei network mainly connects East and Southern China. These regions form the most stable network structure of tourism flow in China, showing a typical “diamond-shaped” structure. At the same time, owing to the traction of China’s “eight vertical and eight horizontal” high-speed railway network, a relatively simple network is formed in the northeast and northwest of China—supported by the Longhai–Lanxin Line and the Beijing–Kazakhstan Line—that integrates Harbin, Changchun, Shenyang, Urumqi, Lanzhou, and Xi’an into the national tourism network pattern.

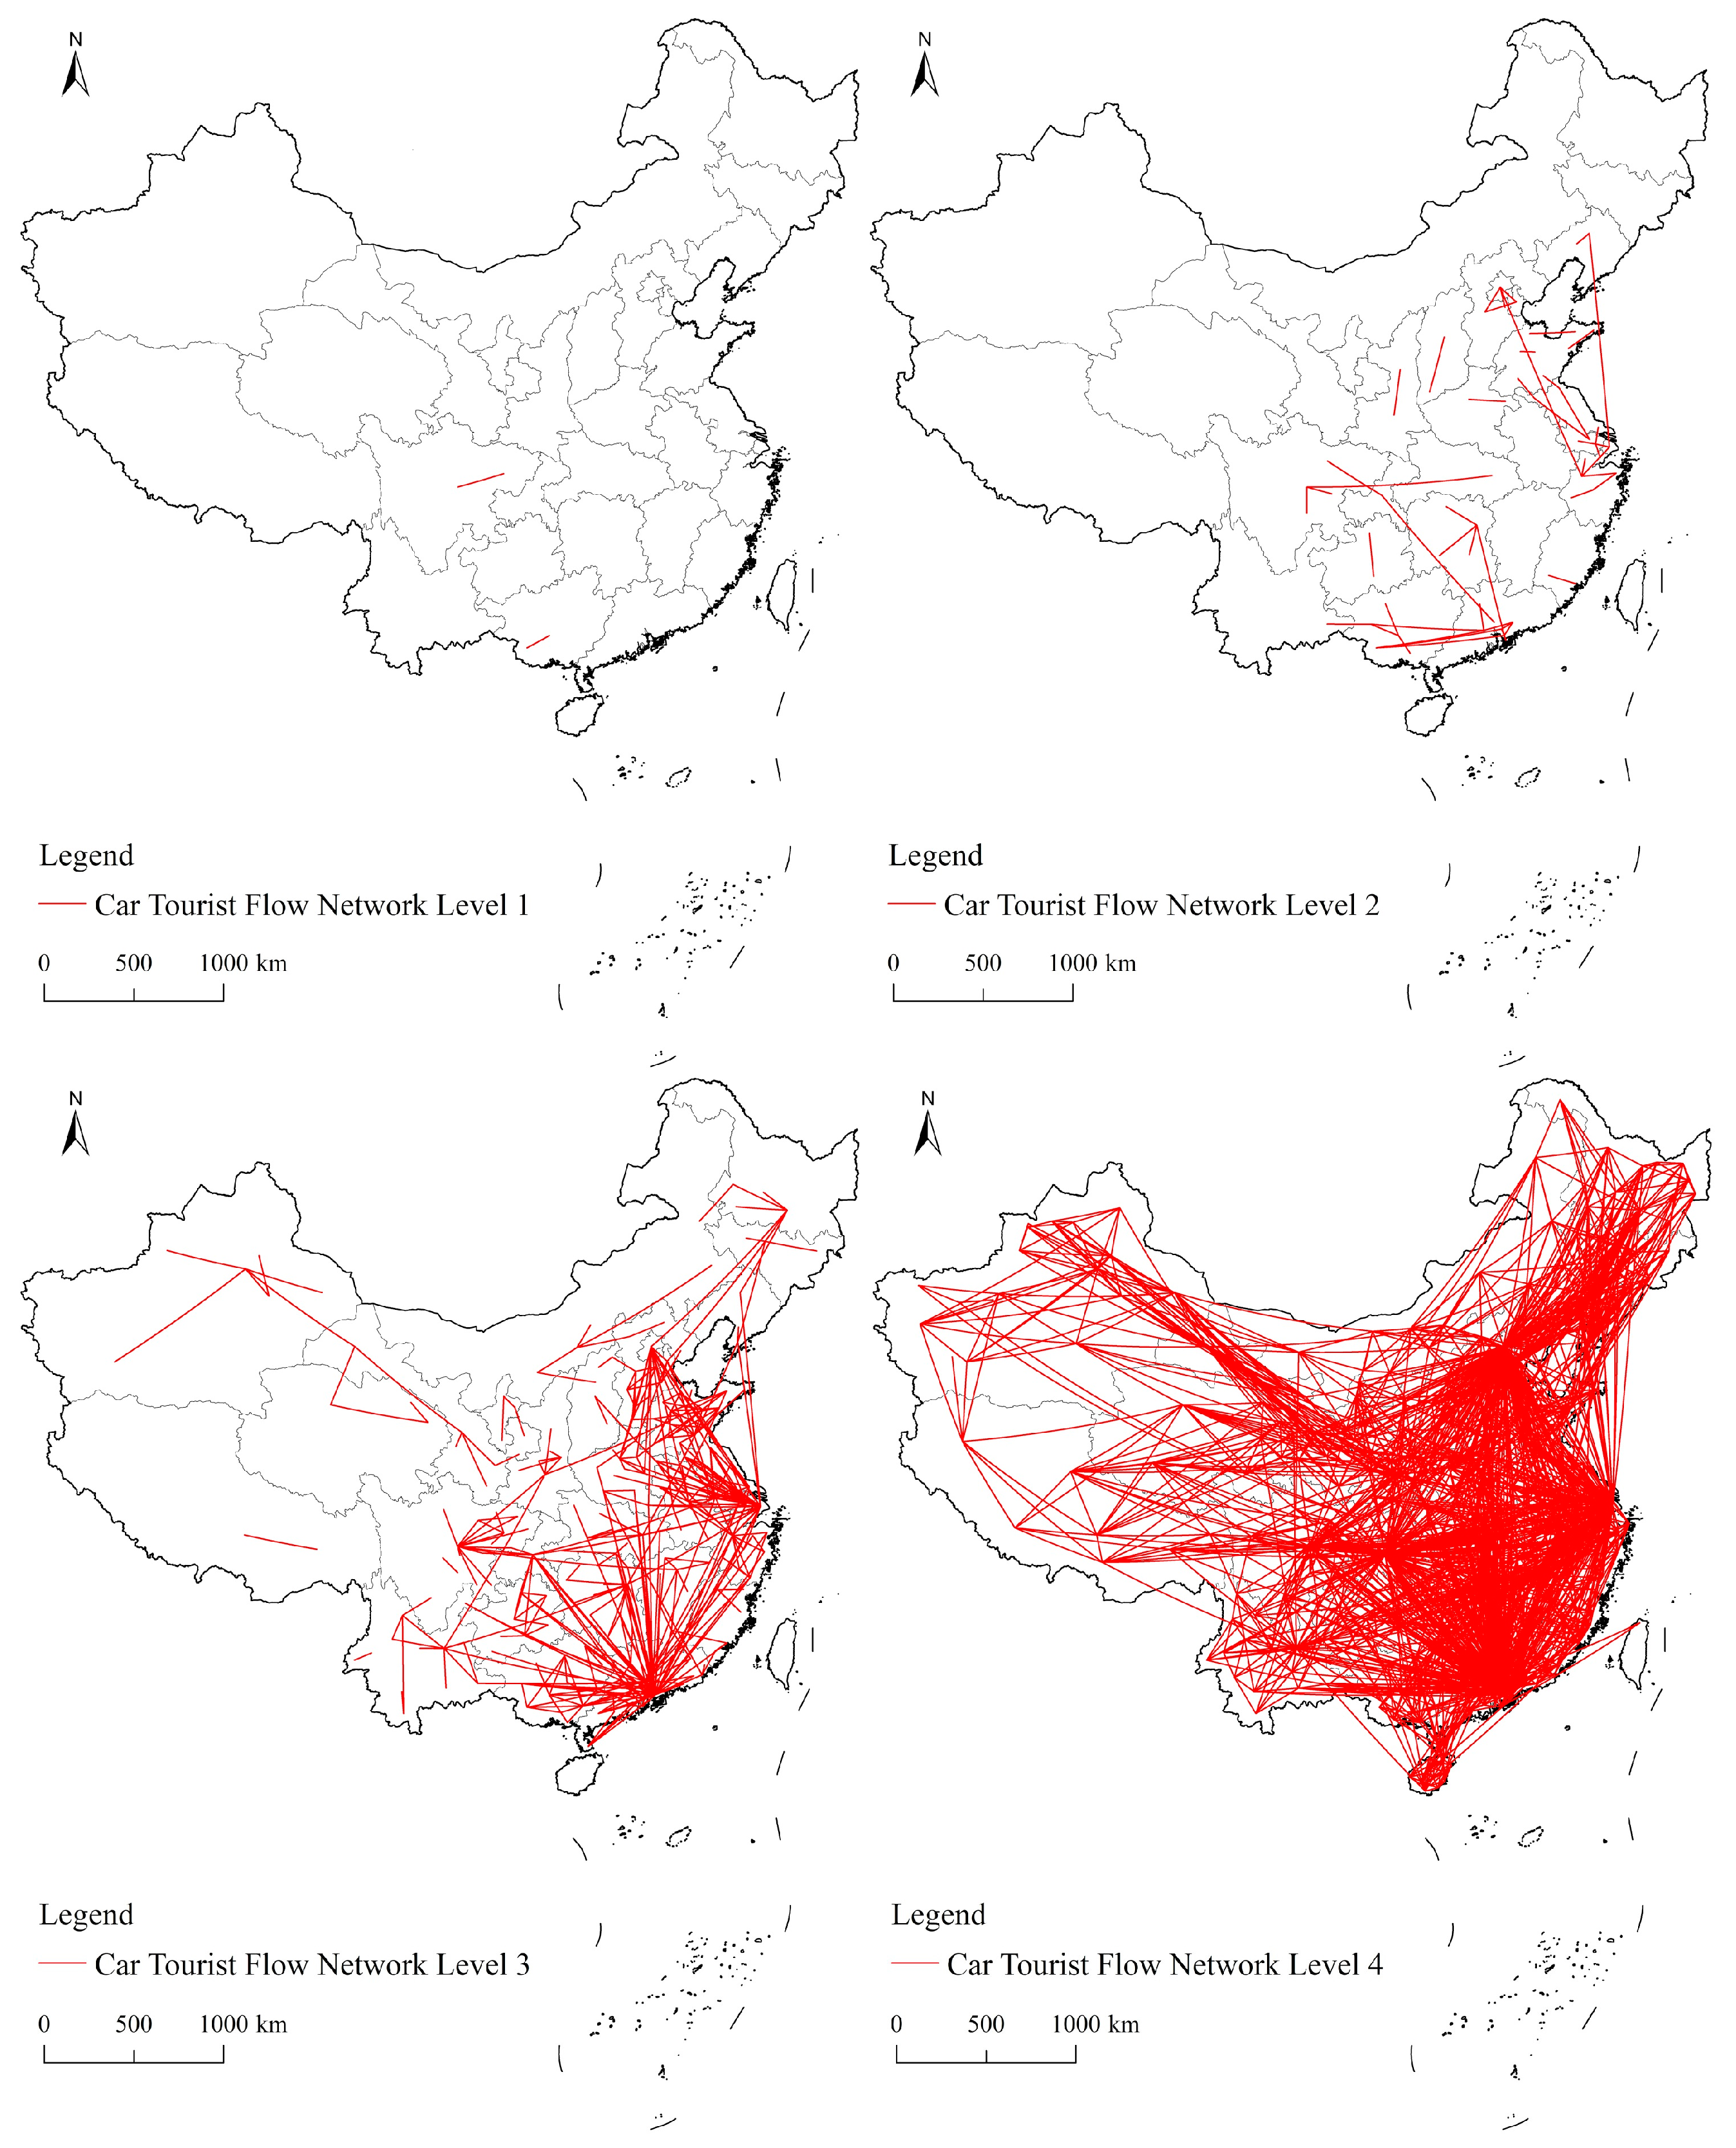
4.3.3. Tourism Flow Network Resulting from Road Transport

The capacity of and practical travel distances for automobiles are limited compared to those of airplanes and trains, and comfort and safety are poor. However, the popularity of private cars, the free policy of highway holidays and the rise of the “family tour” have challenged the traditional tourism model and become the first choice for tourists traveling short distances. Self-driving travel has become the norm.
In contrast to the network pattern of tourism flow caused by air and rail transport, the tourism flow created by automobile transport is more reflected in the local tourist network pattern (Figure 9). If the balance is based on tourism flow, then the primary and secondary networks (which are not actually networked at all) are mainly connected to neighboring cities, such as Chengdu–Chongqing, Nanning–Chongzuo, Xi’an–Yan’an, and Nanning–Guilin. The network structure, density, and range are very simple. Only when the network level is reduced is the real network found, but the connected cities are mainly confined to the inner cities of the province and the neighboring province. The network density has increased rapidly, and the connectivity of major cities in various regions has increased. Some regions show plate development patterns owing to their increased network densities—such as the Beijing–Tianjin–Hebei, Shandong, Henan, Anhui, Jiangsu, Zhejiang, and Shanghai regions. The main southern urban contact network occurs from Xi’an through Yulin to Shanxi, Inner Mongolia, Sichuan, Chongqing, Guizhou, Yunnan, Guangxi, and Guangdong, with high connectivity. The network basically has each province as the basic unit, with strong spatial dependence. It can be seen that the degree of the response of road transportation to distance is stronger than that of air and rail transportation, and the regional nature of the network is the most obvious.
A tourism path is a realistic link between a tourist destination and origin, and it is an important support in studying the spatial structure characteristics of tourism flow. The “time–space convergence” effect and “organization–space synergy” effect produced by traffic characterized by “speed” and “time” are becoming important for reconstructing the regional tourism spatial structure and shaping the regional channel and portal effect.
The spatial distance between a tourist destination and origin is an important factor determining the direction, quantity, and time characteristics. The transportation (aircraft or train) capacity, safety, economy, and related infrastructure configuration all further affect the network structure of tourism flow. Deasy points out that the circle structure of the tourism attraction hinterland originates from distance friction and coincides with the first rule of geography, the distance-decay regularity; that is, with an increase in travel distance and travel consumption (time and energy), the scale of tourism flow exhibits characteristics of distance attenuation [49]. The number of tourist paths, the average flow distance, and the average quantity of the four types of tourism networks were calculated (Table 2); the quantity of tourist paths and the network level form a “pyramid” structure, while the traffic-network level has an “inverted pyramid” structure; the higher the network level, the fewer the cities connected and the wider the connection range, but the greater the tourism flow. In addition to the network of car tourism flow, as the network level decreases, the connected urban pairs tend to increase, but the quantity and range tend to decrease. It means that the high-level network is not restricted by distance attenuation, while the lower-level network distance is more constrained.
Different transportation modes have different route indices and abilities to overcome space friction, which affects the connectivity and economic distances of routes. Traffic location theory states that different modes of transport have different rates of decline in freight. Generally speaking, the order is aviation > high-speed rail > rail > vehicles. This fundamentally affects the appropriate ranges of transportation (or economic distances) for different modes of transport, and difference in economic distance determine the spatial proximity and intensity of various flows, which leads to different urban network strata and hinterlands. The average path length (distance) is an important index for describing the spatial displacement of tourism flow. It is related not only to the traffic mode but also the network level. For aircraft, train, and automobile transportation, the average distances travelled by tourists are 770, 343 and 126 km, respectively, which are highly consistent with the economic distances of the different modes. There are obvious differences in the amounts of migration, which lead to differences in the urban network structure in terms of paths. With air and train transportation, the national and large regional networks are always connected to high-grade cities over a large range, while for automobiles the high-grade networks are mainly inter-city commuter networks. On the whole, aircraft are suitable for long-distance transportation, echoing the national network; trains are suitable for medium- and long-distance transportation, echoing the large and regional networks; and cars are suitable for short-distance transportation, echoing the local network. Based on average speeds (about 1000 km/h for aircraft, 300–350 km/h for high-speed rail, and 60–120 km/h for cars) and economic distances, through national urban networks, core cities can best enjoy fast regional connections by air (or high-speed rail). In local networks, cities may rely on cars (or common rail) to reach other metropolitan areas within 1–3 h. This also coincides with the “three-hour meal, eight-hour hotel” travel habits.
Different modes of transport have different suitable transport ranges; that is, the responses to distance are different. The automobile transport threshold is the lowest, and the response to an increase in distance is the highest, with 200 km as the inflection point. Tourism flow based on automobiles is thus drastically attenuated and overtaken by trains near 500 km, owing to their economy. The sensitivity of trains to distance is weaker, with two inflection points (or peaks)—500 km (ordinary railway) and 1700 km (high-speed railway)—but the attenuation rate after 500 km is much higher than that after 1700 km, indicating that the railways are dominated by medium-distance transportation. The aircraft transport mode has an inflection point at 1200 km followed by decay. It is because of the economic distance differences between different transportation modes that there are obvious differences in tourism flows and ranges (network patterns). In general, aircraft are suitable for long-distance transportation, corresponding to the formation of a national tourism flow network; trains are suitable for medium- and long-distance transportation, forming regional and national tourism networks; and cars are suitable for short-distance transportation, corresponding to the formation of a local tourism flow network. According to the coordinates of longitude and latitude, the distances between different levels of destinations (Beijing, Chengdu, Yan’an, and Yili) and tourist origins (Shanghai, Xi’an, Kunming, and Gannan) were plotted by using ArcGIS (Figure 10). It can be observed that the total amount of tourism flow peaks at about 1000 km, followed by a rapid decline. When the distance is greater than 1500 km or lower than 500 km, the flow is generally less, indicating that tourists have a greater desire to travel across provinces. Tourism flow has a strong path dependence on tourism channels, and the shorter the distance, the stronger the dependence on automobile transportation. The longer the distance, the more inclined tourists are to choose aircraft and railways, but in the presence of high-speed rail (especially direct high-speed rail), tourists tend to choose railways over aircraft. The functional relationship between national tourism node cities can overcome the influence of distance attenuation, but with a downward shift in the network node level, distance-induced attenuation is strengthened. For example, 63.82% and 36.18% of the Baoding–Beijing tourism flow is via train and car, with none by aviation, 96.04% of the Wuhan–Beijing tourism flow is by train, and 74.23% of the Urumqi–Beijing tourism flow is by aircraft. In the national tourism network, tourism flow is not exactly consistent with the “law of distance attenuation” but exists in a fluctuating state. When the travel force (or attraction) of the strong cities increases, tourism flow also increases; these cities—such as Changsha, Shenzhen, Guangzhou, Wuhan, Xi’an, and Zhengzhou—are also important nodes in the tourism flow network. The emergence of high-speed rail has broken the monopoly of long-distance transportation by air and affected the differentiation of urban networks. The national and large regional networks formed by a reliance on air transportation are being impacted by the high-speed rail network; that is, reliance on the high-speed railway network is able to construct regional and even national urban networks. For road transport with relatively weak time sensitivity, it is difficult to scale it up to large regional networks.

5. Discussion

Tourism flow is a hot topic of study that is a difficult concept to examine. This study used Tencent migration big data and skillfully extracted tourism flow “relational data,” identified tourist destinations and sources, and systematically studied the tourism network’s structure and path dependence. The research scope of previous studies has been small (at the city [50,51] or provincial [52] levels), primarily obtaining results through social network analysis to determine the core-edge structures of small-scale, low-density tourist flow networks and hierarchical structures. Furthermore, the sample sizes of these studies are limited. Scholars have begun to harness the mining of tourism big data, but with limited research scope. Using Tencent migration big data, this study addressed the problems of the limited tourist flow data available for national, large-scale tourist flow network research. Researchers often choose a typical destination as the research area, which has limited applicability for distinguishing the destinations and sources of tourists on a large regional scale. Moreover, the research areas selected in previous studies have not been uniform [53], and there are defects in the classification of city types. A cross study on modes of transport involved a study area concentrated around typical rapid transit lines, finding the modes of transport to be more important near scenic spots in the core of the network [54]. Research into the tourism economy and influencing factors found economic and transportation development to be uncoordinated [55,56]. Our comprehensive study analyzing plane, train, and car travel found clear differences in the transport networks that have formed based on the three modes of transport, with a specific relationship between the traffic flow distance and network structure being found.
However, there are some shortcomings in our study. Tourists are responsible for the main bulk of tourism flow, but the flow of information and capital was not extracted and analyzed, so the tourism network was not elucidated from the perspective of the flow of all elements. Tencent migration big data only record the beginning and end of tourism flow and the direction; they cannot reflect the whole process of tourism. In fact, sightseeing visitors engage in not only “one-stop” tourism but also “relay tourism” in many cases; however, there remains no effective way to address this based on the current large number of conditions.
This paper defines the destination and source based on the net moving-in (moving-out) quantity, and finds asymmetry in their quantity, directions, and spatial patterns. However, there are still some issues in this regard, especially for both source and destination cities. In reality, some cities have a large inflow and outflow, playing a “dual function” role, while others have very little immigration (emigration), making them neither typical destinations nor typical sources. Simply considering a net moving-in (moving-out) measure would screen out some substantive destinations and include some cities with little relevance to tourism, affecting the characteristics and scope of the network structure. Therefore, in a follow-up study, in addition to the definition of the destination and source locations by simple division, we should fully consider the total numbers moving-in (moving-out) and the relationship between the two, constructing multivariate division criteria, in order to analyze the real destination and source locations.
Aircraft, trains, and cars are realistic paths for tourism flow in terms of spatial movement. This avoided several defects present in traditional research, examined the influence of different paths on the tourism network, and determined the suitable travel distances of different paths. However, spatial distance is not a simple variable but a compound variable, especially the comprehensive tourism distance and range derived from the combination of different modes of transportation; how the quantity and direction of tourism flow are subtly affected by transportation warrants further exploration. What kind of interaction mechanism exists between China’s integrated network and tourism flow network? Against the background of the rapid development of China’s high-speed rail, how might the timeliness and safety characteristics of high-speed rail be fully considered and guide the spatial movement in tourism flow? With the popularity of private cars in China and the increasing manifestation of the “family” form of tourism, what kinds of choices and responses will tourists exhibit in their path selection? These questions require in-depth thematic studies to answer.
It should be pointed out that the source market is divided into the basic market, the expansion of the market, and the opportunity market based on the distance between the destination and the source. This may have defects in traditional tourism planning. Research shows that tourism flow does not simply conform to the “law of distance attenuation” under different path conditions and tourist statuses, and some cities are not constrained by distance attenuation because of their very important tourist status. Therefore, we cannot simply draw a “tourism circle” according to the proximity of the region. In addition to examining the tourist index, we must take into account the actual travel path. It was found that the typical tourist cities in China are concentrated in the eastern region, the flow of tourist cities in the western region is small, and local tourists tend to gather in other tourist cities, but cities’ external attraction is low, which leads to the situation of a “strong east and weak west.” Therefore, how to promote the spatial balance between the destination and the source, prevent the “siphon effect” in the western region, and accelerate the development of tourism in the western region is also a major practical problem that needs to be carefully studied.
This study has the following defects. Firstly, the data source used is actually population flow data, and the representation of tourism flow is relatively rough, with some non-tourism population flows intermingled. Secondly, the method of city-type division needs to be further refined to make it more accurate. In future work, on the one hand, we should continue to look for better tourism flow data to avoid the defects of the data in this paper; on the other hand, we should develop mathematical methods to build a model for division according to city type in an appropriate manner. It is also hoped that scientific methods can be used to enhance the scientific contributions of the article.

6. Conclusions

This study used “Tencent migration” big data; extracted China’s May Day tourism flow population; and subdivided it into the plane, train, and automobile flows. It constructed a 361 × 361 tourism flow symmetrical matrix and systematically analyzed the tourism flow network structure and path dependence characteristics on May Day in China.
The main findings are as follows. Firstly, the flow potentials of destination and tourist origins are asymmetrical. Of the 361 cities, 13 are D&O cities, 235 are D-type cities, and 113 are O-type cities. Most of the D&O cities are provincial capitals, important tourist cities and megacities with high comprehensive strength, such as Beijing, Shanghai, Guangzhou, and Shenzhen. The typical tourist destination type (D-type) cities are mostly distributed on the east side of Hu Line, especially in the Beijing–Tianjin–Hebei, Yangtze River Delta, and Pearl River Delta regions. Other cities have become main tourist O cities, concentrated in the southwest, with a few scattered in the northeast. In the eastern, middle, and western regions, the difference between the urban tourist inflow and outflow is significant. In the middle region, the difference between the inflow and outflow is large; the tourism flow is mostly net inflow. In the west and east, meanwhile, the difference between the urban inflow and outflow is larger than that in the east, and its flow is mainly net outflow. The flow difference indices for D-type and O-type cities are larger, while those for D&O-type cities are smaller. There is no correlation between the D&O city tourism flow and the number of highly rated scenic spots and hotels, and per capita disposable income. The inflow of D cities and outflow of O cities are significantly related to the three elements. This shows that tourism flow promotes regional economic development and that economic conditions are not the key determinants of whether tourists travel.
Secondly, the tourism flow network is complex. The higher the attraction of tourism flow, the higher the tourist network level and the wider the network scope. With a decrease in city tourism flow, the contact range tends to shrink; that is, the tourism circle tends to shrink. High-grade node cities are closely connected with one another, while the periphery is populated with less attractive and inconvenient node cities, forming a “core-edge” structure.
Thirdly, differentiation in the flow paths is observed. Different tourism flow nodes and different network patterns are formed by the different types of traffic. The quantity of tourist paths and the network level form a “pyramid” structure, while the traffic-network level exhibits an “inverted pyramid” structure; that is, the higher the network level, the fewer the cities connected and the wider the connection range, but the greater the tourism flow. In addition to the network of car tourism flow, with a decrease in network level, the connected urban pairs tend to increase, but the quantity and range tend to decrease. The responses of different vehicles to distance are the main factor affecting the network patterns of different paths; 200, 1000, and 1500 km are the suitable travel distances for automobiles, trains, and aircraft, respectively. The accessibility of the car tourism flow network is the lowest, and the total tourism flow network is roughly equal to the train network in this regard.

Author Contributions

Conceptualization, L.W.; methodology, S.W.; software, S.W.; validation, S.W.; formal analysis, S.W.; investigation, S.W.; resources, H.L.; data curation, S.W.; writing—original draft preparation, S.W.; writing—review and editing, L.W.; visualization, S.W.; supervision, L.W.; project administration, L.W.; funding acquisition, L.W. All authors have read and agreed to the published version of the manuscript.

Funding

This research was funded by graduate research project of Northwest Normal University in 2020.

Institutional Review Board Statement

Not applicable.

Informed Consent Statement

Not applicable.

Data Availability Statement

The data presented in this study are available on request from the corresponding author. The data are not publicly available due to privacy.

Conflicts of Interest

The authors declare no conflict of interest.

References

  1. Yang, Y. The effect of social interaction and tourism scenario on tourism demand: Empirical research based on spring festival golden week. Tour. Trib. 2016, 31, 56–69. [Google Scholar]
  2. Jun, Y. Rational regression of golden weeks tourism. Tour. Sci. 2005, 19, 48–51. [Google Scholar]
  3. Li, Y. A study summary on the problems existing in dolden week holiday tourism and countermeasures. Tour. Trib. 2006, 21, 12–18. [Google Scholar]
  4. Wen, J.; Kozak, M.; Yang, S.; Liu, F. COVID-19: Potential effects on Chinese citizens’ lifestyle and travel. Tour. Rev. 2020. [Google Scholar] [CrossRef]
  5. Fyall, A.; Garrod, B. Destination management: A perspective article. Tour. Rev. 2019, 75, 165–169. [Google Scholar] [CrossRef]
  6. Sheng, W. From “tourist gaze” to “tourist gaze”: Cultural logic of “golden week”. CHN Book Rev. 2018, 4, 27–34. [Google Scholar]
  7. Qin, Y.; Gu, H.; Li, B.; Fan, D. The Chinese hospitality industry: A perspective article. Tour. Rev. 2019, 75, 117–121. [Google Scholar] [CrossRef]
  8. Sánchez-Fernández, M.D.; Álvarez-Bassi, D.; Ramón-Cardona, J. Management of tourist destinations: The expectations of guests on eWOM generation in Maldonado (Uruguay). Sustainability 2020, 12, 6825. [Google Scholar] [CrossRef]
  9. Pulido-Fernández, J.I.; Casado-Montilla, J.; Carrillo-Hidalgo, I. Understanding the behaviour of olive oil tourists: A cluster analysis in Southern Spain. Sustainability 2020, 12, 6863. [Google Scholar] [CrossRef]
  10. Zhang, H.; Gordon, S.; Buhalis, D.; Ding, X. Experience value cocreation on destination online platforms. J. Travel Res. 2018, 57, 1093–1107. [Google Scholar] [CrossRef]
  11. Wu, H.; Lv, X.; Cavusoglu, M.; Cobanoglu, C. Chinese cruise customers loyalty: The impact of customer participation and service personal values. Tour. Rev. 2020. [Google Scholar] [CrossRef]
  12. Shen, K.; Shen, H. Chinese traditional village residents’ behavioural intention to support tourism: An extended model of the theory of planned behaviour. Tour. Rev. 2020. [Google Scholar] [CrossRef]
  13. Chen, H. Conceptual definition of tourism flow and new discussion on the theoretic connotation. Tour. Res. 2017, 9, 22–31. [Google Scholar]
  14. Lee, S.H.; Choi, J.Y.; Yoo, S.H.; Oh, Y.G. Evaluating spatial centrality for integrated tourism management in rural areas using GIS and network analysis. Tour. Manag. 2013, 34, 14–24. [Google Scholar] [CrossRef]
  15. Fafchamps, M.; Goyal, S.; Van der Leij, M. Matching and network effects. J. Eur. Econ. Assoc. 2010, 8, 203–231. [Google Scholar] [CrossRef]
  16. Baggio, R. The science of complexity in the tourism domain: A perspective article. Tour. Rev. 2019, 75, 16–19. [Google Scholar] [CrossRef]
  17. Ayazlar, R.A. Flow phenomenon as a tourist experience in paragliding: A qualitative research. Procedia Econ. Financ. 2015, 26, 792–799. [Google Scholar] [CrossRef] [Green Version]
  18. Yin, P.; Lin, Z.; Prideaux, B. The impact of high-speed railway on tourism spatial structures between two adjoining metropolitan cities in China: Beijing and Tianjin. J. Trans. Geogr. 2019, 80, 102495. [Google Scholar] [CrossRef]
  19. Alderighi, M.; Gaggero, A.A. Flight availability and international tourism flows. Ann. Tour. Res. 2019, 79. [Google Scholar] [CrossRef]
  20. Mou, N.; Yuan, R.; Yang, T.; Zhang, H.; Tang, J.; Makkonen, T. Exploring spatio-temporal changes of city inbound tourism flow: The case of Shanghai, China. Tour. Manag. 2020, 76, 103955. [Google Scholar] [CrossRef]
  21. Jin, C.; Xu, J.; Huang, Z. Spatiotemporal analysis of regional tourism development: A semiparametric geographically weighted regression model approach. Habitat Int. 2019, 87, 1–10. [Google Scholar] [CrossRef]
  22. Wang, D.; Niu, Y.; Qian, J. Evolution and optimization of China’s urban tourism spatial structure: A high speed rail perspective. Tour. Manag. 2018, 64, 218–232. [Google Scholar] [CrossRef]
  23. Zhong, S.; Jie, Z.; Xiang, L. A reformulated directional bias of tourism flow. Tour. Geogr. 2011, 13, 129–147. [Google Scholar] [CrossRef]
  24. Liu, P.; Zhang, H.; Zhang, J.; Sun, Y.; Qiu, M. Spatial-temporal response patterns of tourism flow under impulse pre-trip information search: From online to arrival. Tour. Manag. 2019, 73, 105–114. [Google Scholar] [CrossRef]
  25. Li, Y.; Zhou, B.; Wang, L.; Cheng, S. Effect of tourist flow on province-scale food resource spatial allocation in China. J. Clean. Prod. 2019, 239, 117931. [Google Scholar] [CrossRef]
  26. Yang, Y.; Zhang, H. Spatial-temporal forecasting of tourism demand. Ann. Tour. Res. 2019, 75, 106–119. [Google Scholar] [CrossRef]
  27. Song, H.; Qiu, R.T.Q.; Park, J. A review of research on tourism demand forecasting: Launching the annals of tourism research curated collection on tourism demand forecasting. Ann. Tour. Res. 2019, 75, 338–362. [Google Scholar] [CrossRef]
  28. Yao, M.; Chen, Y.; Zhou, Z. The evolution of structural features and gravity enter for China-ASEAN tourism flow network. Eco. Geogr. 2018, 38, 181–189. [Google Scholar]
  29. Scott, N.; Cooper, C.; Baggio, R. Destination networks: Four Australian cases. Ann. Tour. Res. 2008, 35, 169–188. [Google Scholar] [CrossRef]
  30. Chua, A.; Servillo, L.; Marcheggiani, E.; Moere, A.V. Mapping cilento:using geotagged social media data to characterize tourism flows in southern Italy. Tour. Manag. 2016, 57, 295–310. [Google Scholar] [CrossRef]
  31. Buhalis, D.; Harwood, T.; Bogicevic, V.; Viglia, G.; Beldona, S.; Hofacker, C. Technological disruptions in services: Lessons from tourism and hospitality. J. Serv. Manag. 2019, 30, 484–506. [Google Scholar] [CrossRef]
  32. Buhalis, D. Technology in tourism-from information communication technologies to eTourism and smart tourism towards ambient intelligence tourism: A perspective article. Tour. Rev. 2019, 75, 267–272. [Google Scholar] [CrossRef]
  33. Brás, J.M.; Costa, C.; Buhalis, D. Network analysis and wine routes: The case of the Bairrada wine route. Serv. Ind. J. 2010, 30, 1621–1641. [Google Scholar] [CrossRef]
  34. Xu, M.; Huang, Z.F.; Cao, F.D.; Zhu, H.Z. The network structure features and influence factors of tourism flows based on online data analysis: Taking the Yangtze river delta region as an example. Econ. Geogr. 2018, 38, 193–202. [Google Scholar]
  35. Lohmann, G.; Pereira, B.A. Air transport innovations: A perspective article. Tour. Rev. 2019, 75, 95–101. [Google Scholar] [CrossRef] [Green Version]
  36. Duval, D.T. Transport and tourism: A perspective article. Tour. Rev. 2020, 75, 91–94. [Google Scholar] [CrossRef]
  37. Froidh, O. Perspectives for a future high-speed train in the Swedish domestic travel market. J. Transp. Geogr. 2008, 16, 268–277. [Google Scholar] [CrossRef]
  38. Li, M.; Chen, J. High-speed rail network in China: The contribution of fast trains to regional tourism and economic development. Tour. Rev. 2019, 75, 414–432. [Google Scholar] [CrossRef]
  39. Degen, W.; Tian, C.; Lin, L.; Li, W.; Lew, A.A. Mechanism and HSR effect of spatial structure of regional tourism flow: Case study of Beijing-Shanghai HSR in China. Acta Geogr. Sin. 2015, 70, 214–233. [Google Scholar]
  40. Wang, Z.; Xu, S. Influence and evaluation of different traffic modes on tourism efficiency: Taking Zhangjiajie as an example. Sci. Geogr. Sin. 2018, 38, 1148–1155. [Google Scholar]
  41. Degen, W. The influence of Beijing-Shanghai high-speed railway on tourism flow and time-space distribution. Tour. Trib. 2014, 29, 75–82. [Google Scholar]
  42. Jiang, H.; Liu, J.; Jiang, J. An analysis of the accessibility of China’s tourist attractions under the impact of high-speed railway. Tour. Trib. 2014, 29, 58–67. [Google Scholar]
  43. Liu, F.; Zhang, J.; Chen, D. Application of social network analysis in tourism research. Tour. Forum 2009, 2, 172–177. [Google Scholar]
  44. Dredge, D. Destination place planning and design. Ann. Tour. Res. 1999, 26, 772–791. [Google Scholar] [CrossRef]
  45. Zhong, S.; Zhang, J.; Han, G.-S. Satial pattern of tourism flow: Problem and prospects. Human Geogr. 2010, 5, 31–36. [Google Scholar]
  46. Lundgren, J.O.J. The tourist frontier of Nouveau Quebec: Functions and regional linkages. Tour. Rev. 1982, 37, 10–16. [Google Scholar] [CrossRef]
  47. Morrison, P.; Lynch, N.J. International tourism networks. Int. J. Contemp. Hosp. Manag. 2004, 16, 197–202. [Google Scholar] [CrossRef]
  48. Liu, F.; Zhang, J.; Zhang, J.; Chen, D.; Zhong, S.; Zhang, H.; Liu, Z. Analysis on basic methods of spatial data acquisition of tourism flow: A review and comparison of domestic and foreign research. Tour. Trib. 2012, 27, 101–109. [Google Scholar]
  49. Deasy, G.F.; Griess, P.R. Impact of a tourist facility on its hinterland. Ann. Assoc. Am. Geogr. 1966, 56, 290–306. [Google Scholar] [CrossRef]
  50. Yang, X.Z.; Gu, C.L.; Wang, Q. Urban tourism flow network structure construction in Nanjing. Acta Geogr. Sin. 2007, 62, 609–620. [Google Scholar]
  51. Yu, H.; Xu, X.; Feng, X. The impact of Shanghai Disneyland on Shanghai’s tourist flow network: From the perspective of tourists’digital footprints on the Lvmama website. Tour. Trib. 2018, 33, 33–45. [Google Scholar]
  52. Fu, Q.G.; Liu, D.J.; Hu, J. Network structure and optimization research on the Hubei province tourist flow. Econ. Geogr. 2015, 35, 191–196. [Google Scholar]
  53. Liu, H.; Wei, L.; Zhang, J. The research on the characteristics of network structure of aera tourism flows based on tourism route. Hum. Geogr. 2014, 29, 131–136. [Google Scholar]
  54. Ji, X.; Ge, Y.; Chen, F. Spatiotemporal differentiation characteristics of holiday tourism flow based on big data of highway traffic flow: A case study of seven holidays in Yunnan province in 2017. J. Tour. 2019, 34, 37–47. [Google Scholar]
  55. Wu, L.; Jiao, H.; Ye, L. Spatiotemporal characteristics of coupling and coordinated development of tourism economy and transportation in Wannan international cultural tourism demonstration zone. Geogr. Sci. 2019, 39, 1822–1829. [Google Scholar]
  56. Wang, Z.; Zhao, S.; Yang, X. Study on the coupling and coordinated evolution of transportation network and tourism destination of Urban agglomeration: A case study of Changsha Zhuzhou Xiangtan urban agglomeration. World Geogr. Res. 2020, 29, 962–972. [Google Scholar]
Figure 1. Spatial pattern of tourism destinations in different development stages.
Sustainability 13 00947 g001
Figure 2. Network hierarchy of tourism flow.
Sustainability 13 00947 g002
Figure 3. The change chart of population flow.
Sustainability 13 00947 g003
Figure 4. City type division.
Sustainability 13 00947 g004
Figure 5. Distribution of urban tourism inflow and outflow difference.
Sustainability 13 00947 g005
Figure 6. China’s tourism flow network.
Sustainability 13 00947 g006
Figure 7. China’s tourism flow network regarding air transport.
Sustainability 13 00947 g007
Figure 8. China’s tourism flow network under the mode of train transportation.
Sustainability 13 00947 g008
Figure 9. China’s tourism flow network under the mode of automobile transportation.
Sustainability 13 00947 g009
Figure 10. Responsiveness of tourist flows to distance.
Sustainability 13 00947 g010aSustainability 13 00947 g010b
Table 1. Correlation between the inflow of urban tourism and the number of scenic spots and hotels.
Urban-TypeCorrelationTourist Attractions and Receptivity Travel Power
Number of 5A Scenic SpotsNumber of 4A Scenic SpotsNumber of 3A Scenic SpotsNumber of 5-Star HotelsNumber of 4-Star HotelsNumber of 3-Star HotelsPer Capita Disposable Income
D&O TypeInflowPearson Relevance0.17−0.645−0.3130.1550.5080.543−0.554
Significant (bilateral)0.6880.0840.450.7130.1990.1650.155
OutflowPearson Relevance0.3340.209−0.670.770*0.5940.5370.516
Significant (bilateral)0.4190.6190.0690.0250.1210.170.191
D TypePearson Relevance0.358 **0.440 **0.340 **0.481 **0.444 **0.423 **0.439 **
Significant (bilateral)0000000
O TypePearson Relevance0.2050.350 **0.473 **0.369 **0.357 **0.414 **0.268 *
Significant (bilateral)0.0760.00200.0010.00200.019
** Significantly correlated at the 0.01 level (bilateral); * significantly correlated at the 0.05 level (bilateral).
Table 2. Tourism flow networks’ characteristics.
Network TypeNetwork Level (Number of Tourism Paths)Average Flow Distance/kmAverage Flow/Man-Time
Total
Tourism Flow Network
Level 1 (22)962.719192,207
Level 2 (99)884.16168,592
Level 3 (611)780.06823,005
Level 4 (2961)692.5293937
Car
Tourism Flow Network
Level 1 (2)205.391151,239
Level 2 (51)288.38330,077
Level 3 (446)352.3468299
Level 4 (2400)526.4031259
Train
Tourism Flow Network
Level 1 (23)883.668102,436
Level 2 (105)723.77436,223
Level 3 (546)770.40213,501
Level 4 (2984)700.9062205
Airplane
Tourism Flow Network
Level 1 (130)1357.117111,787
Level 2 (60)1264.46341,255
Level 3 (206)1303.69414,557
Level 4 (1674)1140.2071791
Publisher’s Note: MDPI stays neutral with regard to jurisdictional claims in published maps and institutional affiliations.

