
Struggling with COVID-19—A Framework for Assessing Health System Performance


Abstract
:1. Introduction
2. Theoretical Background
3. Materials and Methods
- EuroStat (https://ec.europa.eu/eurostat/data/database)
- Johns Hopkins University & Medicine; Maps & Trends; Mortality Analyses (https://coronavirus.jhu.edu/data/mortality),
- Our World in Data platform (https://ourworldindata.org/),
- The World Bank (https://data.worldbank.org/indicator/SH.XPD.CHEX.GD.ZS), and
- JHU Coronavirus Resource Centre for Global Data (https://covid19stats.ph/stats/by-country/crr).
- i—the number of the object (country), i = 1, 2,..., N,
- k—the number of variables (characteristics), k = 1, 2,..., K,
- zik—the normalized value of the k variable for the i object, (𝑥ik—value of the k diagnostic variable for the i object; —arithmetic average of the diagnostic variable xk, Sk—the standard deviation from the diagnostic variable xk,),
- z0k—the development pattern value for the k variable (it takes the maximum value of the variable for the tested objects if the variable is stimulant or its minimum value if it is a destimulant).
- Pearson’s coefficient—to measure the relationship between the values of the taxonomic development measure and the values of selected variables,
- Spearman’s coefficient—to measure the relationship between the country ranking positions according to the “country health and health system capacity profile” and selected variables.
4. Results
5. Discussion
6. Conclusions
Author Contributions
Funding
Data Availability Statement
Conflicts of Interest
References
- World Health Organization. 2019 Novel Coronavirus (2019-nCoV): Strategic Preparedness and Response Plan. Available online: https://www.who.int/docs/default-source/coronaviruse/srp04022020.pdf?-ua=1 (accessed on 5 June 2020).
- World Health Organization. WHO COVID-19 Preparedness and Response Progress Report (CH). Available online: https://www.who.int/publications/i/item/strategic-preparedness-and-response-plan-for-the-new-coronavirus (accessed on 1 June 2020).
- World Health Organization. WHO Coronavirus Disease (COVID-19) Dashboard. 2020. Available online: https://covid19.who.int (accessed on 21 October 2020).
- OECD. Evaluating the Initial Impact of COVID-19 Containment Measures on Economic Activity. 2020. Available online: https://read.oecdilibrary.org/view/?ref=126_126496evgsi2gmqj&title=Evaluating_the_initial_impact_of_COVID-19_containment_measures_on_economic_activity (accessed on 10 June 2020).
- Hood, C. Contemporary public management: A new global paradigm? Public Policy Adm. 1995, 10, 104–117. [Google Scholar] [CrossRef]
- Lapsley, I. Accounting and the New Public Management: Instruments of Substantive Efficiency or a Rationalising Modernity? Financ. Account. Manag. 1999, 15, 201–207. [Google Scholar] [CrossRef]
- Smith, P.C.; Mossialos, E.; Papanicolas, I.; Leatherman, S. Performance Measurement for Health System Improvement; Cambridge University Press: Cambridge, UK, 2010. [Google Scholar]
- Papanicolas, I.; Smith, P.C. Health System Performance Comparisons; Open University Press: London, UK, 2013. [Google Scholar]
- Smith, P.C. Performance Measurement in Health Care: History, Challenges and Prospects. Public Money Manag. 2005, 25, 213–220. [Google Scholar] [CrossRef]
- Levesque, J.-F.; Sutherland, K. Combining patient, clinical and system perspectives in assessing performance in healthcare: An integrated measurement framework. BMC Health Serv. Res. 2020, 20, 1–14. [Google Scholar] [CrossRef]
- Bouckaert, G.; Peters, B.G. Performance Measurement and Management: The Achilles’ Heel in Administrative Modernization. Public Perform. Manag. Rev. 2002, 25, 359–362. [Google Scholar] [CrossRef]
- Love, D.; Revere, L.; Black, K. A current look at the key performance measures considered critical by healthcare leaders. J. Health Care Financ. 2008, 34, 19–33. [Google Scholar]
- Yang, M.-C.; Tung, Y.-C. Using Path Analysis to Examine Causal Relationships Among Balanced Scorecard Performance Indicators for General Hospitals. The Case of a Public Hospital System in Taiwan. Health Care Manag. Rev. 2006, 31, 280–288. [Google Scholar] [CrossRef] [PubMed]
- Fottler, M.D.; Erickson, E.; Rivers, P.A. Bringing Human Resources To the Table. Utilization of an HR Balanced Scorecard at Mayo Clinic. Health Care Manag. Rev. 2006, 31, 64–72. [Google Scholar] [CrossRef] [PubMed]
- Ba-Abaad, K.M. Review of the literature of balanced scorecard and performance measurement: The case of healthcare organizations. Bus. eBull. 2009, 1, 33–47. [Google Scholar]
- Kloot, L.; Martin, J. Strategic performance management: A balanced approach to performance management issues in local government. Manag. Account. Res. 2000, 11, 231–251. [Google Scholar] [CrossRef]
- Chang, L.-C. The NHS performance assessment framework as a balanced scorecard approach. Int. J. Public Sect. Manag. 2007, 20, 101–117. [Google Scholar] [CrossRef]
- Guven-Uslu, P.; Conrad, L. Uses of Management Accounting Information for Benchmarking in NHS Trusts. Public Money Manag. 2008, 28, 239–246. [Google Scholar] [CrossRef]
- Smith, P.C. Measuring up. Improving Health Systems Performance in OECD Countries; OECD: Ottawa, ON, Canada, 2002. [Google Scholar]
- Wait, S.; Nolte, E. Benchmarking health systems: Trends, conceptual issues and future perspectives. Benchmarking: Int. J. 2005, 12, 436–448. [Google Scholar] [CrossRef]
- Arah, O.A.; Westert, G.P.; Hurst, J.P.; Klazinga, N.S. A conceptual framework for the OECD Health Care Quality Indicators Project. Int. J. Qual. Health Care 2006, 18 (Suppl. 1), 5–13. [Google Scholar] [CrossRef] [PubMed] [Green Version]
- Hilarion, P.; Suñol, R.; Groene, O.; Vallejo, P.; Herrera, E.; Saura, R.M. Making performance indicators work: The experience of using consensus indicators for external assessment of health and social services at regional level in Spain. Health Policy 2009, 90, 94–103. [Google Scholar] [CrossRef]
- Giovanelli, L.; Marino, L.; Rotondo, F.; Fadda, N.; Ezza, A.; Amadori, M. Developing a performance evaluation system for the Italian public healthcare sector. Public Money Manag. 2015, 35, 297–302. [Google Scholar] [CrossRef]
- Kim, H.; Jeon, B. Developing a framework for performance assessment of the public long-term care system in Korea: Methodological and policy lessons. Health Res. Policy Syst. 2020, 18, 1–10. [Google Scholar] [CrossRef] [PubMed] [Green Version]
- World Health Organization. The World Health Report: Health Systems: Improving Performance. 2000. Available online: https://www.who.int/whr/2000/en/whr00_en.pdf?ua=1 (accessed on 3 June 2020).
- World Health Organization. Health Systems Performance Assessment: Debates, Methods and Empiricism; World Health Organization: Geneva, Switzerland, 2003. [Google Scholar]
- Hurst, J.; Jee-Hughes, M. Performance Measurement and Performance Management in OECD Health Systems. In OECD Labour Market and Social Policy Occasional Papers; OECD: Ottawa, ON, Canada, 2001; Volume 47, pp. 1–69. [Google Scholar] [CrossRef]
- Murray, C.J.; Frenk, J. A framework for assessing the performance of health systems. Bull. World Health Organ. 2000, 78, 717–731. [Google Scholar]
- Bankauskaite, V.; Dargent, G. Health systems performance indicators: Methodological issues. Presup. Gasto Público 2007, 49, 125–137. Available online: https://www.ief.es/docs/destacados/publicaciones/revistas/pgp/49_Health.pdf (accessed on 3 June 2020).
- Caunic, R.E. Frameworks and measures for health systems performance assessment. SEA Pract. Appl. Sci. 2019, 7, 205–212. [Google Scholar]
- World Health Organization. Everybody’s Business: Strengthening Health Systems to Improve Health Outcomes. WHO’s Framework for Action. 2007. Available online: https://www.who.int/healthsystems/strategy/everybodys_business.pdf (accessed on 3 June 2020).
- Evans, S.M.; Lowinger, J.S.; Sprivulis, P.C.; Copnell, B.; Cameron, P.A. Prioritizing quality indicator development across the healthcare system: Identifying what to measure. Intern. Med. J. 2009, 39, 648–654. [Google Scholar] [CrossRef]
- Lizarondo, L.; Grimmer, K.; Kumar, S. Assisting allied health in performance evaluation: A systematic review. BMC Health Serv. Res. 2014, 14, 572. [Google Scholar] [CrossRef] [PubMed] [Green Version]
- Sun, D.; Ahn, H.; Lievens, T.; Zeng, W. Evaluation of the performance of national health systems in 2004-2011: An analysis of 173 countries. PLoS ONE 2017, 12, e0173346. [Google Scholar] [CrossRef] [Green Version]
- Stevens, S.S. Measurement, psychophysics and utility. In Measurement. Definitions and Theories; Churchman, C.W., Ratooch, P., Eds.; Wiley: New York, NY, USA, 1959. [Google Scholar]
- Jajuga, K.; Walesiak, M. Standardisation of data set under different measurement scales. In Classification and Information Processing at the Turn of the Millennium; Decker, R., Gaul, W., Eds.; Springer: Berlin/Heidelberg, Germany, 2000. [Google Scholar]
- Walesiak, M.; Dudek, A. Finding Groups in Ordinal Data: An Examination of Some Clustering Procedures. In Classification as a Tool for Research; Locarek-Junge, H., Weihs, C., Eds.; Springer: Berlin/Heidelberg, Germany, 2010. [Google Scholar]
- Bąk, I.; Markowicz, I. Taksonomiczne mierniki rozwoju w klasyfikacji obiektów (na przykładzie usług kulturalnych). Wiad. Stat. Pol. Stat. 2003, 4, 32–39. [Google Scholar]
- Hellwig, Z. Procedure of Evaluating High-Level Manpower Data and Typology of Countries by Means of the Taxonomic Method. In Towards a System of Human Resources Indicators for Less Developed Countries; Gostkowski, Z., Ed.; Papers Prepared for UNESCO Research Project; Ossolineum, The Polish Academy of Sciences Press: Wrocław, Poland, 1972; pp. 115–134. [Google Scholar]
- Walesiak, M.; Dudek, A. Selecting the Optimal Multidimensional Scaling Procedure for Metric Data with R Environment. Stat. Transit. New Ser. 2017, 18, 521–540. [Google Scholar] [CrossRef]
- Tarczyński, W.; Łuniewska, M. Stability of Selected Linear Ranking Methods—An Attempt of Evaluation for the Polish Stock Market. In Innovations in Classification, Data Science, and Information Systems. Studies in Classification, Data Analysis, and Knowledge Organization; Baier, D., Wernecke, K.D., Eds.; Springer: Berlin/Heidelberg, Germany, 2005. [Google Scholar]
- Pietrzak, M.B.; Balcerzak, A.P. Economic development of Polish voivodeships in the years 2010–2014. Application of taxonomic measure of development with entropy weights. Inst. Econ. Res. Work. Pap. 2017, 2, 1–11. [Google Scholar]
- Dehnel, G.; Walesiak, M.; Obrębalski, M. Comparative Analysis of the Ordering of Polish Provinces in Terms of Social Cohesion. Argum. Oecon. Crac. 2019, 1, 71–85. [Google Scholar] [CrossRef] [Green Version]
- Kufel, T. ARIMA-based forecasting of the dynamics of confirmed Covid-19 cases for selected European countries. Equilib. Q. J. Econ. Econ. Policy 2020, 15, 181–204. [Google Scholar] [CrossRef]
- Iacus, S.M.; Natale, F.; Satamaria, C.; Spyratos, S.; Vespe, M. Estimating and projecting air passenger traffic during the COVID-19 coronavirus outbreak and its socio-economic impact. Saf. Sci. 2020, 129, 104791. [Google Scholar] [CrossRef]
- Bal, R.; de Graaff, B.; van de Bovenkamp, H.M.; Wallenburg, I. Practicing Corona—Towards a research agenda of health policies. Health Policy 2020, 124, 671–673. [Google Scholar] [CrossRef]
- Sabat, I.; Neuman-Böhme, S.; Varghese, N.E.; Barros, P.; Brouwer, W.; van Exel, J.; Schreyögg, J.; Stargardt, T. United but divided: Policy responses and people’s perceptions in the EU during the COVID-19 outbreak. Health Policy 2020, 124, 909–918. [Google Scholar] [CrossRef] [PubMed]
- Forman, R.; Atun, R.; McKee, M.; Mossialos, E. 12 Lessons learned from the management of the coronavirus pandemic. Health Policy 2020, 124, 577–580. [Google Scholar] [CrossRef]
- World Health Organization. Joint External Evaluation Tool: International Health Regulations (2005). Monitoring and Evaluation Framework. Geneva, Switzerland. 2016. Available online: https://apps.who.int/iris/bitstream/handle/10665/204368/9789241510172_eng.pdf;jsessionid=7664826D3E6DC0F55092FFA810908414?sequence=1 (accessed on 27 July 2021).
- World Health Organization. Pandemic Influenza Preparedness and Response: A WHO Guidance Document. Global Influenza Programme. France. 2010. Available online: https://apps.who.int/iris/bitstream/handle/10665/44123/9789241547680_eng.pdf;jsessionid=D9C4B4292381A4A69FC36EF571DC0B19?sequence=1 (accessed on 27 July 2021).
- Centers for Disease Control and Prevention. Global Health Security Agenda: Action Packages. Available online: https://www.cdc.gov/globalhealth/healthprotection/ghs/pdf/ghsa-action-packages_24-september-2014.pdf (accessed on 27 July 2021).
- Global Health Security Agenda (GHSA). 2024 Framework November 2018. Available online: https://ghsagenda.org/wp-content/uploads/2020/06/ghsa2024-framework.pdf (accessed on 27 July 2021).
- Vuong, Q.-H.; Ho, T.; Nguyen, H.K.; Vuong, T.-T. Healthcare consumers’ sensitivity to costs: A reflection on behavioural economics from an emerging market. Palgrave Commun. 2018, 4, 70. [Google Scholar] [CrossRef]
- Vuong, Q.H. Be rich or don’t be sick: Estimating Vietnamese patients’ risk of falling into destitution. SpringerPlus 2015, 4, 529. [Google Scholar] [CrossRef] [PubMed]

| WHO Region | Reported Cases | Reported Deaths |
|---|---|---|
| Americas | 81,824,784 | 2,074,302 |
| Europe | 63,790,934 | 1,255,791 |
| South-East Asia | 40,584,666 | 629,604 |
| Eastern Mediterranean | 14,112,751 | 257,624 |
| Western Pacific | 5,918,234 | 82,578 |
| Africa | 5,497,902 | 130,785 |
| System Dimension | Indicator | Key Question Answered |
|---|---|---|
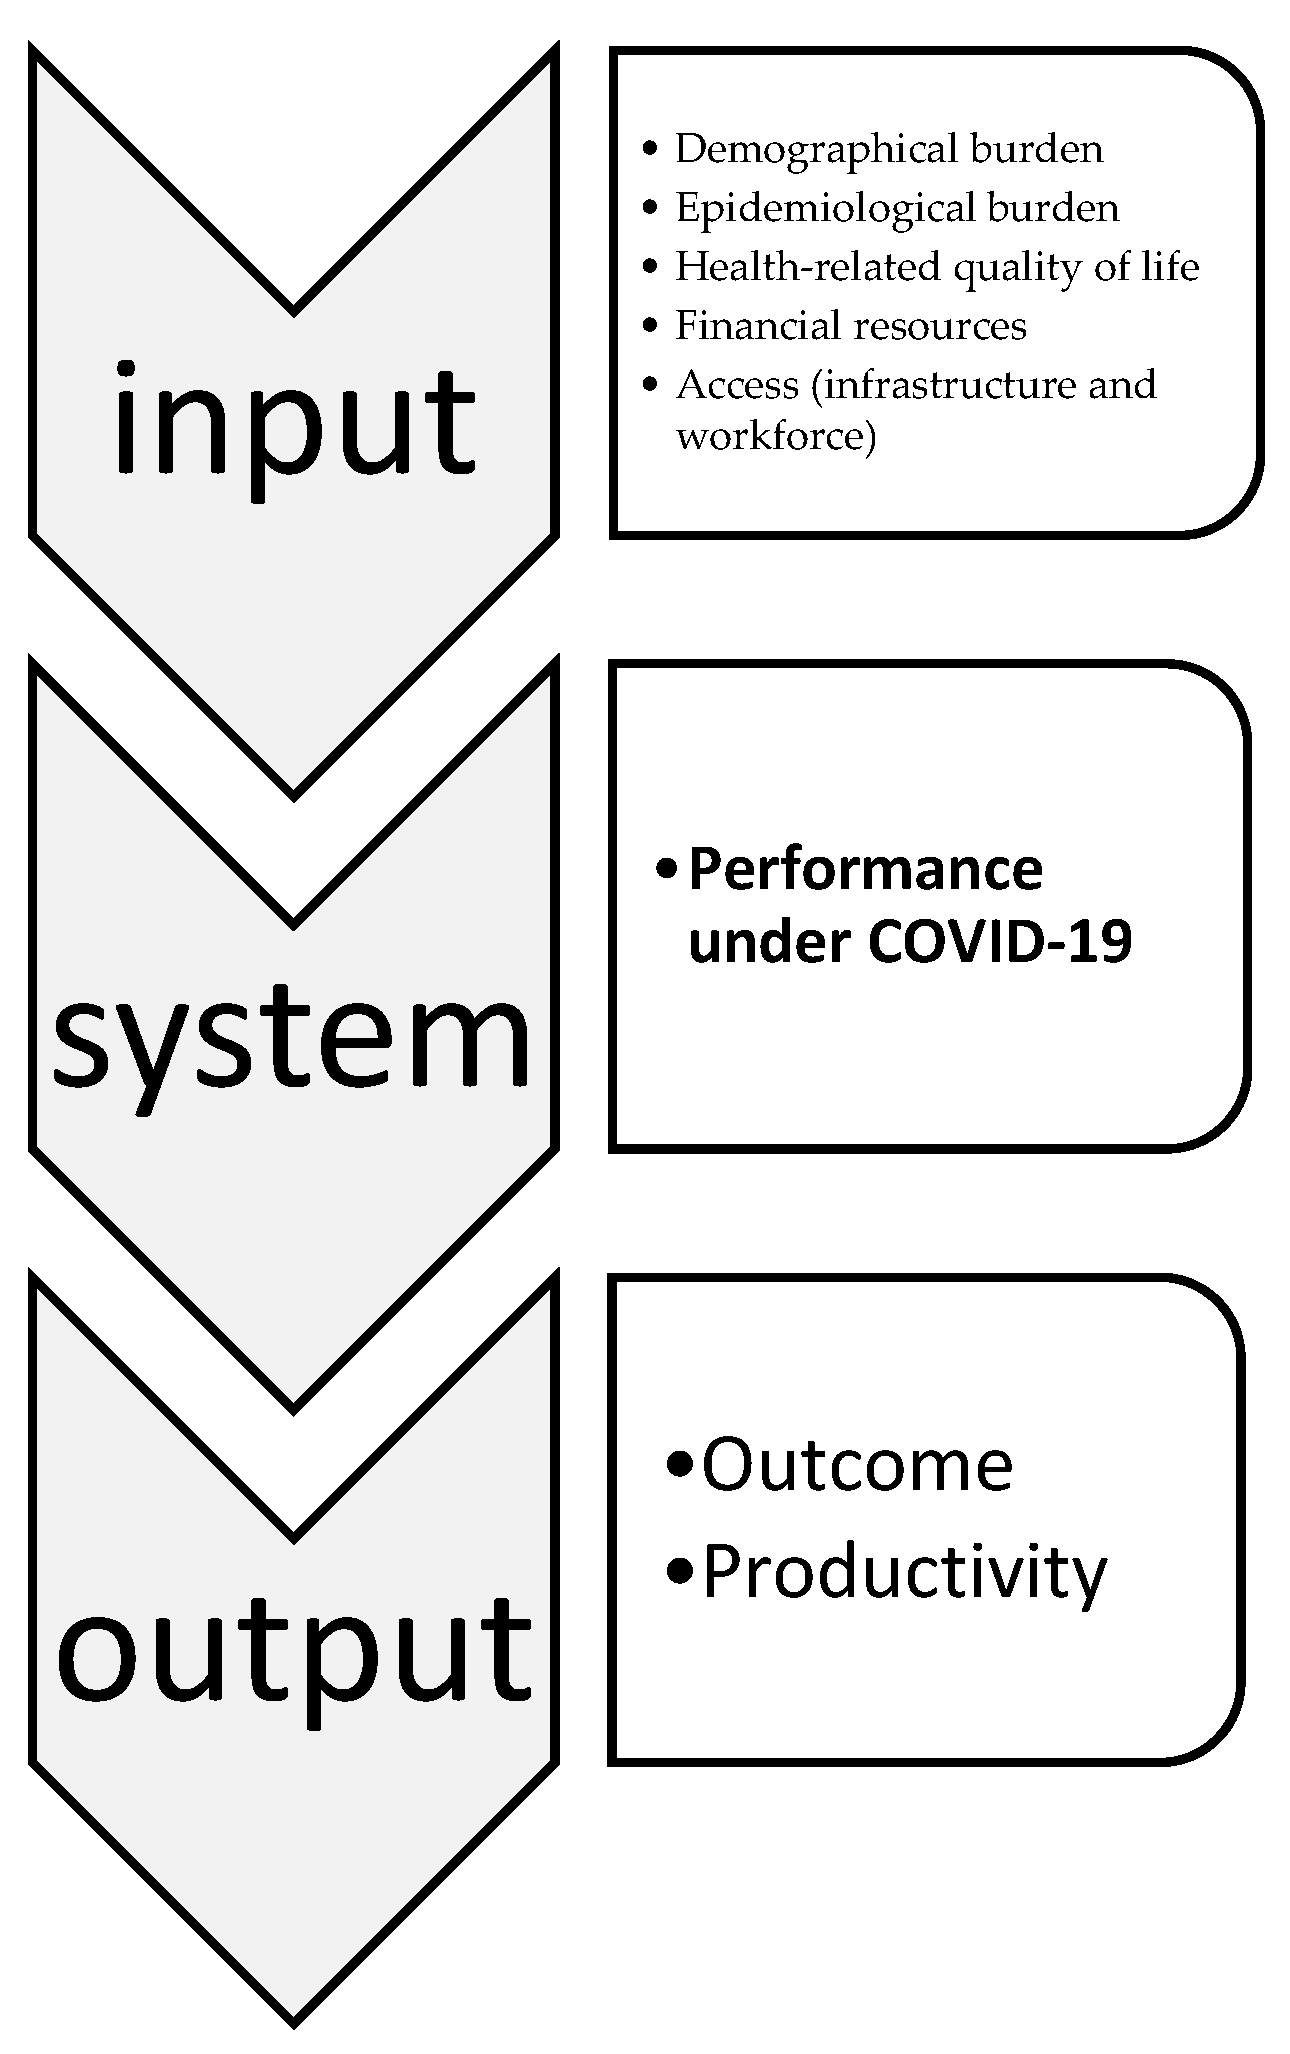
| Demographic burden | I1—population density (number of people per sq. km) I2—median age I3—population aged 65 and older (percentage) I4—population aged 70 and older (percentage) | Is the population prone to COVID-19 due to demographic burden? |
| Epidemiological burden | I6—cardiovascular disease death rate I7—diabetes prevalence I8—female smokers (percentage) I9—male smokers (percentage) | Is the population prone to COVID-19 due to epidemiological burden? |
| Health-related quality of life | I11—life expectancy I12—healthy life years at birth I13—share of people with good or very good perceived health (aged 16 and older) I14—healthy life years at age 65 | Is the population resistant to COVID-19 due to good health-related quality of life? |
| Financial resources | I5—GDP per capita I15—total health care expenditure (in euros per capita) I18—current health expenditure (% of GDP) | What is the system’s potential to manage SARS-CoV-2 in terms of financial resources? |
| Access (infrastructure and workforce) | I10—hospital beds per 1000 population I16—practicing physicians (per 100,000 population)I17—nurses (number per 1000 population) | What is the system potential to manage SARS-CoV-2 in terms of human and infrastructure resources? |
| Domain | Indicator | Key Question Answered |
|---|---|---|
| Outcomes | O1—observed case-fatality ratio due to COVID-19 O2—deaths per 100,000 population due to COVID-19 O3—total COVID-19 cases per million population O6—COVID-19 Case Recovery Rate (CRR—Recoveries/Confirmed Cases) | What is the dynamic of the SARS-CoV-2 pandemic? |
| Productivity | O4—total tests per 1000 population O5—daily tests per 1000 population | How is the pandemic managed? |
| Variables | Average | Standard Deviation | Min | Max |
|---|---|---|---|---|
| I1 | 176.99 | 263.85 | 18.14 | 1454.04 |
| I2 | 42.83 | 2.41 | 37.30 | 47.90 |
| I3 | 18.73 | 2.31 | 13.42 | 23.02 |
| I4 | 12.48 | 1.97 | 8.56 | 16.24 |
| I5 | 37,859.17 | 15,026.65 | 18,563.31 | 94,277.97 |
| I6 | 191.05 | 90.58 | 86.06 | 424.69 |
| I7 | 6.27 | 1.99 | 3.28 | 10.79 |
| I8 | 24.05 | 4.82 | 16.30 | 35.30 |
| I9 | 33.18 | 8.89 | 18.80 | 52.70 |
| I10 | 4.83 | 1.73 | 2.22 | 8.00 |
| I11 | 80.28 | 2.53 | 75.05 | 83.56 |
| I12 | 62.01 | 5.21 | 52.30 | 72.80 |
| I13 | 67.77 | 10.18 | 44.00 | 87.40 |
| I14 | 9.09 | 2.90 | 4.40 | 15.70 |
| I15 | 2708.23 | 1916.04 | 493.78 | 8452.88 |
| I16 | 364.14 | 75.84 | 237.75 | 550.00 |
| I17 | 8.47 | 3.32 | 3.37 | 17.37 |
| I18 | 8.56 | 2.38 | 5.16 | 17.06 |
| Variables | Pearson’s Coefficient | Spearmen’s Coefficient |
|---|---|---|
| O1 | 0.2845 | 0.3103 |
| O2 | 0.5606 *** | 0.6601 *** |
| O3 | 0.7405 *** | 0.7606 *** |
| O4 | 0.3394 ** | 0.2754 |
| O5 | 0.4011 *** | 0.4842 ** |
| O6 | −0.2723 | −0.1030 |
Publisher’s Note: MDPI stays neutral with regard to jurisdictional claims in published maps and institutional affiliations. |
© 2021 by the authors. Licensee MDPI, Basel, Switzerland. This article is an open access article distributed under the terms and conditions of the Creative Commons Attribution (CC BY) license (https://creativecommons.org/licenses/by/4.0/).
Share and Cite
Markowicz, I.; Rudawska, I. Struggling with COVID-19—A Framework for Assessing Health System Performance. Sustainability 2021, 13, 11146. https://doi.org/10.3390/su132011146
Markowicz I, Rudawska I. Struggling with COVID-19—A Framework for Assessing Health System Performance. Sustainability. 2021; 13(20):11146. https://doi.org/10.3390/su132011146
Chicago/Turabian StyleMarkowicz, Iwona, and Iga Rudawska. 2021. "Struggling with COVID-19—A Framework for Assessing Health System Performance" Sustainability 13, no. 20: 11146. https://doi.org/10.3390/su132011146