Article

Consistency of Urban Roads to Manage Emergencies: Methodology to Identify the Minimum Network with Total Connectivity at Maximum Availability

Department of Civil, Constructional and Environmental Engineering, Sapienza University of Rome, Via Eudossiana 18, 00184 Rome, Italy
*
Author to whom correspondence should be addressed.
Sustainability 2021, 13(20), 11151; https://doi.org/10.3390/su132011151
Submission received: 4 September 2021 / Revised: 26 September 2021 / Accepted: 3 October 2021 / Published: 9 October 2021

Abstract

:
Natural disasters happen without warning; it is normally impossible to predict when they will occur, but it is necessary that rescue services reach the disaster site and manage the emergency. This paper proposes an innovative methodology to summarize seismic effects on road, building, and land factors in urban areas. The existing road network is modelled through the graph theory: the arcs represent the main infrastructures, while the nodes represent both the primary strategic buildings and the intersections between the main roads. Therefore, the quantitative approach takes into account the existing road network, the focal areas that play a strategic role during emergency, and their relationship with buildings and territory. The results enable the identification of the minimum urban structure (MUS) with total connectivity at maximum availability. These structures were composed of the paths that will be the priority choice for emergency vehicles after an earthquake. The proposed approach has been implemented to identify the MUS in a medium-size Italian urban center (Pomezia) in the event of a critical earthquake. The methodology is easy to apply and could represent an ideal tool in the preliminary phase of analysis of an urban road network to define new city plans through targeted territorial design, to facilitate decision makers in investment choices, to increase the road network consistency, and to implement emergency plans after natural disasters.

1. Introduction

1.1. Natural Risks and Urban Development

The norms laid down in the Athens Charter (1933) [1] are a staple of town planning identifying four pivotal functions of existence (i.e., home, work, leisure, and movement). In the late 1970s, the scientific community understood the role played by technological innovations on the urbanistic and logistic development of towns. Subsequently, a fourth dimension (i.e., time) was applied to describe urban phenomena [2]. Indeed, the time dimension is crucial to analyze evolutionary processes and manage anthropic and natural risks because it plays a central role in public services [3,4]. Firstly, the seismic risk was analyzed because of its great impact on public health and costs. Later, other kinds of natural risk were also considered (e.g., atmospheric, hydrologic, volcanic, and wildfire phenomena) [5]. In recent decades, town planning strategies have aimed to reduce urban vulnerability, overcome rigidity, and guarantee access and escape in the event of an emergency [6]. Entry into, movement around, and exit from the town should be guaranteed to all the user categories [7,8], whatever condition. Strategies to reduce urban vulnerability are based on studies of an area in order to identify the most probable natural disaster and its effects on goods and people [9]. Research to date demonstrates that prevention costs for reducing possible damage to buildings, goods, and people are far less than those for rebuilding and returning to the pre-crisis scenario [10,11,12]. Moreover, reconstruction often results in modification of the layout and organization of a settlement, adding social to economic costs [13]. A town has a dynamic texture that depends on the availability of public services [14]. Indeed, public services fill a strategic role: they should work both in ordinary moments and after collapse because all emergency activities need lifelines that join various spatial areas [15] that are affected by an emergency [16]. Public services ensure essential and indispensable services for people’s survival (e.g., transport, water and sewage, telecommunication, fuels, and electricity) [17]. The road network is among the most important lifelines as most maintenance and repair operations of other lifelines require the use of road infrastructure [18]. However, the functionality of road lifelines may not be effective after a natural disaster [19]. Although the on-ground transport network may be seriously damaged, escape routes from the disaster area should be guaranteed to ensure a sure path for access to safe areas [18,20]. Moreover, escape routes ensure access for the emergency services that reach people; in a later phase, they are essential to the restoration process. Therefore, public services are a system that contributes to town safety [21], and risk becomes an aspect of land-use management [22].

1.2. Risk Analysis

Risk analysis takes into account the correlation between territory, its anthropization, and natural risks [23], such as the morphology of the territory, the typology of the inhabited centers, and how the settlements organization interrelate. Therefore, detailed zoning regulations should be adopted to manage data for current and future safety of settlements. In Italy in particular, the city emergency plan (CEP) is an operational tool that contains all the procedures to deal with any expected or unforeseen disasters in a municipality, allowing the authorities to prepare and coordinate rescue interventions [24]. Its main goal of implementation is to protect people and maintain a dignified quality of life when disasters occur. Therefore, risk reduction affects territorial policies of a settlement. As such, the layout of central and suburban areas, the position of public and rescue services (e.g., hospitals and transportation nodes), and administrative competencies in disaster management cannot be overlooked. Particularly, the typological character of a center (e.g., its value concentrated in or spread over an area [25]), the connection between settlements [26,27], and their environmental morphology affect the continuity of a territory and its vulnerability [28]. Indeed, both punctual services (e.g., education, production, administrative, health, and strategic services) and network services (e.g., transportation, fuels, energy, and communication) contribute to risk analysis at an urban level.

1.3. Minimum Urban Structure
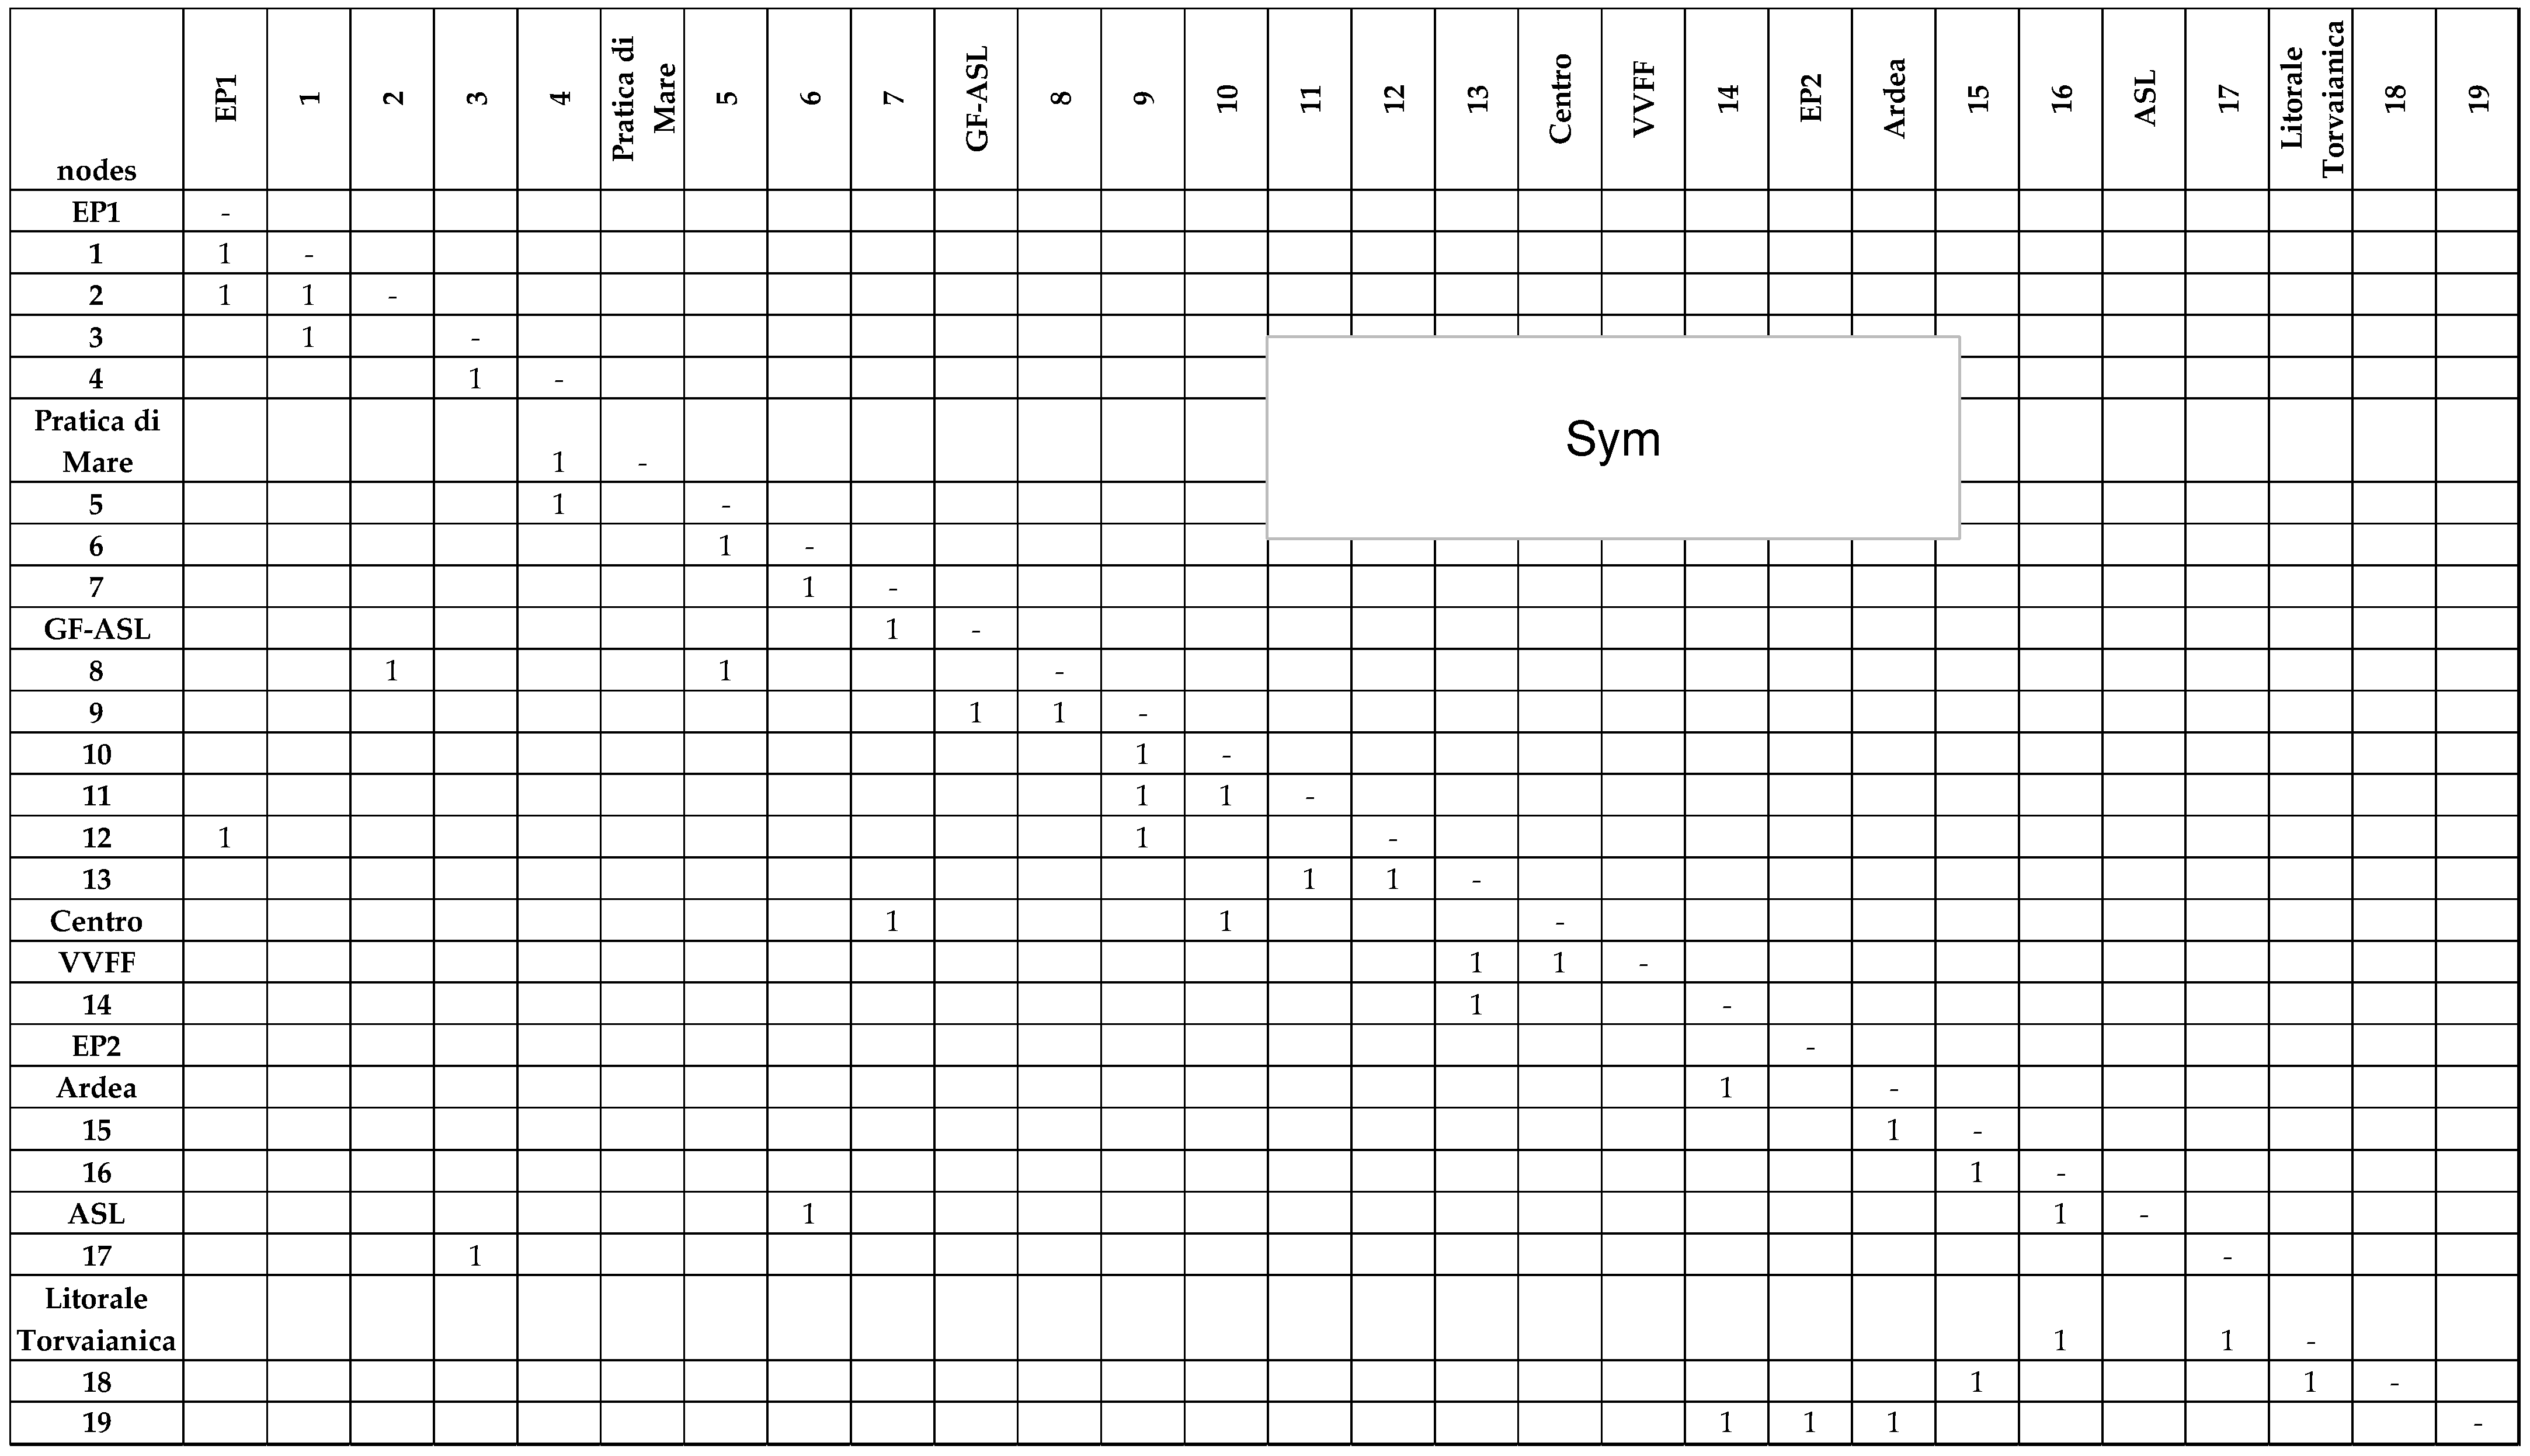
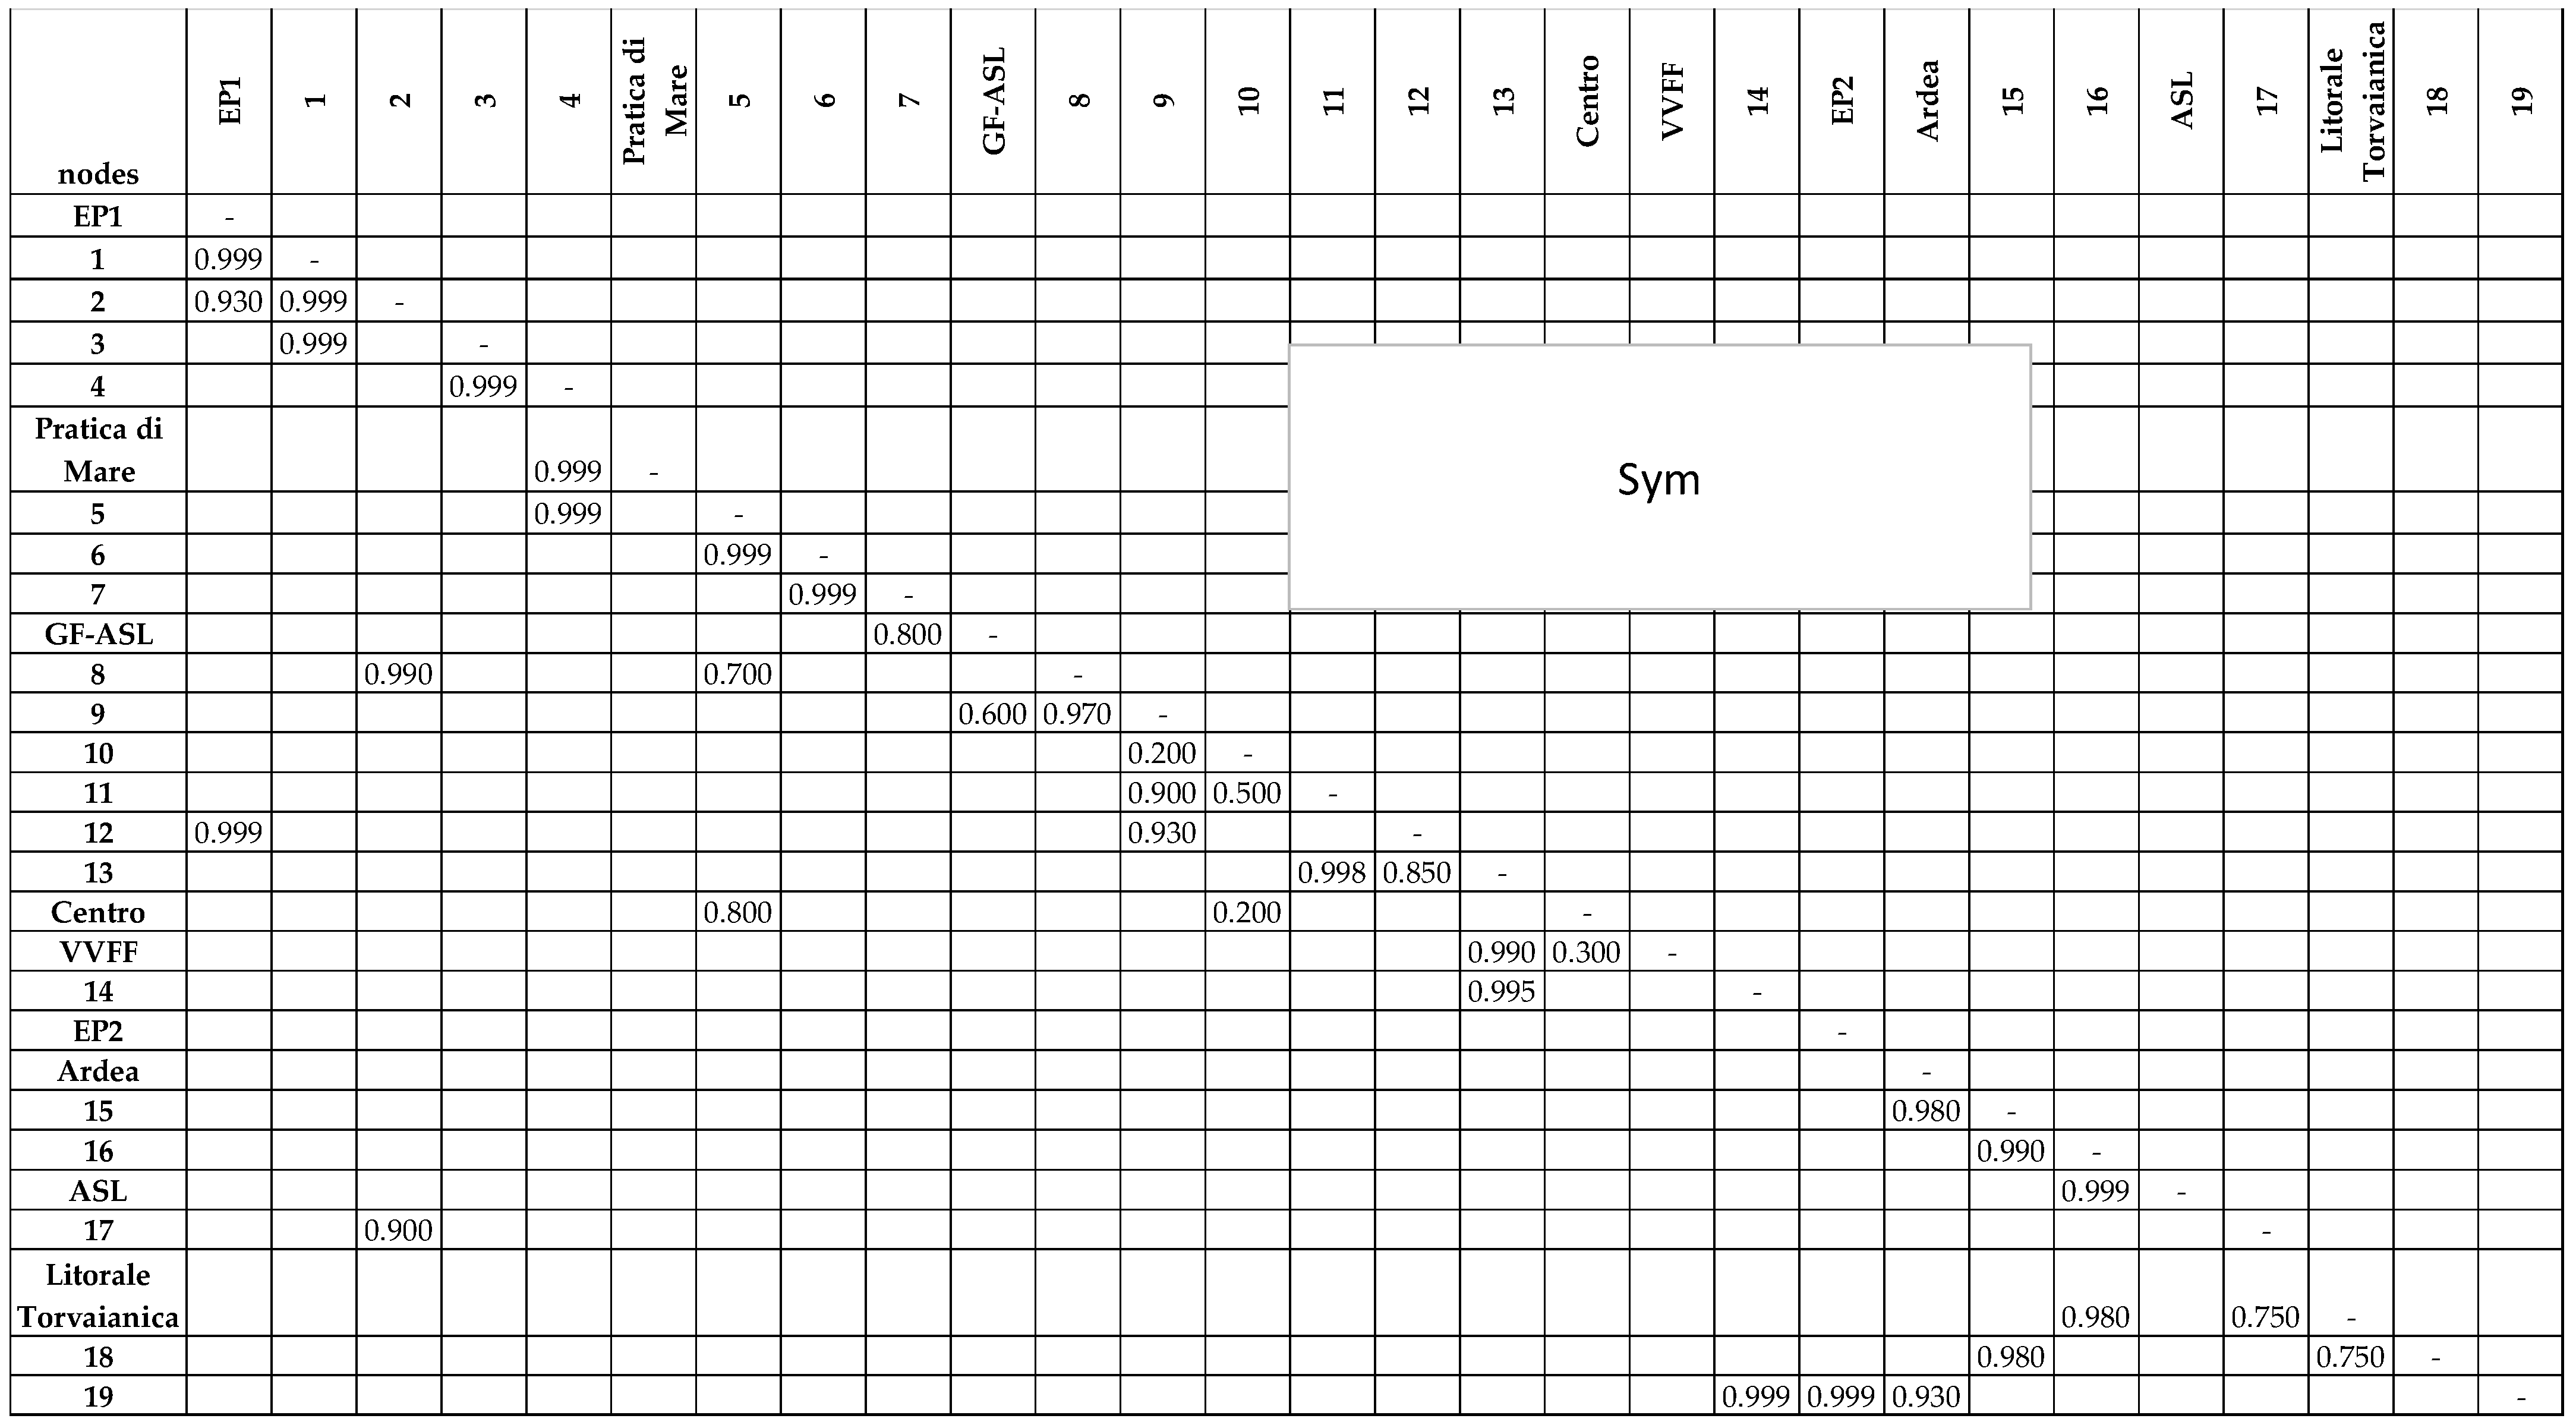
In an urban context, essential spaces are composed of linear elements where users move and strategic areas where public services are available [29,30]. In particular, to ensure economic, social, and relationship activities, the system of routes, spaces, urban functions, and strategic buildings that are necessary during and after an emergency [31] compose the minimum urban structure (MUS). The main components of an MUS are the primary routes, main road and railway nodes (e.g., junctions, main nodes, urban gates, and stations), escape routes and safe open spaces, and nerve centers (governing bodies, health facilities, civil protection, and firefighters) [32]. Moreover, cultural and economic–productive focal points can be included in the MUS to overcome a crisis.
This paper is organized as follows: Section 2 describes the innovative methodology defined by the authors to identify the MUS in a medium-size Italian town in the event of a critical earthquake. Section 3 shows the results from the implementation of the described methodology with regard to the seaside urban center of Pomezia, in central Italy [33]. Pomezia belongs to seismic zone 2B, where the horizontal peak ground acceleration with 10% exceedance probability in 50 years (ag) is lower than 0.20 g, and the reference horizontal peak ground acceleration (ag/g) is 0.25 [34]. Section 4 highlights the potential of the proposed tool in the preliminary phase of analysis of an infrastructural network, in order to facilitate decision maker’s investment choices and the implementation of emergency plans following natural disasters. Indeed, the proposed approach takes into account both the existing spaces and typical seismic damage to buildings in order to identify the strategic road network. These results contribute to prevention and protection strategies such as pre-emergency planning territory and seismic retrofitting, and during emergency management of rescue services. Finally, Section 5 presents our conclusions.

2. Methods

The definition of MUS requires a network analysis about spatial and functional elements that is formalized through the graph theory [35]. A graph is a mathematical structure formed by a finite number m of vertices (or nodes) and a finite number E of segments (arcs) that connect nodes to each other [36]. Each path is a sequence of consecutive arcs from the initial node (i.e., origin) to the end node (i.e., destination). The network of the MUS could be represented by the “undirected graph” technique (i.e., a set of arcs and nodes where the arcs represent the main infrastructures while the nodes represent both the primary strategic buildings and the intersections between the main transport infrastructures). The graph elements have been treated by the construction of a squared adjacency matrix (A) where each entry indicates whether pairs of vertices are adjacent or not in the graph. The entries aij are 1 if there exists a direct connection between the vertex i-th and the vertex j-th; otherwise, the entries of not-connected vertices are 0. A is symmetric with respect to the main diagonal, which is 0 (Equation (1)).
A = a 11 a 1 j a 1 m a i 1 a i j a i m a m 1 a m j a m m = 0 a 1 j a 1 m 0 a i m s y m 0
The matrix A allows the morphogenesis of the road network to be distinguished (e.g., urban sprawl if the majority of entries are not null) [37]. However, the adjacency matrix does not describe the interaction of the road network with the built environment [38] and the seismic effects on the transport infrastructure. Indeed, debris due to the earthquake could interfere with the arcs’ availability both during and after a crisis [39]. Therefore, in this study, the post-seismic functionality (dij) of each non-zero entry in A has been calculated according to Equation (2):
d i , j = q k i , j , q
where ki,j,q is a parameter ranging between 0 and 1 attributed to each of q variables (i.e., s: cross sections, b: buildings, f: street furniture) assumed in this study. They refer to vulnerability of road cross sections, overlooking buildings, and street furniture (e.g., lighting, vertical signs, and trees) along the arc.
For each i,j arc and q variable, the parameter ki,j,q,m has been calculated according to Equation (3):
k i , j , q = m k i , j , q , m   l m m l m  
where m is the number of sections that form the arc and lm is the length of each section; each section is not more than 1 km long.
With regard to the vulnerability of road cross sections, Table 1 and Table 2 list the vulnerability criteria defined by the authors for embankment and trench cross sections (ki,j,s).
Data in Table 1 and Table 2 permitted the authors to quantify ki,j,s according to Table 3.
Equation (4) presents the method adopted to assess the vulnerability of arcs due to overlooking buildings ki,j,b.
k i , j , b = G V I   B D I L  
where GVI is the geometric vulnerability index obtained for each pair of overlooking buildings along the arc according to Equation (5):
G V I = min L max ( H 1 + H 2 )
where L is the distance between a pair of two overlooking buildings that could vary along the arc (Figure 1) and BDI is the building damage index.
BDI depends on the volume and extension of the debris of collapsed buildings [40]; it has been defined by the authors according to [41]. The materials, technology, and type of structure affect its values. Table 4 lists the adopted criteria.
BDI is assumed equal to 1 if no buildings are along the section.
Finally, the authors defined five vulnerability classes to take into account the effects of street furniture on the arc availability. Table 5 lists the proposed values of ki,j,f.
Each dij value ranges between 0 and 1:1 means the maximum availability, while 0 is the opposite. the obtained dij values define the availability matrix (D) and contribute to the identification of the minimum network with total connectivity at maximum availability that joins all nodes without redundancies. For undirected connected graphs, this network consists of n-1 arcs, where n is the number of nodes [42] with the highest availability values. The best-performing arcs should connect all the identified strategic buildings and road intersections, ensuring the most available acyclic path between them without redundances. The number of arcs that should be disregarded to identify the minimum network is a measure of the network resilience: its entity depends on arcs whose function can be performed by one or more alternative arcs. The minimum network with total connectivity at maximum availability has been identified using an iterative routine written with Visual Basic programming language:
  • all the arcs have been sorted in descending order of dij;
  • the network topology of the first n-1 arcs has been analyzed in order to verify if it was complete (i.e., there was a path between every pair of vertices). If at least one node or strategical building was not included in the identified network, the graph was re-analyzed to modify its configuration and link all the nodes/strategical buildings.
Finally, the path analysis allows the identification of the tracks with decreasing availability and prioritization in journey choices under emergency. The availability of each journey tkl depends on dij of each arc between departure and arrival nodes (i.e., k and l in Equation (6)):
t k l =   d i j
The proposed quantitative methodology that assesses the vulnerability of road sections following an earthquake is innovative and fills a gap in the literature. The holistic approach synthesizes different approaches (i.e., structural, transport, and urban environment) to identify the MUS of Pomezia, because its seismic and urbanistic features are representative of many flat Italian urban centers. The birth of the town is relatively modern: its urban aggregate was built in 1938 during the Pontine marshes redemption, in order to find a city between Rome and the Southern Lazio region (i.e., Latina, Sabaudia, and Pontinia).

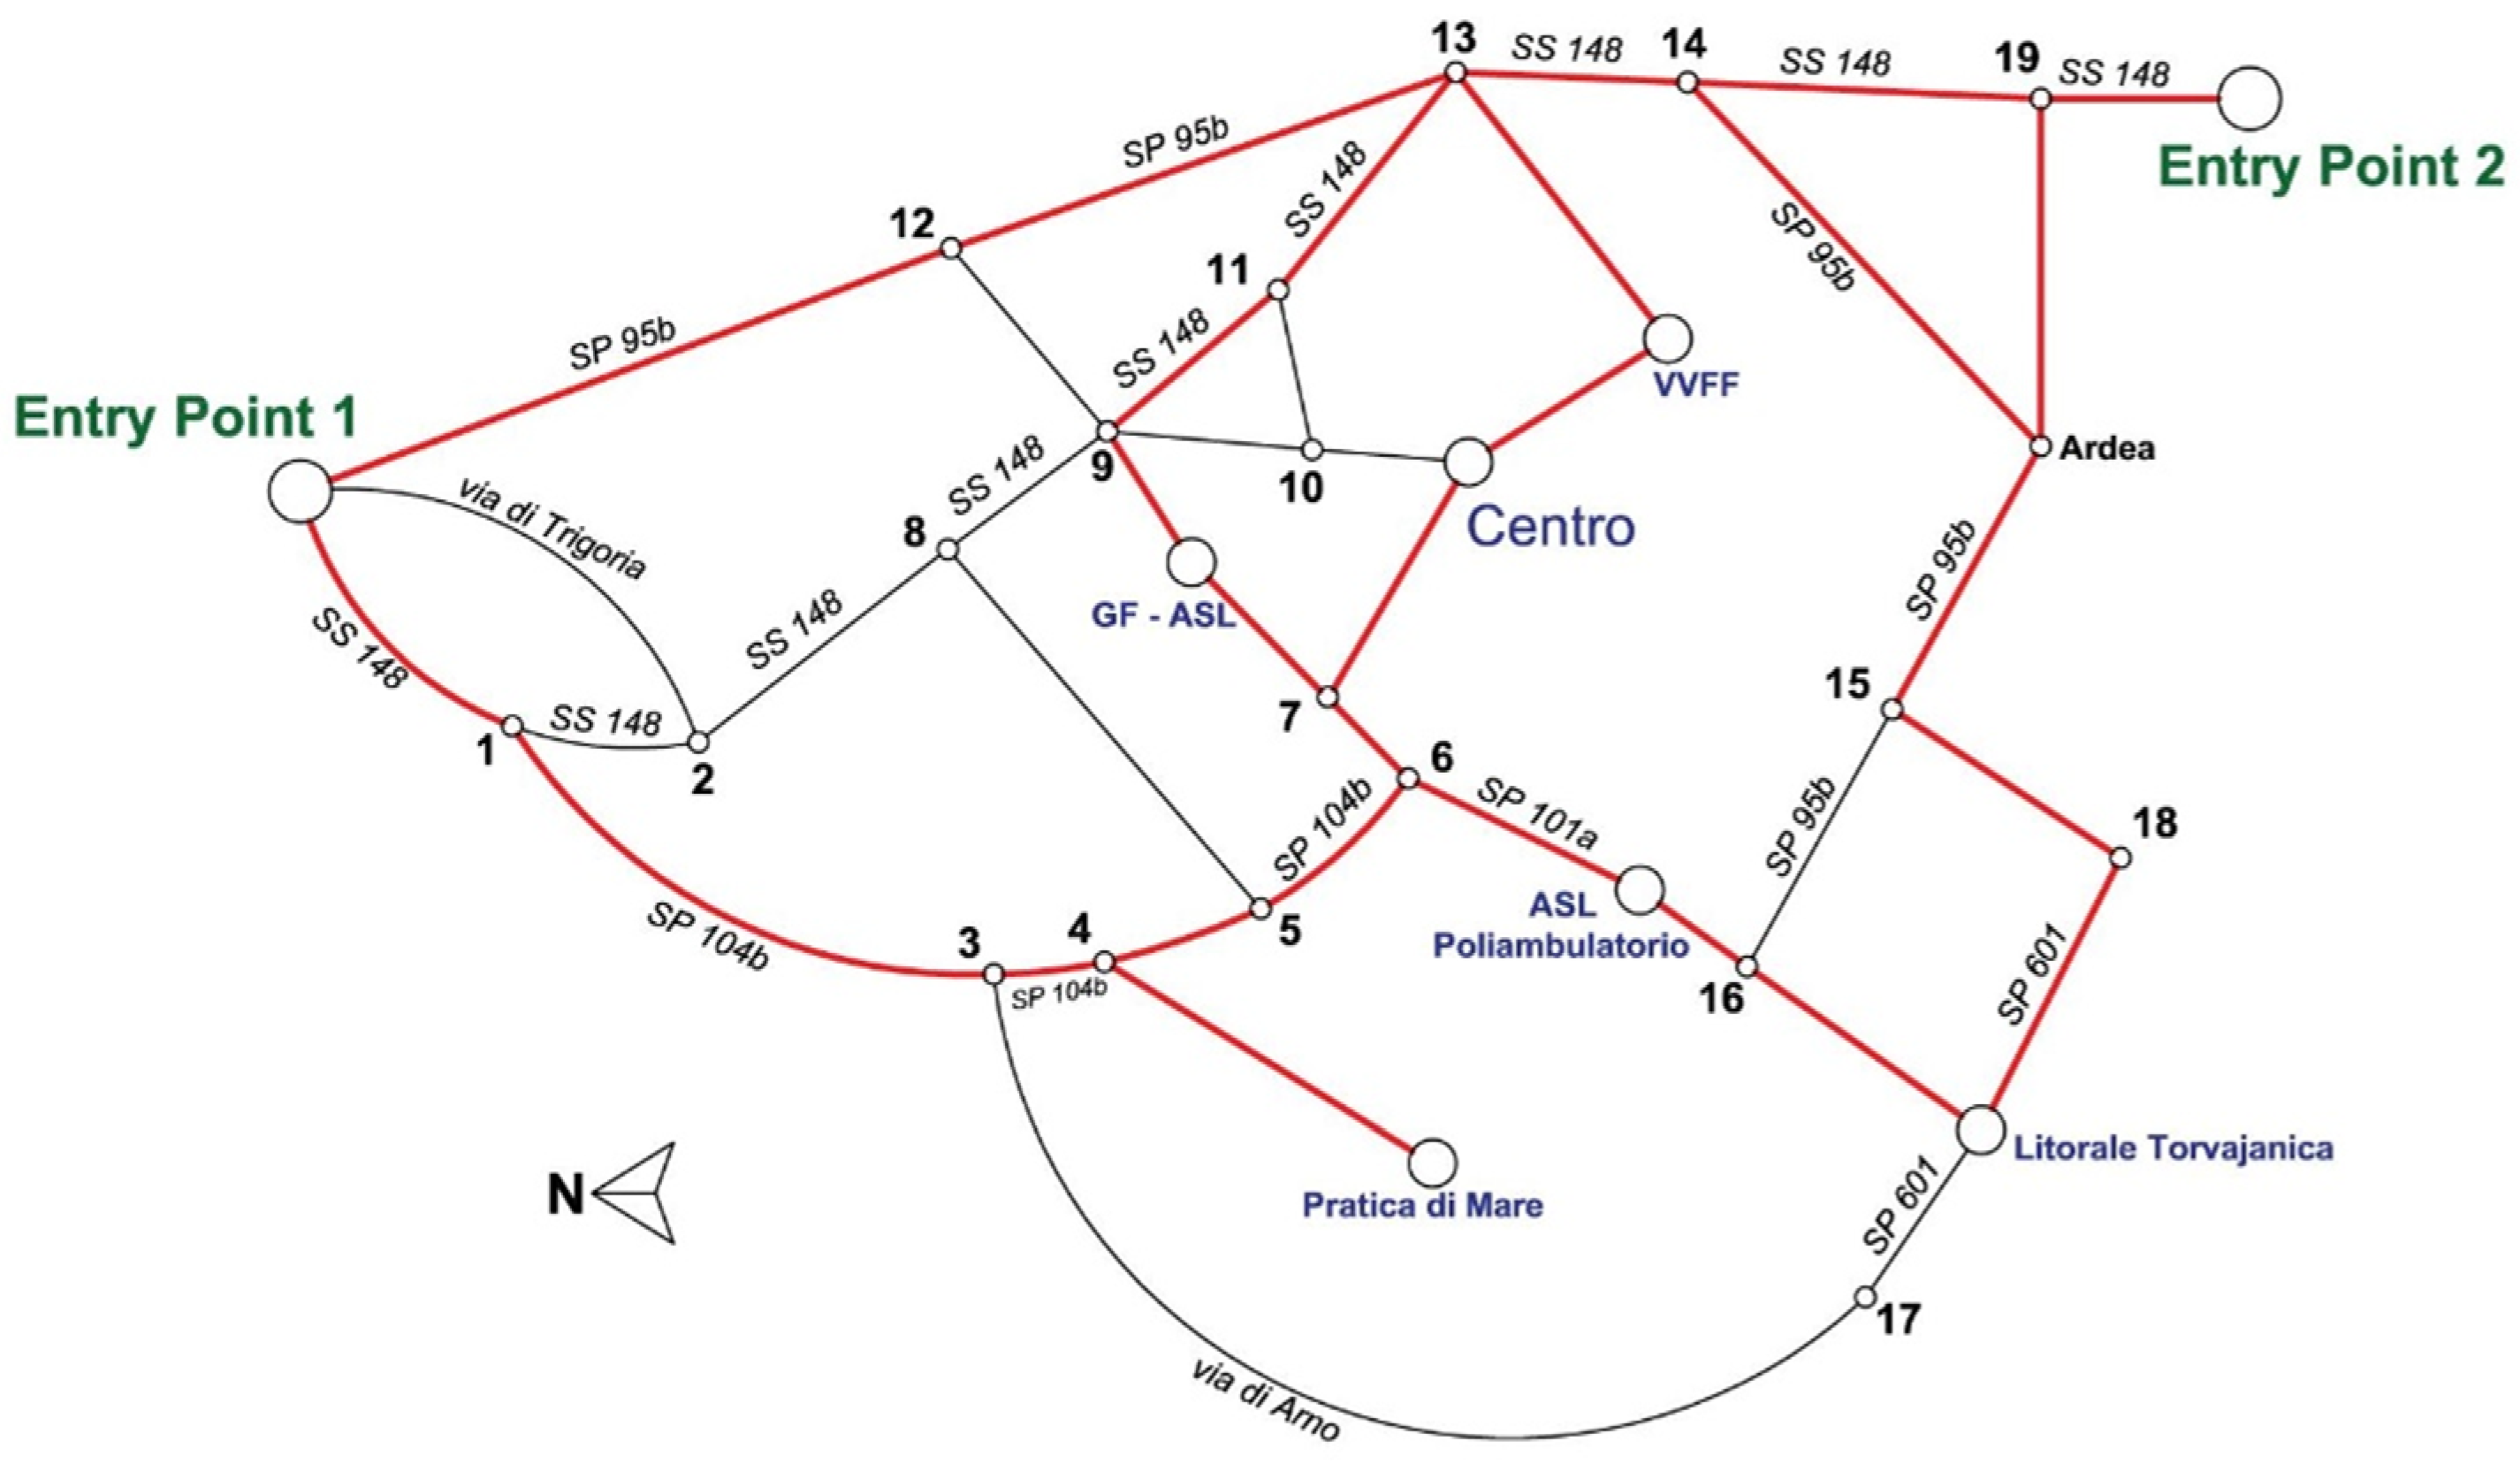
3. Case Study and Results

The implementation of the proposed methodology allows the identification of MUS to safely manage a post-seismic emergency in Pomezia. With regard to the primary strategic buildings, the identified focal areas are:
  • Entry Point 1 (EP1): a safe open space 17 km from Pomezia where logistical support and rescue services from the north could be hosted;
  • Entry Point 2 (EP2): the second headquarters 15 km from Pomezia where logistical support and rescue services from the south could be hosted;
  • GF-ASL: three strategic buildings (i.e., a health unit, a pharmacy, and the board of the Customs corps) are in this area;
  • Centro: there are four strategic buildings (i.e., the town hall, the police office, the board of the local police, and a pharmacy);
  • VVFF: hosts a fire station,
  • ASL: hosts a health facility;
  • Pratica di Mare: a military area where there is an airport;
  • Litorale Torvajanica: includes five strategic buildings (i.e., two pharmacies, two police offices, and a fire station).
The existing road network has been modeled by an undirected graph whose nodes are joined by bidirectional arcs. The most important road infrastructures have been identified on the basis of:
  • geometric characteristics (e.g., carriageway width, and longitudinal slopes);
  • net paths compliant with the width of emergency vehicles: enrolling in curves with small radius should ensure the residual functionality (i.e., availability”) after a seismic event;
  • MUS connection to two peripheral entry points where rescue services would be placed.
Figure 2 shows the m-by-m matrix A, where m (equal to 28) is the number of nodes (i.e., focal areas and road intersections) that compose the graph, while the entries’ sum (i.e., 39) is equal to the arcs of the graph in Figure 3.
The authors surveyed all the urban centers and acquired information through the geolocation of a mobile GPS device that tracked and shared the routes [43]. Figure 3 represents the graph of the overall road network: the focal areas are the big points, while small nodes are road intersections identified by numbers ranging from 1 to 19 and the name Ardea that identifies a town 10 km to the south. Each arc is identified by the name of the existing road.
Given the graph in Figure 3, the minimum network with total connectivity is composed of 27 arcs; two arcs are essential for MUS (i.e., the arc between node 4 and the focal area “Pratica di Mare”, and that between EP2 and node 19). The analysis of the overall network availability gives D in Figure 4. Each non-null entry returns the availability of the arc that joins the nodes.
Sorting in descending order, the availability of the arcs allows the identification of the minimum network. The first 27 arcs identified the highest network availability (Table 6a), but the total network connectivity (i.e., the inclusion of all focal areas and road intersections) should be verified. This first solution does not satisfy the goal of total connectivity because node 10, GF-ASL, and Centro focal areas are not linked. Therefore, the analysis of the graph by parts forced the reduction of more available arcs and added less available ones, both to obtain the minimum network without redundancies and to ensure the total connectivity. Arcs 25, 26, and 27 were substituted by arcs 30, 31, and 36 (red and green cells in Table 6b), respectively.
Therefore, the network in Table 6b ensures the total connectivity because it includes all the focal areas and road intersections. Finally, the tkl values were considered to identify the paths (from the two entry points EP1 and EP2 to the other nodes) that maximize the availability performance of the overall network. The analysis of the journeys identified the most available path for each connection from each EP to the j-th focal area (bold values of tkl in Table 7), with respect to all identified acyclic paths.
Red arcs in Figure 5 compose the minimum network with total connectivity at maximum availability.

4. Discussion

Recent research has concluded that the concept of safety for towns depends on three factors: the town, the urbanization networks, and the risk reduction. Components and strategic elements leading towards an emergency plan should be identified where urbanization infrastructures (e.g., road network) are the primary strategic elements, while buildings are the secondary elements. Preliminary operative choices should localize services and structures essential for the town, identify the existing transport networks and safe areas, and evaluate construction techniques of buildings. Therefore, planning and risk reduction both contribute to safety and health in each urban context because the minimum network with total connectivity at maximum availability is necessary to handle emergencies. The proposed methodology summarizes road, building, and land data to identify the journeys that would be the priority choice of emergency vehicles during an emergency. The vulnerability classes (ki,j,q,m) defined by the authors can be adapted and modified according to different conditions and contexts (e.g., dimension of town, type of settlement, availability of open spaces or safe areas, road network, orography and territorial location, and emergency traffic demand). The defined process to identify the MUS gives the opportunity to be easily adapted to other scenarios. Moreover, the obtained results provided for secondary options when primary ones were not available. The methodology has been implemented to identify the minimum network with total connectivity at maximum availability in Pomezia, a medium-sized Italian town. The iterative process to identify the MUS permitted optimized journeys with an unbiased approach, excluding paths that appeared safe but had problems. In order to obtain an increase in network performance, further analysis could focus on the most fragile arches in a journey from EPs to each focal area. In this way, the available resources are allocated for practical targets, optimizing the use of public finances, scheduling works to improve strategic parts of the graph, and increasing the road network consistency. The available works could reduce both criticalities related to the mobility system (e.g., rehabilitation of road sections, tunnels, and bridges) and vulnerability of buildings facing the journeys (e.g., seismic retrofitting).

5. Conclusions

In recent decades, the evaluation of natural disasters is changing the approach to emergency plans, from a simple prefiguration of the future layout to land management answering fixed objectives. “Emergency services” (e.g., people, goods, and vehicles) need transport infrastructure to reach the disaster site. As such, essential routes should be able to resist any event of crisis to guarantee safe and regular connections. An emergency plan is pivotal to manage a crisis when the municipal response is not sufficient; primary road arcs should be available to oncoming services. The proposed methodology aimed to verify the residual functionality of a strategic road network after a seismic event and to identify the most available journeys accessible to emergency vehicles. It takes into account input data about structural, transport, and urban environments to assess the vulnerability of road sections following an earthquake and plan emergency journeys. The holistic approach combines issues from different subject areas to identify the MUS of Pomezia. The identified network is composed of roads and strategic buildings that ensure emergency management in the post-event phase. This network could be represented by a graph (i.e., a system of nodes and arcs) whose availability depends on the vulnerability of road cross-sections, overlooking buildings, and street furniture (e.g., lighting, vertical signs, and trees) along the arcs. The analytical approach allows the quantification of the redundancy of the network (i.e., the higher the degree of redundancy, the greater the resilience), identifying the best-performing arcs and their alternatives. This then allows planning strategies to improve the current road network consistency. A new hierarchy for the road network has thus been created where the less vulnerable elements are the most important for survival and for continuous road operativity.
The proposed methodology has been implemented to distinguish the minimum network with total connectivity at maximum availability in Pomezia, an urban center located in the Lazio region, south of Rome, Italy. However, the proposal could be used to analyze the road network of bigger urban areas and contribute to define an MUS at a regional scale. These results may be integrated into an emergency plan because they enable the identification of primary (and secondary, with decreasing availability) safe paths and areas for inhabitants and emergency services. On the other hand, further development of the proposed methodology should consider bridge and tunnel road cross-sections that have, so far, not been analyzed.

Author Contributions

Conceptualization, G.G. and L.M.; methodology, L.M.; validation, G.G. and L.M.; formal analysis, G.G.; data curation, L.M.; writing—original draft preparation, G.G. and L.M.; writing—review and editing, G.G. and L.M.; visualization, G.G. All authors have read and agreed to the published version of the manuscript.

Funding

This research received no external funding.

Institutional Review Board Statement

Not applicable.

Informed Consent Statement

Not applicable.

Data Availability Statement

The data presented in this study are available on request from the corresponding author. The data are not publicly available due to confidentiality reasons.

Acknowledgments

The authors thank Eng. Niko Fattori for the identification of the existing road network and cooperation to the develop earlier versions of the methodology.

Conflicts of Interest

The authors declare no conflict of interest.

References

  1. Lawton, P. Tracing the provenance of urbanist ideals: A critical analysis of the Quito papers. Int. J. Urban Reg. Res. 2020, 44, 731–742. [Google Scholar] [CrossRef]
  2. Galiano, G.; Cutini, A. Guida alla Pianificazione Territoriale; Edizioni Efesto: Rome, Italy, 2020; EAN: 9788833812311. [Google Scholar]
  3. Cappuccitti, A. Earthquake, urban form and city planning: Research perspectives. CSE J. City Saf. Energy 2014, 2, 15–27. [Google Scholar]
  4. De Rubeis, A.; Di Mascio, P.; Montanarelli, F.; Moretti, L. Design of a temporary surface-level helipad paved with aluminium mats. Eur. Transp. Trasp. Eur. 2019, 72, 5. [Google Scholar]
  5. Kumar, A. Natural hazards of the Arabian Peninsula: Their causes and possible remediation. In Earth System Processes and Disaster Management; Sinha, R., Ravindra, R., Eds.; Springer: Berlin/Heidelberg, Germany, 2013; pp. 155–180. [Google Scholar]
  6. Forester, J. Pianificazione e Potere. Pratiche e Teorie Interattive del Progetto Urbano, 1st ed.; Dedalo: Bari, Italy, 1998; EAN: 9788822061843. [Google Scholar]
  7. Romano, B. Pianificazione Sostenibile del Territorio, 1st ed.; Verdone: Biella, Italy, 2014. [Google Scholar]
  8. Bertino, G.; Fischer, T.; Puhr, G.; Langergraber, G.; Österreicher, D. Framework Conditions and Strategies for Pop-Up Environments in Urban Planning. Sustainability 2019, 11, 7204. [Google Scholar] [CrossRef] [Green Version]
  9. Morrow, B. Identifying and mapping community vulnerability. Disasters 1999, 23, 1–18. [Google Scholar] [CrossRef] [PubMed]
  10. Bostenaru Dan, M. Decision Making Based on Benefit-Costs Analysis: Costs of Preventive Retrofit versus Costs of Repair after Earthquake Hazards. Sustainability 2018, 10, 1537. [Google Scholar] [CrossRef] [Green Version]
  11. Akadiri, P.O.; Chinyio, E.A.; Olomolaiye, P.O. Design of A Sustainable Building: A Conceptual Framework for Implementing Sustainability in the Building Sector. Buildings 2012, 2, 126–152. [Google Scholar] [CrossRef] [Green Version]
  12. Sucuoğlu, H.; Yakut, A.; Özmen, A.; Kubin, J. Seismic Risk Prioritization and Retrofit Cost Evaluation of Code-Deficient RC Public Buildings in Turkey. Earthq. Spectra 2015, 31, 601–614. [Google Scholar] [CrossRef]
  13. Franchin, P. Methodology for Systemic Seismic Vulnerability Assessment of Buildings, Infrastructures, Networks and Socio-Economic Impacts, SYNER-G Reference Report 1; Publications Office of the European Union: Luxembourg, 2013. [Google Scholar] [CrossRef]
  14. Colavitti, A.M.; Floris, A.; Serra, S. Urban Standards and Ecosystem Services: The Evolution of the Services Planning in Italy from Theory to Practice. Sustainability 2020, 12, 2434. [Google Scholar] [CrossRef] [Green Version]
  15. Cirianni, F.; Fonte, F.; Leonardi, G.; Scopelliti, F. Analysis of Lifelines Transportation Vulnerability. Procedia-Soc. Behav. Sci. 2012, 53, 29–38. [Google Scholar] [CrossRef] [Green Version]
  16. Moretti, L.; Loprencipe, G. Climate change and transport infrastructures: State of the art. Sustainability 2018, 10, 4098. [Google Scholar] [CrossRef] [Green Version]
  17. Solari, D.; Cimellaro, G.P. A comprehensive methodology for the evaluation of infrastructure interdependencies. Urban Resil. Emerg. Response Recovery 2016, 41, 139–223. [Google Scholar]
  18. Li, Z.; Liu, Q. Optimal deployment of emergency rescue stations in an urban transportation corridor. Transportation 2020, 47, 445–473. [Google Scholar] [CrossRef]
  19. Su, D.; Guo, Z.; Liu, B. Traffic function loss of highway lifelines during major natural disasters. In Proceedings of the 4th International Conference on Transportation Engineering, ICTE 2013, Chengdu, China, 19–20 October 2013; pp. 2598–2604. [Google Scholar]
  20. Franchin, P.; Pinto, P.E. Allowing traffic over mainshock-damaged bridges. J. Earthq. Eng. 2009, 13, 585–599. [Google Scholar] [CrossRef]
  21. Indovina, F. Governare la Città con L’urbanistica; Maggiori Editore: Rimini, Italy, 2013. [Google Scholar]
  22. Banba, M.; Shaw, R. Land Use Management in Disaster Risk Reduction. Practice and Cases from a Global Perspective; Springer Japan: Chiyoda-ku, Japan; ISBN 978-4-431-56442-3.
  23. Aragona, S. Ecological resilience and care of the common house to build the landscape of contemporaneity and future scenarios of territories and cities. In New Metropolitan Perspectives. Local Knowledge and Innovation Dynamics towards Territory Attractiveness through the Implementation of Horizon/E2020/Agenda2030; Springer International Publishing: Heidelberg, Germany, 2018; pp. 522–533. ISBN 978-3-319-92099-3. [Google Scholar] [CrossRef]
  24. Italian Parliament. Disposizioni urgenti per il riordino della protezione civile. Decreto-Legge n. 59/2012, 15 May 2012. [Google Scholar]
  25. Muller, J.; Dame, J. Small Town, Great Expectations: Urbanization and Beautification in Leh. South Asia Multidiscip. Acad. J. 2016, 14, 4208. [Google Scholar] [CrossRef] [Green Version]
  26. Iida, Y.; Kurauchi, F.; Shimada, H. Traffic management system against major earthquakes. IATSS Res. 2000, 24, 6–17. [Google Scholar] [CrossRef] [Green Version]
  27. National Academies of Sciences, Engineering, and Medicine. A Guide to Regional Transportation Planning for Disasters, Emergencies, and Significant Events; The National Academies Press: Washington, DC, USA, 2014. [Google Scholar] [CrossRef] [Green Version]
  28. Galiano, G.; Cutini, A. Il pianificatore: Mediatore tra politica e bisogni dei cittadini-uno sguardo all’edilizia pubblica. In Gli Attori del Divenire Urbano, Proceedings of the 1st Congress on Interaction Man-Space-Time, Rome, Italy, 26 November 2015; Efesto: Rome, Italy, 2016; pp. 5–15, ISBN/ISSN: 9788899104801. [Google Scholar]
  29. Forestieri, G.; Marseglia, G.; Galiano, G. Recovery and optimization of a former railway transport track. WIT Trans. Built Environ. 2019, 186, 47–57. [Google Scholar] [CrossRef] [Green Version]
  30. Forestieri, G.; Galiano, G. Sustainable transport network for the urban rehabilitation of an old town in southern Italy. WIT Trans. Built Environ. 2019, 182, 229–239. [Google Scholar] [CrossRef] [Green Version]
  31. Franchin, P.; Lupoi, A.; Pinto, P.E. On the role of road network in reducing human losses after earthquakes. J. Earthq. Eng. 2006, 10, 195–206. [Google Scholar] [CrossRef]
  32. Fabietti, V.; Pozzi, C. The Minimum Urban Structure. Architectural Culture and Society. Space International Conference 2019; Editor SPACE Studies of Planning and Architecture Ltd.: London, UK, 2019; ISBN 9781916284111. [Google Scholar]
  33. Dijkstra, L.; Poelman, H. Cities in Europe—The New OECD-EC Definition. Available online: https://ec.europa.eu/regional_policy/sources/docgener/focus/2012_01_city.pdf (accessed on 7 October 2021).
  34. Ordinanza del Presidente del Consiglio dei Ministri (OPCM) n.3519. Criteri Generali per L’individuazione delle Zone Sismiche e per la Formazione e L’aggiornamento Degli Elenchi delle Medesime Zone. Gazzetta Ufficiale n.108 dell’11 Maggio 2006. Available online: http://www.protezionecivile.gov.it/amministrazione-trasparente/provvedimenti/dettaglio/-/asset_publisher/default/content/opcm-n-3519-del-28-aprile-2006-criteri-generali-per-l-individuazione-delle-zone-sismiche-e-per-la-formazione-e-l-aggiornamento-degli-elenchi-delle-ste (accessed on 4 September 2021). (In Italian)
  35. Guze, S. Graph Theory Approach to Transportation Systems Design and Optimization. TransNav Int. J. Mar. Navig. Saf. Sea Transp. 2014, 8, 571–578. [Google Scholar] [CrossRef] [Green Version]
  36. Thomson, R.C.; Ricardson, D.E. A graph theory approach to road network generalization. In Proceedings of the 17th International Cartographic Conference, Barcelona, Spain, 3–9 September 1995; pp. 1871–1880. [Google Scholar]
  37. Courtat, T.; Gloaguen, C.; Douady, S. Mathematics and morphogenesis of cities: A geometrical approach. Phys. Rev. 2011, E83, 036106. [Google Scholar] [CrossRef] [Green Version]
  38. Argyroudis, S.; Selva, J.; Gehl, P.; Pitilakis, K. Systemic Seismic Risk Assessment of Road Networks Considering Interactions with the Built Environment. Comput.-Aided Civ. Infrastruct. Eng. 2015, 30, 524–540. [Google Scholar] [CrossRef]
  39. Goretti, A.; Sarli, V. Road network and damaged buildings in urban areas: Short and long-term interaction. Bull. Earthq. Eng. 2006, 4, 159–175. [Google Scholar] [CrossRef]
  40. Schweier, C.; Markus, M. Classification of collapsed buildings for fast damage and loss assessment. Bull. Earthq. Eng. 2006, 4, 177–192. [Google Scholar] [CrossRef]
  41. Grünthal, G. Cahiers du Centre Européen de Géodynamique et de Séismologie: Volume 15—European Macroseismic Scale 1998; European Center for Geodynamics and Seismology: Luxembourg, 1998. [Google Scholar]
  42. Jarry, A.; Laugier, A. On the minimum number of edges of two-connected graphs with given diameter. Discret. Math. 2012, 312, 757–762. [Google Scholar] [CrossRef] [Green Version]
  43. Cantisani, G.; Del Serrone, G. Procedure for the identification of existing roads alignment from georeferenced points database. Infrastructures 2021, 6, 2. [Google Scholar] [CrossRef]
Figure 1. Parameters used in calculating GVI.
Sustainability 13 11151 g001
Figure 2. Adjacency matrix (A).
Sustainability 13 11151 g002
Figure 3. Graph of the existing road network.
Sustainability 13 11151 g003
Figure 4. availability matrix (D).
Sustainability 13 11151 g004
Figure 5. Minimum network with total connectivity at maximum availability.
Sustainability 13 11151 g005
Table 1. Vulnerability criteria for embankment cross sections.
CriterionVulnerability Class
Very LowLowModerateHighVery High
embankment height (m)<11–33–5>5 with berm>5 without berm
natural soil slope (%)<1010–1515–20>20 with benching>20 without benching
maximum side slope (%)<2/3=2/3=2/3>2/3>2/3
shoulder width (m)<0.50.5–10.5–1>1> 1
natural soilsiltclaygranular soilfractured rockintact rock
Table 2. Vulnerability criteria for trench cross sections.
CriterionVulnerability Class
Very LowLowModerateHighVery High
trench height (m)<11–33–66–9>9
maximum side slope (%)<1/1=1/1=1/1>1/1 with protection>1/1 without protection
shoulder width (m)<0.50.5–10.5–1>1>1
natural soilsiltclaygranular soilfractured rockintact rock
Table 3. Vulnerability classes for road cross sections.
ki,j,sMost Frequent or Best Vulnerability Class
0.2very high
0.4high
0.6moderate
0.8low
1very low
Table 4. BDI values for different types of structure.
Type of StructureStructure TypeBDI
0.15–0.250.35–0.450.55–0.650.75–0.850.95–1
Masonrydry masonryx
simple stone x
unreinforced with reinforced concrete floors x
massive stone/reinforced or confined x
Reinforced concretestructures without earthquake-resistant design (ERD) x
structures with moderate level of ERD x
structures with high level of ERD x
Steel structures x
Timber structures -x
Table 5. Vulnerability classes for street furniture.
Scenarioki,j,f
furniture’s collapse occupies the carriageway and disrupts circulation0.2
furniture’s collapse occupies a large part of carriageway permitting only one-way circulation0.4
furniture’s collapse occupies only shoulders0.6
furniture’s collapse occupies only road margins0.8
no effects of furniture’s collapse or no furniture on the road1.0
Table 6. Descending availability of arcs. (a) Theoretical highest availability network (incomplete); (b) effective highest availability network (complete).
#ArcAvailability #ArcAvailability
1EP1–120.999 1EP1–120.999
21–20.999 21–20.999
31–30.999 31–30.999
43–40.999 43–40.999
54–50.999 54–50.999
65–60.999 65–60.999
76–70.999 76–70.999
814–190.999 814–190.999
9EPZ–190.999 9EPZ–190.999
10EP1–10.999 10EP1–10.999
114–Pratica di Mare0.999 114–Pratica di Mare0.999
126–ASL0.999 126–ASL0.999
1316–ASL0.999 1316–ASL0.999
1411–130.998 Sustainability 13 11151 i0011411–130.998
1513–140.9951513–140.995
162–80.990 162–80.990
1713–VVF0.990 1713–VVF0.990
1814–Ardea0.990 1814–Ardea0.990
1915–160.990 1915–160.990
20Ardea–150.980 20Ardea–150.980
2115–180.980 2115–180.980
2216–Litorale Torvajanica0.980 2216–Litorale Torvajanica0.980
238–90.970 238–90.970
24EP1–20.930 24EP1–20.930
259–120.930 259–120.930
26Ardea–190.930 26Ardea–190.930
273–170.900 273–170.900
289–110.900 289–110.900
2912–130.850 2912–130.850
307–GF,ASL0.800 307–GF,ASL0.800
317–Centro0.800 317–Centro0.800
3217–Litorale Torvajanica0.750 3217–Litorale Torvajanica0.750
33Litorale Torvajanica–180.750 33Litorale Torvajanica–180.750
345–80.700 345–80.700
35GF,ASL–90.600 35GF,ASL–90.600
3610–110.500 3610–110.500
37Centro–VVFF0.300 37Centro–VVFF0.300
389–100.200 389–100.200
3910–Centro 0.200a3910–Centro 0.200b
Table 7. Path analysis from EPs.
Departure Entry PointDestination Focal AreaIntermediate Nodestkl
EP1Pratica di Mare1-3-40.867
2-8-5-40.017
12-13-14-19-Ardea-15-16-ASL-6-5-40.003
GF,ASL1-3-4-5-6-70.135
1-3-4-5-8-90.004
1-2-8-5-6-70.011
1-2-8-90.017
12-90.030
12-13-11-90.003
VVF1-2-8-9-11-130.010
12-130.086
1-3-4-5-6-ASL-16-15-Ardea-14-130.020
Centro1-3-4-5-6-70.129
1-2-8-9-GF-70.0004
1-2-8-9-11-13-VVF0.001
12-9-GF-70.001
12-9-11-13-VVF0.001
ASL1-3-4-5-60.711
1-2-8-9-11-13-14-Ardea-15-160.001
12-13-14-Ardea-15-160.009
Litorale Torvajanica1-3-170.030
1-3-4-5-6-ASL-160.170
12-13-14-Ardea-15-160.003
12-13-14-Ardea-15-180.001
EP2Litorale Torvajanica19-Ardea-15-160.014
19-Ardea-15-180.005
VVF19-14-130.301
19-Ardea-14-130.032
Centro19-14-13-VVF0.017
19-Ardea-15-16-ASL-6-70.004
ASL19-Ardea-15-160.035
19-14-Ardea-15-160.080
GF,ASL19-14-Ardea-15-16-ASL-6-70.010
19-14-13-12-90.003
19-14-13-11-90.012
Pratica di Mare19-14-Ardea-15-16-ASL-6-5-40.060
Publisher’s Note: MDPI stays neutral with regard to jurisdictional claims in published maps and institutional affiliations.

