Abstract
The present study focuses on the valorisation of winery industry wastes through slow pyrolysis of exhausted grape marc (EGM). The optimal pyrolysis parameters were firstly identified by small scale experiments carried out using thermogravimetric analysis. Nine pyrolysis temperatures were tested and their influence on the decomposition of the EGM residue and biochar yield was evaluated. Then, biochar production was conducted in a pilot plant at three chosen temperatures (450, 500 and 550 °C) at which the biochar was shown to be stable. The effects of biochar application to soil with respect to plant (ryegrass) growth was also evaluated. Pyrolysis of EGM at the 450–550 °C temperature range has been shown to generate thermally stable and nutrient-rich biochars, but only the biochar produced at 450 °C showed a marked benefit effect of ryegrass growth.
1. Introduction
Grapes are among the most cultivated fruit crops worldwide [1]. One-third of the grape total production is intended for the wine industry [2,3,4]. France is among the leading producers of wine in the world. In 2020, France was ranked as the second largest wine-producing country, just after Italy, with an estimated volume of 46.6 million hectolitres [5,6]. Considering the high volumes produced every year, the wine industry can generate thousands of tons of solid residues, which raises serious environmental and economic issues [7]. Throughout the winemaking process, a large amount of solid residue, referred to as grape marc (pomace), is generated and it represents 10–30 wt. % of the grape fresh weight [3]. This residue generally consists of skins, seeds, stalks and moisture. In the red wine making process, the grape marc residue is produced after fermentation and pressing, and it contains a valuable alcoholic fraction [4]. As a traditional and reliable way to recover the alcoholic fraction (polyphenols), fermented grape marc undergoes a distillation process, which results in a final solid residue known as exhausted grape marc [8]. The chemical composition of grape marc (similarly to exhausted grape marc) is very diverse, consisting mainly of fibres (cellulose, hemicellulose and lignin), polyphenols, lipids, proteins, oligosaccharides and minerals [9]. Such a rich and complex composition holds great potential for further valorisation through value-added processing, including the thermochemical and biochemical processes [3]. Thermal conversion technologies for energy recovery from grape marc include combustion, gasification, hydrothermal carbonisation, torrefaction and pyrolysis [10]. Pyrolysis is a thermal decomposition process in oxygen-free or oxygen-poor conditions at temperatures of around 400–700 °C [11]. Pyrolysis yields a mix of gas, liquid (tar or biooil) and solid (biochar) products, depending on the operating conditions (heating rate, vapours/solid residence time, pyrolysis temperature, pyrolysis atmosphere) and the origin of the feedstocks [11]. Low pyrolysis temperatures and low heating rates are generally required when the biochar is the product of interest. The pyrolysis of exhausted grape marc could provide a sustainable approach to managing waste from the wine industry. From this standpoint, several studies were carried out to explore optimal thermal conversion pathways of winery wastes and evaluate their potential for the recovery of energy and high-added value compounds [12,13,14,15,16,17,18,19,20,21,22,23,24]. Encinar et al. [12] investigated the influence of the pyrolysis temperature and feedstocks’ particle size on the quality of the biochars produced from grape marc, using a batch pyrolysis system with nitrogen as a carrier gas. They found that increasing the temperature yields an increase in the fixed carbon content, gases produced and ash content. Particle size has a negligible effect on the properties of the biochars. Demiral et al. [13] investigated changes in pyrolysis product yields by varying the operating conditions, including the temperature, heating rate and nitrogen gas flow. Encinar et al. also reported that an increase in the pyrolysis temperature led to higher liquid and gas yields. Marculescu and Ciuta [14] studied the optimal pyrolysis conditions for grape marc treatment using experimental and modelling techniques. The study revealed that the pyrolysis temperature had a significant impact on products distribution and energy content. An optimum treatment temperature for the maximum net energy content of the combined pyrolysis products (char, liquid and gas) was identified to be 550 °C. As mentioned before, the pyrolysis products range from solid to liquid to gaseous compounds, and all are considered as valuable bio-products. Some of these products can be used directly, as a feedstock for a further industrial process or can be converted into energy. Charcoal as a bio-product has potential for use in the energy, industrial and agricultural sectors [25,26,27]. A significant increase in the agricultural use of biochar has already been recorded since 2015 [28]. Agricultural applications include soil amendment, composting, carriers for fertilisers, silage additives and feed additives [28]. Biochar as a soil amendment has received considerable attention because of its carbon sequestration potential and ability to enhance soil productivity [29,30,31,32,33]. Compared to non-waste feedstocks (e.g., woody biomass), biochar production from exhausted grape marc for agronomic uses has not been widely explored and only few studies reported uses of biochar in soil amendment and connected applications.
The main motivations for this study were (1) to evaluate the potential of grape marc waste as a feedstock for biochar production, (2) to examine the effects of pyrolysis temperature on the physicochemical properties of the produced biochars and (3) to consider the potential agronomic implications of applying biochar to soil.
2. Materials and Methods
2.1. Feedstock
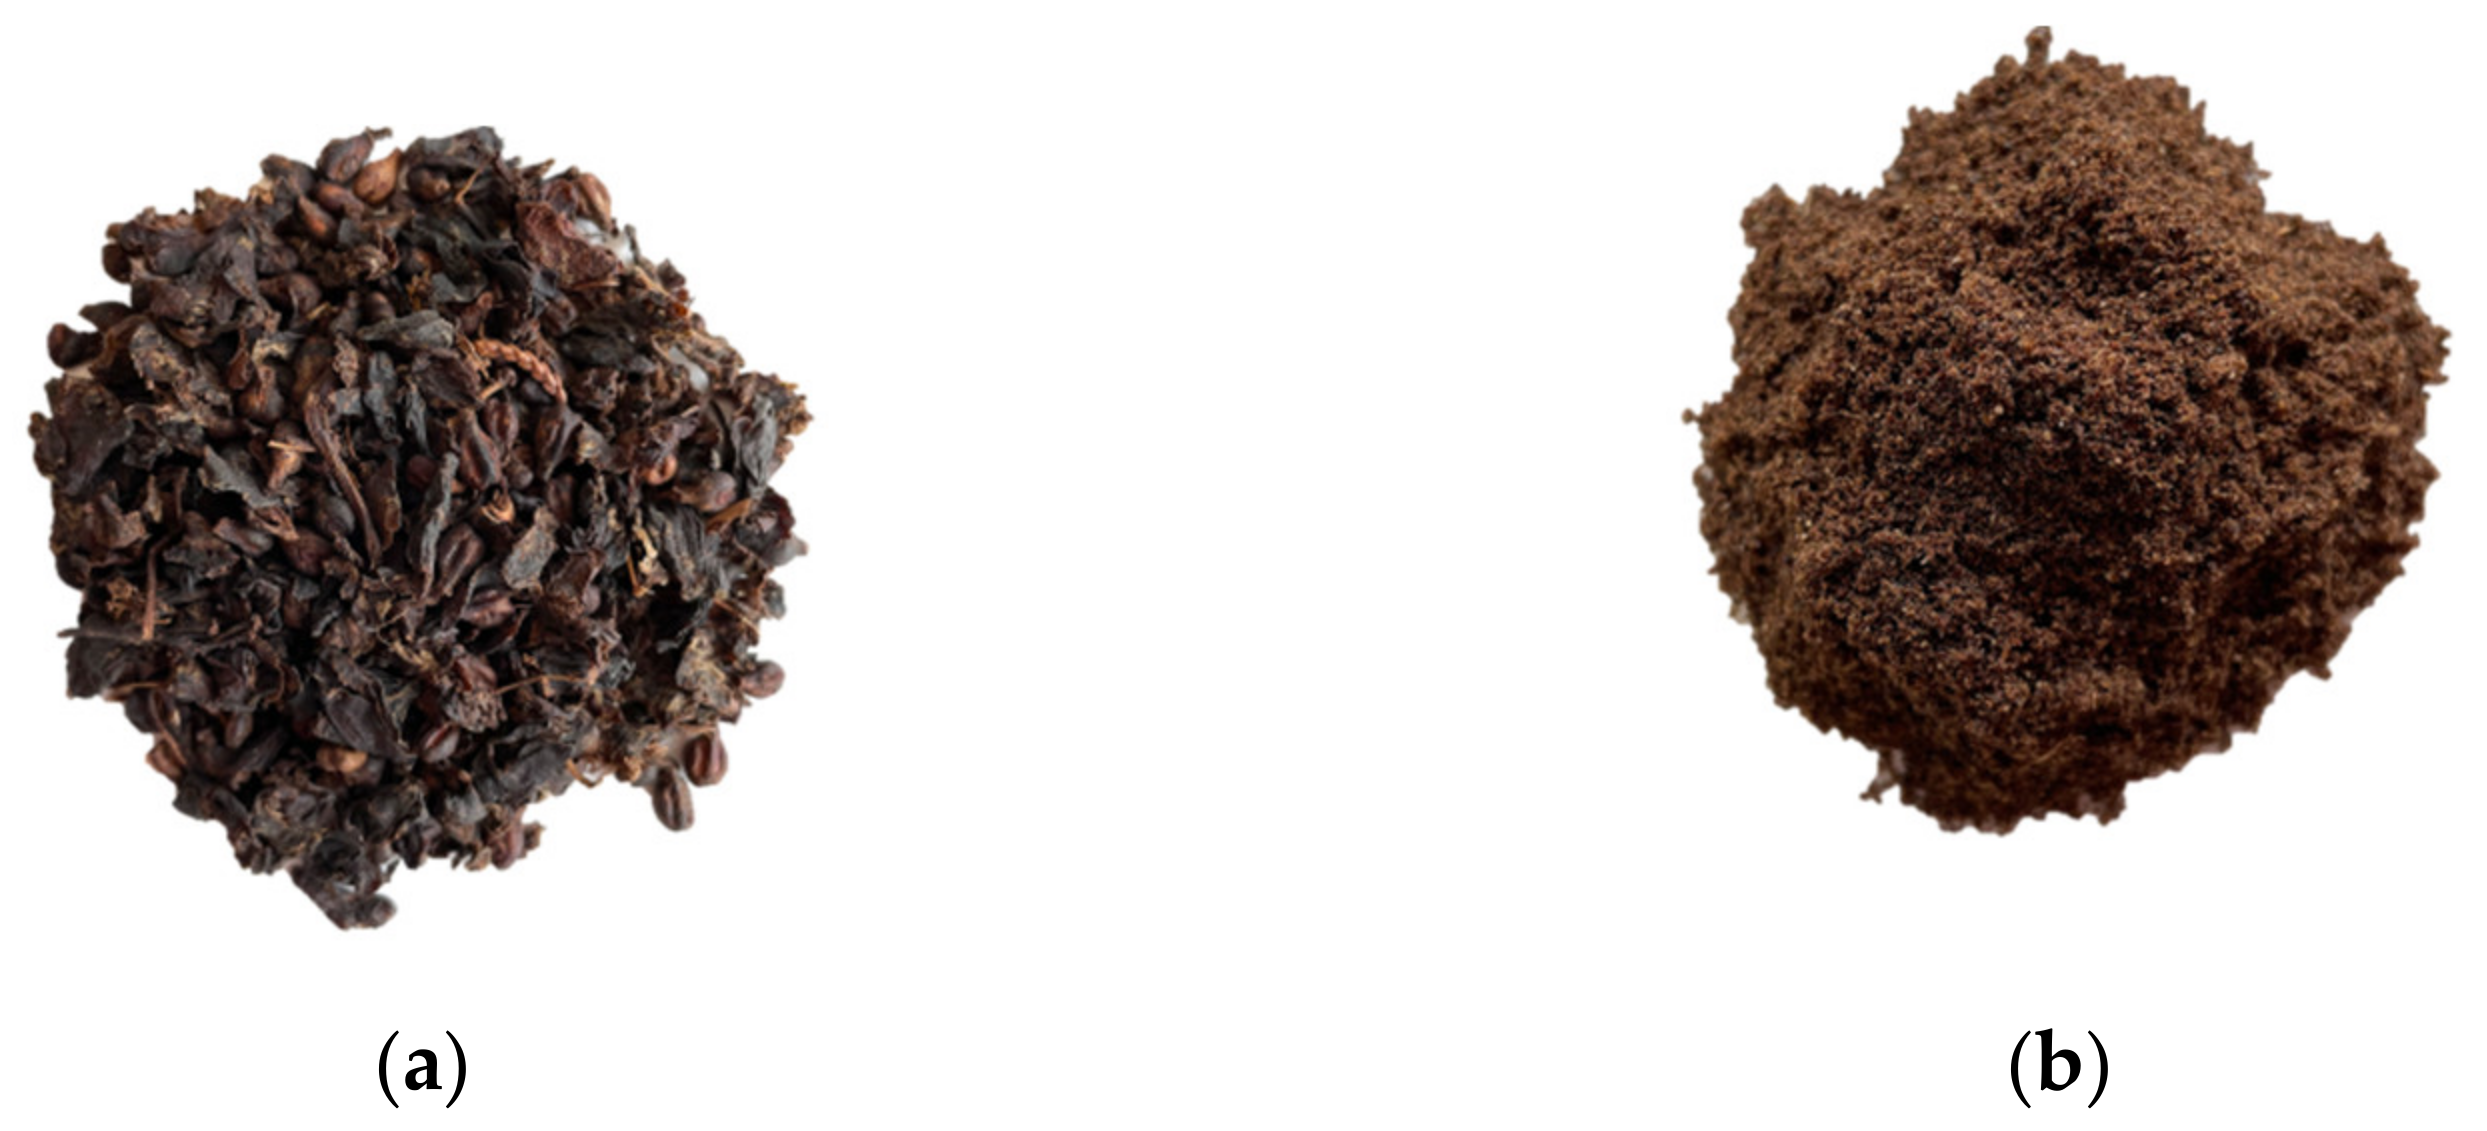
Exhausted Grape Marc (EGM), a distillery waste or an agro-industrial by-product, was collected from a distillery industry located in the Alsace region (France). An EGM sample was prepared following the NF EN ISO 14780 standard. An EGM lot (batch) was mixed by turning and piling it upside-down several times, then different subsamples were arbitrarily taken and gathered from different spots of the homogenised EGM lot. After mixing, one portion of the new subsample was dried at 60 °C for 24 h, ground using a laboratory batch mill (IKA Mod. A11 Basic analytical mill, IKA, Staufen im Breisgau, Germany), thoroughly mixed and sieved to obtain particle sizes in the range of 250 to 400 μm. The dried milled sample was stored in a sealed container. Before laboratory analysis, representative subsamples were weighed and stored into another set of sealed containers. The pictures of (a) raw and (c) dried milled EGM samples are shown in Figure 1.

Figure 1.
Pictures of (a) raw and (b) dried milled (250–400 µm) EGM samples.
2.2. Feedstock Analysis
Characterisation of EGM is important to assess its properties and quality as a feedstock for biochar production. A series of physicochemical characterisation were performed, including thermogravimetric analysis (TGA), elemental analysis (C, N, H, O and S), Higher Heating Value (HHV) measurements and mineral and chemical composition analysis.
A non-isothermal pyrolysis experiment of EGM was carried out in a thermogravimetric analyser (thermo-balance, Mettler Toledo TGA 850). Prior to experiment, an EGM sample was dried overnight in a ventilated oven at 105 °C under air. A typical run was carried out as follows: about 15 mg of EGM sample was weighed into an open-type alumina crucible (70 μL) and introduced into the TGA furnace. The temperature was raised from room temperature up to 900 °C at a heating rate of 5 °C min−1 under 100 mL min−1 nitrogen and maintained at this temperature for 1h. Then, the atmosphere was switched to synthetic air (100 mL min−1) for 60 min.
The hemicellulose, cellulose and lignin contents were determined, by Cirad laboratory, according to the Van Soest acid detergent fibre method [34].
The total carbon (C), nitrogen (N), Sulphur (S), hydrogen (H) and oxygen (O) contents measurements were analysed by Filab laboratory, according to NF EN ISO 16948 and NF EN ISO 16994 standards.
The inorganic composition (Mg, Na, K, Ca, Si, Al, P, Fe and Cu contents) was analysed using inductively coupled plasma atomic emission spectroscopy (ICP-AES), provided by Filab laboratory (Accreditation COFRAC ISO 17025).
The Higher Heating Value (HHV) (MJ kg−1, dry basis) of EGM sample was measured on a dry basis in a calorimeter bomb according to the standard NF EN ISO 18125 by Eurofins laboratory. The Lower Heating Value LHV (MJ kg−1, dry basis) was calculated based on the measured HHV (MJ kg−1, dry basis) using Equation (1) [11].
2.3. Pyrolysis
Slow pyrolysis experiments were conducted in both a thermobalance and a pilot plant pyrolizer. In TGA experiments, a very low heating rate (5 °C min−1) and a very small sample size (about 15 mg) were used to minimise the effects of secondary reactions and heat and mass transfer (optimal pyrolysis conditions) [35]. In the pilot plant experiments, a larger size sample was used (about 1.5 kg).
2.3.1. TGA Study
TGA experiments were conducted, based on ASTM D7582-15 protocol, in a TGA/DSC 1 LF1100 thermogravimetric analyser (Mettler-Toledo, Columbus, OH, USA), following two stages: in a first stage, a pyrolysis step was performed by heating under nitrogen from an ambient temperature up to the pyrolysis temperature (350, 400, 450, 475, 500, 525, 550, 575 and 600 °C), then holding for 90 min and finally heating from pyrolysis temperature to 900 °C. In a second stage, a combustion step was carried out by switching the gas environment to synthetic air and holding at 900 °C for 60 min. For the whole run, a constant heating rate of 5 °C min−1 and a constant gas flow rate of 100 mL min−1 were maintained. Prior to TGA experiments, the sample was dried overnight in a ventilated oven at 105 °C under air.
2.3.2. Pyrolysis Experiments
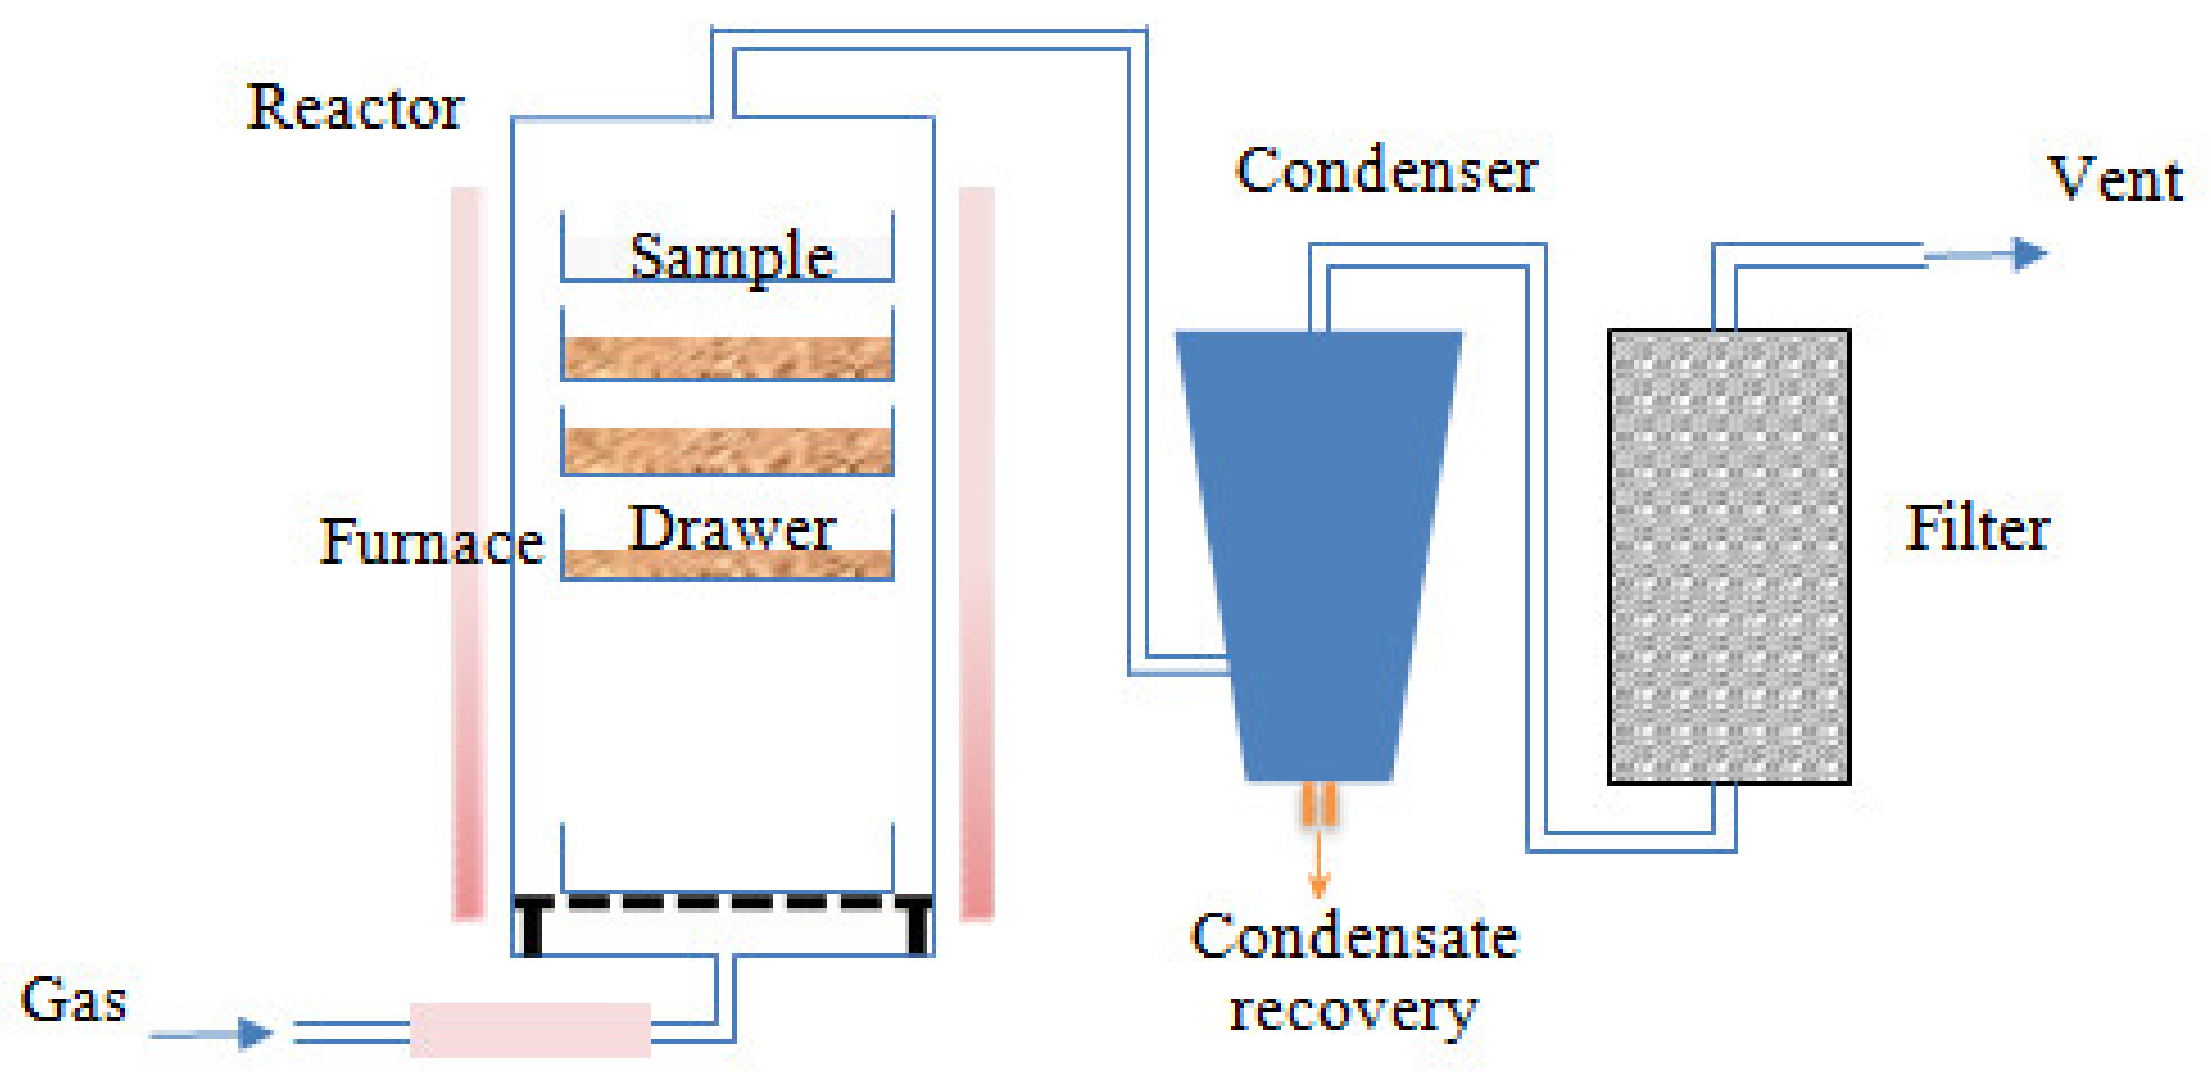
Pyrolysis experiments were performed by an external, accredited laboratory RAPSODEE-UMR CNRS 5302. Before each pyrolysis test, the raw EGM sample was dried at 105 °C for 24 h. Dried grape marc was deposited onto the different drawers and loaded into the reactor. The reactor was purged for 10 min with nitrogen to remove the air. Pyrolysis experiments were conducted in a crossed fixed bed reactor. As illustrated in Figure 2, the reactor consisted of several drawers, disposed inside an electric vertical furnace. The temperature profiles in each drawer were instantly recorded using a thermocouple. The inert atmosphere gas, N2, was fed from the bottom at a flow rate of 10 L min−1, heated along the lower part of the reactor and crossing the sample bed. This method would ensure a good thermal contact between the gas and the particles of the sample, while taking the gas products away from the bed. The temperature was raised at a constant heating rate of 10 °C min-1 to the required hold temperature (450, 500 and 550 °C), and was maintained for 1h before cooling. The evolved gases reached the condensing system carried by the nitrogen inert gas. The condensed gas fraction (biooil) was recovered in a liquid collector after moving down by gravity. The non-condensable gases were sent into a filter before reaching the atmosphere. After completing the pyrolysis process, the reactor was naturally cooled under N2 flow. The solid residue fraction (biochar) was recovered at an ambient temperature. The biochar samples were immediately stored in sealed polyethylene containers. Liquid and solid yields were directly obtained by weight. The gas yield was calculated using the following balance: Gas yield = 100% − (biochar yield + biooil yield).
Figure 2.
Pilot plant pyrolizer.
The biochar samples obtained at the three pyrolysis temperatures were labelled as EGM450, EGM500 and EGM550, respectively.
2.4. Biochar Characterisation
Biochars derived from pyrolysis were characterised using different techniques, including TGA, elemental analysis, X-ray diffraction analysis (XRD), Scanning Electron Microscopy (SEM), Energy Dispersive X-ray spectrometry (EDX), CO2 adsorption analysis and pH measurement. Before analysis, representative samples of the different biochars were ground by hand using a mortar and pestle. Ground samples were sieved to a uniform size fraction of 250–400 μm and stored in sealed containers until use.
Proximate analysis was conducted in a TGA/DSC 1 LF1100 thermogravimetric analyser (Mettler-Toledo, Columbus, OH, USA), according to the ASTM D7582-15 standard, whereby samples were heated from ambient to 900 °C in a N2 atmosphere, after which air was introduced. Weight loss up to 110 °C represents moisture content, and between 110 and 900 °C, volatile matter content. The residue remaining after combustion in air at 900 °C represents the ash fraction. Fixed carbon content was determined by difference. Before analysis, biochar samples were dried at 105 °C overnight.
Surface area and porosity measurements were carried out using Micromeritics ASAP2420 equipment (Norcross, GA, USA). Prior to analysis, the biochar samples were degassed at 250 °C under vacuum for 12 h to remove surface water and volatile organic species. Analysis was carried out using CO2 adsorption at 0 °C, with temperature control being achieved with an ice-water bath. Adsorption was carried out up to a relative pressure (P/P°) of 0.03 to examine the micropore region. Pore size distribution for the biochar was determined using the Density Functional Theory (DFT) method. The mean pore size was estimated from the pore size distribution data. The micropore volume was determined according to the Dubinin–Radushkevich equation.
SEM analysis was carried out on a JSM 7900 JOEL microscope equipped with an energy dispersive X-ray analysis spectrometer. SEM images were acquired at 5 kV accelerating voltage, while SEM-EDX microanalysis were conducted at 15 kV accelerating voltage. Prior to the observations, the samples were adhered to a specimen stub with carbon-based adhesive tape, then carbon coating was applied by sputtering to ensure high electrical conductivity of the biochar sample.
X-ray diffraction analysis was conducted using a PANalytical MPD X’Pert Pro diffractometer (Eindhoven, The Netherlands) operating with Cu K α radiation, λ = 0.15406 nm at 40 mA and 45 kV. Data were recorded at room temperature, applying a 2-theta scanning range of 10–70°, and a step size of 0.017° with a scan step time of 220 s. Data processing was then carried out using High Score software. The different mineralogical phases were identified according to the Joint Committee on Powder Diffraction Standards (JCPDS) database.
Biochar pH was measured by mixing 1 g of biochar sample with 10 mL of deionised water. After 1 h of stirring, samples were allowed to stand for 60 min and then pH was measured using a calomel electrode-glass electrode system. Before pH measurements, the pH meter was calibrated using buffers of pH 4, 7 and 10.
Quantification of total C, N and H elements was carried out, by Eurofins laboratory, according to the NF EN ISO 17294-2 standard. S content was determined separately according to NF EN ISO 16994 standard. O content was calculated by difference, using Equation (2) [11].
where Ash, C, H, N and S are, respectively ash, carbon, hydrogen, nitrogen and sulfur content (wt. %, dry basis).
Analysis of Al, Ca, Fe, K, Mg, Na, P, Si, As and Cr elements was conducted, by Eurofins laboratory, according to DIN EN ISO 17294-2 (E29): 2017-0 standard.
2.5. Plant Growth Study
The influence of biochar on plant growth was assessed using EGM450, EGM500 and EGM550 biochars. The microculture technique was applied as described by Lombaert [36]. The Italian ryegrass, used as a model plant, was cultivated in pots containing 1.18 kg of dry soil with a seeding density of 1.2 g pot−1 (Table 1). A loamy-sand soil, with a sand content of 50% and a pH value of 7.8, was used. Regulation ensured a daytime temperature of 25 °C and a night temperature of 20 °C. During cultivation, the soil humidity was maintained between 70 and 80%. Plant growth experiments were conducted using the following two modalities: the first modality corresponds to the control samples by adding mineral K fertiliser to ensure 50 U K2O (1 unit corresponds to 1 kg K2O ha−1). The second modality corresponds to the use of biochars to provide the same amount of K (1.77 g pot−1 for EGM 450, 1.46 g pot−1 for EGM500 and 1.50 g pot−1 for EGM 550, respectively). Biochar application amounts were calculated according to mineral K content contained in the biochar (Table 2).The two modality tests were replicated 4 times and received additional fertilisation during the ryegrass growing (10 mL of 109.86 g L−1 NaH2PO4·2H2O solution, 10 mL of 73.75 g L−1 Ca(NO3)2·4H2O solution and 10 mL of solution containing 0.450 g L−1 FeSO4·7H2O, 0.452 g L−1 MnSO4·H2O, 0.202 g L−1 ZnSO4·7H2O, 0.189 g L−1 CuSO4·5H2O, 0.278 g L−1 Na2B4O7·10H2O and 0.013 g L−1 (NH4)6Mo7O24·4H2O and weekly nutritive solution (20 mL of 5.65 g L−1 NH4NO3, 5.33 g L−1 Mg(NO3)2·6H2O and 2.06 g L−1 (NH4)2SO4). Ryegrass was harvested at 4 weeks. The dry weight contents of the aerial part of the plant were measured to evaluate the impact of biochar amendment on plant growth.

Table 1.
Plant growth experiments.
3. Results and Discussion
3.1. Thermo-Chemical Properties of EGM
Table 2 reports the results of the characterisation analyses of exhausted grape marc feedstock. The characterisation results are in line with the values found in the literature. The HHV and LHV values of EGM fall within the expected range for grape marc feedstocks. The HHV and LHV were assessed to about 23 and 21 MJ kg−1, respectively. The macromolecular organic composition data show that EGM was richer in lignin (42 wt. %) than in cellulose (15 wt. %) and hemicellulose (5 wt. %). The high lignin content measured in the EGM sample may lead to a higher biochar yield [35].
The grape marc feedstock had a high carbon content, with lower amounts of oxygen, hydrogen and nitrogen. Mineral analysis indicates that the Ca, P and K contents in EGM are relatively high, with a value of a few thousands of ppm, which is in the classical range found for grape marc feedstocks. In the case of Al, Fe, Mg and Si, the values measured were higher than those found in the literature [8,21]. Depending on the grape marc sources, the soil composition of the Alsatian vineyard, the harvest and collection practices, the grape harvesting age, the handling operations and the wine-making process, a variability of mineral concentrations in exhausted grape marc can be expected. The high amounts of silicon, aluminium, iron and magnesium derive from the composition of the soil. Silicon, aluminium and iron tend to accumulate in the seeds fraction of the exhausted grape marcs and that constituted a part of the biomass feedstock.
The TG and DTG (differential thermogravimetric analysis) curves, relative to the thermal decomposition of grape marc under nitrogen, are shown in Figure 3 (the isothermal oxidation step has been omitted). The TG curve shows that the pyrolysis of grape marc is a three-step thermal decomposition process; the first weight loss at a temperature below 180 °C relates to residual moisture (dehydration stage). The second decomposition step (devolatilization or primary pyrolysis), in the temperature range of 180 to approximately 483 °C, corresponds to the loss of organic volatiles. At this temperature range, exhausted grape marc decomposes into char (primary char), condensable gases (vapours and precursors to bio-oil) and non-condensable gases. Finally, the third step (secondary pyrolysis), at a higher temperature (>500 °C), which is characterised by low and continuous mass loss, corresponds to the slow charring process of the solid residue [18,22,35,37].
Figure 3.
TG and DTG curves of EGM.
The proximate analysis of the EGM sample (Table 2) gave a fixed carbon content of 22 wt. %, a volatile matter content of 72 wt. % and an ash content of 6 wt. %. It is clearly seen that exhausted grape marc residue contains more ash content and produces more fixed carbon than woody feedstocks [38].
The DTG curve of the EGM sample (Figure 3) shows a single peak with three shoulders (small plateau): the lower temperature shoulders at around 220 and 270 °C, represents the decomposition of low molecular weight sugars [39] and hemicellulose, respectively. The peak at 323 °C, where the maximum rate of decomposition occurs, was assigned to the degradation of cellulose [19,22]. The higher temperature shoulder at around 400 °C was attributed to the temperature of maximum decomposition of lignin [35].
Table 2.
Analysis and comparison of main properties of grape marc feedstocks.
Table 2.
Analysis and comparison of main properties of grape marc feedstocks.
| Parameter | Present Study | Literature 1 | Reference |
|---|---|---|---|
| Energy properties (MJ kg−1, dry basis) | |||
| HHV | 22.74 | 17.20–22.06 | [3,8,10,12,14,19] |
| LHV | 21.39 | 16.40–20.50 | [3,8,10,12,14,19] |
| CHONS analysis (wt. %, dry basis) | |||
| C | 49 | 43–54.90 | [3,8,10,12,14,21] |
| H | 6.39 | 5.56–9.28 | [3,8,10,12,14,21] |
| O | 37 | 30.40–45.50 | [3,8,10,12,14,21] |
| N | 2 | 0.65–2.59 | [3,8,10,12,14,21] |
| S | 0.12 | 0.11–1.24 | [3,8,10,12,14,21] |
| Mineral composition (mg kg−1, dry basis) | |||
| Al | 503 | 50 | [21] |
| Ca | 6409 | 6220 | [21] |
| Fe | 478 | 110 | [21] |
| Mg | 1326 | 890 | [21] |
| P | 3669 | 2570 | [21] |
| K | 8038 | 6770–37,900 | [8,21] |
| Si | 2631 | 330 | [21] |
| Na | 249 | 102–1809 | [8,21] |
| Cu | 53 | 6–279 | [8,21] |
| Organic composition (wt. %, dry basis) | |||
| Cellulose | 15.38 | 28.64 | [13] |
| Hemicellulose | 4.72 | – | – |
| Lignin | 42.46 | 41.98 | [13] |
| Devolatilization | |||
| T Start point 2 (°C) | 180 | – | – |
| T End point 3 (°C) | 483 | – | – |
| T max 4 (°C) | 323 | – | – |
| Rate max (wt. % min−1) | ~2 | – | – |
| Proximate analysis (wt. %, dry basis) | |||
| Total volatile matter | 71.9 | 63.60–72 | [3,8,10,12,14,19] |
| Fixed carbon | 22.4 | 20.68–28.20 | [3,8,10,12,14,19] |
| Ash | 5.7 | 3.46–8.20 | [3,8,10,12,14,19] |
1 Grape marc originates from various sources and wine-making process. 2 Temperature at which devolatilization starts. 3 Temperature at which devolatilization ends. 4 Temperature at which the maximum rate of devolatilization occurs.
3.2. Pyrolysis Characteristics of EGM
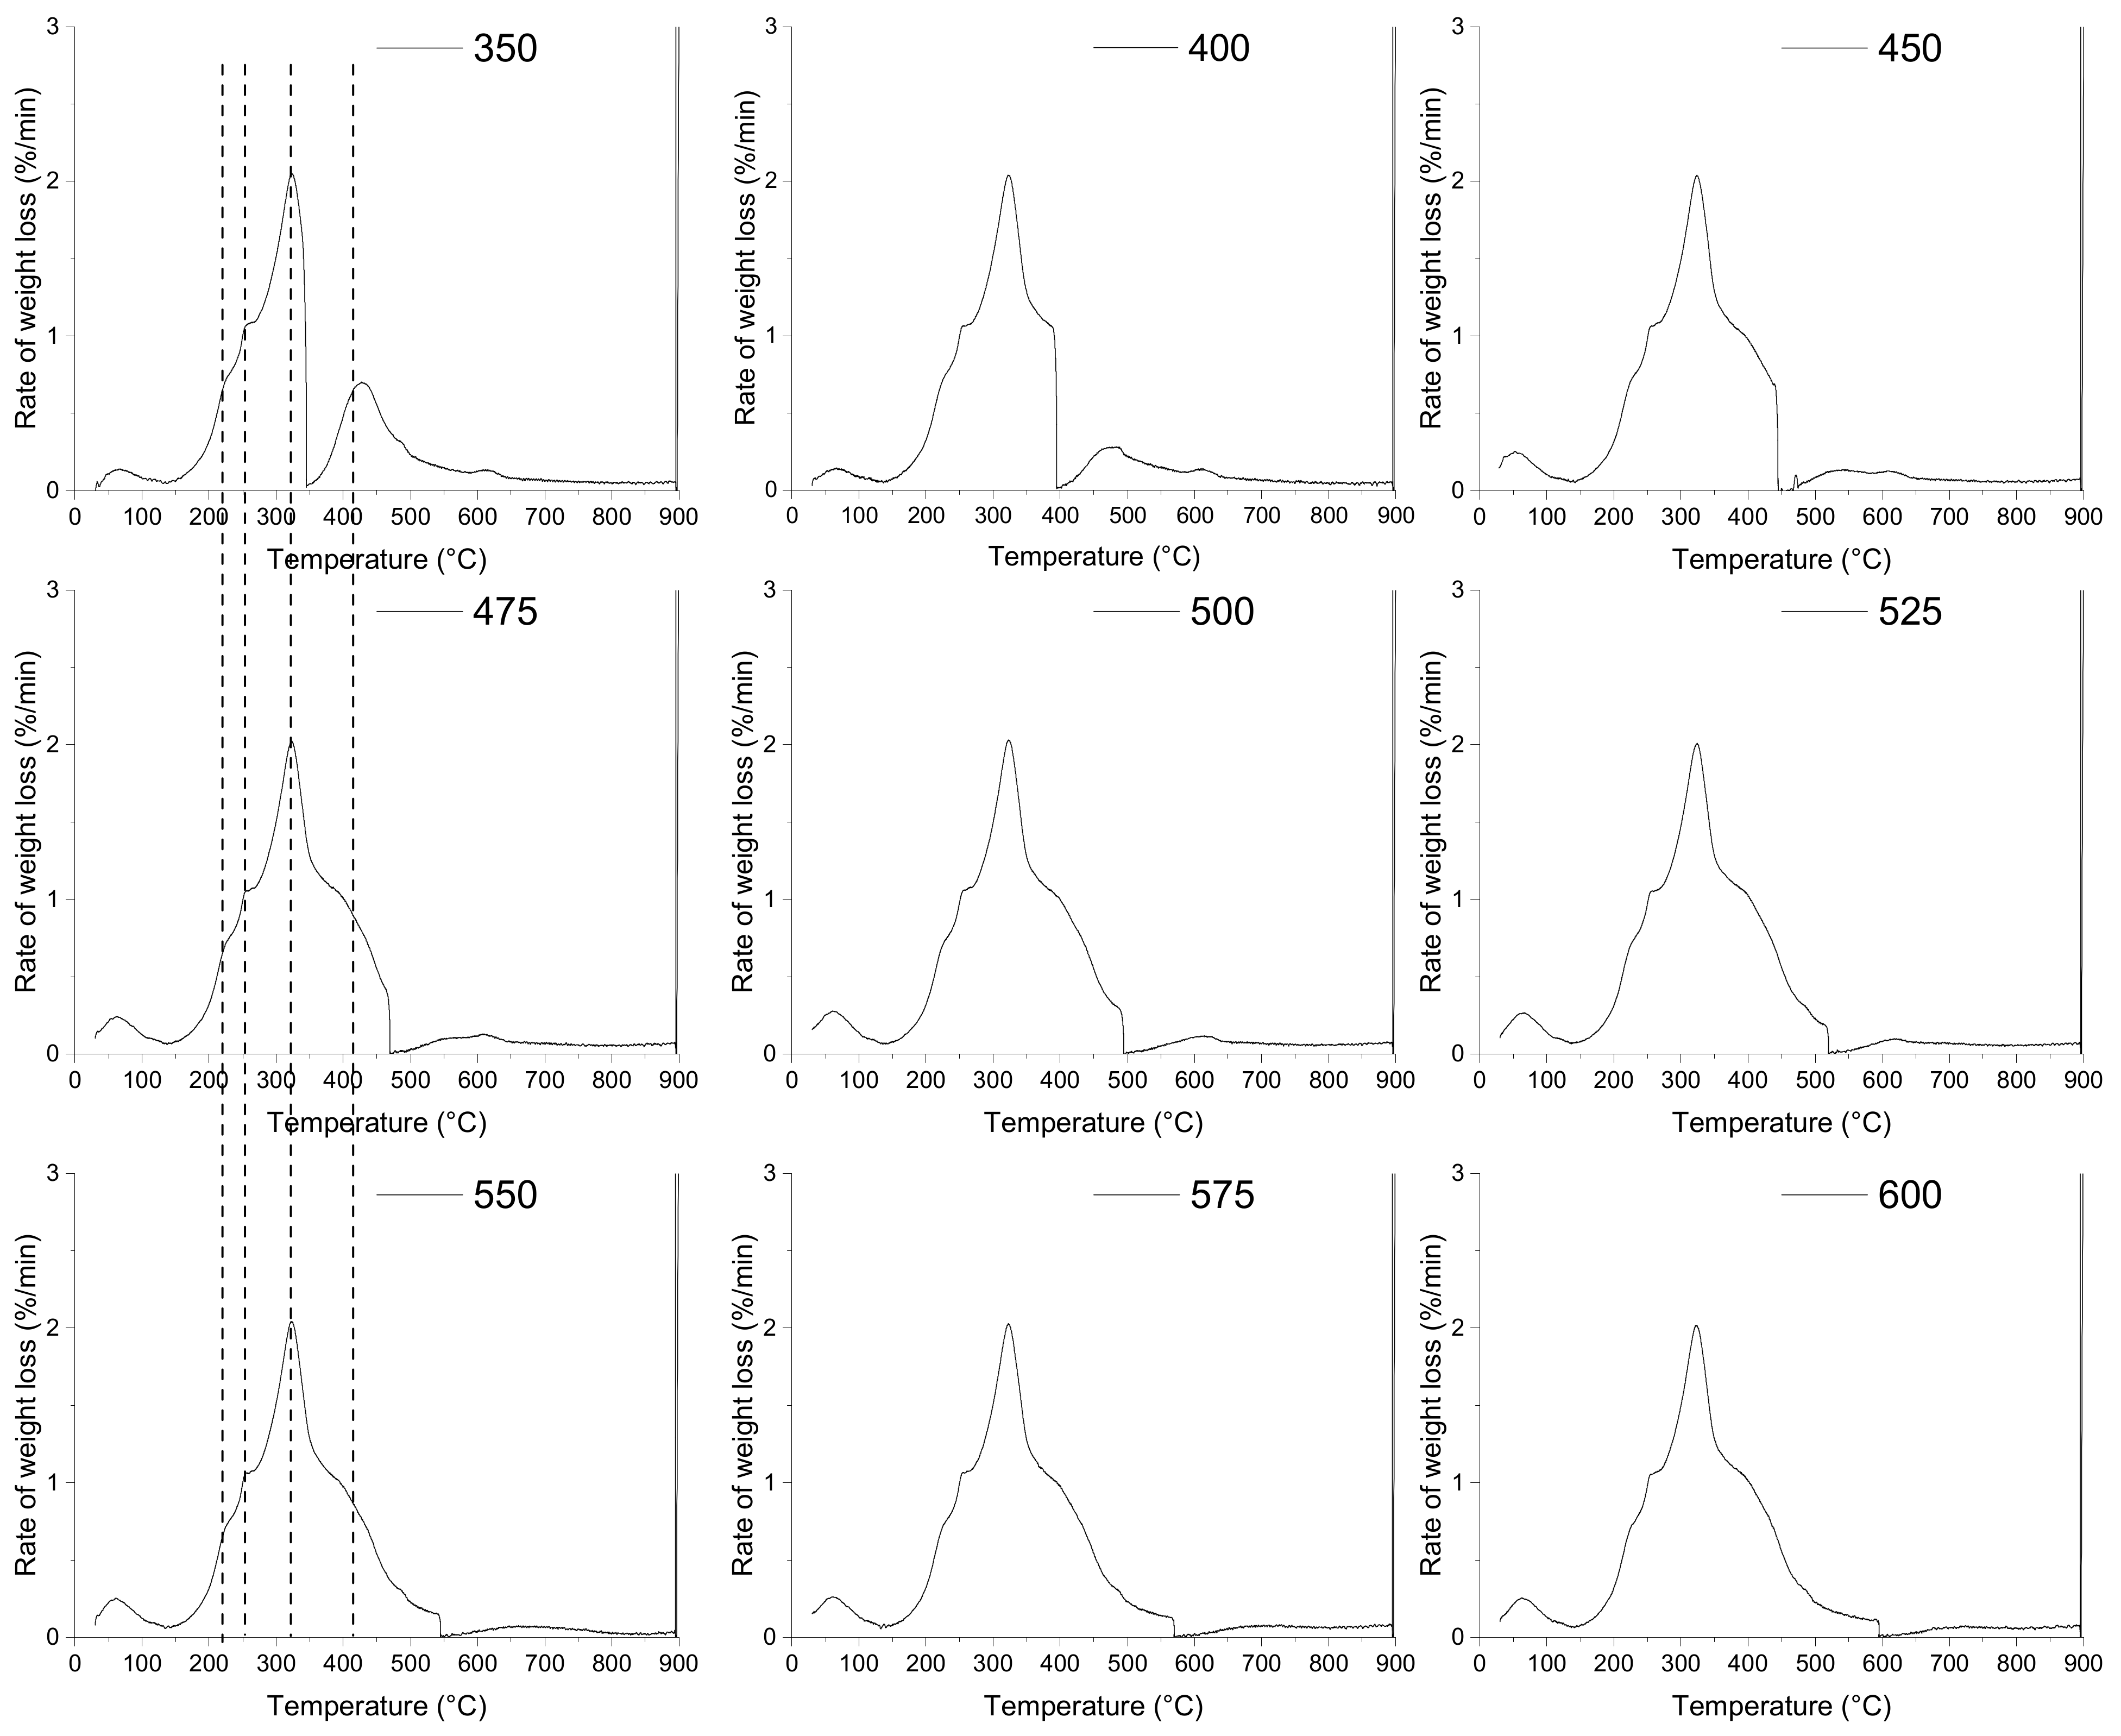
A comparison of the thermal behaviour of the EGM sample at different pyrolysis temperature is presented in Figure 4. The mean objective here is to identify suitable low pyrolysis temperatures at which a high and effective conversion is possible. Most of the thermal decomposition of EGM occurs in the same temperature range under the different pyrolysis temperatures. The characteristic temperatures of the devolatilization stage involved in the thermal decomposition of EGM were approximately the same for all the runs. The temperature for which the maximum rate of reaction occurs (Tmax) is almost identical for all the runs with a deviation of ±1 °C from a mean temperature of 323 °C. For all the pyrolysis temperatures, there is a flat section at the higher temperatures (>500 °C) corresponding to the charring process.
Figure 4.
Effects of pyrolysis temperature on the pyrolysis behaviour of EGM.
However, some differences may be observed with respect to the thermal decomposition of lignin over the 350–450 °C pyrolysis temperature range. At a pyrolysis temperature ≥ 450 °C, the DTG curves of the EGM sample contain one broad peak with three shoulders. At a lower pyrolysis temperature ≤ 400 °C, the overlapping effects between cellulose, hemicellulose and lignin decompositions are limited, and two peaks can be distinguished.
Since cellulose and hemicellulose start to decompose at lower temperatures, their thermal decomposition was already complete before the pyrolysis temperature plateau. By increasing the pyrolysis temperature from 350 to 450 °C, lignin is decomposed at a higher extent and the DTG peak becomes broader. This means that a minimum temperature of 450 °C is needed to ensure the completion of the overall decomposition reactions for the used residence time. When increasing the pyrolysis temperature from 450 to 600 °C, the width of the DTG peaks is of an approximately equal size, suggesting that a higher pyrolysis temperature has little effect on the devolatilization process.
The pyrolysis yields for the volatile matter and char fraction were determined for all the investigated pyrolysis temperatures and their values are listed in Table 3. The solid char yield drastically decreases by increasing the pyrolysis temperature from 350 to 450 °C, while the volatile yield increases. At elevated temperatures, the pyrolysis yields remained stable, with a weight drop of ~1 wt. %. Another interesting observation can be made by plotting the mass loss curve vs. time, to estimate the time for char mass stabilisation (see Figure S1). The period for mass stabilisation at 450 °C was about 60 min, while for higher temperatures, the thermal decomposition lasted for 20–30 min. Thus, higher operating temperatures result in a shorter processing time.
Table 3.
Product yields (wt. %, dry basis) in TGA 1.
In view of these findings, a temperature range from 450 to 550 °C and a one-hour residence time were selected for biochar production at a large scale. Indeed, temperatures higher than 450 °C will allow for a more effective decomposition of EGM organic components, while a longer products residence time (>30 min) permits a secondary reaction to occur between the char and volatiles, leading to a secondary char formation (maximising char aromaticity and stability) [11].
As mentioned earlier, pyrolysis experiments in a pilot plant were carried out at three different temperatures ranging from 450 to 550 °C, under a one-hour residence time. Depending on the pyrolysis temperature, different product yields were obtained, which must be attributed to their different pyrolysis behaviour. The average product yields are presented in Table 4. As the pyrolysis temperature is increased from 450 to 550 °C, the yields of char and liquid decreased, while the yield of gases increased. Obviously, higher temperatures promote secondary reactions of the tar, thus, increasing the yield of gases [40]. The char yields ranged from 41 to around 38 wt. %, which are slightly higher than the yields obtained in the TGA experiments. Similar char yields have been previously reported [14,21].
Table 4.
Product yields (wt. %) in pilot plant.
3.3. Properties of EGM-Based Biochars
The elemental composition of EGM-based biochars is reported in Table 5. The carbon contents were high, ranging from 77.5 to 80%. The hydrogen contents were low, ranging from 2.5 to 3.32%. The nitrogen content ranged very tightly from 2.4 to 2.6%. The oxygen content ranged from 7.3 to 4.8%. The contents of C in the biochars tended to increase, while the contents of H and O tended to decrease with increased pyrolysis temperatures. These trends can be attributed to the enhanced thermal rearrangement process (aromatic growth) of the carbon structure with increased temperatures, leading to a highly carbonaceous and aromatic biochar.
Table 5.
Physicochemical properties of EGM-based biochars.
Atomic element ratios were determined to predict some characteristics of the produced biochars such as aromaticity (H/C), stability (O/C) and potential N immobilisation (C/N) [41]. Both the H/C and O/C ratios decreased with increased pyrolysis temperatures, indicating a more condensed and stable biochar with fewer oxygen functional groups [41]. The C/N ratio varied slightly with increased pyrolysis temperatures, suggesting that those biochars will lead to increased N immobilisation in soils.
Analysis of the inorganic content in biochars compared with that of the EGM feedstock gave insight into the enrichment of biochars with inorganic elements, particularly Ca (13,600–16,500 ppm), Mg (2430–2950 ppm), P (6460–7560 ppm) and K (24,500–28,200 ppm). As shown in Table 5, increasing the pyrolysis temperature from 450 to 550 °C resulted in higher inorganic contents. This includes Al, Ca, Fe, K, Mg, Na, P and Si.
The TG and DTG thermograms of the three biochars are presented in Figure 5. For the three samples, the following two main regions of weight loss were observed: the lower temperature loss (25–150 °C) corresponds to the desorption of water, while the higher temperature loss, between 400 and 900 °C, could be attributed to the release of volatile organic compounds or/and loss of mineral compounds/salts not released during the pyrolysis process at a low temperature. As expected, the greater mass loss occurs for the biochars pyrolyzed at lower temperatures. By examining the DTG thermogram, EGM500 and EGM550 biochars gave a single DTG peak located at around 650 °C with a very small shoulder at 700 °C. EGM450 has an additional DTG peak located at a lower temperature, around 550 °C. This peak can be attributed to the presence of a small fraction of lignin that might not be totally decomposed during the pyrolysis process.
Figure 5.
TG and DTG curves of EGM-based biochars.
Proximate analysis of the three biochar (Table 5) gave a high fixed carbon content ranging from 68 to 73 wt. %, a volatile matter ranging from 17 to 23 wt. % and a high ash content ranging from 9 to 10 wt. %. Fixed carbon and ash contents increased with the temperature while the volatile matter decreased. The high ash content (when compared with wood-derived biochars [42,43]) in the three biochars can be attributed to the high ash content found in the EGM feedstock, which is about 6 wt. %. Considering the above results, the EGM550 biochar seemed to undergo more complete carbonisation, resulting in a higher fixed carbon content, lower volatile matter and lower H/C ratio, and, therefore, higher stability.
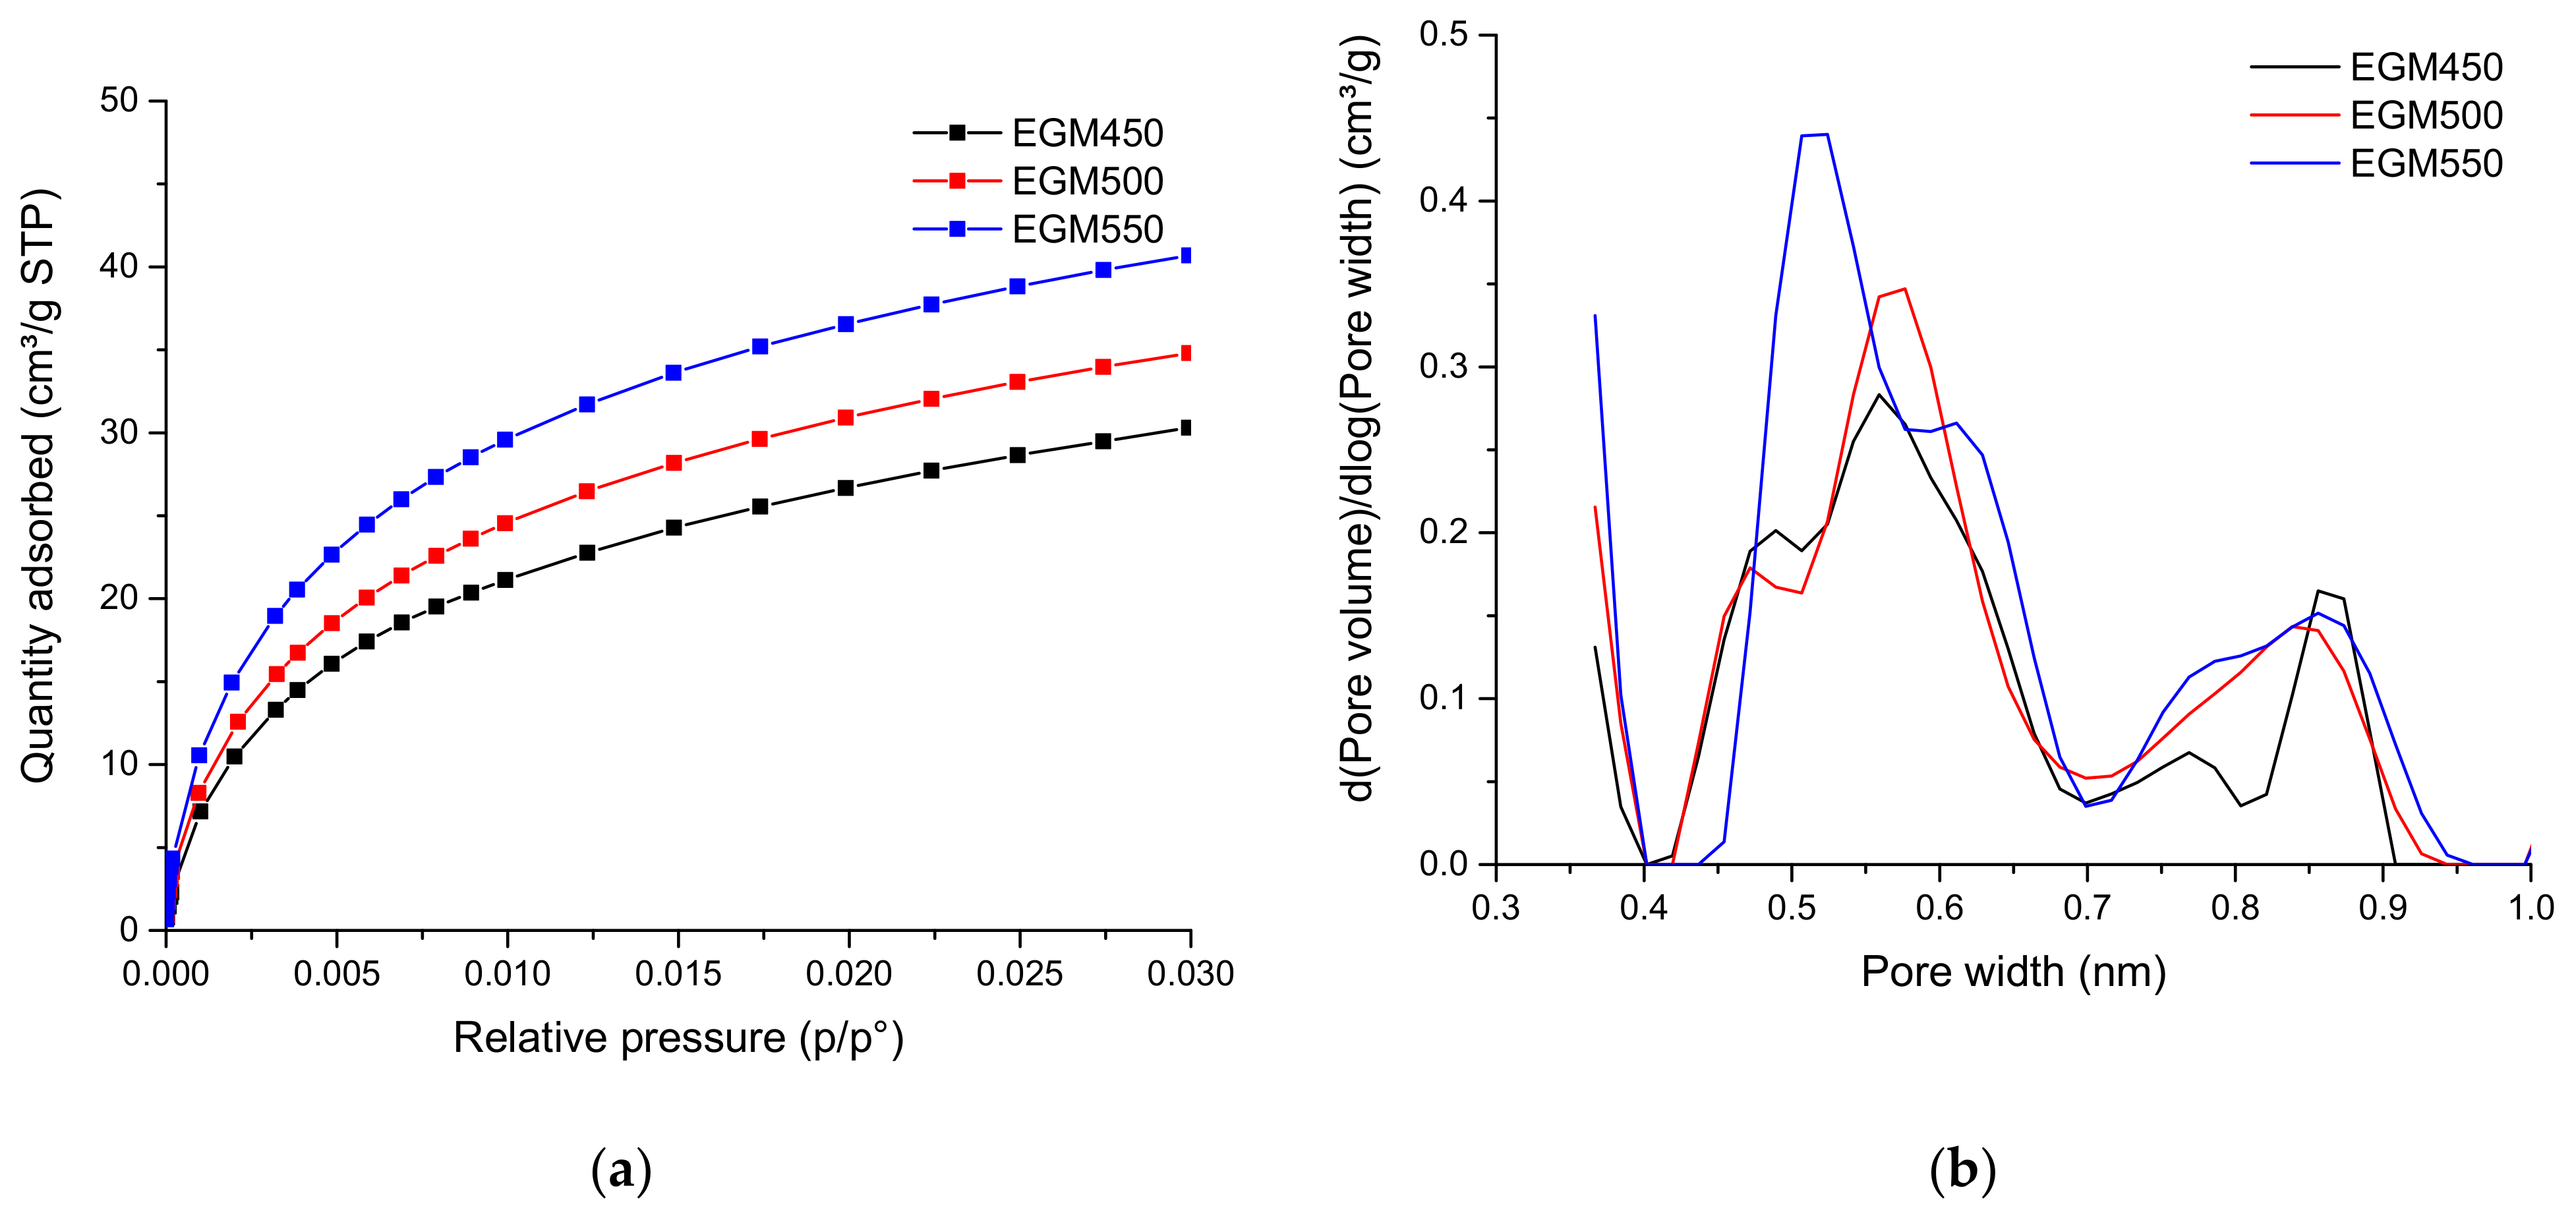
The specific surface area, the micropore volume and the mean pore size of the different biochars were calculated starting for the CO2 adsorption isotherms and presented in Table 5. The micropore volume increased with the increasing pyrolysis temperature from 0.091 to 0.116 cm3 g−1. The BET surface area followed a similar trend, increasing from 170 to 219 m2 g−1. Figure 6 shows the presence of micropores with a pore size between 0.4 and 1 nm. The micropore size distribution curve of the biochar samples showed a tri-modal pore size distribution. The ultra-microporous structure found in the biochars may arise from the release of gases during the pyrolysis process.
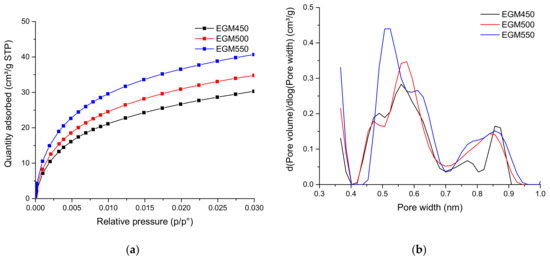
Figure 6.
(a) Adsorption isotherms of CO2 at 0° and (b) pore size distribution for EGM-based biochars.
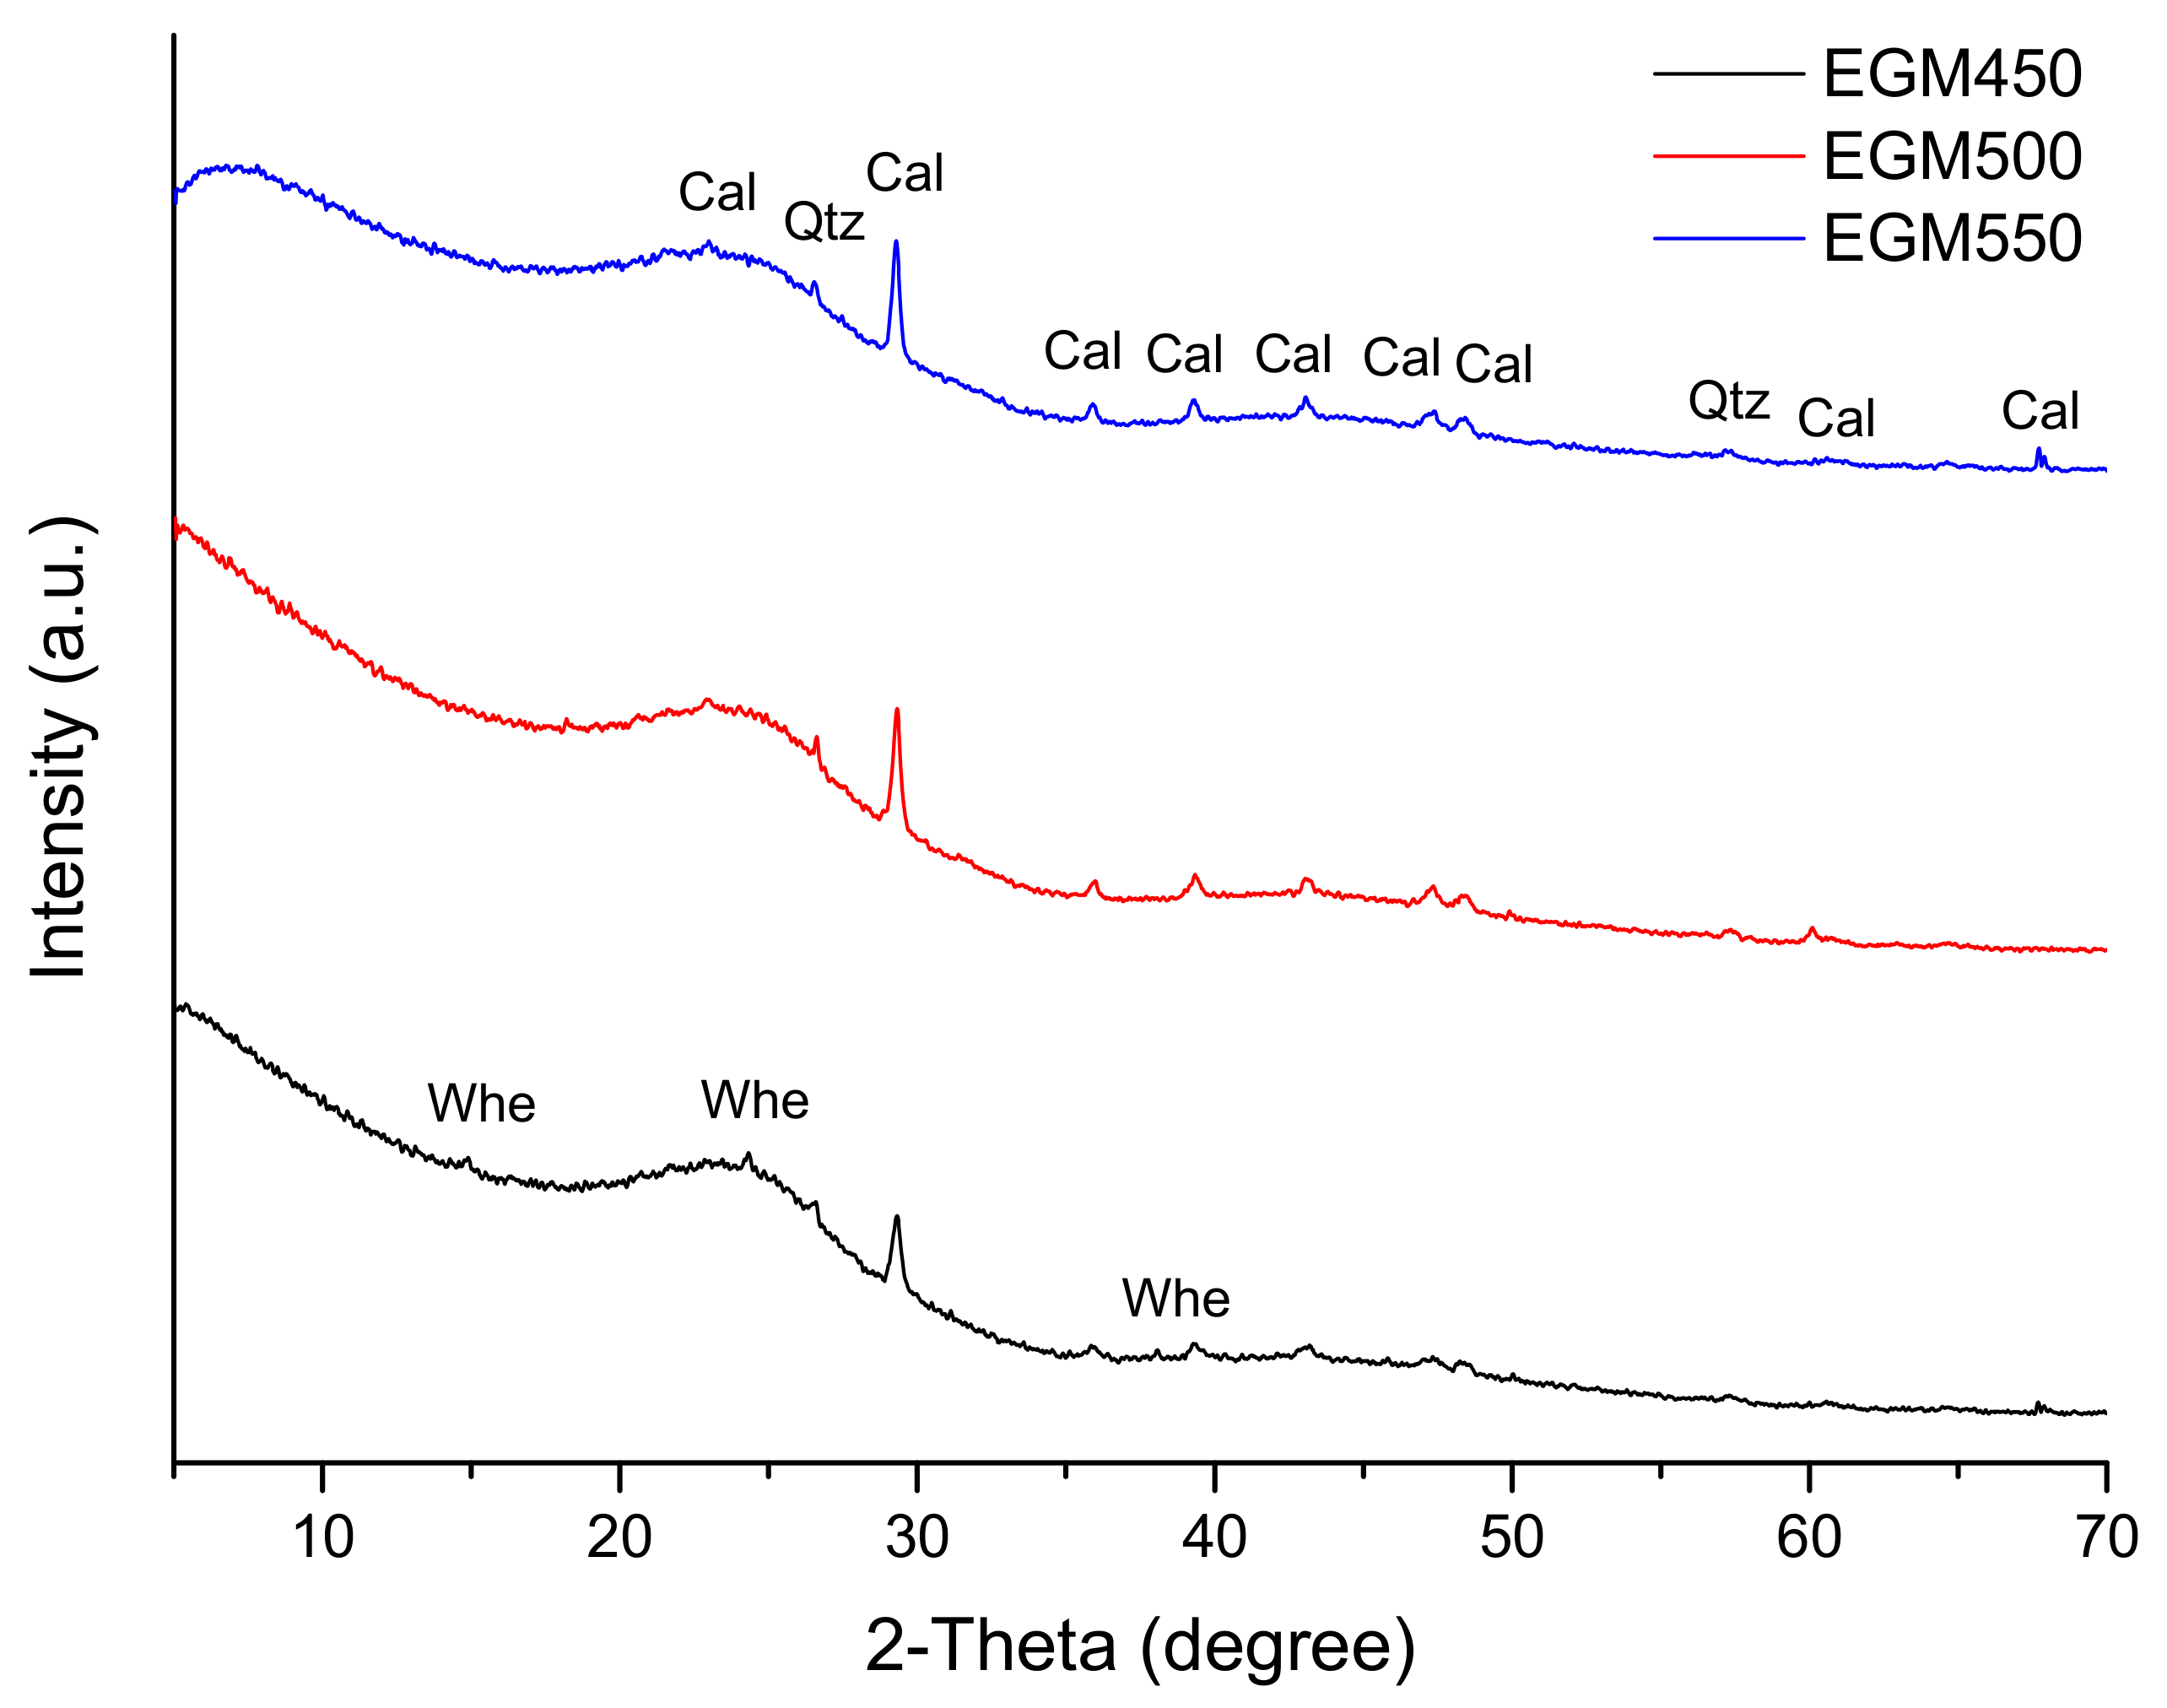
The XRD patterns of the different biochar samples are shown in Figure 7. They show a broad band centred at around 23° 2θ (3.8 Å) and corresponding to amorphous carbon. Calcite (CaCO3) and quartz (SiO2) were the two major crystalline phases identified in the biochar samples. The presence of carbonate and quartz crystalline phases is consistent with their elemental composition. Calcite could have formed during the pyrolysis process via the hydration and carbonation of Ca oxide [44]. Some minor peaks of crystalline whewellite (calcium oxalate, Ca(C2O4) H2O) were detected in the XRD pattern of the biochar produced at 450 °C. Calcium oxalate in biochar has been suggested to derive from the biomass feedstock. Whewellite peaks were absent in EGM500 and EGM550 due to its decomposition (at 479 °C) into calcite at a high pyrolysis temperature [45]. Most of these salts are highly soluble and could increase the biochars’ alkalinity [44].

Figure 7.
XRD patterns of EGM-based biochars (Cal: Calcite, Qtz: Quartz, Whe: Whewellite).
The SEM images (Figure 8) revealed a heterogeneous and porous structure of EGM-based biochar particles. The heterogeneity feature is derived from the complex composition of grape marc (seeds, stalks and skins). On the other hand, the porous nature of these materials originates from the precursor plant cellular structure of EGM and from the gas evolved during the pyrolysis process [41]. The EDX spectra (not shown) indicate that the chemical compositions of the different structures are similar. The presence of carbon, oxygen, calcium and potassium can be readily detected.
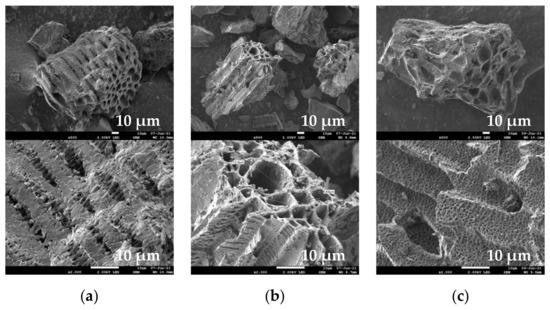
Figure 8.
SEM images of (a) EGM450, (b) EGM500 and (c) EGM550 biochars.
The pH values of the EGM-based biochars are given in Table 5. All the produced biochars had an alkaline pH (>10). This basic characteristic arises from both their chemical composition and their surface chemistry. Indeed, during pyrolysis, acidic functional groups (oxygen-containing groups) are removed and alkali and alkaline earth elements concentrate, resulting in a higher pH value [41].
3.4. Qualification of EGM-Based Biochar as a Potential Candidate for Soil Amendment
Biochar is recognised as a potential soil amendment. Its properties, such as high organic C, high mineral content of macronutrients (Ca, K and P) and micronutrients (B, Mn, Cu, Zn, Fe, Mo and Mg), porous structure, high and active surface area and high cation exchange capacity have been highlighted as soil improvers [41,46]. Moreover, the effect of biochar on soil pH is beneficial for ameliorating acid soils. In this study, biochars derived from EGM were found to meet the requirements relating to agricultural applications. The required characteristics include high organic carbon content, low ash and volatile matter contents, porous structure, high surface area and high pH value. In addition, the biochar material must meet the soil toxicity assessment thresholds. Thermal and proximate analysis revealed that the pyrolyzed biochars have a high fixed carbon (>68 wt. %), low volatile matter (<23 wt. %) and high ash content (9–10 wt.). The high fixed carbon content is a good indicator of the biochar’s stability and ability in sequestering carbon. The volatile matter is generally considered as an organic contaminant that may be released from biochar in soil. Diminishing the volatile matter content in biochar is always essential to minimise the risk of soil contamination and its related effects on microbial populations and plant growth [41,46]. In terms of chemical composition, the produced biochars have shown a high carbon content (≥77.5 wt. %), and very low values for both O/C and H/C ratios. Such information serves as a key indicator for the carbon sequestration potential of the produced biochars [28,41]. Mineral analysis results have revealed a high mineral content of macronutrients (Ca, K and P), in accordance with SEM-EDX analysis. These results are a good indicator of the nutrient value and the substantial fertiliser value of these biochars. CO2 adsorption and SEM analysis provided valuable insight into the textural and structural properties of the biochars. The microporous nature of these materials and their relatively high surface areas would enhance their sorption capacity (water and added nutrients), while their microporosity will provide suitable habitats for micro-organisms colonisation. The biochars produced from EGM were all alkaline with pH, which made them more suitable for acid soils.
The biochars properties show a qualitative dependence to the temperature of production. A clear correlation cannot be established due to the complex matrix of biochars and the influence of other parameters (inorganics catalytic impact, granulometry, etc.) on the pyrolysis process and consequently on the biochars characteristics. Nevertheless, certain behaviours can be underlined; concerning the elemental composition, higher pyrolysis temperatures led to a higher carbon content and lower H, O and N contents. For the proximate analysis, higher pyrolysis temperatures generated biochars with a higher fixed carbon content and a lower volatile matter content. For the textural properties, higher pyrolysis temperature resulted in accentuated microporous structures. Additionally, as the pyrolysis temperature increases, the content of minerals is increased due to concentration. In addition, the effect of the pyrolysis temperature on biochar properties, particularly the chemical and textural properties, was more pronounced at the highest temperature. The lowest pyrolysis temperature (450 °C) produces a less condensed biochar structure, which is expected to be more biodegradable. The highest pyrolysis temperature (550 °C) produces a more stable biochar with a high microporous structure.
3.5. Plant Growth Study
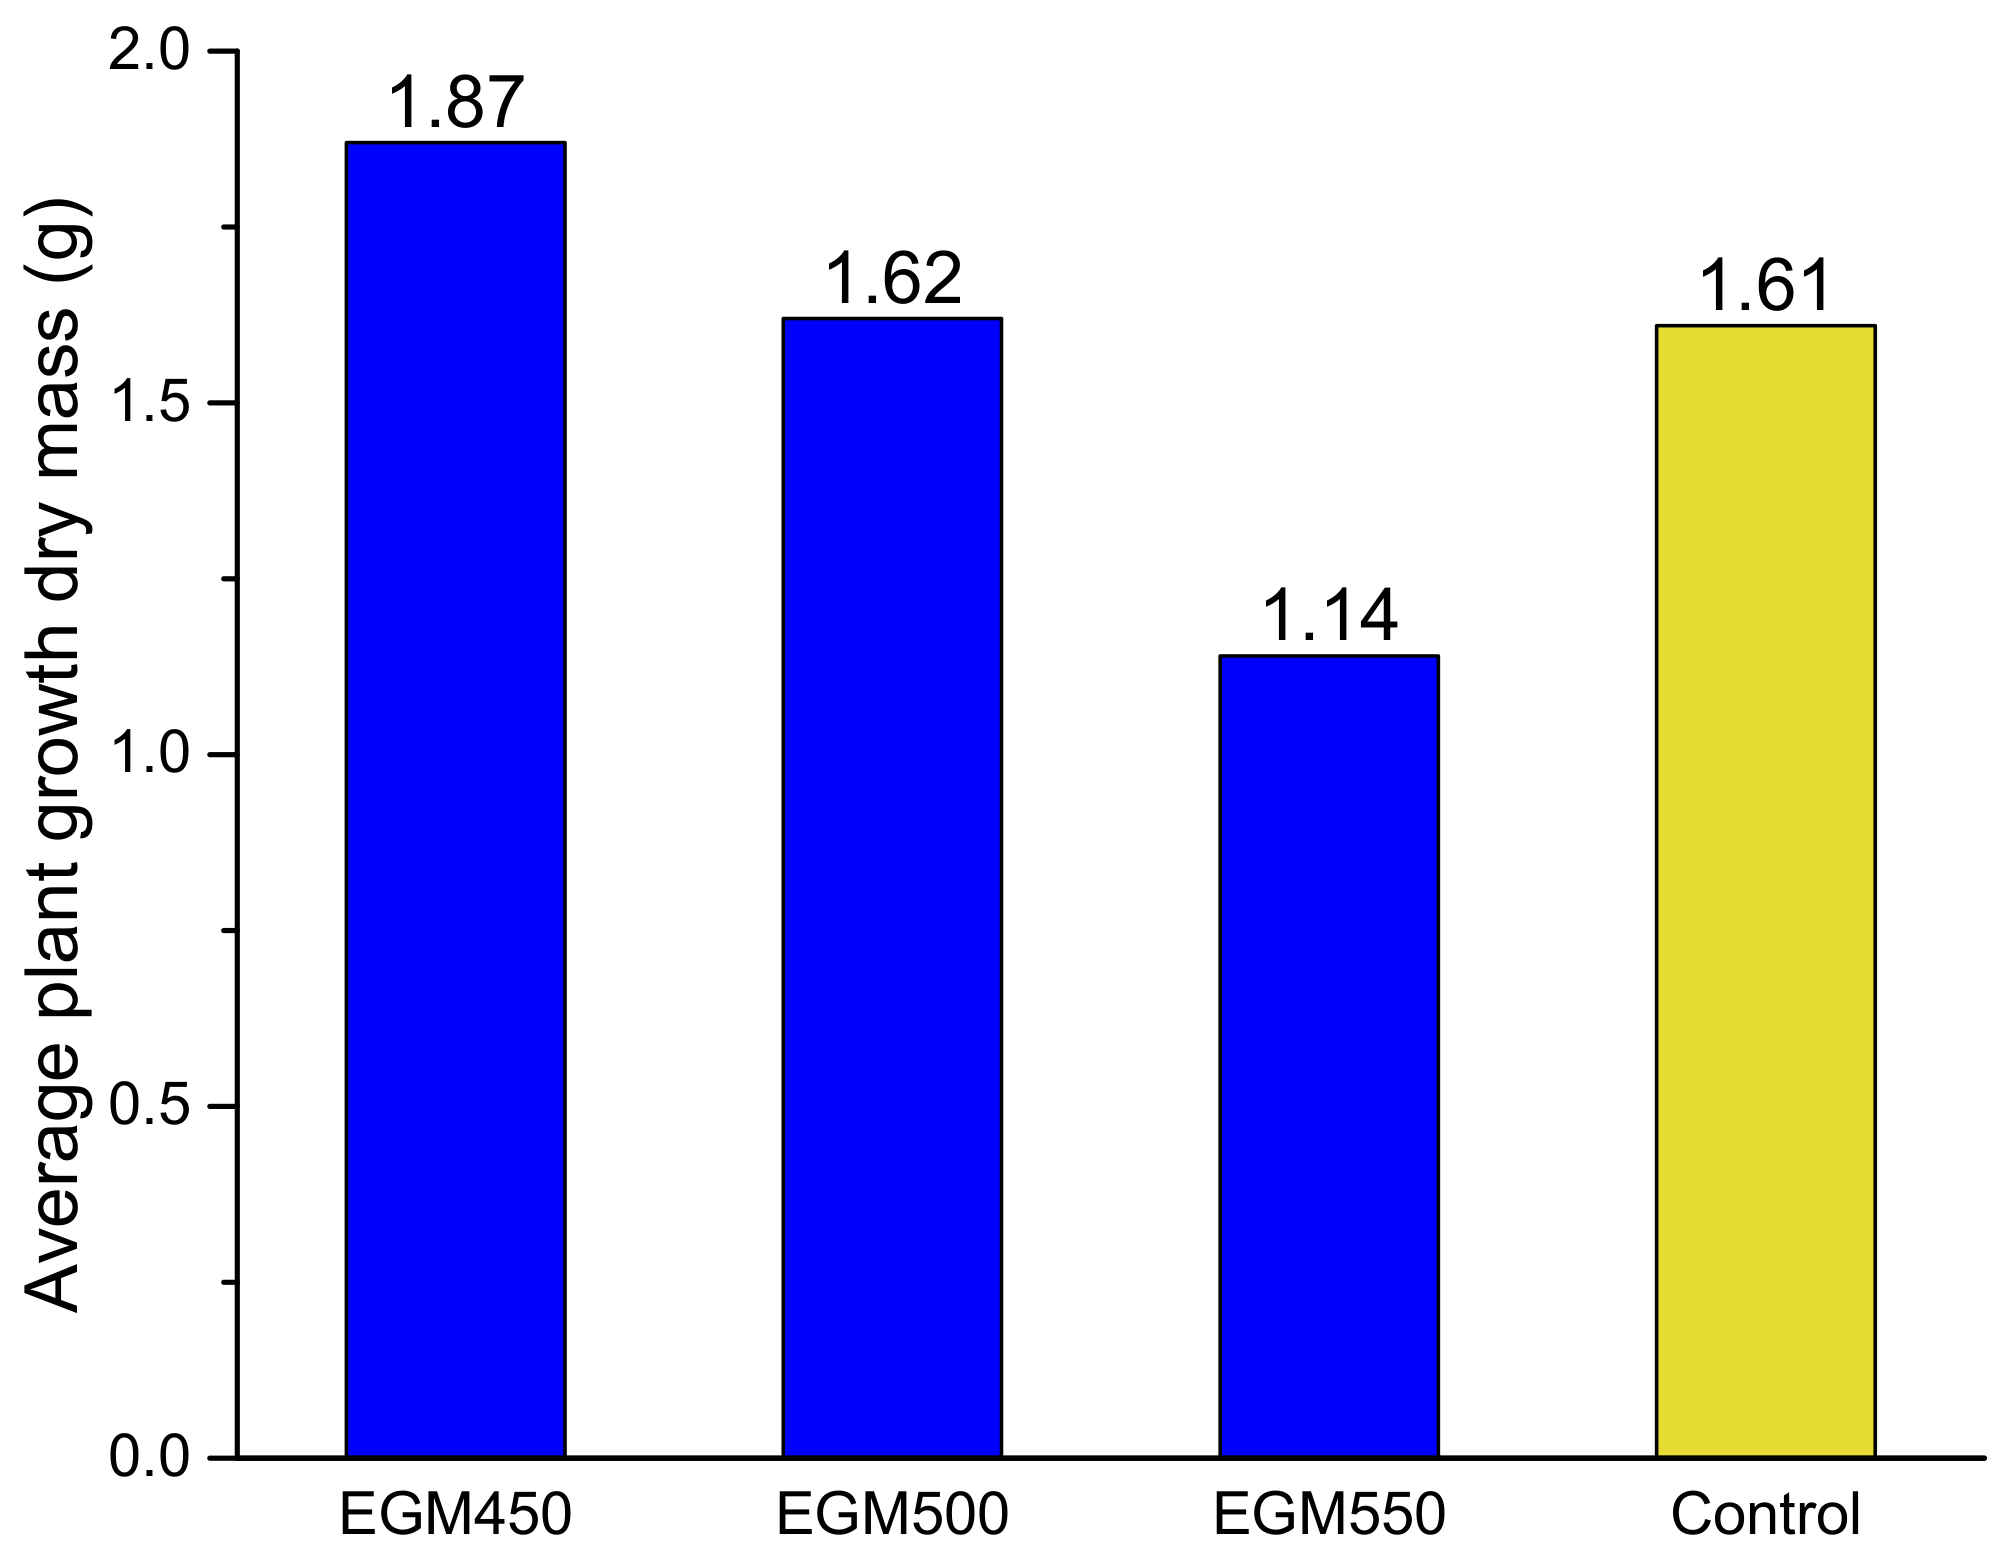
The impact of the biochars on ryegrass growth has been firstly evaluated by measuring the plant growth dry mass after 4 weeks (see Figure 9). The plant growth was clearly affected by the type of biochar added to the soil. When compared to the control samples (modality M1), the ryegrass dry mass obtained in the pots containing EGM550 biochar was lower (1.14 g) than that obtained with the control samples (1.61 g). No effect on the ryegrass dry mass could be evaluated in the presence of the EGM500 biochar, with an average plant growth dry mass of 1.62 g. On the other hand, a clear benefit related to the addition of EGM450 biochar has been observed; the dry mass was improved by 16% with respect to the control sample and reached 1.87 g. The reduction in the plant growth dry mass when EGM550 was added can be explained at first by the effects of biochar on soil N dynamics [47]. The plant-available N pool (by comparing the C/N ratio, which is often used to predict mineralisation and N release in soils) was lower; the application of biochar produced at a high temperature (550 °C) induced a higher net N mineralisation and lower N immobilisation than those produced at low temperatures (≤550 °C); as a result, the biochar produced at a low temperature (450 °C) induced less mineral N leaching loss and greater soil N retention, resulting in a higher plant growth dry mass. Secondly, the carbon matrix reorganises at higher temperature and can incorporate certain minerals in the structure. They cannot be easily released as in the biochars prepared at lower temperature and then they cannot be assimilated by the plant.

Figure 9.
Average plant growth (on dry mass basis) for the pots containing EGM biochars prepared at different temperatures (blue) and the control sample (yellow).
The pyrolysis temperature has already been identified as a key parameter for optimising the biochar features adapted to agro applications [21]. In a previous study [48], an EGM pyrolysis temperature between 400 and 500 °C was identified as the best temperature range for producing biochars that are able to release the minerals at an optimum rate, as determined by leaching experiments at a laboratory scale. The present results consolidate the previous observations in terms of plant growth. Even if the present plant growth experiments are targeted on K loading, synergetic effects, such as the water retention, the realising of other minerals and the biological and structural modification of the soil, can affect the growth performance.
4. Conclusions
Biochar production and characterisation provided in-depth knowledge of the chemical and physical characterisation of the produced biochars. Through the results of this study, it was found that the pyrolysis temperature impacts the pyrolysis yields, the biochar thermal stability, the development of surface area, the mineral composition and, to a lesser extent, the ash content. The pyrolysis of exhausted grape marc at a medium temperature, between 450 and 550 °C, could be considered as a sustainable pathway to manage winery industry wastes, while achieving the economic efficiency of the production process once implemented in different applications. Biochars prepared at a pyrolysis temperature below 500 °C have been demonstrated to be promising as an agricultural amendment. The use of biochar in this field is crucial in decreasing the environmental pollution caused by synthetic amendment, reducing the global-carbon emission and improving the soil quality (i.e., water retention).
Supplementary Materials
The following are available online at https://www.mdpi.com/article/10.3390/su132011187/s1, Figure S1. Effects of pyrolysis temperature on the pyrolysis behaviour of EGM (weight loss vs time).
Author Contributions
Conceptualisation, L.L. and S.B.; methodology, L.L., S.B. and N.T.; validation, S.B. and L.L.; formal analysis, K.F. and N.T.; investigation, M.B.A., L.R., K.F. and L.L.; resources, S.B. and L.L.; writing—original draft preparation, K.F.; writing—review and editing, S.B.; visualisation, K.F.; supervision, L.L., S.B., K.F. and M.Z.; project administration, S.B. and L.L.; funding acquisition, S.B. All authors have read and agreed to the published version of the manuscript.
Funding
This research was partially funded by the Region Grand Est, 3BR “biomolecules et biomatériaux pour la bioéconomie Régionale vers une valorization zero déchets”.
Institutional Review Board Statement
Not applicable.
Informed Consent Statement
Not applicable.
Data Availability Statement
Data is contained within the article or Supplementary Materials.
Acknowledgments
The authors acknowledge the Carnot MICA institute for funding the pilot scale pyrolysis tests and IS2M technical platforms for the physicochemical characterisations. The authors are very grateful to L. Michelin (XRD), L. Josien (SEM/EDX), and C. Vaulot (CO2 adsorption experiments) for their contributions.
Conflicts of Interest
The authors declare no conflict of interest.
References
- Gómez-Brandón, M.; Lores, M.; Insam, H.; Domínguez, J. Strategies for Recycling and Valorization of Grape Marc. Crit. Rev. Biotechnol. 2019, 39, 437–450. [Google Scholar] [CrossRef]
- Nakai, J. Food and Agriculture Organization of the United Nations and the Sustainable Development Goals Natural Re-Sources Management Officer, FAO From the Millennium Development Goals to the Sustainable Development Goals. Sustain. Dev. 2018, 22, 3–11. [Google Scholar]
- Muhlack, R.A.; Potumarthi, R.; Jeffery, D.W. Sustainable Wineries through Waste Valorisation: A Review of Grape Marc Utilisation for Value-Added Products. Waste Manag. 2018, 72, 99–118. [Google Scholar] [CrossRef]
- Ahmad, B.; Yadav, V.; Yadav, A.; Rahman, M.U.; Yuan, W.Z.; Li, Z.; Wang, X. Integrated Biorefinery Approach to Valorize Winery Waste: A Review from Waste to Energy Perspectives. Sci. Total. Environ. 2020, 719, 137315. [Google Scholar] [CrossRef]
- Panorama Des Industries Agroalimentaires. Available online: https://agriculture.gouv.fr/Le-Panorama-Des-Industries-Agroalimentaires (accessed on 20 April 2021).
- State of the World Vitivinicultural Sector in 2020. Available online: https://www.oiv.int/public/medias/7909/oiv-State-of-the-World-Vitivinicultural-Sector-in-2020.Pdf (accessed on 20 April 2021).
- Ruiz-Moreno, M.J.; Raposo, R.; Cayuela, J.M.; Zafrilla, P.; Piñeiro, Z.; Rojas, J.M.M.; Mulero, J.; Puertas, B.; Girón, F.; Guerrero, R.F.; et al. Valorization of Grape Stems. Ind. Crop. Prod. 2015, 63, 152–157. [Google Scholar] [CrossRef]
- Toscano, G.; Riva, G.; Duca, D.; Pedretti, E.F.; Corinaldesi, F.; Rossini, G. Analysis of the Characteristics of the Residues of the Wine Production Chain Finalized to Their Industrial and Energy Recovery. Biomass-Bioenergy 2013, 55, 260–267. [Google Scholar] [CrossRef]
- Bordiga, M.; Travaglia, F.; Locatelli, M. Valorisation of Grape Pomace: An Approach That Is Increasingly Reaching Its Maturity—A Review. Int. J. Food Sci. Technol. 2019, 54, 933–942. [Google Scholar] [CrossRef]
- Zhang, N.; Hoadley, A.; Patel, J.; Lim, S.; Li, C. Sustainable Options for the Utilization of Solid Residues from Wine Production. Waste Manag. 2017, 60, 173–183. [Google Scholar] [CrossRef]
- Basu, P. Chapter 3—Pyrolysis and Torrefaction. In Biomass Gasification and Pyrolysis; Academic Press: Boston, FL, USA, 2010; pp. 65–96. ISBN 978-0-12-374988-8. [Google Scholar]
- Encinar, J.; Beltran, F.J.; Bernalte, A.; Ramiro, A.; González, J.F.G. Pyrolysis of Two Agricultural Residues: Olive and Grape Bagasse. Influence of Particle Size and Temperature. Biomass- Bioenergy 1996, 11, 397–409. [Google Scholar] [CrossRef]
- Demiral, I.; Ayan, E.A. Pyrolysis of Grape Bagasse: Effect of Pyrolysis Conditions on the Product Yields and Characterization of the Liquid Product. Bioresour. Technol. 2011, 102, 3946–3951. [Google Scholar] [CrossRef]
- Marculescu, C.; Ciuta, S. Wine Industry Waste Thermal Processing for Derived Fuel Properties Improvement. Renew. Energy 2013, 57, 645–652. [Google Scholar] [CrossRef]
- Spigno, G.; Marinoni, L.; Garrido, G.D. State of the Art in Grape Processing By-Products. In Handbook of Grape Processing By-Products; Elsevier BV: London, UK, 2017; pp. 1–27. [Google Scholar] [CrossRef]
- Basso, D.; Patuzzi, F.; Castello, D.; Baratieri, M.; Rada, E.C.; Weiss-Hortala, E.; Fiori, L. Agro-Industrial Waste to Solid Biofuel through Hydrothermal Carbonization. Waste Manag. 2016, 47, 114–121. [Google Scholar] [CrossRef] [PubMed] [Green Version]
- Xu, R.; Ferrante, L.; Briens, C.; Berruti, F. Flash Pyrolysis of Grape Residues into Biofuel in a Bubbling Fluid Bed. J. Anal. Appl. Pyrolysis 2009, 86, 58–65. [Google Scholar] [CrossRef]
- Valente, M.; Brillard, A.; Schönnenbeck, C.; Brilhac, J.-F. Investigation of Grape Marc Combustion Using Thermogravimetric Analysis. Kinetic Modeling Using an Extended Independent Parallel Reaction (EIPR). Fuel Process. Technol. 2015, 131, 297–303. [Google Scholar] [CrossRef]
- Casazza, A.A.; Aliakbarian, B.; Lagazzo, A.; Garbarino, G.; Carnasciali, M.M.; Perego, P.; Busca, G. Pyrolysis of Grape Marc before and After the Recovery of Polyphenol Fraction. Fuel Process. Technol. 2016, 153, 121–128. [Google Scholar] [CrossRef]
- Tounsi, M.S.; Ouerghemmi, I.; Wannes, W.A.; Ksouri, R.; Zemni, H.; Marzouk, B.; Kchouk, M.E. Valorization of Three Varieties of Grape. Ind. Crop. Prod. 2009, 30, 292–296. [Google Scholar] [CrossRef]
- Ibn Ferjani, A.; Jeguirim, M.; Jellali, S.; Limousy, L.; Courson, C.; Akrout, H.; Thevenin, N.; Ruidavets, L.; Muller, A.; Bennici, S. The Use of Exhausted Grape Marc to Produce Biofuels and Biofertilizers: Effect of Pyrolysis Temperatures on Biochars Properties. Renew. Sustain. Energy Rev. 2019, 107, 425–433. [Google Scholar] [CrossRef]
- Torres-Garcia, E.; Brachi, P. Non-Isothermal Pyrolysis of Grape Marc. J. Therm. Anal. Calorim. 2019, 139, 1463–1478. [Google Scholar] [CrossRef]
- Zacharof, M.-P. Grape Winery Waste as Feedstock for Bioconversions: Applying the Biorefinery Concept. Waste Biomass Valorization 2016, 8, 1011–1025. [Google Scholar] [CrossRef] [Green Version]
- Rivera, O.M.P.; Leos, M.D.S.; Solis, V.E.; Domínguez, J.M. Recent Trends on the Valorization of Winemaking Industry Wastes. Curr. Opin. Green Sustain. Chem. 2021, 27, 100415. [Google Scholar] [CrossRef]
- Balat, M.; Balat, M.; Kırtay, E.; Balat, H. Main Routes for the Thermo-Conversion of Biomass into Fuels and Chemicals. Part 1: Pyrolysis Systems. Energy Convers. Manag. 2009, 50, 3147–3157. [Google Scholar] [CrossRef]
- Fahmy, T.Y.A.; Fahmy, Y.; Mobarak, F.; El-Sakhawy, M.; Abou-Zeid, R.E. Biomass Pyrolysis: Past, Present, and Future. Environ. Dev. Sustain. 2018, 22, 17–32. [Google Scholar] [CrossRef]
- Xie, T.; Reddy, K.; Wang, C.; Yargicoglu, E.; Spokas, K. Characteristics and Applications of Biochar for Environmental Remediation: A Review. Crit. Rev. Environ. Sci. Technol. 2015, 45, 939–969. [Google Scholar] [CrossRef]
- Schmidth, H.P.; Bucheli, T.; Kammann, C.; Glaser, B.; Abiven, S. EBC (2012) “EuropeanEuropean Biochar Certificate—Guidelines for a Sustainable Production of Biochar”; EBC: Arbaz, Switzerland, 2021. [Google Scholar]
- Ding, Y.; Liu, Y.; Liu, S.; Li, Z.; Tan, X.; Huang, X.; Zeng, G.; Zhou, L.; Zheng, B. Biochar to Improve Soil Fertility. A Review. Agron. Sustain. Dev. 2016, 36, 36. [Google Scholar] [CrossRef] [Green Version]
- Verheijen, F.; Jeffery, S.; Bastos, A.C.; Van Der Velde, M.; Diafas, I. Biochar Application to Soils—A Critical Scientific Review of Effects on Soil Properties, Processes and Functions. EUR 24099 EN; European Commission: Luxembourg, 2010; Volume 8, ISBN 9789279142932. [Google Scholar]
- Kookana, R.S.; Sarmah, A.K.; Van Zwieten, L.; Krull, E.; Singh, B. Biochar Application to Soil. Agronomic and Environmental Benefits and Unintended Consequences. In Advances in Agronomy; Elsevier Inc.: Amsterdam, The Netherlands, 2011; Volume 112, pp. 103–143. ISBN 9780123855381. [Google Scholar]
- Kavitha, B.; Reddy, P.V.L.; Kim, B.; Lee, S.S.; Pandey, S.K.; Kim, K.-H. Benefits and Limitations of Biochar Amendment in Agricultural Soils: A Review. J. Environ. Manag. 2018, 227, 146–154. [Google Scholar] [CrossRef]
- Guo, X.-X.; Liu, H.-T.; Zhang, J. The Role of Biochar in Organic Waste Composting and Soil Improvement: A Review. Waste Manag. 2020, 102, 884–899. [Google Scholar] [CrossRef]
- Van Soest, P.J. Use of Detergents in the Analysis of Fibrous Feeds. II. A Rapid Method for the Determination of Fiber and Lignin. J.-Assoc. Off. Anal. Chem. 1990, 73, 491–497. [Google Scholar] [CrossRef]
- Groenli, M.G. A Theoretical and Experimental Study of the Thermal Degradation of Biomass. Master’s Thesis, Norges teknisknaturvitenskapelige Universitet, Trondheim, Norway, 1996. [Google Scholar]
- Lombaert, V. Micro-cultures, Stanford-De Ment Methods [determination of the short term availability of fertilizers, diagnosis of soil fertility]. Dossiers Agronomiques d’Aspach-le-Bas 1987, 2, 59–86. [Google Scholar]
- Werner, K.; Pommer, L.; Broström, M. Thermal Decomposition of Hemicelluloses. J. Anal. Appl. Pyrolysis 2014, 110, 130–137. [Google Scholar] [CrossRef]
- Mohan, D.; Pittman, C.U.; Steele, P.H. Pyrolysis of Wood/Biomass for Bio-Oil: A Critical Review. Energy Fuels 2006, 20, 848–889. [Google Scholar] [CrossRef]
- Örsi, F. Kinetic Studies on the Thermal Decomposition of Glucose and Fructose. J. Therm. Anal. Calorim. 1973, 5, 329–335. [Google Scholar] [CrossRef]
- Grammelis, P.; Margaritis, N.; Kourkoumpas, D.-S. 4.27 Pyrolysis Energy Conversion Systems. Compr. Energy Syst. 2018, 1065–1106. [Google Scholar] [CrossRef]
- Rajapaksha, A.U.; Mohan, D.; Igalavithana, A.D.; Lee, S.S.; Ok, Y.S. Definitions and Fundamentals of Biochar. In Biochar: Production, Characterization, and Applications; Ok, Y.S., Uchimiya, S.M., Chang, S.X., Bolan, N., Eds.; Urbanization, Industrialization, and the Environment; CRC Press: Boca Raton, FL, USA, 2016; pp. 4–16. ISBN 978-1-4822-4230-0. [Google Scholar]
- Wang, S.; Dai, G.; Yang, H.; Luo, Z. Lignocellulosic Biomass Pyrolysis Mechanism: A State-of-the-Art Review. Prog. Energy Combust. Sci. 2017, 62, 33–86. [Google Scholar] [CrossRef]
- Gholizadeh, M.; Hu, X.; Liu, Q. A Mini Review of the Specialties of the Bio-Oils Produced from Pyrolysis of 20 Different Bio-Masses. Renew. Sustain. Energy Rev. 2019, 114, 109313. [Google Scholar] [CrossRef]
- Singh, B.; Camps-Arbestain, M.; Lehmann, J. Biochar: A Guide to Analytical Methods; Csiro Publishing: Clayton Southy, Australia, 2017; ISBN 9781486305094. [Google Scholar]
- Frost, R.L.; Weier, M.L. Thermal Treatment of whewellite—A Thermal Analysis and Raman Spectroscopic Study. Thermochim. Acta 2004, 409, 79–85. [Google Scholar] [CrossRef] [Green Version]
- Bruckman, V.J.; Varol, E.A.; Uzun, B.B.; Liu, J. Biochar: A Regional Supply Chain Approach in View of Climate Change Mitigation; Cambridge University Press: Cambridge, UK, 2016; ISBN 9780333227794. [Google Scholar]
- Chan, K.Y.; Xu, Z. Biochar: Nutrient Properties and Their Enhancement. In Biochar for Environmental Management; Routledge: Oxfordshire, UK, 2012; pp. 99–116. [Google Scholar]
- Ibn Ferjani, A.; Jellali, S.; Akrout, H.; Limousy, L.; Hamdi, H.; Thevenin, N.; Jeguirim, M. Nutrient Retention and Release from Raw Exhausted Grape Marc Biochars and an Amended Agricultural Soil: Static and Dynamic Investigation. Environ. Technol. Innov. 2020, 19, 100885. [Google Scholar] [CrossRef]


Publisher’s Note: MDPI stays neutral with regard to jurisdictional claims in published maps and institutional affiliations. |
© 2021 by the authors. Licensee MDPI, Basel, Switzerland. This article is an open access article distributed under the terms and conditions of the Creative Commons Attribution (CC BY) license (https://creativecommons.org/licenses/by/4.0/).