Article

Spatio-Temporal Characteristics of Green Development Cooperation Network among Belt and Road Initiative Regions and Countries

1
Faculty of Geographical Science, Beijing Normal University, Beijing 100875, China
2
School of Geography, South China Normal University, Guangzhou 510631, China
3
Chongqing Academy of Economics Research, Chongqing 401147, China
*
Author to whom correspondence should be addressed.
Sustainability 2021, 13(20), 11216; https://doi.org/10.3390/su132011216
Submission received: 29 July 2021 / Revised: 29 September 2021 / Accepted: 4 October 2021 / Published: 12 October 2021

Abstract

:
There is a global need to jointly build the green Belt and Road Initiative (BRI) in order to develop a philosophy of ecological civilisation and achieve sustainable development. This paper aims to analyse the temporal and spatial characteristics of the green development cooperation (GDC) network among BRI regions and countries and explore the reasons for its formation. To this end, the first step was to analyse the spatial and temporal characteristics of green development capability in six regions of 104 BRI countries from 2013 to 2019 using the synthetic evaluation model and entropy method. Next, social network analysis was used to analyse three characteristics of the GDC network: network structure, node structure, and community structure. Moreover, the indicators of network strength and network correlation were used to estimate the structural characteristics of the entire GDC network, while degree centrality, betweenness centrality, and closeness centrality were used to estimate the role and status of countries in the GDC network. In addition, modularity optimisation was used to analyse the community structure and regional effects of the GDC network. The results show that (1) the green development capability of the BRI countries has spatial and temporal heterogeneity. (2) The GDC network among the BRI countries has been initially formed, and has the characteristics of high connectedness, high efficiency, low density, and low hierarchy. (3) The GDC network has community structure and regional effect, showing polycentric and hierarchical characteristics. (4) China, Russia, and the European countries have stronger radiating and controlling power. Central Asian countries along the land Silk Road and Indian Ocean countries along the maritime Silk Road play a significant role as intermediaries and bridges, while the BRICS and Shanghai Cooperation Organisation (SCO) countries play a vital role as the central actors. Finally, some theoretical and practical implications are put forward to provide a blueprint for jointly achieving the sustainable development goals.

1. Introduction

Green development is a socially inclusive approach that aims to minimise pollution emissions and effectively utilise natural resources in order to reduce the increasingly negative pressure on the environment and boost the economy in order to promote high-quality and sustainable development. Therefore, green development has become a significant component of the Belt and Road Initiative (BRI). Green BRI construction is an important measure taken by all countries globally to jointly implement the United Nations’ (UN) sustainable development goals. In September 2015, the 2030 Agenda for Sustainable Development adopted by the UN’s 193 member states set out specific goals for green development and ecological protection, thus laying out a roadmap for the countries’ development and international cooperation. The goals, principles, and implementation paths of China’s BRI are highly consistent with the UN’s 2030 Agenda for Sustainable Development; thus, they have received a positive response and much support from the BRI countries [1]. Today the BRI countries are facing significant challenges in terms of green development, such as maintaining the sensitive and fragile ecological environment, addressing low levels of economic development, alleviating overdependence on natural resources, and so forth. Strengthening the BRI countries’ cooperation is the most practical and effective way to solve these issues. The green BRI provides an important platform for countries to cooperate with each other in green development and jointly achieve sustainable development goals.
What are the green development capabilities of countries and regions around the world? What are the GDC relationships between China and other countries? An urgent problem to be solved is how to quantify the green cooperative partnerships between countries and how to determine which countries are the ‘core players’, ‘middlemen’, and ‘laggers’ in the GDC network. In addition, the formation and development of sub-network structure or community groups have some influence on the overall network structure. However, there are few studies on GDC between countries from the perspective of social network analysis. In view of this, by selecting 104 BRI countries as examples, this paper first establishes an evaluation system of green development capability and analyses the spatial and temporal differences of green development capability in different regions and countries by adopting a comprehensive evaluation model and entropy method. Then, from the perspective of relational data and network structure, the national green development capability index and the modified gravity model are used to determine the spatial correlation. Finally, from the perspective of the overall network, community, and node characteristics, social network analysis is used to analyse the structural characteristics of the GDC network.
The purpose of this study is to analyse the temporal and spatial characteristics of the GDC network and understand the reasons for its formation. This will provide a future reference for sustainable development cooperation among BRI countries and regions. The rest of the paper is organised as follows: Section 2 introduces present relevant research progress; Section 3 describes the study area, evaluation system, data collection, and the procedures of the methodology; Section 4 analyses the results; Section 5 discusses the theoretical and practical implications; and Section 6 concludes the paper.

2. Literature Review

2.1. Green BRI Construction

In line with the increasing awareness of the BRI’s formation and the wide acceptance of the vision of green development, research on the green development of BRI countries is rapidly progressing. The existing literature focuses on several aspects. First, previous studies have considered the influence of BRI formation on resources and the environment. For example, Tian et al. [2] assessed the impacts of international trade on BRI countries’ environment and natural resources. They suggested the joint building of eco-industrial parks and green supply chains to promote the innovation of eco-products and improve the efficiency of resource utilisation, thereby reducing the negative impact of international trade on the environment and natural resources. Huang et al. [3], meanwhile, noted that the vision of green development had great significance for the BRI, finding that resource utilisation and cooperation based on the fossil energy trade has a negative impact on green development capabilities. Second, previous research has focused on the assessment of the environment and natural resources of the BRI countries. Davila et al. [4], for instance, found that there is no common regulatory framework to guide the procedure on transboundary environmental assessment in BRI countries and have proposed strengthening transboundary procedures in BRI regions. Moreover, Fang et al. [5] explored the spatiotemporal distribution of PM2.5 concentrations in 74 BRI-partnering countries and identified socio-economic and natural drivers. The study called for international coordinated action to improve air quality and enhance policy synergies among signatories to the green BRI, the Paris Agreement, and the UN’s 2030 Agenda for Sustainable Development. Third, previous studies have focused on the key fields of green development in BRI construction. Green BRI construction involves many areas such as green infrastructure [6], green trade [7], green policy, green investment [8], green finance [9], green technology [10], and so on. Meanwhile, relevant scholars have studied the specific measures of green development, such as developing a circular economy [11], improving energy-economic efficiency, adjusting the industrial structure [12], improving green total-factor energy efficiency [13,14,15], improving environmental indicators [16], using renewable resources [17,18], strengthening global environmental governance, and tackling global climate change. Peng et al. [13], for example, found that the green total-factor productivity of the countries along the Silk Road economic belt demonstrated increasing trends with time, and factors such as imports, exports, industrial structure, and urban development influenced the growth of green total-factor productivity. Carbon emission reduction is also a research focus of GDC [19,20]. Indeed, Lu et al. [7] found that technological change and industrial restructuring are the key drivers of emissions reduction, and that the enhancement of carbon efficiency is a critical step for BRI countries to slow the growth of carbon emissions and carbon leakage. Furthermore, Rauf et al. [21] studied the nexus of energy consumption, economic growth, population growth, financial development, and carbon emissions in 65 BRI countries and discovered that energy consumption and economic growth deteriorate environmental quality, while financial development and renewable energy consumption are conducive to the environment.

2.2. Assessment of Green Development Capability

With BRI’s 2013 proposal, along with its continuous advance, the research on BRI’s green development shows a trend of diversification. As such, the assessment of green development capability has become a widely researched topic. The relevant studies mainly focus on evaluating the level of green development of a region by establishing an evaluation index system and adopting quantitative methods. These studies reveal some new data. First, a systematic and complete index system is the basis of green development evaluation [22,23]. Researchers have established evaluation systems from different dimensions. The evaluation index system by Feng et al. includes three dimensions: resource consumption, economic development, and social welfare [24]. Weng et al. [25] established a green development evaluation system comprising five dimensions, namely economic development, resource utilisation, the ecological environment, social progress, and environmental governance. Li’s green development evaluation index system also comprises five dimensions: living environment, pollutant treatment and utilisation, ecological benefit, economic growth, and innovation potential [26]. In addition, many researchers have constructed evaluative index systems for certain industries from different perspectives. Guo et al. [27] constructed an evaluation index system of agricultural green development covering four indicators: social development, economic interests, resource input, and ecological environment. Chen et al. [28] developed an industrial green development evaluation system based on the pressure-response model. Through comparative analysis, the evaluation index system covers multiple dimensions, such as economic development, social progress, resource utilisation, and environmental protection. The index systems are diverse because of the wide range of research themes and scales. Second, relevant studies focus on the urban [26,29] and sub-national scales [30]. In recent years, research on BRI countries has become more common. Cheng et al. [28] evaluated the green development levels of 49 BRI countries and found that levels varied from high to low from the west to the east, and that spatial differentiation has strong global spatial dependence. Huan et al. [31] evaluated the performance of the SDG of 15 countries in the BRI by constructing a comprehensive evaluation system of the UN’s Sustainable Development Goals based on four dimensions: society, the economy, the environment, and implementation. They also put forward various national development modes and relevant policy suggestions.
These existing studies suffer from two key shortcomings. (1) They mainly focus on evaluating the green development level of single regions or comparing the differences among regions; thus, they do not adequately cover international cooperation towards green development. Since it is impossible for these studies to observe the cooperative relationships, the strength of association, and changing trends in green development between countries, it is also difficult to truly assess any given country’s green development progress. (2) They fail to acknowledge that in regard to common development issues, countries influence and interact with each other, eventually forming a complex network of interconnections. It is difficult to describe the characteristics of spatial structure based only on the attribute data; therefore, it is essential to consider relational data to objectively represent the characteristics of cooperative relations among countries in the field of green development.

2.3. Social Network Analysis

Social network analysis is a theory or method designed to measure the relationships of certain characteristics among countries [32,33]. It is mostly used to assess trade relations [34,35], tourism flows [36], and regional innovation systems [37] among countries. In fact, social network analysis has become the mainstream method of spatial relationship analysis, and an increasing number of scholars are beginning to pay attention to the characteristics of network structure. Thus, introducing social network theory and network science method into GDC research can explain the complex phenomenon of international cooperation. In the field of GDC, existing studies focus on collaborative exploitation of water resources [38], clean energy cooperation [39], and industrial symbiosis [40]. Sun et al. [41], for instance, calculated the degree of synergy necessary to construct the mine–water network of ten mining provinces along the Yangtze River Economic Belt. They then analysed network characteristics and key elements by employing the social network analysis method to reveal the mechanisms of mineral exploitation in the water environment. Kang et al. [39], meanwhile, analysed the position of the countries in the global network on clean development mechanisms and suggested that a participating country’s position in the collaboration network significantly affects its innovation environment. This in turn determines the country’s impact on the entire network as well as its access to knowledge and information. In addition, some scholars have used social network analysis to analyse the collective actions and strategies of different stakeholders in green development, such as industrial park cooperation [42] and urban sustainable development cooperation [43,44]. However, there are few studies on international green cooperation from a quantitative perspective, indicating that the international GDC network is still a relatively neglected area. In order to narrow the research gap, then, this study explores the GDC network among BRI countries from a quantitative perspective.
There are three advantages to using the social network analysis method. First, the structural characteristics of the overall network can be analysed from a quantitative perspective, which can directly reflect the cooperative relationship between countries in the field of green development. The dynamic change process of the cooperative network can be intuitively grasped and the development trend of the future relationship network can be predicted by indicators such as density, relevance, efficiency, and rank. Second, the status and role of different countries in the cooperative relationship network can be identified, such as advanced, middleman, and laggard. According to the social network theory, the ‘core players’ are in the core position of the network and have command of the control power and radiation power. The ‘laggers’ are at the edge of the network and the ‘middlemen’ act as a bridge between countries and organisations, or control vital resources or access to information [32]. Centrality analysis provides a feasible way to understand how countries are embedded in the network and helps to identify the role and status of each country in the cooperative network. Third, there are various attributes of community groups in the social network. Through the analysis of community structure, we can identify the strong and weak communities in the network, and then analyse the regional reasons for the formation of these communities, so as to put forward corresponding policies and suggestions. Thus, this paper adopts the social network analysis method to expound the structural characteristics of the GDC network from the whole network, individual nodes, and community, in order to provide a reference for the green BRI.

3. Materials and Methods
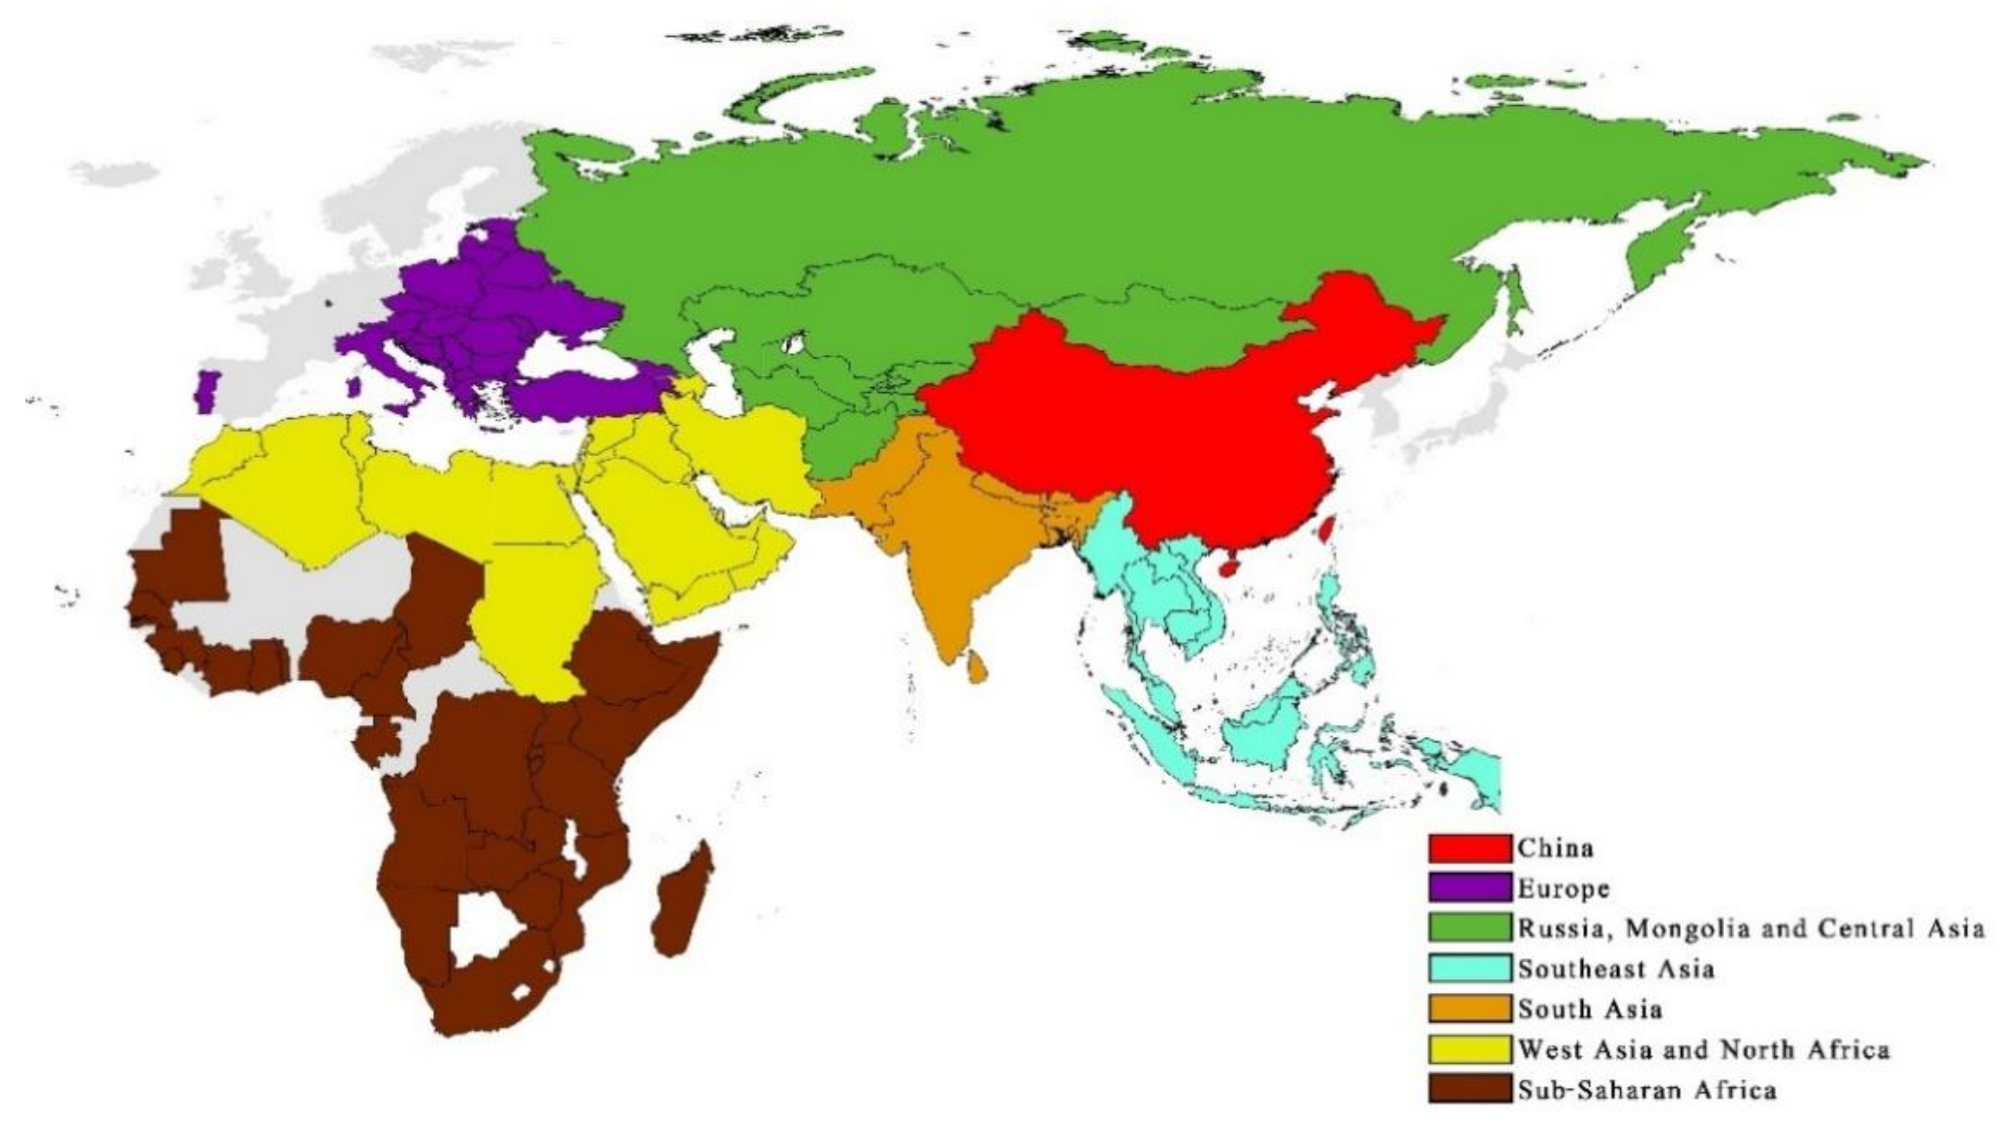
3.1. Study Area

The BRI is an open network of international development cooperation with no strictly defined spatial scope. It was launched in September 2013 and grew from an initial 65 countries to 145 by December 2020. The participating countries cover six continents, namely, Asia, Europe, Africa, Oceania, North America, and South America. Furthermore, the BRI proposes the establishment of six major international economic cooperation corridors, including the New Eurasian Land Bridge, China–Mongolia–Russia, China–Central Asia–West Asia, China–Indian Peninsula, China–Pakistan, and China–Bangladesh–India–Myanmar. Considering the natural environment and socio-economic connection of the six international economic corridors, the selected study area is divided into six regions and 104 countries, comprising 28 countries in Europe, Russia, and Mongolia, six countries in Central Asia, 10 countries in Southeast Asia, seven countries in South Asia, 20 countries in West Asia and North Africa, and 30 countries in Sub-Saharan Africa (Figure 1).
There are two main bases for geographical zoning. First, considering the natural environment, economic and social development, and historical and cultural factors of each continent can be used as a basis for the division. Second, this paper focuses on the global geopolitical environment around China, and at this stage, from the perspective of China. This geographical division makes it easier to understand the BRI as the framework of the world political and economic system [45].
According to Chinese officials, countries that have signed cooperation agreements with China on the cooperative agreements are collectively referred to as BRI countries. According to data from the World Bank’s (WB) data, the 104 BRI countries had a land area of 60.63 million square kilometres, a GDP of 19.24 trillion dollars, and a population of 4.37 billion in 2018, accounting for 45.92%, 22.26%, and 57.5% of the world’s total, respectively.

3.2. Evaluation System and Data Collection

The connotation of green development can be addressed both broadly and narrowly: the former emphasises the coordinated development of economy, society, resources, and environment, while the latter emphasises the sustainable development of ecology, resources, and environment. Therefore, the evaluation system utilises the former perspective. Due to the differences in research objects and national development stages, different countries have different research emphases on the evaluation dimensions [46]. Developed countries seldom focus on economic development; their studies therefore generally emphasise harmony, well-being, and social inclusiveness within communities. However, developing countries such as China are in the stage of high economic development; domestic Chinese research thus covers economy, society, resources, and the environment, emphasising the harmonious coexistence of humankind and nature in addition to the coordinated development of economic, ecological, and social benefits [25].
To ensure that the evaluation of green development capability is scientific and reasonable, this paper seeks to establish an evaluation system of green development capability using the frequency statistical method, expert consulting method, and theoretical analysis method. The evaluation index system comprises four dimensions: economic development, social progress, resource utilisation, and environmental governance, with a total of 25 specific indicators (Table 1).
To ensure the reliability of the index and the integrity of the data, the data used is mainly taken from official websites, including the UN Food and Agriculture Organisation (or FAO) (http://www.fao.org/faostat/)(accessed on 12th January 2021), the Chinese BRI database YDYL (https://www.yidaiyilu.gov.cn/)(accessed on 12th January 2021), and the WB database (https://data.worldbank.org/)(accessed on 12th January 2021) from 2013 to 2019 because the latest official data only covers up to 2019. Data from this time period are used because 2013 was the initial year of the BRI, and this study chose 2013–2019 as the time range in which to observe the dynamic changes in the initial stage of the BRI. Data on embassies are derived from the official websites of the foreign ministries of the BRI countries; data on the straight-line distance between capitals comes from Google Earth. The list of the BRI countries can be found through the YDYL network.

3.3. Methods

3.3.1. Synthetic Evaluation Model

The green development capability of each country is evaluated comprehensively by using linear weighting [27,47]. Suppose that x1, x2,…,xn are indicators of the green development capability system. The synthetic evaluation functions are expressed as:
S ( x i ) = j = 1 m x i j ¯ ω j
where S(xi) is the value of the green development capability at time, i, x i j ¯ is the standardised value of the original indicator, xij, and ωj indicate the weight of index j. Min–max normalisation is used to normalise the indexes, and the formula is expressed as:
Positive indicators:
x i j ¯ = x i j x j min x j max x j min
Negative indicators:
x i j ¯ = x j max x i j x j max x j min
where x jmin and x jmax indicate the minimum and maximum values of the indicator j, respectively. The entropy method, which is an objective weighting method, is adopted to calculate the weight wj. The steps are as follows:
e j = 1 ln m j = 1 n p i j ln p i j
p i j = x i j ¯ + 1 i = 1 n ( x i j ¯ + 1 )
ω i j = 1 e j j = 1 n ( 1 e j )
where pij indicates the proportion of the index j at time i, ej is the information entropy of the indicator j, and m and n represent the quantities of years and the indicators, respectively. The indicator weights of green development capability are shown in Table 1. The green development capability is the output of the synthetic evaluation model.

3.3.2. Modified Gravity Model

The gravity model has commonly been applied to analyse the spatial correlation characteristics of transportation, trade, population migration, and so on [48,49]. Therefore, it can also be used to measure cooperative linkages among countries engaged in green development. The function is expressed as:
P i j = k · G i · G j D i j 2
where Pij is the connection degree between two countries in GDC, k is the gravitational constant (in which k is equal to 1), Gi and Gj are the green development capacities of countries i and j, respectively, and Dij is the distance of cooperation between country i and j (which is measured by the spatial distance and diplomatic distance between countries). The spatial distance is expressed as the straight-line distance between the two capitals. Linear distance is an ideal distance form representing the cooperative relationship between countries in a spatial context. Proximity, however, is not always an indicator of good relations between countries; one such example is India and Pakistan. Therefore, we also introduce diplomatic distance, hoping to represent bilateral relations between countries from the perspective of international politics. The diplomatic distance is assigned to the actual situation of establishing embassies, in which one embassy is assigned a value of 1 and no embassy is assigned a value of 0.5. Therefore, the arithmetical mean is used to combine the Euclidean distance with the diplomatic distance to obtain the cooperation distance (Dij), in which the value range is also between 0 and 1.

3.3.3. Social Network Analysis Method

The social network analysis method is suitable for analysing the GDC network, as it lends itself to the whole network analysis and node analysis.

Network Analysis

Network strength and network correlation are used to describe the overall structural characteristics of the GDC network [50]. Network strength is characterised by the number of network relationships (network relationship number) and network density. The network relationship number is the sum of connections between a country and other countries, which represents the extent of green cooperation among countries. The higher the number of network relationships, the greater the network strength. Network density, on the other hand, measures the closeness of node connections and represents the closeness of green cooperation among countries. The greater the density, the closer the connection. Since the cooperative network is a directed association network, the maximum number of association relationships that can exist among countries is n(n−1). The function is expressed as:
D = L n ( n 1 )
where D is network density, L is the number of actual relationships in the network, and n is the number of nodes.
Network correlation is represented by three indicators, including network connectedness, hierarchy, and efficiency. Network connectedness represents the robustness and vulnerability of the GDC network. If the connectedness is equal to 1, the whole network structure is robust; otherwise, the structure tends to be loose. Network hierarchy indicates the extent to which countries are asymmetrically accessible and reflects whether they have a rigid hierarchical structure in the network. The stronger the asymmetry, the higher the hierarchy and the lower the correlation. Network efficiency, meanwhile, refers to the extent to which redundant connections exist in the networks. The smaller the number of redundant connections, the greater the number of two-way overflow lines, which indicates that the network efficiency is higher and the whole correlation is stronger. The functions are expressed as:
C = 1 V N ( N 1 ) / 2
G H = 1 V 1 max ( V 1 )
G E = 1 V 2 max ( V 2 )
where C is connectedness, GH is graph hierarchy, GE is graph efficiency, V is the number of unreachable point pairs in the network, V1 is the number of symmetrically reachable pairs, V2 is the number of extra links, max(V1) is the number of reachable point pairs between two points, max(V2) is the maximum possible number of excess links, and n is the scale of the network.

Node Analysis

Individual node analysis reflects the centrality of nodes in the network, which reveals the role played by each node in the overall network and the differences in roles assumed by each node. Centrality analysis is used to describe the structural characteristics of individual nodes in the GDC network, including degree centrality, betweenness centrality, and closeness centrality [50].
Degree centrality is the number of lines directly connected with a node, indicating the degree to which the node is close to the centre of the entire network. In the directed graph, the degree centrality of each country can also be divided into outdegree and indegree centrality [51,52]. The former represents the controlling power of the node country over other countries and the outgoing radiating capability of the GDC network. The latter represents the prestige and attractiveness of the country compared to others in the GDC network.
Betweenness centrality is the ratio of the number of shortcuts connecting two nodes through a third node to the total number of shortcuts between these two nodes, representing the ability of this node to control other nodes.
Closeness centrality is the sum of the shortcut distances between a node and all other nodes in the overall network, representing the proximity between the node and other nodes in the GDC network. It is divided into outdegree and indegree closeness centrality in the directed graph.
C R D ( i ) = C A D ( i ) n 1
C b t = 2 j n k n b j k ( i ) ( n 1 ) ( n 2 )
C A P ( i ) - 1 = i = 1 n d i j
where CRD(i) is relative degree centrality, CAD(i) is absolute degree centrality, Cbt is betweenness centrality, bjk(i) is the ability of a third country to control the relationship between countries j and k, C−1AP(i) is closeness centrality, dij is the shortcut distance between countries i and j, and n is the number of countries.

Community Analysis

Community structure is one of the most important and universal topological properties of complex networks. Information dissemination within the same community is relatively fast, while that among societies is relatively slow. Modularity is a commonly used standard to measure community division quality in recent years. The modularity of a partition measures the density of links inside communities. In the case of weighted networks, it is defined as
Q = 1 2 m i , j A i j k i k j 2 m δ ( c i , c j )
where Aij represents the weight of the edge between i and j, k i = j A i j is the sum of the weights of the edges attached to vertex i, ci is the community to which vertex i is assigned, the δ function δ(u, v) is 1 if u = v and 0 otherwise and m = 1 2 i j A i j .
Blondel et al.’s algorithm contains two phases that are repeated iteratively. The first stage is that the nodes in the network are assigned to different communities. Here, the node i is placed in the community C with the largest gain of modularity ΔQ. The second phase is the establishment of the new network. The weights of the links between the new nodes are determined by the sum of the weights of the links between nodes in the corresponding two communities [53]. The formula ΔQ is as follows:
Δ Q = i n + 2 k i , i n 2 m t o t + k i 2 m 2 i n 2 m t o t 2 m 2 k i 2 m 2
where Σin is the sum of the weights of the links inside C, Σtot is the sum of the weights of the links incident to nodes in C, ki is the sum of the weights of the links incident to node i, ki,in is the sum of the weights of the links from i to nodes in C, and m is the sum of the weights of all the links in the network.

4. Results

4.1. Spatiotemporal Differences in Green Development Capability

4.1.1. Characteristics of Green Development Capability Overall

The green development capability of 104 BRI countries from 2013 to 2019 was calculated by using the comprehensive evaluation model and entropy method (Figure 2). The results showed that the overall average values from 2013 to 2019 were 0.459, 0.484, 0.473, 0.481, 0.464, 0.478, and 0.470, respectively. It follows that the overall green development level of BRI countries shows an upward trend in fluctuation.

4.1.2. Characteristics of Green Development Capability on the Regional Level

Comparing the green development capability of the six BRI regions from 2013 to 2019 (Figure 2), we found that there is heterogeneity in green development capability between regions.
  • From the perspective of spatial scale, there are differences among regions in their green development capability. Regional development capability is ranked from high to low, namely, Europe, Southeast Asia, Russia and Mongolia, Central Asia, South Asia, Sub-Saharan Africa, West Asia, and North Africa. Among them, the average values of Europe, Southeast Asia, Russia, Mongolia, and Central Asia are always higher than the overall level, while the average values of South Asia, Sub-Saharan Africa, West Asia, and North Africa are always lower than the overall level. Therefore, the capability for green development in different regions of the world is uneven.
  • From the perspective of the time scale, the overall green development level of the regions shows an upward trend. In 2013, the green development capability of Europe; Southeast Asia; Russia, Mongolia and Central Asia; South Asia; Sub-Saharan Africa; West Asia and North Africa were 0.492, 0.474, 0.468, 0.447, 0.439, and 0.423, respectively. In 2019, the regional green development capability of Europe; Southeast Asia; Russia, Mongolia, and Central Asia; South Asia; Africa; West Asia, and North Africa were 0.507, 0.496, 0.476, 0.464, 0.447, and 0.426, respectively. Therefore, the green development capability of six regions shows a rising trend in the fluctuation.

4.1.3. Characteristics of Green Development Capability on the Country Level

The average green development capability of the 104 BRI countries from 2013 to 2019 was calculated, and the top 10 countries were selected (Table 2).
  • Through data collection and comparative analysis, it was found that there is a large disparity in the green development capability among countries; that is, 50 countries are above the average value (0.473) and 54 countries are below the average value. The difference between the largest average value (0.678) in China and the smallest average value in Qatar (0.350) is 0.328.
  • Countries with high levels of green development capability are mostly located in Europe, such as Slovenia (0.560), Estonia (0.557), Poland (0.529), and so forth. In addition, Russia (0.534), Vietnam (0.535), and several other countries maintain a high level of green development capability.
  • Countries with low levels of green development capability, such as Egypt (0.421), Bahrain (0.393), Chad (0.388), Kuwait (0.385), Sudan (0.380), and Qatar (0.350), are mostly located near the Arabian Peninsula and the Sahara Desert. Therefore, there is a great difference in green development capability between countries, which has a great impact on the green cooperation between countries and the green BRI construction.

4.2. Topological Characteristics in the GDC Network

4.2.1. Construction of the GDC Network

To explore the structural characteristics of the GDC network, it is essential to transform the numerical gravity matrix into a relational matrix. After many attempts, connection degree 0.3 was found to be the appropriate breakpoint value. If the value is higher than 0.3, the value is assigned to 1; otherwise, it is assigned to 0, and finally, the converted relationship matrix of 104 × 104 was obtained. The NetDraw function of UCINET software was used to analyse the changing trend of the GDC network from 2013 to 2019. The maps on the GDC network of BRI countries in the most productive years were plotted using the Gephi 0.9.2 software.
BRI countries’ green development is not only affected by native sociometric development, natural resources, environmental conditions, and policy support; it is also influenced by other countries. Cooperation among countries also transcends the geographic adjacent effect and presents a complex network structure. Meanwhile, different countries play different roles and occupy different positions in the cooperative network. Therefore, it is essential to explore the changing characteristics of the GDC network. This section analyses the structural characteristics of GDC from the perspectives of the whole network, nodes, and communities.

4.2.2. Characteristics of the GDC Network Overall

Network strength and correlation were calculated using UCINET 6.0 software, and different characteristics of the overall GDC network were analysed.

Network Strength

The total number of relationships and network density of the GDC network among the 104 BRI countries were measured by using UCINET 6.0 software (Figure 3). The findings are as follows.
  • The total number of relationships of the BRI network has generally increased from 2013 to 2019, indicating that since the BRI was proposed in 2013, the GDC among countries has gradually strengthened and presents a good development trend.
  • The network density of the GDC network in the BRI countries presents trends similar to those of the number of network relations. The relations of GDC among the BRI countries are increasing, whereas the network density level stands at approximately 0.1 (mean value is 0.085). This shows that the compactness of the overall network structure is not high, and the green coordinated development among countries still has much potential for improvement.

Network Correlation

Network connectedness, hierarchy, and efficiency were measured using UCINET 6.0 software (Figure 4).
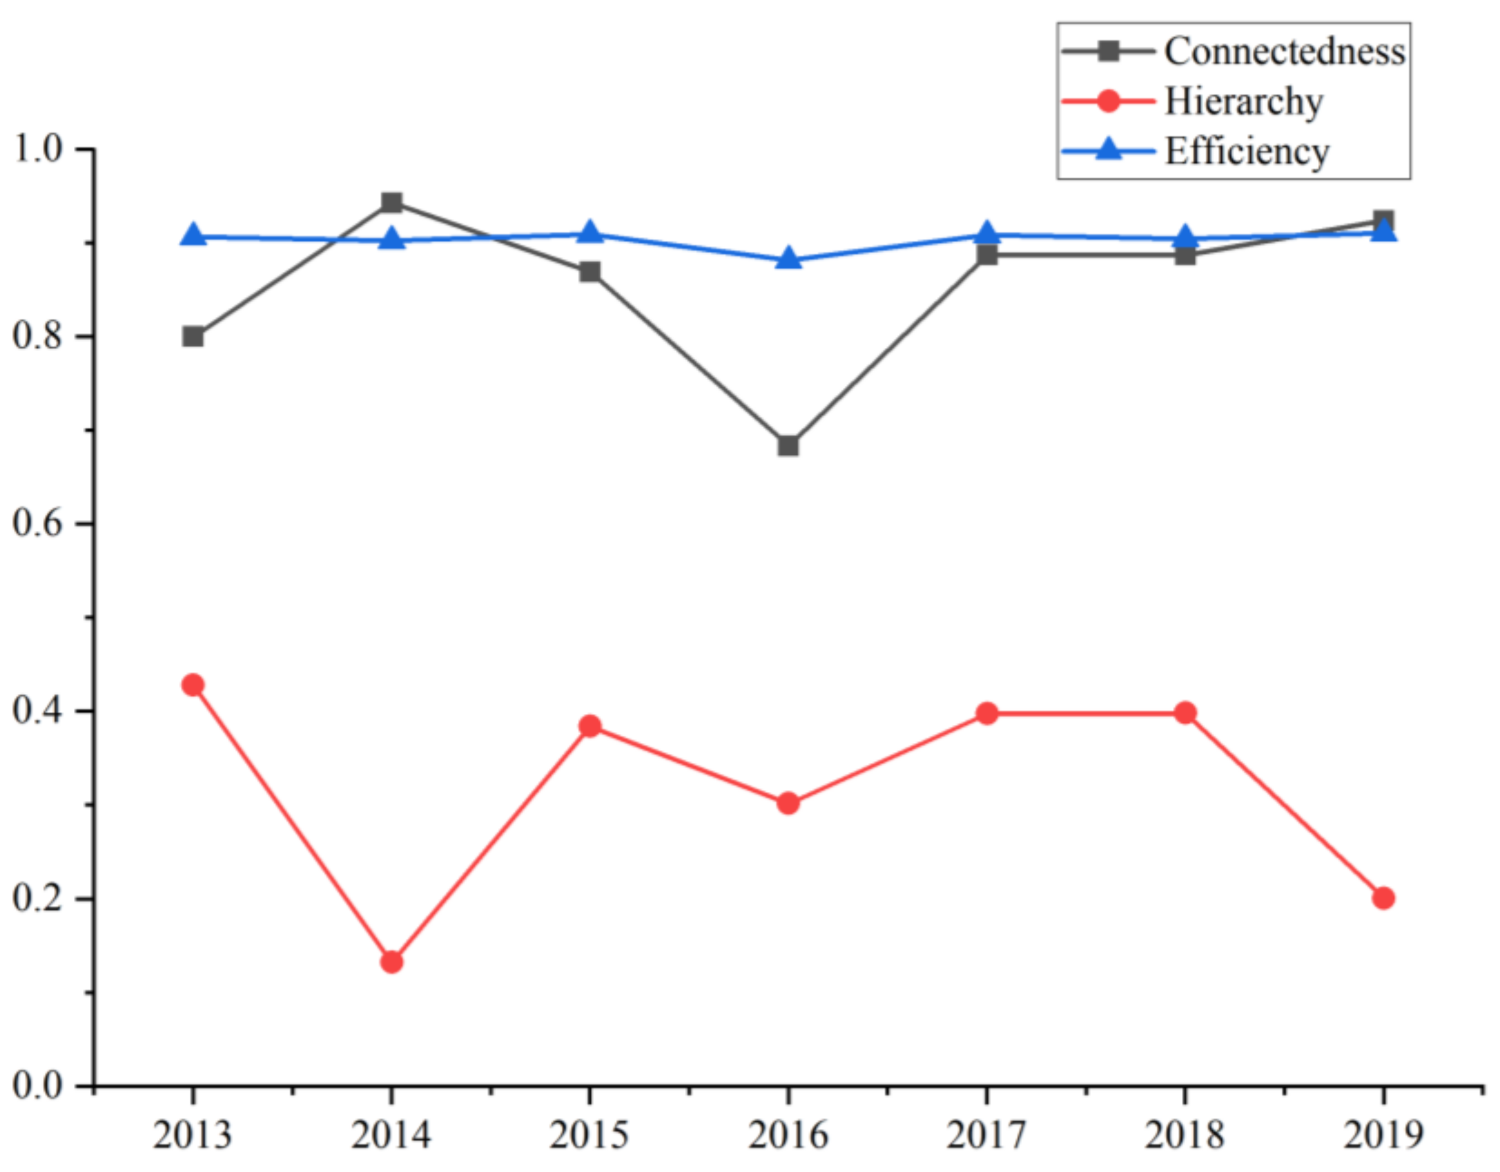
  • Network connectedness shows a fluctuating growth trend and approaches 1.0 on the whole (mean value is 0.856), indicating that the network structure of GDC is in a stable state.
  • The mean value of the network hierarchy is 0.321, showing a fluctuating downward trend, indicating that there is no rigid hierarchical network structure.
  • The average value of network efficiency is 0.904, and the overall volatility is not strong, indicating that the GDC network is stable. Therefore, with the promotion of the green BRI and the implementation of sustainable development strategies, communication and connection among countries in the field of green development are improving, the number of network relationships is gradually increasing, and the stability of the network is constantly being strengthened

4.3. Node Centrality in the GDC Network

Degree centrality, betweenness centrality, and closeness centrality were measured using UCINET 6.0 software, and the status and roles of BRI countries in the GDC network were analysed.

4.3.1. Degree Centrality

Degree centrality indicates whether a country in the GDC network has radiating and controlling power.
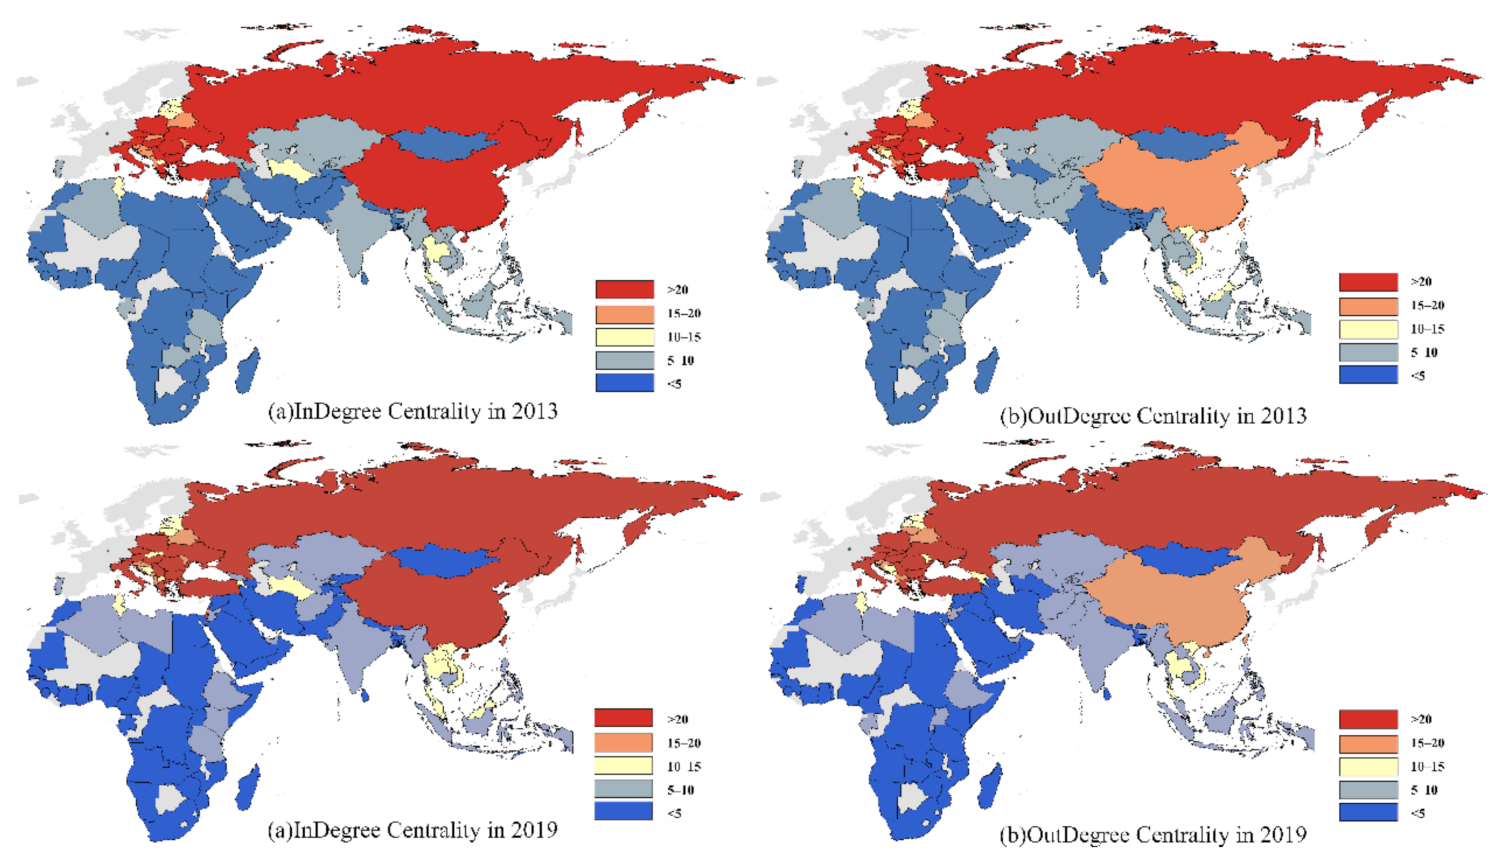
  • According to this measurement, we see that from 2013 to 2019, the mean value of degree centrality increased from 8.106 to 8.607, and 39 network nodes exceeded the mean value. However, the degree centrality of each country generally increased, indicating that more countries were playing an enhanced role in the GDC network. By drawing the distribution maps of degree centrality (Figure 5), sorting out the data of the top 10 countries (Table 3) and comparing the average over seven years (Appendix A), it was found that the European countries with higher degree centrality formed the overwhelming majority, such as Italy, Austria, Greece, and the Czech Republic. Thus, European countries occupy key positions in the GDC network and have strong radiating and controlling power. Russia and China also have higher degree centrality.
  • On the other hand, whilst many countries in West Asia and North Africa have made progress, their degree centrality always ranks at the bottom. Furthermore, they have not been able to effectively interact with other nodes, and their role in the network is weak.
  • The characteristics and changing trend of degree centrality reflect the Matthew effect of ‘strong constant strong’ in the network. Countries with strong green development capability are able to encourage neighbouring countries to carry out green cooperation, resulting in a polarisation effect, while countries with weak green development capability are usually at a disadvantage.

4.3.2. Betweenness Centrality

Betweenness centrality reflects whether the country plays a bridging role in the GDC network.
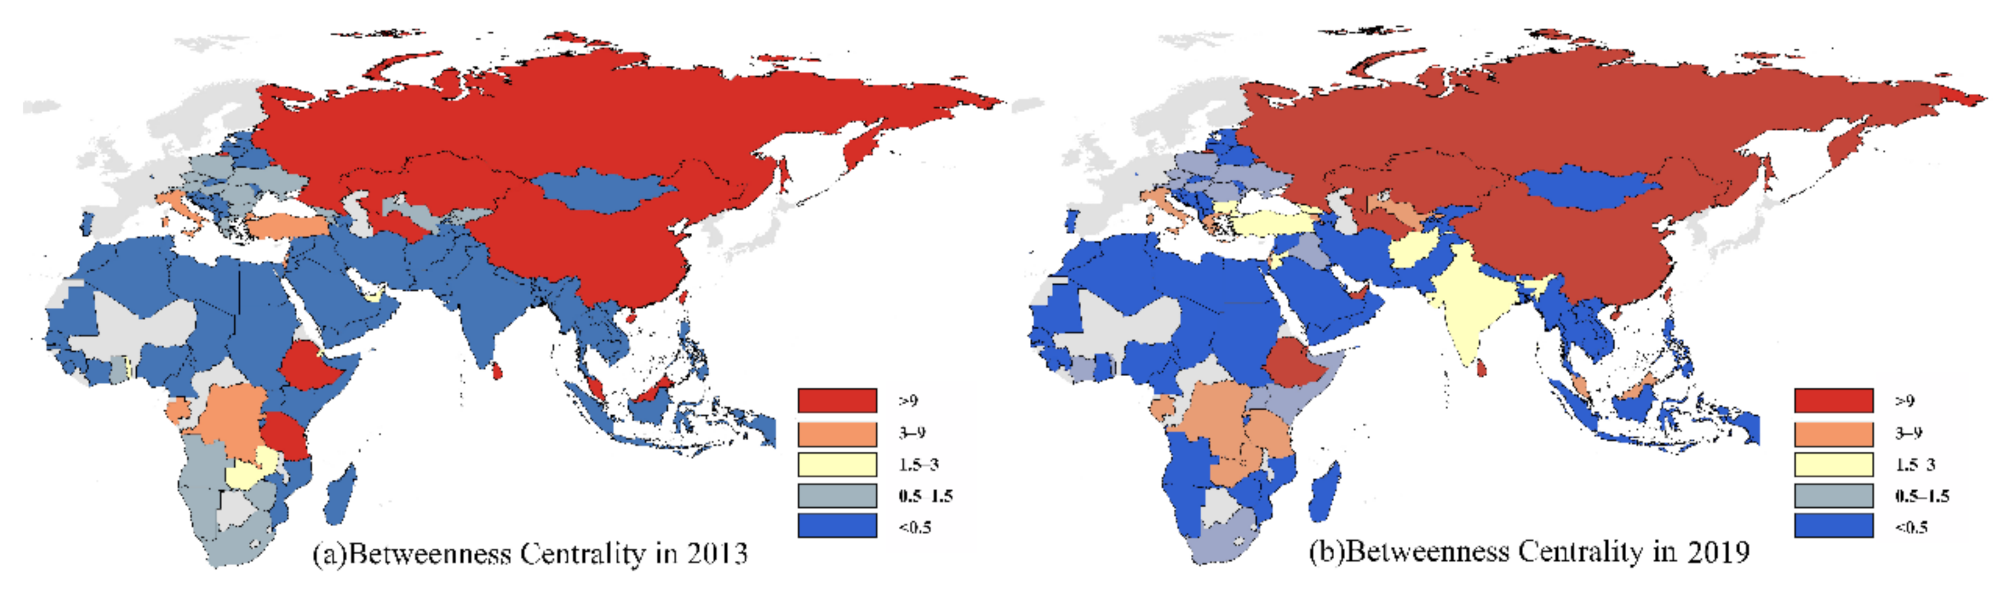
  • According to the measurement of betweenness centrality, the results show that from 2013 to 2019, the number of countries with betweenness centrality above the mean increased from 16 to 22, indicating that more and more countries are playing an intermediary role in the GDC network. However, because most countries are at the edge of the network and have not yet played the role of network intermediation conduction, the pattern of betweenness centrality is unbalanced.
  • By drawing the distribution maps of betweenness centrality (Figure 6), sorting out the data of the top 10 countries (Table 3), and comparing the average over seven years (Appendix A), we found that China and Russia have always played the roles of intermediaries and bridges in the GDC network and have a strong influence on other countries.
  • Central Asian countries such as Kazakhstan, Turkmenistan, and Uzbekistan have a high betweenness centrality and have played an increasingly prominent role in bridging the GDC network. In addition, the betweenness centrality of the key nodes of the maritime Silk Road—which includes such countries as Malaysia, Sri Lanka, and Seychelles—has been enhanced.

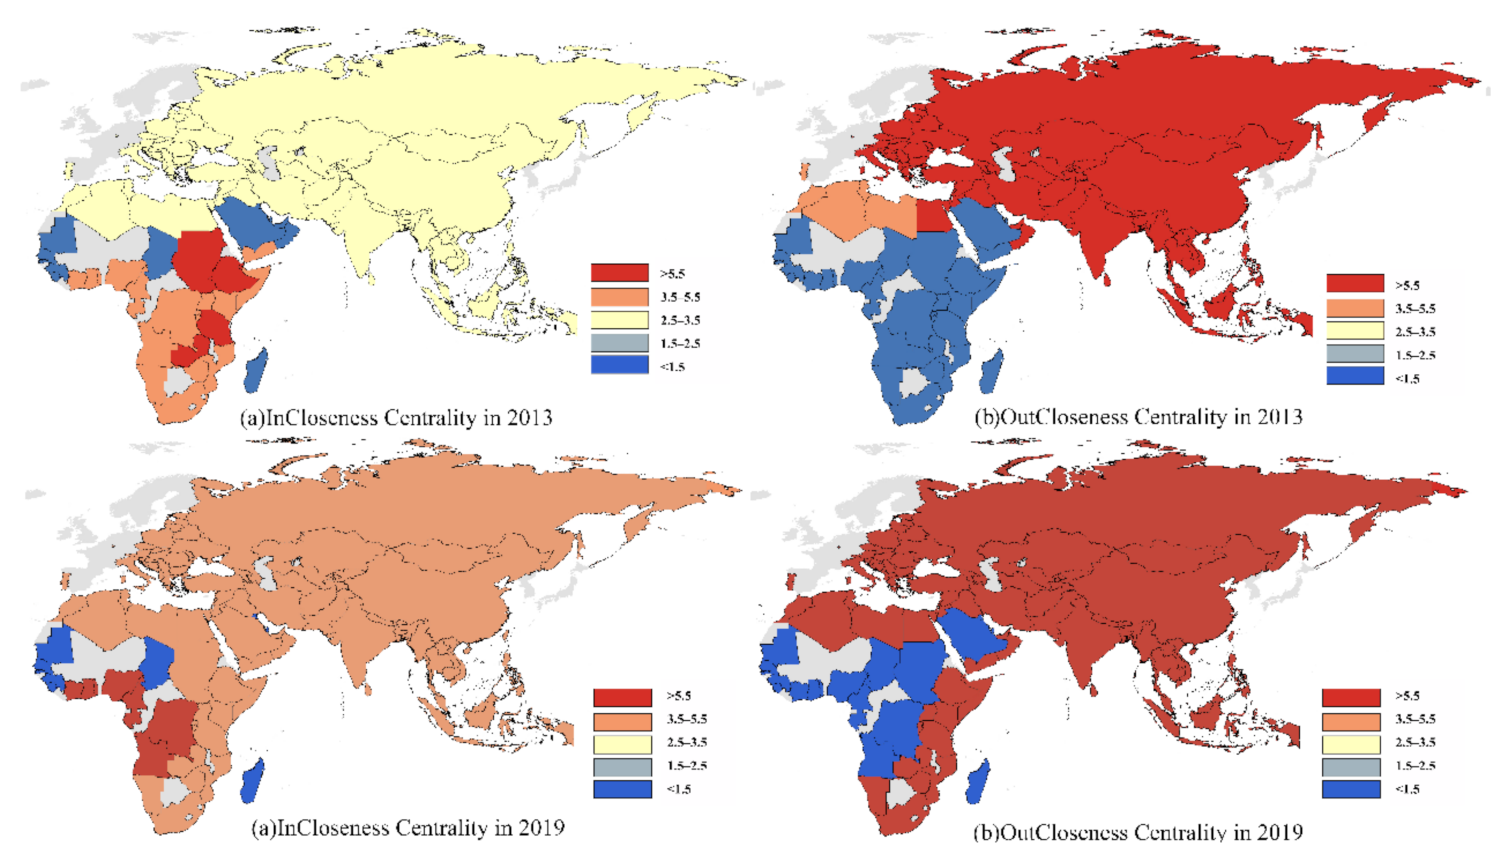
4.3.3. Closeness Centrality

Closeness centrality measures the accessibility between one node and another.
  • According to the measurement of closeness centrality, the results show that from 2013 to 2019, the out-closeness centrality increased more than the in-closeness centrality, and the gap continued to shrink. From 2013 to 2019, the mean value of in-closeness centrality increased from 3.076 to 4.207, while the mean value of out-closeness centrality decreased from 4.130 to 5.954. This indicates that the connections among countries are becoming more convenient, and the cooperation distance is strengthening.
  • By drawing distribution maps of closeness centrality (Figure 7), sorting out the data of the top 10 countries (Table 3), and comparing the average over seven years (Appendix A), it was found that China, Russia, India, and Central Asia’s participating countries, such as the BRICS countries and the Shanghai Cooperation Organisation (SCO), have high out-closeness centrality, suggesting that these countries can quickly make contact with other countries in the GDC network and play the role of the central actors of the outflow network; that is, there is a shorter distance between these countries and other countries in the network and so they can more quickly establish contact with other countries.
  • Sub-Saharan African countries have a higher in-closeness centrality, and these countries can more quickly connect with other countries in the inflow network. Therefore, Sub-Saharan Africa needs more external support in the future green BRI construction.

4.4. Community Structure in the GDC Network

4.4.1. Regional Effects of the GDC Network

According to the heuristic algorithm based on modularity optimisation using Gephi 0.9.2 [53], the community structure of the cooperative network is extracted, and the community division of the GDC network is obtained (Figure 8).

Spatial Characteristics of Communities

With the passage of time, the number of communities increased significantly, and the community space characteristics were significant. From the perspective of the time scale, with the further development of the BRI, more regions and countries have joined to cooperate on green development. In 2013, a total of five communities were identified in the GDC network, including European, Asian, Sub-Saharan African, Middle Eastern, and West African communities. In 2019, the number of communities increased to six, namely European, Indo-Pacific, Central and West Asian, East and South African, Central African, and West African communities. The increase in the number of communities shows that the GDC network is clearly decentralised and the multi-polar pattern gradually emerges. Each community exhibits obvious spatial location characteristics, and most of the communities coincide with the major geographical regions of the world.

Hierarchical Characteristics of Communities

Through comparison, it was found that from 2013 to 2019 the GDC network in different regions became more complex and the cooperation links became stronger. Indeed, Europe, Russia, Mongolia, Central Asia, and Southeast Asia have numerous inter-regional connections, and there is a strong tendency for green cooperation among countries within each region. Most notably, strong and stable cooperative relations have been formed within Europe. There are fewer links, though, between countries in South Asia and West Asia and between countries in North Africa and Sub-Saharan Africa. In addition, China has maintained close cooperation on green development with countries in Southeast Asia, South Asia, and Central Asia.
Furthermore, due to its geopolitical location and history of cooperation, Europe has more cooperative relations with West Asia, North Africa, Russia, Mongolia, and Central Asia. South Asia, in a similar vein, has many cooperative relations with Southeast Asia and Central Asia. However, Sub-Saharan Africa is more isolated and has fewer cooperative ties with other regions.

4.4.2. Characteristics of the GDC Network between China and Other Countries

The degree of connection between China and the other 103 countries in the GDC was calculated, and the software ArcGIS 10.5 was used to divide the values of connection degree into five levels at equal intervals (Figure 9). The findings show that the cooperation pattern between China and the other countries is spatially distributed from high to low in a ladder from east to west, and it is developing gradually over time [28]. First, the BRI is important to China as a measure of how well the country is opening up to the West and how well it is cooperating with other countries in the GDC. As more countries have joined the BRI, the level of cooperation between China and other countries has gradually improved. Meanwhile, because of its geographical advantages, China took the lead in cooperating with Central Asia, the Indo-China Peninsula, and Southeast Asia, so China’s cooperation with these regions is at a high level. The level of cooperation between China and countries in West Asia and Africa, however, is low, but with continued development of the BRI, the level of cooperation between China and other countries has been steadily improving.

5. Discussion

5.1. Factors Influencing the Green Development Capability

According to Figure 2 and Table 1, the overall green development capability in 104 BRI countries from 2013 to 2019 was stable, but there were differences among regions and countries. Economic development, social progress, resource utilisation, and environmental governance affect a country’s capacity for green development [25,26].
First, economic development is the basic condition that affects national green development capability. Countries such as Slovenia, Austria, Estonia, Czech Republic, Italy, and Poland are mostly located in Eastern and Central Europe. According to the revenue standard of the World Bank, these countries are usually high- or middle-income countries, which means they have a strong economic foundation for promoting green development [28]. In recent years, European countries have promoted green transformation as a breakthrough point for economic recovery. Moreover, by formulating new growth strategies and industrial policies, European countries have increased the upgrading and transformation of high-energy consuming industries and focused on developing green industries with energy saving and emissions reduction. However, African countries have low green development capability, which is not only related to the natural environment, but also related to economic development.
Second, social progress is a major guarantee of national green development capability. The key point of green development is to coordinate the relationship between population, resources, and the environment. The slow population growth, the improvement of population quality, the prominent governance concept, and the improvement of social awareness of environmental protection lay a solid social foundation for green development. For example, in recent years, China has been advocating green consumption, low-carbon travel, waste classification, food conservation, and other green lifestyles in society as a whole, which may subtly affect the country’s green development level.
Third, resource utilisation is the key index for measuring national green development capability. The dimension of resource utilisation mainly includes natural resource endowment and utilisation. The industrial structure of the top 10 countries with green development capability is quite different. For example, the economic structure of Bhutan is dominated by agriculture, hydropower, and tourism, while the economic structure of Seychelles is dominated by tourism, fisheries, and handicrafts. The indicators of fossil fuel energy consumption, energy use, and power resource consumption are all in the lowest position in these countries. However, China, with its large population and fast economic and social development, consumes more resources. For example, China’s fossil fuel energy consumption (as a percentage of the total) was 87.67%, and its energy use (per capita kg of oil equivalent) was 2236.73 in 2018. Therefore, China needs to further improve its level of efficient use of natural resources.
Fourth, environmental governance is an important dimension for measuring the level of national green development. The dimension mainly involves the national capacity for environmental governance and technical support. For example, Singapore has a small land area and a lack of resources and energy, so it attaches great importance to energy efficiency. Singapore’s GDP energy consumption per unit in 2018 was 16.000, exceeding that of China (5.690), Russia (5.200), and several other countries. In addition, Singapore pays close attention to the use of clean energy sources such as solar and wind, and develops high-tech industries and modern service industries that save energy and reduce emissions [54]. Therefore, Singapore has a high national green development capability.

5.2. Drivers of the GDC Network Formation

The green development of BRI countries is not only affected by their own economic development, resources and environment, policy support, and other factors, but also affected by other countries, and beyond the geographical proximity effect, showing a complex network structure. By referring to the Level of Analysis method in international relations studies, this paper discusses the mechanism of green development cooperation at the three levels of national, regional, and international systems, and then analyses the multi-factor interaction at each level.

5.2.1. Different Roles for Different Countries

In Figure 5, Figure 6 and Figure 7 and Table 3, we see that BRI countries play different roles in GDC networks, either ‘core players’, ‘middlemen’, or ‘laggers’. It is important to analyse the role of these countries in promoting green BRI construction.
First, the European countries, Russia, and China each have a high degree of centrality. It can be inferred from this that these countries have strong radiating and controlling power in the GDC network, while many countries in West Asia and North Africa have weak green development capability due to war, poverty, and disease, and so their positions in the GDC network are always low. The status of a country in the GDC network is matched with its green development capability, and green development has the Matthew effect of ‘the strong are always strong’.
Second, Kazakhstan, Turkmenistan, Uzbekistan, and other Central Asian countries are playing an increasingly prominent role as bridges. This is because Central Asia is located in the core of the Eurasian continent and is the epicentre of the land Silk Road. China and the five Central Asian countries have strengthened their cooperation in the fields of transportation infrastructure, energy, and agriculture in recent years. They have also accelerated the construction of international corridors and mainland bridges in Asia and Europe, which has had an important role in promoting the GDC network. Meanwhile, other countries, such as Sri Lanka and Seychelles, have a high betweenness centrality because they are located in the key nodes of the maritime Silk Road. China has cooperated with maritime countries in the fields of marine environmental pollution, marine garbage, pollution emergency response, and green ports, and promoted the establishment of a cooperative mechanism for the prevention and control of marine pollution and emergency response. Therefore, the key nodes of the land Silk Road and the maritime Silk Road play an important role as bridges in the GDC network. If problems arise in these bridge countries, the network will be broken and structural holes will form.
Third, participating countries in the BRICS and the SCO, such as China, Russia, India, and the Central Asian countries, have high out-closeness centrality and thus assume the role of central actors. This is because these international organisations will become more active in the field of sustainable development, build up effective cooperative mechanisms, and strengthen sustainable development cooperation between one another. BRIC countries actively build partnerships among cities through exchange platforms and conferences, and also promote inter-city environmental dialogue and cooperation. However, Sub-Saharan African countries have high in-closeness, which is conducive to obtaining external support. For example, the Chinese government and the African Union signed the BRI cooperation plan and the China–Africa GDC plan to promote African countries’ joint achievement of sustainable development goals.

5.2.2. Diversified Regional Cooperative Relations

In Figure 8, on the temporal scale, we see that more regional GDC networks have been formed, showing a polycentric spatial pattern, which indicates that regional green cooperation has been gradually developed. On the spatial scale, countries within each community are closely related, showing the characteristics of coordinated development. There are gradient differences and regional differences between communities. European countries, in particular, have formed a close regional cooperation network, China’s close cooperation with its neighbours is getting stronger, and African sub-regional cooperation is also getting stronger. Therefore, the GDC network of BRI countries has spatial heterogeneity and dependence. However, the interactions between communities are still relatively less, and the trend of synergistic development needs to be strengthened.
First, shared interests form the basis for promoting the formation and development of GDC networks. The GDC relationship of European countries is stronger than that of other regions. This is because most European countries are at the forefront of the world in terms of economic and social development, technological innovation, and environmental protection law. Meanwhile, the European Union has long been established among European countries as a means to strengthen economic and social cooperation within Europe. Particularly in the field of green development, close cooperative ties have already been formed within European countries. A series of cooperation frameworks, such as the EU Emissions Trading System, the Europe 2020 Strategy, and the European Green Deal, have been launched successively to solve the problems of resources, environment, and climate common to European countries. Therefore, regional integration is of great significance to the formation and development of GDC networks among countries.
Second, geographical proximity and long-term cooperative foundations are conducive to further promoting the GDC. The green cooperation between China and 103 countries shows a pattern from high to low moving east to west. This is explained by the fact that due to China’s geographical proximity to these countries and its historical foundation of cooperation, it has been the first country to carry out sustainable cooperation with Southeast Asia, Central Asia, and the Indochina Peninsula countries. For example, GDC between China and ASEAN countries has a long history. On the one hand, due to geographical proximity, cultural proximity, and close historical exchanges, China and ASEAN countries enjoy the advantages of sustainable cooperation. On the other hand, China and ASEAN countries signed a comprehensive cooperation framework agreement as early as the beginning of the 21st century, in which green cooperation is the area of priority. China and ASEAN countries have successively carried out cooperation and exchanges in the construction of ecological cities, sustainable management of marine ecosystems, and technological innovation in green industries, which has formed a long-term mechanism for regional cooperation [55,56]. Therefore, geographical proximity and a historical basis for cooperation are of great significance in promoting the formation of the GDC network.
Third, the sub-regional cooperation mechanism is an important part of the GDC network. There are a large number of sub-regional organisations under the AU framework, such as the Southern African Development Community (SADC), the East African Community (EAC), and the Economic Community of Central African States (ECCAS). These sub-regional organisations play an important role in promoting the regional integration process of the entire African continent. They have also cooperated in areas such as the joint development of water resources, the use of clean energy, and addressing climate change, forming a number of regional green development networks. Therefore, as well as paying attention to the role changes of different countries, China should also pay attention to the formation and development of regional network structures, so as to actively participate in regional green development cooperation.

5.2.3. Strengthening International Cooperative System

In Figure 3 and Figure 4, we see that the GDC network has the characteristics of low density, high connectedness, high efficiency, and low hierarchy.
  • Low network density (mean value is 0.085) indicates that the association density of green development in BRI countries is weak. In order to give full play to the linkage between countries and regions in green development, it is necessary to further strengthen green exchanges between regions.
  • High network connectedness (mean value is 0.856) indicates that the GDC network has good accessibility, and the GDC network structure is stable due to the correlation between countries through direct or indirect paths. Therefore, the BRI countries have the foundation for a sound regional synergy for green development.
  • High network efficiency (mean value is 0.904) indicates that the correlation channels of green development among countries are gradually increasing, and the spatial network structure tends to be stable, but the stability still needs to be improved.
  • Low hierarchy (mean value is 0.321) indicates that the dominant position of a few countries in the GDC network is gradually changing and is showing a trend of collaborative development. BRI countries are increasingly interacting with each other in the field of green development, which is gradually showing a balanced development pattern of all-win.
There are three main reasons for strengthening the green international cooperation system. First, the establishment of international cooperative relations is also related to national interests, diplomatic relations, and regional conflicts between countries. Good international relations are conducive to the formation of GDC networks, and vice versa. Such issues as territorial disputes, resource competition, and ethnic and religious conflicts among Middle Eastern countries such as Israel, Palestine, and Syria may hinder the development of cooperative relations among countries. Therefore, the geopolitical relationship between countries needs to be analysed in greater depth. Second, the implementation of key projects is the key to deepening GDC between countries. While BRI is broadly in the initial stage of construction, China and other countries and regions have already carried out some GDC projects. For example, China and Cambodia, Laos, Myanmar, Thailand, and Vietnam have carried out the Lancang–Mekong Cooperation. China and Singapore have started intergovernmental cooperation projects, including Suzhou Industrial Park, Tianjin Ecological City, and the Chongqing Demonstration Project [54]. These projects have promoted the process of green BRI construction across different fields and levels. Third, strengthening the green cooperation system is conducive to green exchanges between countries and regions, sharing the experience and lessons of green development, and finally jointly coping with the negative impact of global climate change.

5.3. Theoretical and Practical Implications

5.3.1. Theoretical Implications

Firstly, the characteristics of GDC network among BRI countries were illustrated through three levels: network, community, and node. However, there are differences in the formation and development of green development cooperation network among these different levels. At the network level, common national interests and common development problems are significant factors in international GDC relationships. At the community level, geographical proximity, historical and cultural origin, and long-term cooperation foundation significantly affect the formation and development of regional GDC networks. At the node level, development strength, status and role of a country in international relations are key factors that affect the role of the same country in the GDC network [43,44]. This structured analysis framework can provide a reference for future network research.
Secondly, there are significant differences in green development capability between countries and regions. This indicates that the green development level in BRI countries has a strong correlation with economic and social development, and resource and environmental pressure. Therefore, it is feasible to construct an evaluation system for green development capability. The index system constructed, based on the four dimensions of economic development, social progress, resource utilisation and environmental governance, can provide reference for the government to evaluate and analyse the green development level of BRI countries [46].
Thirdly, through the calculation of specific indicators and spatial visualization, the characteristics of green development capability and cooperative relationships of BRI countries are revealed. The integration of multiple quantitative models and methods can therefore provide a set of quantitative methods for network research.

5.3.2. Practical Implications

In order to further promote the green development capability and GDC network among countries, the following policy suggestions are put forward in this paper.

Solutions to Improve Green Development

Based on the four dimensions of the indicator system for green development capability, we suggest the following policy suggestions to enhance national green levels:
BRI countries should improve the quality of economic growth through industrial upgrading, energy restructuring and technological progress. In particular, it is necessary for developing countries to both change the economic growth model and switch from the extensive growth model to the intensive development model.
BRI countries should promote the concept of green living throughout society and encourage urban and rural residents to develop good habits, such as low-carbon consumption, green travel, and resource recycling, in order to establish an environmentally friendly society focused on saving resources.
BRI countries should utilise clean energy, such as wind power, solar energy, and hydropower, to replace the burning of fossil fuels, such as coal and oil, to reduce carbon dioxide emissions. Governments should encourage factories to use clean energy technologies to improve energy efficiency. Governments should also develop environmental protection industries to practice a circular economy.
BRI countries should improve ecological legislation and environmental regulations. Governments should encourage enterprises to improve independent innovation capabilities and R&D in science and technology. In addition, governments at all levels should control the effects of highly pollutive and energy-intensive projects through administrative and economic interventions.

Solutions to Enhance Green Cooperation

Based on our analysis of the GDC network, we propose policy suggestions that strengthen international green cooperation from three dimensions: network, region, and node. Specific suggestions are as follows:
The overall density level of the GDC network is low, indicating green cooperation between countries is still in the initial stage of development. Therefore, the cohesion of the GDC network needs to be strengthened. BRI countries can share the concept of green development, establish an effective exchange platform, and form a long-term coordination mechanism to address the global climate crisis.
The spatial agglomeration phenomenon is obvious in the GDC network: the core region is relatively fixed, while development among subgroups is unbalanced. Therefore, effective interregional linkage should be strengthened to connect all regions. In addition, each region should develop a development strategy which utilises local advantages.
Different countries display different levels of green development and thus play different roles in the GDC network: core countries should lead the promotion of the common development of peripheral countries; intermediary countries should play a bridge role and actively contact neighbouring countries to participate in green cooperation; and peripheral countries should actively improve their own level of green development. This would result in an effective global network of green cooperation and ultimately achieve the UN 2030 Sustainable Development Goals.
Finally, BRI countries, more generally, need to improve cooperation in order to promote exchanges and collective action in more areas and at higher levels around energy efficiency, clean energy, circular economy, environmental protection, low-carbon development, and climate change. BRI countries also need to establish a platform for the exchange of experience, through multi-level, multi-channel dialogues and exchanges, to share the concepts, policies, and practices of successful green development in Singapore, the European countries, and other countries, and thus jointly achieve the 2030 sustainable development goals.

6. Conclusions

This paper explored the spatial and temporal differences in the green development capability of BRI countries and in the characteristics of the GDC network, respectively. The 2013–2019 panel data of six regions and countries were selected for examination. The green development capability and the GDC characteristics of the BRI countries were first analysed by establishing an evaluation system and using the entropy method, modified gravity model, and social network analysis. The node, community, and network structure characteristics of the GDC network were then analysed. Finally, analysis of the theoretical and practical implications was performed.
First, on the temporal scale, the overall green development capability of BRI countries shows a consistent upward trend over time, changing significantly from 2013 to 2019 from a national perspective. In regard to node characteristics, the mean value of degree centrality, betweenness centrality, and closeness centrality increased from 2013 to 2019, indicating that more and more countries played a significant role in the GDC network. Furthermore, in the context of regional structure, the number of communities gradually increased from 2013 to 2019, displaying the characteristics of regionalisation; this was in line with the trend of multi-polarization of global geopolitical patterns. Meanwhile, China’s cooperation with neighbouring countries increased. The cooperation pattern of green development between China and other countries presented a ladder distribution from high to low and from west to east, indicating that China took the lead in green cooperation with neighbouring countries. In addition, sub-regional cooperation in the Middle East and Africa has also increasingly strengthened. Therefore, regional integration, geographical proximity, and long-established cooperation patterns, diplomatic relations, and national interests can affect green cooperative relations between countries. From analysing the characteristics of the overall network, it can be seen that the GDC network of the BRI countries in the field of green development was stable, and that the cooperation network became closer and more stable from 2013 to 2019.
Second, on the spatial scale, countries with strong green development capability are mostly located in Europe, while countries with weak green development capability are in West Asia, North Africa, and Sub-Saharan Africa. In regard to node characteristics, different countries have different roles in the GDC network:
  • China, Russia, and other European countries have strong radiating and controlling power in the GDC network, while many countries in West Asia and North Africa have weak green development capability with consistently low positions in the GDC network.
  • Central Asian countries, such as Kazakhstan, Turkmenistan, Uzbekistan, and other Central Asian countries, and island countries, such as Sri Lanka and Seychelles, play an important role as bridges in the GDC network.
  • Participating countries in the BRIC and the SCO, such as China, Russia, India, and Central Asian countries, have high out-closeness centrality and assume the role of central actors. However, Sub-Saharan African countries have high in-closeness, which provides them with convenient access to external support in the future.
In the context of regional structure characteristics, the GDC network affects both community and regional structures. The community structure is clearly hierarchical. Green cooperation among European countries has been developing for many years; these cooperative relations are maturing compared to those of other regions. By analysing the characteristics of the overall network, it can be seen that green cooperation among the BRI countries is gradually becoming denser and more multi-oriented. Therefore, China should further promote the process of green BRI, strengthen green cooperation with countries around the world, and actively participate in regional cooperation to further consolidate and develop the GDC network in order to jointly realize the UN’s 2030 Agenda for Sustainable Development.
Finally, there are still issues that remain to be addressed by future research. For example, the comprehensive evaluation model was used to calculate the evaluation index system constructed for this study. The results obtained were consistent with the current regional ecological environment and recent economic and social development, indicating that the evaluation index system has some applicability. However, only 25 indicators were selected, which is a relatively small number. Therefore, more indicators should be considered in subsequent studies to improve the green development indicator system. The data used in this paper was obtained from 2013 (the year in which the BRI was founded) to 2019. We will continue to monitor the efforts of BRI countries to achieve green development goals and dynamic changes in the GDC network. These observations will provide a reference for cooperation on sustainable and green development among BRI countries.

Author Contributions

Conceptualization, B.W., A.S., and D.W.; methodology, B.W., A.S., and Q.Z.; software, A.S. and B.W.; validation, B.W. and Q.Z.; formal analysis, B.W. and A.S.; data curation, D.W.; writing-original draft preparation, B.W.; writing-review and editing, B.W., Q.Z., and D.W.; visualisation, A.S. and B.W.; supervision, D.W.; project administration, D.W.; funding acquisition, D.W. All authors have read and agreed to the published version of the manuscript.

Funding

This work was supported by the Science & Technology Basic Resources Investigation Programme of China’s ‘Multidisciplinary Joint Expedition for China-Mongolia-Russia Economic Corridor’ (Grant No.2017FY101300, 2017FY101302), the National Natural Science Foundation of China (Grant No.41771128), and Collaborative Innovation Centre Project of Geopolitical Environment and Frontier Development in Southwest China (Grant No.KJHX2018494).

Institutional Review Board Statement

Not applicable.

Informed Consent Statement

Not applicable.

Data Availability Statement

The data presented in this study are available on request from the corresponding author. The official website that publishes the original data has been described in the article.

Conflicts of Interest

The authors declare no conflict of interest.

Appendix A

The appendix provides the mean value of green development capability and centrality indicators for 104 BRI countries over a period of seven years from 2013 to 2019.
Table A1. BRI countries from 2013–2019.
CountryGreen Development
Capability
OutdegreeIndegreeBetweennessOut-ClosenessIn-Closeness
Afghanistan0.4517.7675.2700.4435.3034.062
Albania0.48315.53415.6730.0255.2634.055
Algeria0.4626.79610.4020.0515.0673.988
Angola0.4232.3581.9420.6731.9096.028
Armenia0.4799.5707.9062.3195.3774.165
Austria0.55727.46227.6001.4265.3044.153
Azerbaijan0.4414.9934.2990.2425.3454.180
Bahrain0.4010.2770.1390.0001.7181.446
Bangladesh0.4130.9713.0510.0005.1173.996
Belarus0.49515.81116.6440.0746.1874.127
Bhutan0.5383.8831.9420.0066.0613.994
Bosnia and Herzegovina0.47113.86914.8400.0176.1864.003
Bulgaria0.52126.49123.4401.4406.2334.148
Burundi0.4233.3291.3870.0042.9465.577
Cambodia0.4848.7388.0440.0226.0854.007
Cameroon0.4332.2191.2480.3882.7485.795
Cape Verde0.4940.9710.9710.0002.7281.004
Chad0.3910.0000.2770.0001.8632.104
China0.68618.16923.71726.8926.3394.205
Cote d’Ivoire0.4380.8322.0811.1192.5904.168
Croatia0.50619.27917.1990.1116.2014.059
Czech Republic0.53225.65923.5780.7526.1734.138
Democratic Republic of the Congo0.4572.4973.6065.4162.8026.398
Djibouti0.4813.7453.1906.3563.1186.051
East Timor0.4815.2700.9710.0006.0523.992
Egypt0.4183.8835.9640.0036.1044.023
Estonia0.55213.73112.2050.0596.1434.116
Ethiopia0.4685.2706.10315.5573.0806.198
Gabon0.5034.8544.5774.1812.7486.067
Gambia0.4511.9420.9710.0002.7001.004
Georgia0.47610.9579.4311.1656.2474.168
Ghana0.4542.2191.8031.4222.6613.853
Greece0.50026.63029.4041.8756.2034.154
Guinea0.4512.3581.5260.8912.8131.002
Hungary0.52123.16222.7460.6066.1384.142
India0.4547.2127.6281.1426.1794.073
Indonesia0.4857.6287.0730.0286.0694.007
Iran0.4516.5195.5481.0916.2144.134
Iraq0.4344.9935.2713.2256.1234.180
Israel0.51117.33719.1403.7986.2894.076
Italy0.52729.95830.0973.9366.2034.160
Jordan0.4598.5996.1030.6376.1864.082
Kazakhstan0.4836.7968.1839.6666.3014.193
Kenya0.4424.8544.9932.4752.9896.019
Kuwait0.3960.4160.6940.1083.4342.619
Kyrgyzstan0.4526.5194.8540.3316.1734.091
Laos0.5238.46110.1250.1236.0314.014
Latvia0.52512.62112.6210.0306.0944.116
Lebanon0.4528.4605.6860.3216.1004.063
Libya0.4297.2126.2410.0315.9483.969
Lithuania0.52514.42413.5920.0896.1804.121
Luxembourg0.5216.7966.7960.3096.0784.101
Macedonia0.49218.44710.8190.0186.1094.045
Madagascar0.4440.0000.1390.0001.8082.112
Malaysia0.5079.7099.9866.9696.1424.013
Maldives0.5124.1612.4973.0446.1383.978
Malta0.4787.7673.8830.0766.0323.978
Mauritania0.4290.9711.9420.0002.7001.004
Moldova0.47812.62114.8400.1096.1374.128
Mongolia0.4612.2193.0520.0196.0324.056
Montenegro0.49614.56315.5340.0116.1414.055
Morocco0.4733.6064.1600.0005.9323.963
Mozambique0.4342.2192.9130.0102.8615.457
Myanmar0.4466.9357.4900.0516.0644.007
Namibia0.4401.8033.6061.8092.8605.497
Nepal0.4643.6063.6060.0736.0803.999
Nigeria0.4040.9711.8030.5612.6565.786
Oman0.4280.9710.9710.0005.9263.655
Pakistan0.4377.3514.7150.1196.1984.040
Philippines0.4666.6578.8770.0186.0414.011
Poland0.52625.10426.4910.6876.1564.152
Portugal0.5234.8548.8770.0345.8833.975
Qatar0.3610.0000.0000.0001.8030.962
Romania0.49825.52026.3521.0046.1834.157
Russia0.52921.08234.25821.7576.2444.299
Rwanda0.4736.6574.4386.5922.9955.875
Saudi Arabia0.4080.4160.6934.2453.0002.932
Senegal0.4603.7443.7440.7172.7841.004
Serbia0.50121.49820.1110.2935.2724.123
Seychelles0.5401.9420.97112.3505.0153.795
Sierra Leone0.4030.6940.6940.0001.8860.990
Singapore0.5168.7389.7090.0626.0364.015
Slovakia0.52421.08215.3950.1986.1184.118
Slovenia0.57219.00117.6150.2986.1204.130
Somalia0.4232.6362.2190.6123.0015.785
South Africa0.4623.6062.9130.4832.9095.477
Sri Lanka0.4453.3293.46713.0506.1833.958
Sudan0.4200.9711.9420.0252.8986.032
Syria0.4254.7151.6650.0016.0843.981
Tajikistan0.4727.9064.8540.1176.0944.054
Tanzania0.4785.5487.6288.4532.8526.023
Thailand0.4849.98610.9572.4865.9454.016
Togo0.4372.2191.6651.3952.5594.039
Tunisia0.48612.48213.0370.2205.8773.998
Turkey0.47224.68828.7103.7215.3634.217
Turkmenistan0.4913.74413.03714.6745.4394.294
Uganda0.4344.4384.0220.4382.1225.896
Ukraine0.48623.44022.0530.5205.3014.147
United Arab Emirates0.4523.7453.0523.5575.3463.846
Uzbekistan0.5019.5708.3226.2235.4264.236
Vietnam0.52511.09610.4020.2845.2224.014
Yemen0.4110.9711.5260.0002.1265.874
Zambia0.4914.9935.8254.5522.0375.764
Zimbabwe0.4693.8832.9130.7282.0355.701

References

  1. Kates, R.W.; Parris, T.M.; Leiserowitz, A.A. What is sustainable development? Goals, indicators, values, and practice. Environment 2005, 47, 8–21. [Google Scholar]
  2. Tian, X.; Hu, Y.Y.; Yin, H.T.; Geng, Y.; Bleischwitz, R. Trade impacts of China’s belt and road initiative: From resource and environmental perspectives. Resour. Conserv. Recycl. 2019, 150, 8. [Google Scholar] [CrossRef]
  3. Huang, M.X.; Li, S.Y. The analysis of the impact of the belt and road initiative on the green development of participating countries. Sci. Total Environ. 2020, 722, 15. [Google Scholar] [CrossRef] [PubMed]
  4. Davila, J.G.; Zhang, J.; Kornov, L. Challenges to carry out transboundary environmental assessment in ASEAN countries. Environ. Impact Assess. Rev. 2020, 84, 10. [Google Scholar] [CrossRef]
  5. Fang, K.; Wang, T.T.; He, J.J.; Wang, T.J.; Xie, X.D.; Tang, Y.Q.; Shen, Y.; Xu, A.Q. The distribution and drivers of PM2.5 in a rapidly urbanizing region: The belt and road initiative in focus. Sci. Total Environ. 2020, 716, 9. [Google Scholar]
  6. Hao, W.; Shah, S.M.A.; Nawaz, A.; Asad, A.; Iqbal, S.; Zahoor, H.; Maqsoom, A. The impact of energy cooperation and the role of the one belt and road initiative in revolutionizing the geopolitics of energy among regional economic powers: An analysis of infrastructure development and project management. Complexity 2020, 2020, 16. [Google Scholar] [CrossRef]
  7. Lu, Q.L.; Fang, K.; Heijungs, R.; Feng, K.S.; Li, J.S.; Wen, Q.; Li, Y.M.; Huang, X.J. Imbalance and drivers of carbon emissions embodied in trade along the belt and road initiative. Appl. Energy 2020, 280, 12. [Google Scholar] [CrossRef]
  8. Mahadevan, R.; Sun, Y.Y. Effects of foreign direct investment on carbon emissions: Evidence from China and its belt and road countries. J. Environ. Manage. 2020, 276, 9. [Google Scholar] [CrossRef]
  9. Zhu, F. Evaluating the coupling coordination degree of green finance and marine eco-environment based on AHP and grey system theory. J. Clean Prod. 2020, 277–281. [Google Scholar] [CrossRef]
  10. Wang, Q.H.; Qu, J.S.; Wang, B.; Wang, P.L.; Yang, T.B. Green technology innovation development in China in 1990–2015. Sci. Total Environ. 2019, 696, 8. [Google Scholar] [CrossRef]
  11. Wang, H.M.; Schandl, H.; Wang, X.Z.; Ma, F.M.; Yue, Q.; Wang, G.Q.; Wang, Y.; Wei, Y.; Zhang, Z.H.; Zheng, R.Y. Measuring progress of China’s circular economy. Resour. Conserv. Recycl. 2020, 163, 12. [Google Scholar] [CrossRef]
  12. Zheng, Y.; Xiao, J.Z.; Cheng, J.H. Industrial structure adjustment and regional green development from the perspective of mineral resource security. Int. J. Environ. Res. Public Health 2020, 17, 6978. [Google Scholar] [CrossRef]
  13. Peng, Y.X.; Chen, Z.; Xu, J.Z.; Lee, J. Analysis of green total factor productivity trend and its determinants for the countries along silk roads. Growth Change 2020, 51, 1711–1726. [Google Scholar] [CrossRef]
  14. Wu, H.T.; Hao, Y.; Ren, S.Y. How do environmental regulation and environmental decentralization affect green total factor energy efficiency: Evidence from China. Energy Econ. 2020, 91, 18. [Google Scholar] [CrossRef]
  15. Zhong, Z.Q.; Peng, B.H.; Xu, L.; Andrews, A.; Elahi, E. Analysis of regional energy economic efficiency and its influencing factors: A case study of yangtze river urban agglomeration. Sustain. Energy Technol. Assess. 2020, 41, 9. [Google Scholar] [CrossRef]
  16. Fang, G.C.; Wang, Q.L.; Tian, L.X. Green development of Yangtze River Delta in China under population-resources-environment-development-satisfaction perspective. Sci. Total Environ. 2020, 727, 11. [Google Scholar] [CrossRef]
  17. Shuai, J.; Leng, Z.H.; Cheng, J.H.; Shi, Z.Y. China’s renewable energy trade potential in the belt-and-road countries: A gravity model analysis. Renew. Energy 2020, 161, 1025–1035. [Google Scholar]
  18. Zuo, Q.T.; Diao, Y.X.; Hao, L.G.; Han, C.H. Comprehensive evaluation of the human-water harmony relationship in countries along the belt and road. Water Resour. Manag. 2020, 34, 4019–4035. [Google Scholar] [CrossRef]
  19. Deng, X.Y.; Du, L.M. Estimating the environmental efficiency, productivity, and shadow price of carbon dioxide emissions for the belt and road initiative countries. J. Clean Prod. 2020, 277, 12. [Google Scholar] [CrossRef]
  20. Hu, M.J.; Li, R.Z.; You, W.H.; Liu, Y.B.; Lee, C.C. Spatiotemporal evolution of decoupling and driving forces of CO2 emissions on economic growth along the belt and road. J. Clean Prod. 2020, 277, 11. [Google Scholar] [CrossRef]
  21. Rauf, A.; Liu, X.X.; Amin, W.; Rehman, O.U.; Li, J.K.; Ahmad, F.; Bekun, F.V. Does sustainable growth, energy consumption and environment challenges matter for belt and road initiative feat? A novel empirical investigation. J. Clean Prod. 2020, 262, 20. [Google Scholar]
  22. Singh, R.K.; Murty, H.R.; Gupta, S.K.; Dikshit, A.K. An overview of sustainability assessment methodologies. Ecol. Indic. 2012, 15, 281–299. [Google Scholar] [CrossRef]
  23. Hak, T.; Janouskova, S.; Moldan, B. Sustainable development goals: A need for relevant indicators. Ecol. Indic. 2016, 60, 565–573. [Google Scholar] [CrossRef]
  24. Feng, Y.J.; Dong, X.; Zhao, X.M.; Zhu, A.K. Evaluation of urban green development transformation process for Chinese cities during 2005–2016. J. Clean Prod. 2020, 266, 12. [Google Scholar] [CrossRef]
  25. Weng, Q.Q.; Qin, Q.D.; Li, L. A comprehensive evaluation paradigm for regional green development based on five-circle model: A case study from Beijing-Tianjin-Hebei. J. Clean Prod. 2020, 277, 11. [Google Scholar] [CrossRef]
  26. Li, Y.; Chen, Y.Y.; Li, Q. Assessment analysis of green development level based on S-type cloud model of Beijing-Tianjin-Hebei, China. Renew. Sust. Energ. Rev. 2020, 133, 10. [Google Scholar] [CrossRef]
  27. Guo, H.P.; Xu, S.; Pan, C.L. Measurement of the spatial complexity and its influencing factors of agricultural green development in China. Sustainability 2020, 12, 9259. [Google Scholar] [CrossRef]
  28. Cheng, C.Y.; Ge, C.Z. Green development assessment for countries along the belt and road. J. Environ. Manage. 2020, 263, 8. [Google Scholar]
  29. Dong, F.; Pan, Y.L.; Zhang, X.J.; Sun, Z.Y. How to evaluate provincial ecological civilization construction? The case of Jiangsu province, China. Int. J. Environ. Res. Public Health 2020, 17, 20. [Google Scholar]
  30. Wang, Y.C.; Lu, Y.L.; He, G.Z.; Wang, C.C.; Yuan, J.J.; Cao, X.H. Spatial variability of sustainable development goals in China: A provincial level evaluation. Environ. Dev. 2020, 35, 12. [Google Scholar] [CrossRef]
  31. Huan, Y.Z.; Liang, T.; Li, H.T.; Zhang, C.S. A systematic method for assessing progress of achieving sustainable development goals: A case study of 15 countries. Sci. Total Environ. 2021, 752, 24. [Google Scholar] [CrossRef]
  32. Borgatti, S.P.; Mehra, A.; Brass, D.J.; Labianca, G. Network analysis in the social sciences. Science 2009, 323, 892–895. [Google Scholar] [CrossRef] [Green Version]
  33. Otte, E.; Rousseau, R. Social network analysis: A powerful strategy, also for the information sciences. J. Inf. Sci. 2002, 28, 441–453. [Google Scholar] [CrossRef]
  34. Liu, Z.G.; Wang, T.; Sonn, J.W.; Chen, W. The structure and evolution of trade relations between countries along the belt and road. J. Geogr. Sci. 2018, 28, 1233–1248. [Google Scholar] [CrossRef] [Green Version]
  35. Zhang, C.; Fu, J.S.; Pu, Z.N. A study of the petroleum trade network of countries along the belt and road initiative. J. Clean Prod. 2019, 222, 593–605. [Google Scholar] [CrossRef]
  36. Casanueva, C.; Gallego, A.; Garcia-Sanchez, M.R. Social network analysis in tourism. Curr. Issues Tour. 2016, 19, 1190–1209. [Google Scholar] [CrossRef]
  37. Ter Wal, A.L.J.; Boschma, R.A. Applying social network analysis in economic geography: Framing some key analytic issues. Ann. Reg. Sci. 2009, 43, 739–756. [Google Scholar] [CrossRef] [Green Version]
  38. Tan, F.; Bi, J. An inquiry into water transfer network of the Yangtze River economic belt in China. J. Clean Prod. 2018, 176, 288–297. [Google Scholar] [CrossRef]
  39. Kang, M.J.; Park, J. Analysis of the partnership network in the clean development mechanism. Energy Policy 2013, 52, 543–553. [Google Scholar] [CrossRef]
  40. Huang, M.; Wang, Z.; Chen, T. Analysis on the theory and practice of industrial symbiosis based on bibliometrics and social network analysis. J. Clean Prod. 2019, 213, 956–967. [Google Scholar] [CrossRef]
  41. Sun, H.; Wang, H.; Hu, X. Synergetic network evolution of mineral exploitation on the water environment in the Yangtze River economic Belt. Nat. Resour. Res. 2020, 29, 3581–3598. [Google Scholar] [CrossRef]
  42. Xiang, P.; Yuan, T. A collaboration-driven mode for improving sustainable cooperation in smart industrial parks. Resour. Conserv. Recycl. 2019, 141, 273–283. [Google Scholar] [CrossRef]
  43. Zeemering, E.S. International connections for local government sustainability initiatives: Networks linking Detroit and Windsor. J. Urban. Aff. 2014, 36, 119–140. [Google Scholar] [CrossRef]
  44. Cidell, J. Cooperating on urban sustainability: A social network analysis of municipalities across Greater Melbourne. Urban. Policy Res. 2020, 38, 150–172. [Google Scholar] [CrossRef]
  45. Lu, D. The global concept and strategy of contemporary China: Analysis on the geopolitical and geoeconomic environment of the belt and road initiative. Sci. Geogr. Sin. 2016, 36, 483–490. [Google Scholar]
  46. Zhang, H.; Geng, Z.; Yin, R.; Zhang, W. Regional differences and convergence tendency of green development competitiveness in China. J. Clean Prod. 2020, 254, 119922. [Google Scholar] [CrossRef]
  47. Yu, J.; Shen, H.Y.; Gou, J.; Zhang, X.Q. The green environment measurement by entropy method: A study based on Minnan Coastal Area in China. J. Clean Prod. 2020, 442–446. [Google Scholar]
  48. Karemera, D.; Oguledo, V.I.; Davis, B. A Gravity model analysis of international migration to North America. Appl. Econ. 2000, 32, 1745–1755. [Google Scholar] [CrossRef]
  49. Khadaroo, J.; Seetanah, B. The role of transport infrastructure in international tourism development: A gravity model Approach. Tourism Manage. 2008, 29, 831–840. [Google Scholar] [CrossRef]
  50. Liu, J. Lectures on Whole Network Approach: A Practical Guide To Ucinet, 1st ed.; Truth & Wisdom Press: Shanghai, China, 2009. [Google Scholar]
  51. Arthur, S.A.; Jason, B. Power and position in the world city system. Am. J. Sociol. 2004, 109, 811–851. [Google Scholar]
  52. Ben, D. On conceptual confusion in empirical analyses of a transnational urban network. Urban. Stud. 2006, 43, 2027–2046. [Google Scholar]
  53. Blondel, V.D.; Guillaume, J.-L.; Lambiotte, R.; Lefebvre, E. Fast unfolding of communities in large networks. J. Stat. Mech. 2008, 2008, P10008. [Google Scholar] [CrossRef] [Green Version]
  54. Chang, I.C.C.; Leitner, H.; Sheppard, E. A green leap forward? Eco-state restructuring and the Tianjin-Binhai eco-city model. Reg. Stud. 2016, 50, 929–943. [Google Scholar]
  55. Feng, T.T.; Gong, X.L.; Guo, Y.H.; Yang, Y.S.; Pan, B.B.; Li, S.P.; Dong, J. Electricity cooperation strategy between China and ASEAN countries under ‘The Belt and Road’. Energy Strateg. Rev. 2020, 30. [Google Scholar] [CrossRef]
  56. Erdiwansyah; Mamat, R.; Sani, M.S.M.; Sudhakar, K. Renewable energy in Southeast Asia: Policies and recommendations. Sci. Total Environ. 2019, 670, 1095–1102. [Google Scholar] [CrossRef] [PubMed]
Figure 1. Sample countries of green development in the BRI.
Sustainability 13 11216 g001
Figure 2. Average values of green development capability on the overall and regional level from 2013 to 2019.
Sustainability 13 11216 g002
Figure 3. Strength index of the overall network structure.
Sustainability 13 11216 g003
Figure 4. Correlation index of the overall network structure.
Sustainability 13 11216 g004
Figure 5. Grade distribution maps of degree centrality.
Sustainability 13 11216 g005
Figure 6. Grade distribution maps of betweenness centrality.
Sustainability 13 11216 g006
Figure 7. Grade distribution maps of closeness centrality.
Sustainability 13 11216 g007
Figure 8. Community structure of the GDC network from 2013 to 2019.
Sustainability 13 11216 g008
Figure 9. Levels of GDC relationships between China and other BRI countries.
Sustainability 13 11216 g009
Table 1. Evaluation index system of green development capability.
System LayerIndex LayerUnitPositive(+)/Negative(-)Resource
Economic
Development
Per capita GDP growth rate%+WB
GDP growth rate%+WB
Imports of goods and services%+YDYL
Net inflow of foreign direct investment%+YDYL
Foreign trade difference between goods and servicesUSD+YDYL
Social
Progress
Life expectancyyear+WB
Maternal mortality rate%-WB
Adolescent fertility rate%-WB
Proportion of women seated in national parliaments%+WB
Net migration as a percentage of the population%+WB
Access to electricity%+WB
Urbanisation level%+WB
Resource
Utilisation+
Energy usekg of oil equivalent per capita-WB
Proportion of fossil fuels to total consumption%-WB
GDP per unit of energy use USD per kg of oil equivalent-WB
Electric power consumptionKWh per person-WB
Proportion of arable land in the total territorial area%+FAO
Forest cover rate%+FAO
Proportion of terrestrial and marine protected areas in the total territorial area%+FAO
Environmental governanceHigh-technology exports USD+WB
Spending as a percentage of GDP%+WB
Number of patentspiece+WB
Researchers in R&D per million people+WB
PM2.5 exposureμg/m3-WB
CO2 emissions per capitametric tons per capita-WB
Table 2. Top 10 countries in green development capability from 2013 to 2019.
2013201420152016201720182019
1China
(0.672)
China
(0.693)
China
(0.691)
China
(0.698)
China
(0.673)
China
(0.688)
China
(0.678)
2Slovenia
(0.554)
Slovenia
(0.588)
Slovenia
(0.572)
Slovenia
(0.582)
Slovenia
(0.565)
Slovenia
(0.571)
Slovenia
(0.560)
3Singapore
(0.539)
Austria
(0.568)
Austria
(0.554)
Austria
(0.561)
Austria
(0.553)
Austria
(0.568)
Estonia
(0.557)
4Austria
(0.538)
Singapore
(0.568)
Estonia
(0.549)
Estonia
(0.559)
Estonia
(0.547)
Estonia
(0.561)
Austria
(0.554)
5Seychelles
(0.535)
Estonia
(0.561)
Seychelles
(0.546)
Bhutan
(0.558)
Bhutan
(0.534)
Bhutan
(0.547)
East Timor
(0.553)
6Estonia
(0.534)
Seychelles
(0.558)
Bhutan
(0.540)
Vietnam
(0.544)
Czech
(0.524)
Czech
(0.538)
Bhutan
(0.550)
7Russia
(0.527)
Czech
(0.590)
Vietnam
(0.53)
Seychelles
(0.543)
Seychelles
(0.524)
Seychelles
(0.537)
Vietnam
(0.535)
8Lithuani
(0.517)
Russia
(0.544)
Czech
(0.537)
Czech
(0.540)
Vietnam
(0.521)
Vietnam
(0.536)
Russia
(0.534)
9Latvia
(0.515)
Bhutan
(0.544)
Slovakia
(0.528)
Italy
(0.539)
Portugal
(0.520)
Poland
(0.534)
Seychelles
(0.530)
10Czech
(0.509)
Lithuania
(0.543)
East Timor
(0.528)
Hungary
(0.539)
Poland
(0.519)
Italy
(0.533)
Poland
(0.529)
Table 3. Top 10 countries with high centrality.
20132019
OutdegreeIndegreeBetweennessOut-Closeness In-ClosenessOutdegreeIndegreeBetweennessOut-Closeness In-Closeness
1Italy
(29.126)
Russia
(33.981)
China
(30.705)
Bahrain
(6.186)
Sudan
(5.889)
Italy
(30.097)
Russia
(34.951)
China
(29.621)
Uzbekistan
(7.568)
Congo
(8.097)
2Austria
(26.214)
Italy
(30.097)
Russia
(25.972)
Arab
(6.142)
Ethiopia
(5.822)
Austria
(27.184)
Greece
(31.068)
Russia
(22.026)
Turkmenistan
(7.535)
Gabon
(7.658)
3Greece
(25.243)
Turkey
(30.097)
Malaysia
(16.340)
Oman
(5.829)
Tanzania
(5.706)
Greece
(26.214)
Italy
(30.097)
Ethiopia
(21.519)
Kazakhstan
(7.529)
Angola
(7.596)
4Czech
(25.243)
Austria
(27.184)
Sri Lanka
(16.186)
Seychelles
(5.774)
Djibouti
(5.565)
Bulgaria
(26.214)
Austria
(28.155)
Sri Lanka
(15.672)
Djibouti
(7.524)
Cote d’Ivoire
(7.289)
5Turkey
(24.272)
Greece
(26.214)
Kazakhstan
(16.041)
Kazakhstan
(5.751)
Zambia
(5.508)
Czech
(25.243)
Turkey
(28.155)
Seychelles
(15.106)
China
(7.518)
Togo
(7.228)
6Poland
(24.272)
Poland
(25.243)
Ethiopia
(15.201)
Turkmenistan
(5.741)
Zimbabwe
(5.473)
Romania
(25.243)
Romania
(26.214)
Arab Emirates
(14.448)
Russia
(7.491)
Nigeria
(7.148)
7Romania
(24.272)
Romania
(24.272)
Seychelles
(15.106)
China
(5.741)
Rwanda
(5.447)
Poland
(25.243)
Poland
(26.214)
Turkmenistan
(12.684)
Israel
(7.480)
Cameroon
(7.148)
8Hungary
(22.330)
China
(24.272)
Turkmenistan
(14.482)
Russia
(5.729)
Uganda
(5.444)
Hungary
(24.272)
Bulgaria
(24.272)
Kazakhstan
(10.919)
India
(7.458)
Ghana
(6.835)
9Ukraine
(22.330)
Czech
(23.301)
Tanzania
(13.599)
Sri Lanka
(5.706)
Kenya
(5.444)
Ukraine
(24.272)
Czech
(23.301)
Djibouti
(9.890)
Armenia
(7.426)
Saudi Arabia
(4.543)
10Bulgaria
(22.330)
Hungary
(22.33)
Rwanda
(7.646)
Israel
(5.703)
Somalia
(5.410)
Russia
(23.301)
China
(23.301)
Malaysia
(8.772)
Sri Lanka
(7.421)
Russia
(4.522)
Publisher’s Note: MDPI stays neutral with regard to jurisdictional claims in published maps and institutional affiliations.

