Article

Can Adaptive Governance Promote Coupling Social-Ecological Systems? Evidence from the Vulnerable Ecological Region of Northwestern China

1
School of Economics and Management, China University of Geosciences, Wuhan 430078, China
2
Fanli Business School, Nanyang Institute of Technology, Nanyang 473004, China
3
Academy of Science and Technology Development, China University of Geosciences, Wuhan 430074, China
4
Land and Resources Investigation and Monitoring Institute, Department of Natural Resources of Ningxia Hui Autonomous Region, Yinchuan 640104, China
*
Author to whom correspondence should be addressed.
Sustainability 2021, 13(20), 11247; https://doi.org/10.3390/su132011247
Submission received: 11 September 2021 / Revised: 4 October 2021 / Accepted: 9 October 2021 / Published: 12 October 2021
(This article belongs to the Section Sustainable Management)

Abstract

:
Adaptive governance is increasingly considered a feasible approach to address the uncertainties and complexities of social-ecological system (SES), whereas its role on SES coupling has not been sufficiently testified. Empirical evidence is provided in this paper with the case of northwestern China, a region struggling with economic backwardness and ecological vulnerability. Given the ambiguities in scholarship on the causal relationship between adaptive governance and SES coupling, we develop a theoretical framework to outline the driving mechanism of adaptive governance by focusing on its impact on ecosystem service (ES) delivery. Within the framework, ecosystem governance and social system governance are identified as pathways of adaptive governance, which are estimated on their effects on SES coupling by FGLS. The results show that (1) only the synergy of them can positively promote SES coupling rather than isolated one of them, and (2) only social system governance presents a lustrous role in restraining the effect of resource-dependence on SES coupling as opposed to ecosystem governance. The practice of northwestern China again evidences its key leader’s role in seizing the opportunity window and social innovation. The results further uncover the necessity of synthesizing the social and ecological dimensions for shaping adaptive governance and the direction of targeted reforms for catalyzing the transition to adaptive governance.

1. Introduction

The overexploiting of natural resources and excessive emission has caused severe problems, e.g., forest degradation [1], biodiversity loss [2], agrifood debt [3], and insufficient impetus of development [4], arousing concerns on the sustainability of ecosystem service delivery and human well-being [5]. The perceived threats highlight the inherent connections between the ecosystem and the social system and the importance of treating them as a coupled whole [6]. The social-ecological system (SES) was proposed to merge the artificial division between the social and ecological systems and quickly became a hot research frontier in sustainability science [7]. In an SES, subsystems interact at multiple levels, express reciprocal feedback, and generate outcomes at the SES level [8]. To pursue sustainability in this complex dynamic, an SES should avoid moving into undesired configurations and sustain its functionalities of providing ES [9], which asks for the capacity of the governance system to shape the structures and processes of ES delivery between the ecological systems and the social users [10].
After continuous theoretical searching, adaptive governance was emergent and increasingly accepted as a feasible approach to coping with SES’s uncertainties and complexities [6]. The initial proposers of adaptive governance, Dietz et al. [11], suggested that adaptive governance is a strategy to manage the human–environmental interactions for solving the “tragedy of the commons” based on information abundance, policy flexibility, and multi-participation of stakeholders. Then, adaptive governance was increasingly called upon by the scholars of resilience as an approach of building up resilience management to remain or transform to a desired state of the coupled SES in the face of unexpected and abrupt changes [6]. In 2005, Folke et al. [12] presented a synthetic set of standards for transformation towards adaptive governance in their pioneering work, which mainly involved contents of social capital and social networks. Since then, studies on adaptive governance have increased dramatically, and scholars began to shift their focuses from a theoretical exploration to the search for potential real cases that closely match the characteristics of adaptive governance [6].
In the last two decades, most of the case studies of adaptive governance have provided significant insights into converting conventional ecosystem management into adaptive governance. Olsson et al. [13] provide an early case study to illustrate how social transitions created conditions for the emergence of adaptive governance in Kristianstad of Sweden. By establishing a comparative study of cases, Olsson et al. [14] further pointed out the existence of a “window of opportunity” for shifting to adaptive governance between the preparation and transition phases of governance transformation. Through deepening the case study of Kristianstad, Olsson et al. [15] found that the connectors and the leadership are the two crucial features for promoting the “fit” between ecosystems and governance systems in establishing adaptive governance. To “fit” adaptive governance to ecosystems geographically [14], Huitema et al. [16] introduced a notion of “bioregional scale”, referring to a regional scope crossing the administrative boundaries to assure the priority of governance on such an area being stuck in ecological dilemmas. Schultz et al. [17] studied three well-studied cases differing in geographical scales and detected some commons among them, including valuing the knowledge of ecological dynamics, enabling multilevel collaborations, and assuring the legality of informal governance actions. These studies tended to regard the social domain as where adaptive governance coheres forces from, rather than emphasize it as the objective of adaptive governance. The original intention of adaptive governance was to address both the social and ecological dimensions in SES equally since each had been neglected [12].
Given the role of adaptive governance on users’ utilization of ES, it was also applied in ecosystem service governance. Cook et al. [18] proposed an improved payment scheme for ES delivery to avoid potential ecological risks and meet the social interests. A recent case study given by Dunning [19] described how the conservatives of Texas seized the “window of opportunity” [14] and applied collaborative adaptive governance to transform the governance of the recreational ES in response to Hurricane Harvey in 2017. They focused on the social domain as the objective of adaptive governance. However, the outcome of adaptive governance was evaluated by perceptions, not field data or official statistics. Previous studies on adaptive governance rarely provided sufficient evaluation of its outcomes. As argued by Elbakidze et al. [1] in their case study on the “Model Forests” in Russia and Sweden, the modes of multi-stakeholder collaboration can be profoundly influenced by economic and cultural differences. They suggested a need for evaluating the outcomes of adaptive governance in specific cases.
Although the theory of adaptive governance was introduced to China relatively late, cases resembling adaptive governance are waiting to be rediscovered. This paper describes a governance transformation towards adaptive governance in northwestern China, a region crossing provincial boundaries covered by scattered basins and vast mountains, plateaus, and deserts, with arid and semi-arid climates. With the limited water and land resources and ecological vulnerability, northwestern China used to be a highly underdeveloped area. Simultaneously, abundant mineral and energy resources are distributed along the upper and middle reaches of the Yellow River and in the Xinjiang Uygur Autonomous Region. Since the Great Western Development Strategy (GWDS) was proposed in 2000, resource-based industries mushroomed as a critical growth engine in northwestern China. They promoted the transition to medium-term industrialization in northwestern China [20]. However, over-reliance on resource-based industries then occurred due to the urgent need for poverty alleviation. Resource exhaustion and environmental contamination loom ahead, further reducing the development potentials [20]. More considerable ecological risks were also evoked, especially in the Loess Plateau under prominent ecological vulnerabilities [21]. Resource dependence has become another urgent stress factor on the sustainability of northwestern China, besides ecological vulnerability and economic backwardness.
To avoid “walking a tightrope” between economic growth and ecological security, northwestern China has strenuously striven to transform conventional ecosystem management. Collaborative and participatory governance were established, together with reforms involving both social and ecological dimensions. Consequently, as Wu et al. [22] suggested, the Loess Plateau has moved to a phase of “revegetation for environment”, where the interactions of the components in SES are profoundly affected by political and socioeconomic drivers, resulting in enhancements of the positive correlations while the negative ones decline. However, they did not systematically summarize the governance transformation in this region. The results of the China ecosystem assessment (CEA) of 2000 to 2010 also reveal a significant improvement of ESs in most of northwestern China [23]. Nonetheless, it is unclear how the adaptive governance practice has impacted the inherent connections between the subsystems of the coupled SES in northwestern China.
From the above consideration, this paper intends to conduct an empirical study on the case of northwestern China and aims to estimate the impact of its adaptive governance practice on SES coupling through the lens of ES delivery. This study may provide a case reference for notifying future efforts to enhance the adaptive capacity of the governance system in northwestern China and similar ecologically fragile regions in the world.

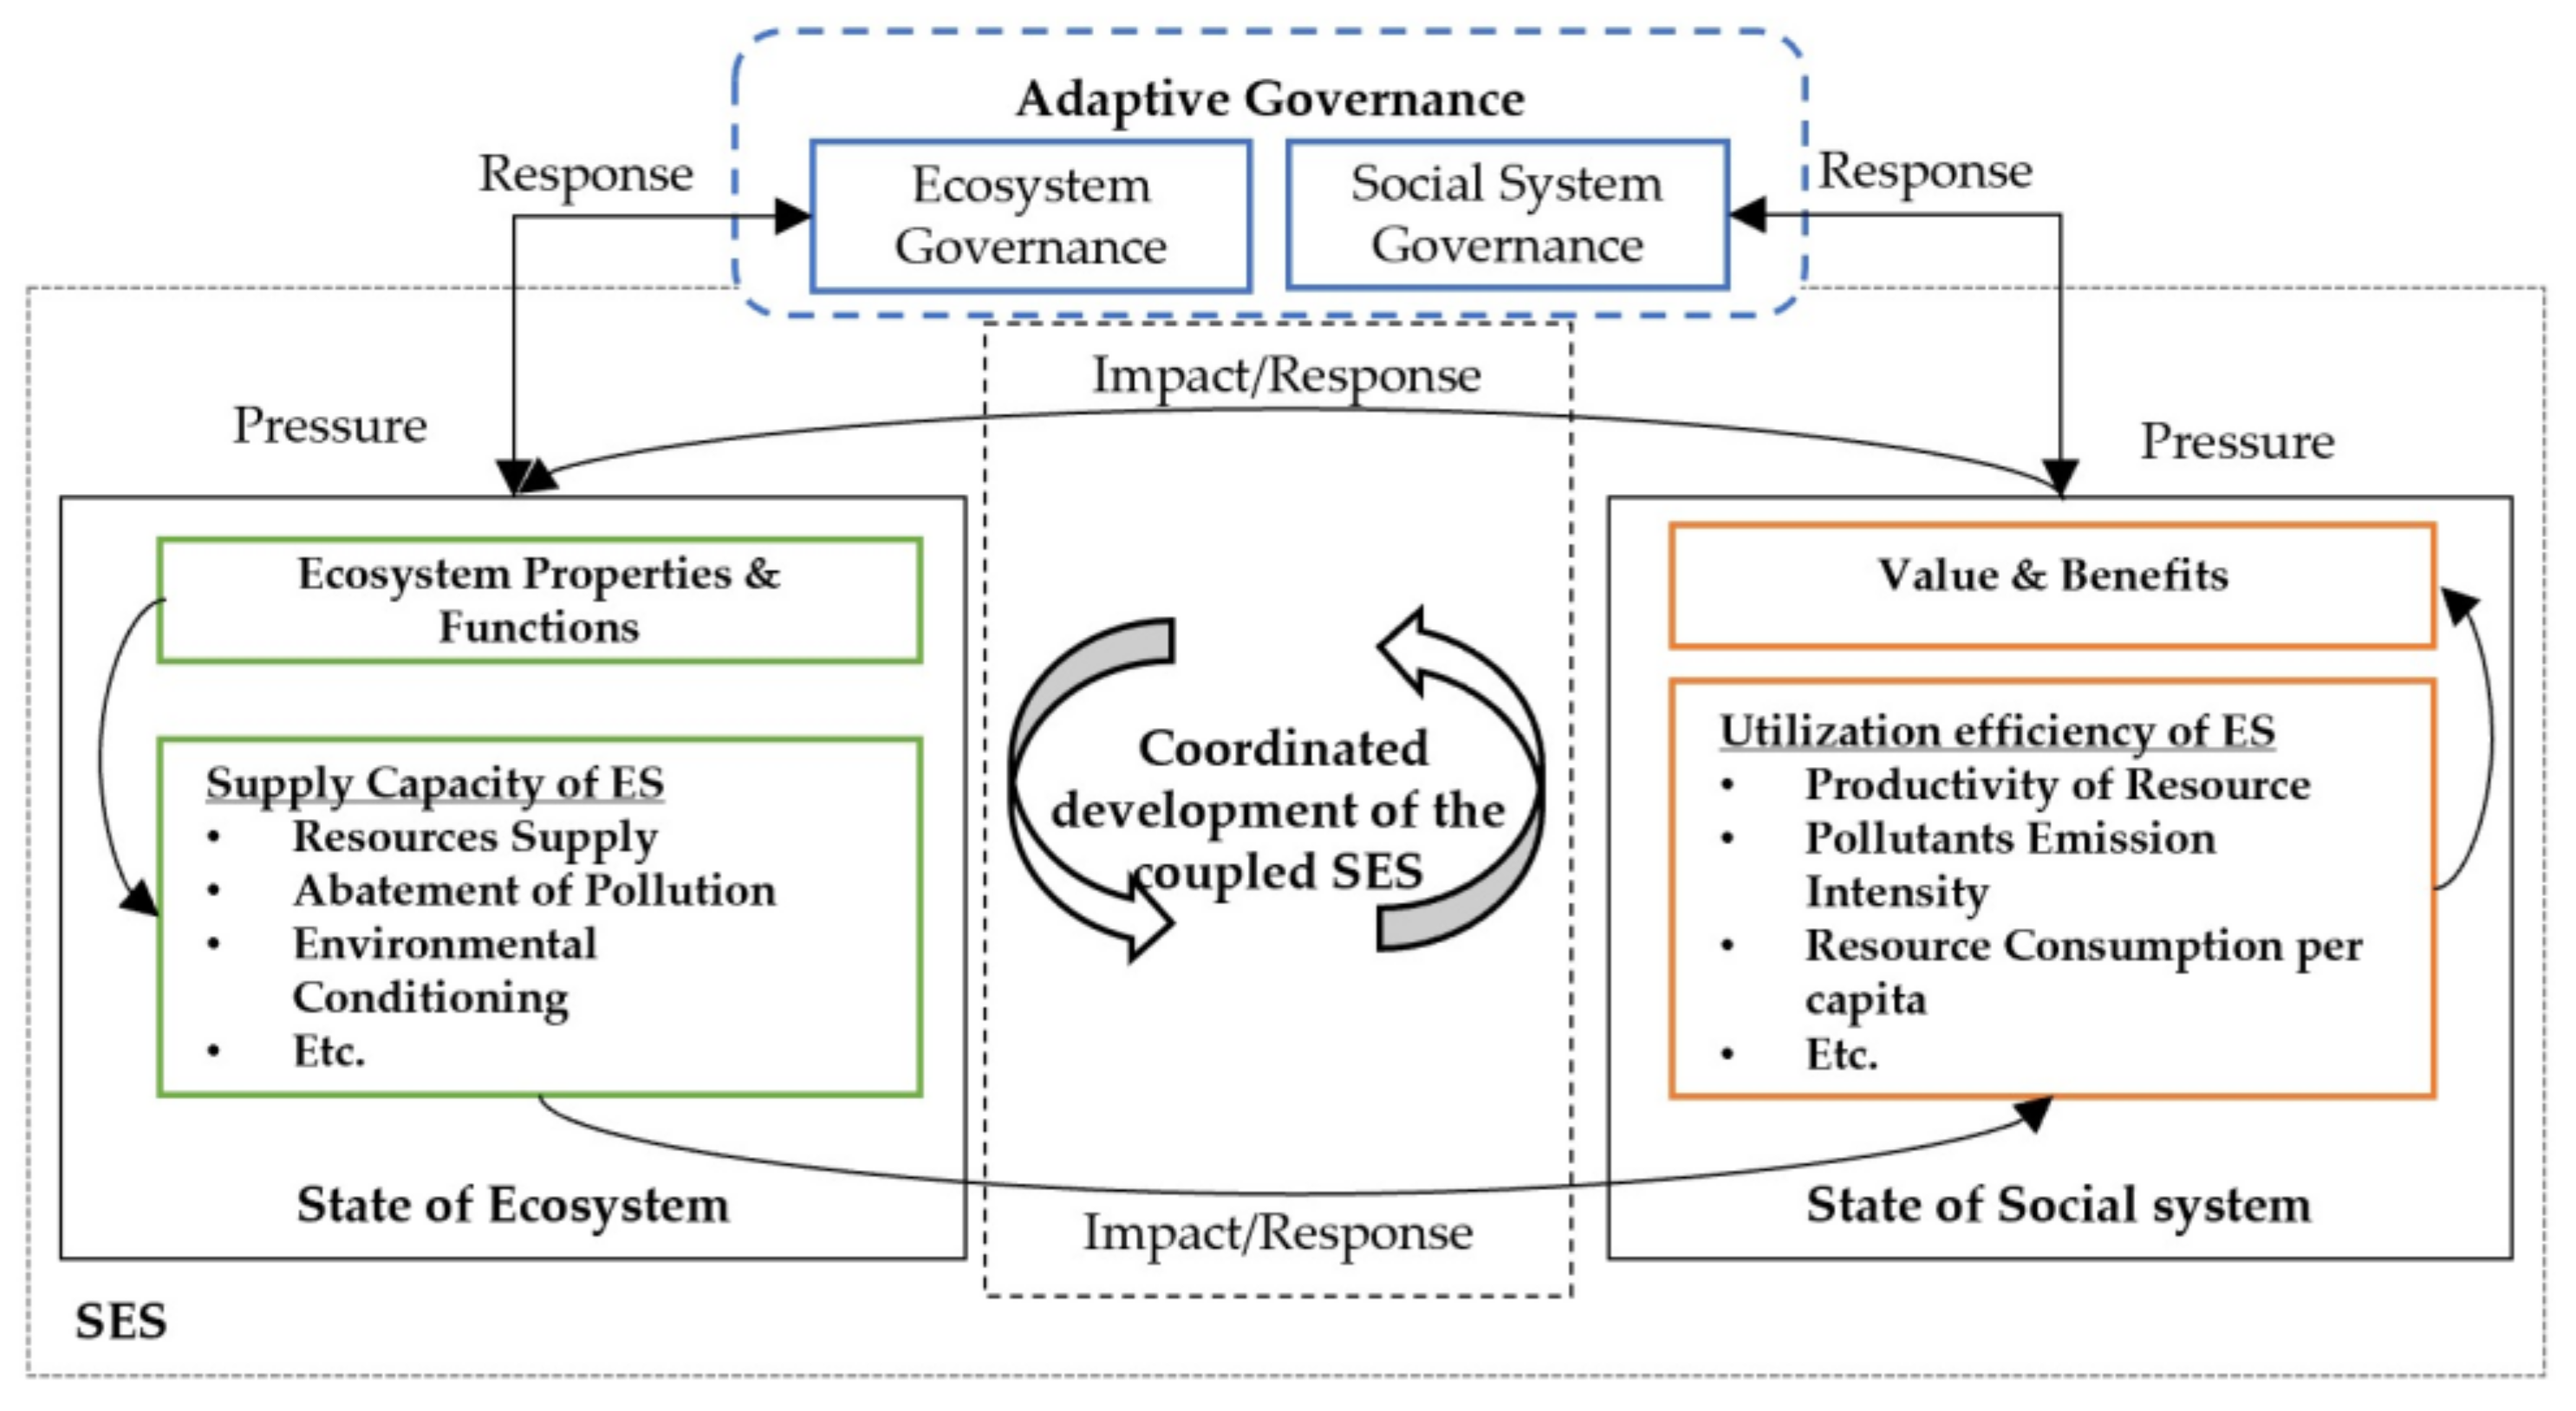
2. Research Framework

Nassl et al. [10] proposed a theoretical framework via the integration of ES cascade (ESC) and DPSIR models to picture the interactions between social and ecological subsystems and explain how the governance system shapes and adapts to the subsystems. By borrowing the synthesized framework of Nassl et al. [10] with some improvements, this paper developed a closed cycle conceptualized model of ES provision and societal feedback under adaptive governance.
In this model, the “ES potentials” [24] are concretized as the supply capacity of ES (green line module in Figure 1). Although Nassl et al. [10] detected the essentiality of “human involvement”, their work was short in assigning human actions to different ES delivery processes. A module of utilization efficiency of ESs (yellow line module in Figure 1) is added into the state of the social system to characterize the self-organization of the resource users, i.e., the potentials of the social system corresponding to the potentials of the ecosystem. As Ostrom stated in her seminal work, self-organization refers to the users’ inputs of time and energy to escape “a tragedy of the commons”. The higher the utilization efficiency of ES, the less the risks of resource exhaustion. Adaptive governance is added as an endogenous or exogenous social driver for the other components of “human involvement” [10], as shown in the blue line module of Figure 1.

2.1. The Coupling Relationship in SES

In this framework, the interactions between social and ecological systems, identified as coordination development of the coupled SES, are outlined as a causal circle underlying the ES provision (as shown in the module of SES in Figure 1). ESs are generated from an ecosystem with specific attributes and subsequently transformed to certain functions by human constructs, which are decided by the knowledge level of humans in the social system. Thus, the capacity of ES provision is determined, representing the state of the ecosystem. The two subsystems codetermine how much ES can be captured by the social system because of their underlying links. Only through human capital investment can the original resources and environment be transformed into benefits, market values, and perceived values. Eventually, the value perception is mapped on the constructs on the properties of the ecosystem, indicting a new beginning of the circle. With the insight of the inherent links between the two subsystems, we argue that the coordination of SES coupling is a measurement of the desired configuration of SES, which is reflected by the matching degree of the supply capacity and utilization efficiency of ESs.
The coupling state of SES is quantified by a widely used coordination degree model [25,26]. Specifically, the term “coupling” is from physics, implying how intensely the two subsystems are linked and interact with each other. As a term from synergetics initiated by Hermann Haken in 1971, “coordination” refers to how harmonious and concordant the interactions are between the coupling systems or among the components within a system during the systematic development, reflecting the dynamic tendency from unordered to ordered. The equations are shown as below:
C = ( S × E ) ( S + E ) 2
T = α S + β E
CCD = C × T  
where S and E, respectively, present the indices of the social system and the ecosystem states, which will be calculated based on an index system in Section 4. C presents the coupling degree of the two subsystems, and it is between 0 to 1. T is the comprehensive coordination index of SES. α and β are undetermined coefficients and present the weight of different systems in the overall population, so the total of α plus β equals 1.
Since the social and ecological systems are equally important, α = β = 0.5 in this study. CCD is the coupling coordination degree of SES. The closer CCD gets to 1, the higher the degree of harmony and mutual support between the two subsystems; otherwise, they would be difficult to adapt to each other. The CCD values are divided into six levels by referencing the previous studies [23,24]. The coupling state is defined as maladjustment when CCD is below 0.4, while the top 40% is defined as coordination by contrast. The middle 20% is identified as the transition state between maladjustment and coordination. Moreover, the values of CCD calculated in Section 4.2 are distributed mainly in the middle 40%; this interval is divided into four subintervals for further detailed research (Table 1).

2.2. The Drivers: Adaptive Governance

As an approach of the governance system developed in response to the undesired configuration, adaptive governance requires organization restructuring and institutional reforms to be compatible with participatory and collaborative governance. Stakeholders in diverse social roles and social networks are reorganized in the face of the risks of the unsustainability of ES delivery to monitor, evaluate, prepare, and react to changes.
In this framework, adaptive governance is classified as ecosystem governance and social system governance based on its target subsystem. Ecosystem governance is defined as a governance policy that seeks to sustain the ecosystem’s ES supply capacity, from which ecosystem properties are conserved. Social system governance refers to governance strategies that strive to advance the social system’s ES utilization efficiency, from which social values are improved and users’ self-organization is reinforced. They trigger the impact and response from each of them to the other alternately or simultaneously. Therefore, the states of the subsystems are changed, causing shifts in the coupling state and a bidirectional response to the governance system. The decision-makers thereby adjust the targets and strategies for meeting the needs of the new SES better. Then, a new cycle starts.
In summary, SES coupling is promoted by adaptive governance through ecosystem governance and social system governance. The higher the level of adaptive governance, the higher the coordination degree in SES coupling. The level of adaptive governance will be evaluated in Section 4 based on the practice of adaptive governance in northwestern China summarized in Section 3.

3. Case Study of Northwestern China

3.1. Study Area

Northwestern China is located north of the Kunlun-Altun Tagh-Qilian Mountains and the Great Wall and west of the Great Khingan. Given the political jurisdiction of northwestern China, provincial administrative institutions for ecosystem management were established focusing on the local natural resources, including the mineral and energy resources, and the fragile ecological environment. Meanwhile, the Yellow River Conservancy Commission was built up for watershed-scale ecosystem management of the upper and middle reaches of the Yellow River from a bioregional perspective [16]. Therefore, northwestern China is defined as the region covering the Xinjiang Uygur Autonomous Region, Qinghai Province, Gansu Province, the Ningxia Hui Autonomous Region, the Inner Mongolia Autonomous Region, and Shaanxi Province in this paper based on the geographic regionalization and administrative division, as shown in Figure 2.

3.2. Responses to Ecological Risks

The flood crisis along the Yangtze River, mainly caused by environmental degradation in 1998, has sparked a national rethink of economic growth’s ecological cost. Since then, the government has reinforced the ecosystem management via top-down instructions in the centralized governance system, especially since the GWDS was proposed. Due to its strategic location and ecological vulnerability, northwestern China has become a target region of several major ecological conservation programs funded by the government (as shown in Table 2). Eventually, a “Great Green Wall” was built up in northwestern China. The cyclic iterative monitoring and feedback mechanism was followed to sustain its functions of defending natural disasters [27]. Northwestern China thereby was endowed with ecological functions that are crucial to the entire mainland. The aggregation of these projects was proved to be of substantial contribution to CO2 mitigation [28]. In addition, ESs were significantly improved in most of northwestern China according to the CEA of 2000 to 2010 [23].
Although command and control approaches are highly efficient in implementing major ecological restoration projects [16], CEA also revealed a decreasing trend of ESs in some scattered regions of northwestern China [23]. Scholars claim that the conflict of water demand between ecosystem and humans was aggravated by local revegetation of GGP, and TNSP is criticized for misconduct in biodiversity conservation and landscape pattern, especially in the Loess Plateau [29]. As claimed in these studies, these ecological projects were insufficient in facing the uncertainties and complexities of large-scale ecosystems and contextual cases. Apart from humans’ tampering with nature since GWDS, other increasingly potent factors, e.g., climate changes, food security, and hazy weather, make it more and more overwhelming for the government. On the flip side, users of the resources have developed initiative adaptions to ecological vulnerabilities by self-organization [8], which used to be neglected by the government. The inhabitants’ experience of dryland farming and herding, especially in Loess Plateau and Ningxia-Inner Mongolia grassland [20], inspired the authorities to be more inclusive of grassroots voices. The local resource-based enterprises enslaved to resource shortage have also made attempts to transform and upgrade to gain market advantages, and there are many successful examples to be explored. Consequently, a window for turning problems into opportunities has been opened [14,19].

3.3. Transition to Adaptive Governance

In response to the perceived threats by the government, changes in policy and organization for ecosystem management towards adaptive governance took place [13]. Roles played by the government are no longer limited to the leader and steward but also the knowledge carrier, broker, and connector [12,13,30]. Multifaceted institutions and individuals with various social roles are increasingly included, connected, and nested [6,12]. As shown in Table 3, the key actors involved in implementing adaptive governance are distinguished into three categories according to the levels of collaboration [1]. The structures and processes show the key actions of the actors in shaping the interactions between the subsystems [12], which jointly facilitate the emergence of a social condition for adaptive governance. Those conditions include powerful leadership, broad consensus, proper legal environment, intelligent policy design, abundant sources of funding, and smooth information transmitting [12,13].

3.3.1. The Leadership of the Government

Leadership is controlled by the ruling government. The primary reason is that the backward economy of northwestern China is incapable of contributing to the ecosystem. In contrast, the government maintains control over other stakeholders in talents, finance, technology, and interpersonal networks. With visions and legislative authority [13], the government tends to make institutions more flexible. The basic components of China’s political system, including the community-level self-governance policy and regional ethnic autonomy policy, provide legality to self-governance in ecosystem management to activate social memories in social networks [15]. Moreover, institutional innovations have been generated. Take the strictest ecological conservation policy, known as the “ecological redlines”, for example. Based on the plan for main functional zones announced in 2011, the vast ecologically fragile areas and those with crucial ecological functions in northwestern China have been designated restricted development zones. Meanwhile, the other developable areas provide safe operating zones for residents to escape poverty under consequent policies for intensive land use and industrial layout optimization [31]. In energy-chemical industry bases along the upper and middle reaches of the Yellow River, the positive industrial agglomeration effects of emission reduction and resource comprehensive utilization are emerging [32]. However, top-down instructions are no longer the only choices.

3.3.2. Collaborative and Participatory Governance

Conditions for adaptive co-management are being created [13,15,33]. On the one hand, enterprises were involved via market-oriented governance besides the mandatory requirements of the “ecological redlines”. In 2015, a supply-side structural reform was proposed by the government. The highly concentrated resource-based industries in northwestern China were required to phase out outdated production capacity and address the external diseconomy. Cleaner production and circular economy were stimulated by fiscal and financial reforms. Meanwhile, scholars are called on to pitch into the ecological diversion of technological innovation, and the resultant products are transacted in the technology market facilitated by government subsidies. Eco-friendly technical innovations generated from the cooperation of industry-university-research are increasingly applied in enterprises. On the other hand, much wider participation was formed. The concept of “lucid waters and lush mountains are invaluable assets”, originated in 2005 by the government, which suggests that the urgent need for poverty eradication can be met by ecological protection, quickly swept the vast areas untouched by development and filled with minority culture. Ecological projects and ecotourism flourished in the vast restricted development zones and sequentially provided inhabitants with new jobs and incomes in related industries. Inhabitants were motivated to supplement the government’s cyclic iterative mechanism [9], especially in dealing with environmental illegalities and risks. Their feedback is directly given and responded to on official websites and well-known social media. In the Returning Grazing Land to Grassland Project, herders are motivated to graze based on the grazing capacity in available grassland by a performance assessment in government subsidies distribution. Because of the increasingly open policies, more international ENGOs were introduced to this region. More local ENGOs were formed simultaneously, becoming supplementary forces on solving practical issues of the ecosystem.
Overall, transformations to adaptive governance were brought into being. In the face of the complexities and uncertainties, although the government remains dominant in ecosystem management, participatory governance and market-oriented governance are flourishing and indispensable [1,16]. The application of adaptive governance is becoming a direction for future reforms [21,22]. Based on the practice of adaptive governance in northwestern China, this paper evaluates the levels of adaptive governance in the six provinces of northwestern China.

4. Materials and Methods

4.1. Measuring Adaptive Governance

By teasing out the main structures and processes of the key actors based on the proposed framework in Section 2, an index system for evaluating adaptive governance is constructed with two subsystems, namely, ecosystem governance and social system governance (Table 4).
Ecosystem governance reflects the joint efforts in sustaining the ES supply capacity of the ecosystem by the actors of northwestern China, which mainly covers pollution control, resource-saving, ecological restoration, and development restriction. Ten indicators are selected by referring to the studies of Wang et al. [34] and the available statistical materials. On the other hand, the improvement in ES utilization efficiency is characterized by social system governance, which should be measured from layout optimization, structural upgrading, technical innovation, and educational development in accordance with the practices of northwestern China. Seven indicators are chosen by referencing studies of Li et al. (2018) and Guo et al. (2016) [35,36]. Some of the indicators’ calculations needed to be illustrated as follows:
(1) Economic Agglomeration. It is calculated by dividing the output value of the non-agricultural sector by the area of urban construction land by referring to the production density equation. This indicator should be positive because of its significant reduction effect on emissions on the city-scale, as proved in the previous studies [32].
(2) Industrial structure rationalization (ISR). Based on Theil Index, the equation is
ISR = i = 1 3 Y i Y ln ( Y i / Y L i / L )
where Y i   and L i are the output value and the number of employees in the i industry, respectively; Y and L are the gross output value and the total number of employees in all industries. The indicator is used to measure the adaptability of the industrial structure to the resource supply structure. The smaller ISR is, the more adaptability there is. So, it is negative.
(3) Industrial structure upgrading (ISU). The equation is
ISU = i = 1 3 v i × LP i
where v i indicates the proportion of output value to GDP in the i industry; and LP i is the productivity in the I industry, i.e., the average return per employee in the i industry. The negative externalities may decrease if the industry is upgraded, implying that the indicator should be positive.
Positive and negative range standardization are adopted, respectively, to normalize the positive and negative indicators in the index system. The entropy TOPSIS method is applied to calculate adaptive governance scores (AG) from 2003 to 2017 to ensure that the information of original variables with different measurement units can be reflected independently. Its primary data source includes the provincial statistical yearbook, China Statistical Yearbook, and China Environmental Statistical Yearbook. Social System Governance index (Sg) and Ecosystem Governance index (Eg) are also calculated for further research.

4.2. Measuring the Coordination Degree of SES Coupling

Following the proposed framework in Section 2, an index system from the ES supply-demand (ESSD) perspective can be developed to evaluate the coordination degree between the subsystems of SES (Table 5). ESSD is composed of corresponding mutual indicators between the supply and demand sides of ES to picture the ecosystem’s carrying capacity against pressure from the social system and human effort to balance the development benefits and ecological risks.
On the supply side, the provision, regulation, and support services are chosen as dimensions for indicator selection because of data availability based on the classification schemes of ES presented severally by Costanza [37], De Groot [38], and the Millennium Ecosystem Assessment (MA) [5]. In addition, only the disposable and directly consumable ESs are considered as the ES acquisition capability of the social system is rigidly restricted by them. Consequently, fourteen proxy indicators are selected by referring to Wang et al. [34] and Li et al. [35]. Six indicators reflecting the supply capacity of water, materials, and fuelwood are classed to provision service. Indicators measuring the abundance of forest, wetland, grassland, and other ecological components essential in sewage purification and exhaust gas absorption are attributed to regulating service. Besides the production capacity of the land, support service is also measured by two negative indicators to highlight the negative influence of the frequent natural disasters and desertification in northwestern China. Apart from these two, other indicators are positive. All of them are calculated based on data from 2003 to 2017 in China Environmental Statistical Yearbook, China Energy Statistical Yearbook, and China Regional Statistical Yearbook.
On the demand side, other fourteen indicators are selected from dimensions of resource consumption, emission intensity, and land development, corresponding to the three dimensions on the supply side, respectively. Resource consumption refers to the expenditure intensity of resources, mainly water and energy, provided by the ecosystem in production and daily life. Emission intensity involves the liquid, gas, solid waste, and soil pollution purified and absorbed by the ecosystem. Land development intensity and the ratio of cultivated area are included in the dimension of land development, which measures the support services occupied by humans in pursuing development benefits. All indicators are negative, indicating that the lower the resource consumption, emission, and land-development intensity, the higher the ES utilization efficiency. The primary data source is the provincial statistical yearbook and China Statistical Yearbook, with complements from China Third Industry Statistical Yearbook and China Agriculture and Forestry Statistical Yearbook.
All indicators are standardized by applying the range standardization method. Entropy TOPSIS is also used to index the states of the social system and the ecosystem to gain S and E. The coordination degree of the coupling SES, namely, CCD, is computed following the equations shown in Section 2.

4.3. Modeling the Impact of Adaptive Governance on SES Coupling

In the context of northwestern China, over-reliance on resource-based industries has negatively affected SES coupling, which can be suppressed by adaptive governance. In summary, adaptive governance may play a role in both the directly driving and indirectly moderating effects, and econometric models estimate both.
A linear panel regression model for analyzing the overall effect of adaptive governance on SES coupling is built as:
CCD it = α i + β i X it + γ i Pop it + δ i Urb it + u i + v i + ε it
where i is the region and t is the year. CCD is the coupling coordination degree of SES, reflecting the closeness of interdependence and harmony of interaction between the subsystems of SES. X presents the different pathways of adaptive governance, namely, ecosystem governance (Eg), social system governance (Sg), and the overall adaptive governance (AG). They are the key independent variables severally added in the model to make a thorough inquiry into the boundaries of their role in promoting SES coupling. β, γ, and δ are the estimated regression coefficients of relative variables. u i and v i are included in the equation to capture the fixed effect of individual and time in the i province. ε is the random error. Pop and Urb are added as control variables against biased estimation due to the agglomeration of population and industries in urban areas of northwestern China [20]. Supposedly, the higher the population aggregation, the higher the intensity of resource consumption and pollution emission. However, the agglomeration of population and industries is also conducive to social system development. As a result, the ecosystem may decline first and then be improved under the influence of urbanization [32]. The two control variables are measured by the population density and urbanization rate of the permanent residents.
For testing the moderating effect of adaptive governance on the relationship between resource dependence and SES coupling, another independent variable, resource dependence (Rd), is introduced to the model. According to the abundant resource types in northwestern China and the development features of relevant industries [20], the proportion of investment in the energy industry (EII) and the proportion of human resource in mining (MHR) are both chosen as proxy variables of Resource Dependence (Rd) from perspectives of physical capital investment and human capital investment [39]. EII is measured by the proportion of the energy industry’s fixed-asset investment in the total. In comparison, MHR is measured by the proportion of the mining industry’s employees in the total employees in urban areas. The regression model is given as:
CCD it = α i + β i Rd it + λ i X it + η i X it Rd it + γ i Pop it + δ i Urb it + u i + v i + ε it
where Rd presents the two forms of resource dependence, EII and MHR; and X presents Eg or Sg. Others are the same as the ones in Model (1). Given the discrepancy in the statistics, the caliber of energy industries is unified as the mining and washing of coal industry, crude petroleum, and natural gas industry, and production and supply industry of power, fuel gas, and water. According to this caliber, EII and MHR are calculated based on China Fixed Assets Investment Statistical Yearbook and China Regional Statistical Yearbook.
All the variables pass the panel unit root test in these long panel (n = 6, t = 15) models, indicating their stabilities. The existences of inter-group heteroscedasticity, intra-group autocorrelation, and inter-group correlation are proved by other tests in succession. Therefore, a feasible generalized least squares (FGLS) method is adopted to estimate adaptive governance’s driving and moderating effects. Both individual effect and time effect are included in these estimations.

5. Results

5.1. The Spatio-Temporal Pattern of Coupling Coordination Degree of SES

Figure 3 shows the spatio-temporal pattern of CCD in the six provinces of northwestern China during 2003–2007. From a general view, the coupling states of all the six provinces have remained steady with slight fluctuations under increasingly high resource consumption and land development intensity since the GWDS. Shaanxi, Inner Mongolia, Qinghai, Xinjiang, and Gansu are in the transitional period to the coordinated stage except for Ningxia, which keeps at a mildly maladjusted level. It suggests a positive impact of adaptive governance on SES coupling, although more is needed to realize overall coordination in this region.
This significant spatial stratification results from the long-term evolution of SES in different provinces. First, the ES utilization efficiency of the social system of Ningxia has remained the lowest in the six provinces, leading to mild but long-term maladjustment. Second, even though the ES supply capability has been insufficient, Gansu province has still been counted in the second layer as being close to maladjusted since its utilization efficiency has been slightly better than Ningxia’s and it has tended to float upwards. Third, the ES supply capabilities of Qinghai and Xinjiang have been relatively stable in the last 15 years, while their ES utilization efficiencies have dropped sharply, reducing them to mildly maladjusted. Fourth, the supply capability and utilization efficiency of ES in Shaanxi and Inner Mongolia were maintained at a high level; thereinto, Inner Mongolia showed a significant upward trend in its ES utilization efficiency, which resulted in an improvement in the coupling coordination degree of SES.
In summary, the ecosystem’s ES supply capability in the six provinces did not vary significantly during 2003–2017, indicating that the main reason for the overall spatio-temporal pattern is the fluctuation of the social system’s ES utilization efficiency. A reasonable inference can be drawn that the measures directed at the social system may more significantly promote SES coupling.

5.2. The Direct Impact of Adaptive Governance on SES Coupling

Table 6 shows the direct effect of adaptive governance on the coordinated development of SES. In Model (1-1), Adaptive Governance (AG) has a significant positive effect on coupling coordination degree (CCD) ( β   = 0.093, p < 0.01). It indicates that the coordination degree of SES coupling in the six northwestern provinces is prominently improved by adaptive governance within 15 years. The results from Model (1-2) and Model (1-3) show that the effect of a single governance method is weak, which only passes the test at the significance level of 0.1. The above outcomes reveal that the joint force of ecosystem governance and social system governance can much more powerfully improve SES coupling.

5.3. The Moderating Effect of Adaptive Governance on SES Coupling

Using different proxy variables, two resource dependency models, i.e., Physical Capital Input Model and Human Capital Input Model, are created to evaluate the moderating effect of adaptive governance (details in Table 7).
In the Physical Capital Input Model (Model 2), the results show that the increase in the proportion of energy industry investment negatively affects the coordination of SES coupling (β = −0.099, p < 0.01). The coefficient of the interaction item in Model (2-2) shows that ecosystem governance does not have an inhibitory effect on the negative impact of EII (β = −0.139, p > 0.1). In contrast, social system governance is revealed to have a significant moderating effect (β = 0.687, p < 0.01) in Model (2-3), which has made the negative effect of EII insignificant anymore (β = −0.001, p > 0.1). The results suggest that social system governance is able to efficiently restrain the negative impact on SES coupling of resource dependence characterized by investment in energy industries. Hence, social system governance should be the primary measure to promote SES coupling in the social system with high resource dependence. Model (2-4) indicates that the moderating effect of social system governance is robust.
Similar results are confirmed in the Human Capital Input Model (Model 3). First, SES coupling is further negatively impacted by resource dependence proxied by MHR (β = −0.366, p < 0.01) in comparison with EII (β = −0.099, p < 0.01). On the other hand, social system governance has a significant moderating effect (β = 3.823, p < 0.01) and ecosystem governance does not (β = −1.792, p < 0.1), as shown by the coefficients of the interaction items in Model (3-2) and Model (3-3). In summary, social system governance could inhibit the passive influence of MHR on SES coupling, which demonstrates the importance of social system governance in northwestern China.
A diagram about the interaction effect is drawn to intuitively reflect the regulating effect of social system governance (Figure 4). The moderator, namely, social system governance, is classified as high or low by the standard of the value calculated from its mean plus or minus twice the standard deviation. Both Figure 4a,b illustrate that the higher the level of social system governance in resource-dependent provinces, the more significantly the improvement of SES coupling. Moreover, social system governance can be more effective in cases of higher resource dependence, which is measured by energy industry investment or mining capital investment.

5.4. Main Findings

The spatial-temporal pattern shows a scantly increase in the coordination degree of the coupled SES under the perturbations of the mushrooming resource-based industries since the GWDS. Subsequently, the overall effect and moderate effect of adaptive governance on the coordination degree of the coupled SES are estimated through an FGLS method. Two main findings are detected, including:
(1) The synergy of ecosystem governance and social system governance can positively promote SES coupling. At the same time, the effectiveness hypotheses on implementing them in isolation is rejected, indicating the superiorities of adaptive governance and non-decomposability between the ecosystem and the social system in adaptive governance.
(2) Although resource dependence is unfavorable for sustainability, this adverse impact can be notably alleviated by social system governance. However, ecosystem governance cannot mitigate it, implying the importance of social reforms for sustainability in resemble regions.

6. Discussion

6.1. Theoretical Implications

Human beings must continuously adapt to unpredictable changes for self-development in the game for nature but simultaneously avoid exceeding the safe operating spaces [31]. However, conventional ecosystem management intends to tighten the grip on resources and reduce uncertainties following the logic of domesticating the ecosystem rather than adapting to it [12]. Although environmental regulations restrain the users’ capture of resources and emission of pollution, the objective of ecosystem management is still the supply capacity of ES in the ecosystem.
This paper provides a perspective of ES utilization efficiency of the users for a better understanding of the non-decomposability of the ecological and social systems in approaches towards sustainability [19]. As suggested by Folke et al. [12], addressing the social or the ecological dimension of ecosystem management in isolation would be insufficient for decision-making towards sustainability. In this paper, we re-emphasize this non-decomposability by taking the ecosystem and the social system as the targets of adaptive governance as equally as each other. Moreover, the state of the social system is reflected by the utilization efficiency of the social system. The results of the econometric models further show the necessity of incorporating social system governance into adaptive governance.
The utilization efficiency of ES is further interpreted as the outcome of self-organization in this paper. The importance of self-organization was brought up by Ostrom [8] in her pioneering study. Based on this ideology, scholars only suggested that adaptive governance should be structured as nested and polycentric to reinforce SES’s resilience [12]. However, the role of self-governance has not yet been interpreted or evaluated from the outcome perspective. In the context of ES delivery, users’ self-organization is recognized as the initial action to enhance the utilization efficiency of ES in our paper. Simultaneously, social system governance is identified as the approach to promote self-organization in ES utilization. In this way, the referred “human involvement” in Nassl et al. [10] is reified. Therefore, their framework is improved to better outline the causality from the drivers to ES delivery in a coupled SES.

6.2. Policy Implications

In the practice of northwestern China, when the government perceived the underlying shortcomings of the large-scale ecological conservation programs [20,22], the government seized the opportunity to infiltrate ecological interests into the social reforms as parallel targets [14], generating a series of social innovations with ecosystem management principles. Consequently, the relationship between the ecological and social systems in ES delivery improved, resulting in a better coordination state of the coupled SES.
This paper provides an experience reference of implanting ecosystem management principles into social innovation for catalyzing the transition to adaptive governance. The capacity to adopt social innovation was recognized as a crucial component in the ecological resilience for a linked SES, as suggested by Moore. et al. [40]. It was also confirmed by Dunning [19] in his case study on the conservatives’ governance transformation after Hurricane Harvey. In this case, a “triple win” solution was proposed as such a social innovation by adapting collaborative adaptive governance to enhance the resilience of recreational ES in the face of hazards. Another common factor between the case of northwestern China and Dunning’s is that it was the authorities that grasped the “window of opportunity” to conduct social innovation in the first place in the face of emergency and intractability. The underlying reason may be the possible difficulties of collaborative decision-making due to the lack of time for different parties to build trust in the face of sudden changes; by contrast, the government has sufficient resources and vision to guide the initial actions [16].
Our work also points out a wiser and more economical direction for regions with high resource dependence to pursue sustainability. Northwestern China is a bioregional scale sharing the commons of rich mineral resources, fragile ecological environment, and economic backwardness, and, simultaneously, is subject to analogous socioeconomic policies [16]. In the wake of GWDS, mushrooming resource-based industries have slowed down its development economically and ecologically [20,21,39], thereby hampering sustainability [41]. This is shown in our work through the significant negative impact of resource dependence on SES coupling. However, we further reveal social system governance as a solution for such negative impacts, especially in regions with high resource dependence. Possible directions include industrial structural upgrading and layout optimization, ecological innovations, and education development.

7. Conclusions

Adaptive governance is increasingly accepted as a better approach to addressing the coupled SES’s complexities and uncertainties than the top-down and bottom-up approaches in ecosystem management. However, as the practice of adaptive governance can be profoundly influenced by multiple factors, evaluating its outcomes was called for by scholars. Based on the experience of transition to adaptive governance in northwestern China, this paper provided an empirical study to detect the role of adaptive governance on SES coupling. By improving Nassl et al. [10] ’s framework, we theoretically clarified the cause–effect relationship between adaptive governance and ES delivery in an SES. Adaptive governance levels and the coordination degrees of SES coupling in the six provinces of northwestern China were evaluated, respectively. Finally, the relationship between adaptive governance and the coordination degree of SES coupling was estimated by econometric models. The results confirmed the positive role of adaptive governance on promoting SES coupling and indicated the insufficiency of ecosystem management targeting the ecosystem or the social system in isolation. The results also verified the indispensable role in offseting the adverse impact of resource dependence on sustainable outcomes of social system governance. Therefore, a wiser direction for regions with high resource dependence for development transformation is indicated, other than phasing out of all the resource-based industries for ecological benefits. This study again evidenced the importance of non-decomposability in pursuing sustainability [15,19] and the key leader in seizing the “window of opportunity” [14,19]. The necessity of the key leader’s social innovation is also testified to [40], providing an experience reference to situations resembling northwestern China to conduct target reforms in adaptive governance.
Several limitations should be addressed in future studies. Firstly, various factors in social, economic, cultural, and historical aspects can impact the structures and processes of adaptive governance [1], and this case study is only “place-based” research on northwestern China [19]. As such, there may be limited referable experience. Secondly, the cases in this paper and Dunning’s study both revealed the essential role of authority on governance transition to adaptive governance in the face of emergencies. However, this paper did not detect underlying reasons sufficiently. Future research is needed to clarify the suitable cases and functional boundaries of different actors in adaptive governance. Thirdly, ecologically vulnerable regions can serve as sites for natural experiments of ecosystem-based adaptive governance. More studies are needed to provide more feasible and detailed plans to implement adaptive governance. Lastly, due to data availability limitations, the indicators in the evaluation systems in this paper are to be enriched.

Author Contributions

Conceptualization, Y.W. and Z.Z.; methodology, Y.W.; software, Y.W.; validation, Y.W., C.W., and Z.Z.; formal analysis, Y.W.; investigation, Y.G.; resources, C.W.; data curation, Y.W.; writing—original draft preparation, Y.W.; writing—review and editing, Z.Z.; visualization, Y.W.; supervision, Z.Z.; project administration, C.W.; funding acquisition, C.W. All authors have read and agreed to the published version of the manuscript.

Funding

This research was funded by the Natural Science Foundation of Ningxia Hui Autonomous Region under Grant 2021AAC03425 and the Department of Natural Resources of Ningxia Hui Autonomous Region under Grant 2019046260.

Data Availability Statement

Not applicable.

Acknowledgments

We express our gratitude to two anonymous reviewers and editors for their professional comments and suggestions.

Conflicts of Interest

The authors declare no conflict of interest.

References

  1. Elbakidze, M.; Angelstam, P.K.; Sandstrom, C.; Axelsson, R. Multi-Stakeholder Collaboration in Russian and Swedish Model Forest Initiatives: Adaptive Governance Toward Sustainable Forest Management? Ecol. Soc. 2010, 15, 14. [Google Scholar] [CrossRef] [Green Version]
  2. Hughes, T.P.; Barnes, M.L.; Bellwood, D.R.; Cinner, J.E.; Cumming, G.S.; Jackson, J.B.C.; Kleypas, J.; van de Leemput, I.A.; Lough, J.M.; Morrison, T.H.; et al. Coral reefs in the Anthropocene. Nature 2017, 546, 82–90. [Google Scholar] [CrossRef] [PubMed]
  3. Oteros-Rozas, E.; Ruiz-Almeida, A.; Aguado, M.; González, J.A.; Rivera-Ferre, M.G. A social–ecological analysis of the global agrifood system. Proc. Natl. Acad. Sci. USA 2019, 116, 26465–26473. [Google Scholar] [CrossRef] [PubMed]
  4. Cumming, G.S.; von Cramon-Taubadel, S. Linking economic growth pathways and environmental sustainability by understanding development as alternate social–ecological regimes. Proc. Natl. Acad. Sci. USA 2018, 115, 9533–9538. [Google Scholar] [CrossRef] [Green Version]
  5. Assessment, M.E. Ecosystems and Human Well-Being: A Framework for Assessment; Island Press: Washington, DC, USA, 2003; p. 245. [Google Scholar]
  6. Chaffin, B.C.; Gosnell, H.; Cosens, B.A. A decade of adaptive governance scholarship: Synthesis and future directions. Ecol. Soc. 2014, 19, 56. [Google Scholar] [CrossRef]
  7. Colding, J.; Barthel, S. Exploring the social-ecological systems discourse 20 years later. Ecol. Soc. 2019, 24, 2. [Google Scholar] [CrossRef] [Green Version]
  8. Ostrom, E. A General Framework for Analyzing Sustainability of Social-Ecological Systems. Science 2009, 325, 419–422. [Google Scholar] [CrossRef] [PubMed]
  9. Walker, B.; Carpenter, S.; Anderies, J.; Abel, N.; Cumming, G.; Janssen, M.; Lebel, L.; Norberg, J.; Peterson, G.D.; Pritchard, R. Resilience management in social-ecological systems: A working hypothesis for a participatory approach. Conserv. Ecol. 2002, 6, 17. [Google Scholar] [CrossRef]
  10. Nassl, M.; Loffler, J. Ecosystem services in coupled social-ecological systems: Closing the cycle of service provision and societal feedback. Ambio 2015, 44, 737–749. [Google Scholar] [CrossRef] [PubMed] [Green Version]
  11. Dietz, T.; Ostrom, E.; Stern, P.C. The struggle to govern the commons. Science 2003, 302, 1907–1912. [Google Scholar] [CrossRef] [Green Version]
  12. Folke, C.; Hahn, T.; Olsson, P.; Norberg, J. Adaptive governance of social-ecological systems. Annu. Rev. Environ. Resour. 2005, 30, 441–473. [Google Scholar] [CrossRef] [Green Version]
  13. Olsson, P.; Folke, C.; Hahn, T. Social-ecological transformation for ecosystem management: The development of adaptive co-management of a wetland landscape in southern Sweden. Ecol. Soc. 2004, 9, 1–26. [Google Scholar] [CrossRef]
  14. Olsson, P.; Gunderson, L.H.; Carpenter, S.R.; Ryan, P.; Lebel, L.; Folke, C.; Holling, C.S. Shooting the rapids: Navigating transitions to adaptive governance of social-ecological systems. Ecol. Soc. 2006, 11. [Google Scholar] [CrossRef] [Green Version]
  15. Olsson, P.; Folke, C.; Galaz, V.; Hahn, T.; Schultz, L. Enhancing the fit through adaptive co-management: Creating and maintaining bridging functions for matching scales in the Kristianstads Vattenrike Biosphere Reserve, Sweden. Ecol. Soc. 2007, 12, 28. [Google Scholar] [CrossRef] [Green Version]
  16. Mostert, H.; PahlWostl, M. Adaptive Water Governance: Assessing the Institutional Prescriptions of Adaptive (Co-) Management from a Governance Perspective and Defining a Research Agenda. Ecol. Soc. 2009, 14, 1–19. [Google Scholar]
  17. Schultz, L.; Folke, C.; Osterblom, H.; Olsson, P. Adaptive governance, ecosystem management, and natural capital. Proc. Natl. Acad. Sci. USA 2015, 112, 7369–7374. [Google Scholar] [CrossRef] [PubMed] [Green Version]
  18. Cook, D.C.; Kristensen, N.P.; Liu, S. Coordinated service provision in payment for ecosystem service schemes through adaptive governance. Ecosyst. Serv. 2016, 19, 103–108. [Google Scholar] [CrossRef]
  19. Dunning, K.H. Adaptive governance of recreational ecosystem services following a major hurricane. Ecosyst. Serv. 2021, 50. [Google Scholar] [CrossRef]
  20. Yang, Y.; Zhang, X.; Mu, Y.; Zhang, W. The Basic Logic and Core Strategies of Ecological Protection and High-Quality Development in the Upper Reaches of the Yellow River. Econ. Geogr. 2020, 40, 9–20. [Google Scholar]
  21. Wang, S.; Fu, B.; Wu, X.; Wang, Y. Dynamics and sustainability of social-ecological systems in the Loess Plateau. Resour. Sci. 2020, 42, 96–103. [Google Scholar] [CrossRef]
  22. Wu, X.; Wei, Y.; Fu, B.; Wang, S.; Zhao, Y.; Moran, E.F. Evolution and effects of the social-ecological system over a millennium in China’s Loess Plateau. Sci. Adv. 2020, 6, eabc0276. [Google Scholar] [CrossRef]
  23. Ouyang, Z.; Zheng, H.; Xiao, Y.; Polasky, S.; Liu, J.; Xu, W.; Wang, Q.; Zhang, L.; Xiao, Y.; Rao, E.; et al. Improvements in ecosystem services from investments in natural capital. Science 2016, 352, 1455–1459. [Google Scholar] [CrossRef]
  24. Spangenberg, J.H.; von Haaren, C.; Settele, J. The ecosystem service cascade: Further developing the metaphor. Integrating societal processes to accommodate social processes and planning, and the case of bioenergy. Ecol. Econ. 2014, 104, 22–32. [Google Scholar] [CrossRef]
  25. Xie, X.; Sun, H.; Gao, J.; Chen, F.; Zhou, C. Spatiotemporal Differentiation of Coupling and Coordination Relationship of Tourism–Urbanization–Ecological Environment System in China’s Major Tourist Cities. Sustainability 2021, 13, 5867. [Google Scholar] [CrossRef]
  26. Shang, Y.; Liu, S. Spatial-Temporal Coupling Coordination Relationship between Urbanization and Green Development in the Coastal Cities of China. Sustainability 2021, 13, 5339. [Google Scholar] [CrossRef]
  27. Gunderson, L.; Light, S.S. Adaptive management and adaptive governance in the Everglades ecosystem. Policy Sci. 2006, 39, 323–334. [Google Scholar] [CrossRef]
  28. Lu, F.; Hu, H.; Sun, W.; Zhu, J.; Liu, G.; Zhou, W.; Zhang, Q.; Shi, P.; Liu, X.; Wu, X.; et al. Effects of national ecological restoration projects on carbon sequestration in China from 2001 to 2010. Proc. Natl. Acad. Sci. USA 2018, 115, 4039–4044. [Google Scholar] [CrossRef] [Green Version]
  29. Wang, Y.; Shao, M.; Zhu, Y.; Liu, Z. Impacts of land use and plant characteristics on dried soil layers in different climatic regions on the Loess Plateau of China. Agric. For. Meteorol. 2011, 151, 437–448. [Google Scholar] [CrossRef]
  30. Bebbington, A. Social Capital and Rural Intensification: Local Organizations and Islands of Sustainability in the Rural Andes. Geogr. J. 1997, 163, 189. [Google Scholar] [CrossRef]
  31. Anderies, J.M.; Mathias, J.-D.; Janssen, M.A. Knowledge infrastructure and safe operating spaces in social–ecological systems. Proc. Natl. Acad. Sci. USA 2019, 116, 5277–5284. [Google Scholar] [CrossRef] [PubMed] [Green Version]
  32. Hu, Z.; Miao, C.; Yuan, F. Impact of industrial spatial and organizational agglomeration patterns on industrial SO2 emissions of prefecture-level cities in China. Acta Geogr. Sin. 2019, 74, 2045–2061. [Google Scholar] [CrossRef]
  33. Berkes, F. Evolution of co-management: Role of knowledge generation, bridging organizations and social learning. J. Envron. Manag. 2009, 90, 1692–1702. [Google Scholar] [CrossRef]
  34. Wang, L.; Liu, H. The comprehensive evaluation of regional resources and environmental carrying capacity based on PS-DR-DP theoretical model. J. Geogr. Sci. 2019, 29, 363–376. [Google Scholar] [CrossRef] [Green Version]
  35. Li, B.; Shi, Z.; Han, Z.; Tian, C. Spatio-temporal difference and influencing factors of environmental adaptability measurement of human-sea economic system in Bohai Rim region. Acta Geogr. Sin. 2018, 73, 1121–1132. [Google Scholar]
  36. Guo, F.; Tong, L.; Wei, Q.; Zhang, H.; Qiu, F.; Tong, W. Spatio-temporal difference and influencing factors of environmental adaptability assessment of industrial system in the Songhua River Basin of Jilin Province. Acta Geogr. Sin. 2016, 71, 459–470. [Google Scholar]
  37. Costanza, R.; d’Arge, R.; de Groot, R.; Farber, S.; Grasso, M.; Hannon, B.; Limburg, K.; Naeem, S.; O’Neill, R.V.; Paruelo, J.; et al. The value of the world’s ecosystem services and natural capital. Ecol. Econ. 1998, 25, 3–15. [Google Scholar] [CrossRef]
  38. de Groot, R.S.; Wilson, M.A.; Boumans, R.M.J. A typology for the classification, description and valuation of ecosystem functions, goods and services. Ecol. Econ. 2002, 41, 393–408. [Google Scholar] [CrossRef] [Green Version]
  39. Xu, K.; Wang, J. An Empirical Study of A Linkage Between Natural Resource Abundance and Economic Development. Econ. Res. J. 2006, 78–89. [Google Scholar]
  40. Moore, M.-L.; Westley, F. Surmountable chasms: Networks and social innovation for resilient systems. Ecol. Soc. 2011, 16. [Google Scholar] [CrossRef]
  41. Atkinson, G.; Hamilton, K. Savings, Growth and the Resource Curse Hypothesis. World Dev. 2003, 31, 1793–1807. [Google Scholar] [CrossRef]
Figure 1. Theoretical framework.
Sustainability 13 11247 g001
Figure 2. Study area: the six provinces in northwestern China.
Sustainability 13 11247 g002
Figure 3. Changes of the coupling coordination degree of SES.
Sustainability 13 11247 g003
Figure 4. The moderating effect of social system governance on resource-dependence.
Sustainability 13 11247 g004
Table 1. Stages of the coupling coordination degree of SES.
Value IntervalsLevelType
[0,0.3)Extreme maladjustedMaladjustment
[0.3,0.4)Mildly maladjusted
[0.4,0.5)Close to maladjustedTransition
[0.5,0.6)Barely coordinated
[0.6,0.7)Primarily coordinatedCoordination
[0.7,1]Highly coordinated
Table 2. Major conservation projects involving northwestern China.
ProgramsStarting TimeInvolved Provinces in Northwestern China
Three-North Shelterbelt Program1978Xinjiang, Qinghai, Gansu, Inner Mongolia, Ningxia, and Shaanxi
Natural Forest Conservation Program 2001Xinjiang, Qinghai, Gansu, Inner Mongolia, Ningxia, and Shaanxi
Grain for Green Program1999Xinjiang, Qinghai, Gansu, Inner Mongolia, Ningxia, and Shaanxi
Beijing-Tianjin Sand Source Control Program 2002Inner Mongolia
Returning Grazing Land to Grassland Project 2003Xinjiang, Qinghai, Gansu, Inner Mongolia, and Ningxia
Table 3. Key actors involved in the establishing adaptive governance system of northwestern China.
Types of participationActorsStructures and ProcessesSocial Conditions
Formalized participation via self-mobilization and initiativeGovernment
  • the community-level self-governance policy and regional ethnic autonomy policy
  • continuous financing of major ecological projects
  • the “ecological redlines” of ecological function, environmental quality, and resource utilization initiated in 2009
  • ecosystem management penetrated economic policies, e.g., the supply-side structural reform proposed in 2015
  • enable legislation that creates space for ecosystem management
  • flexible institutional arrangement
  • funds from public sectors
  • cyclic iterative mechanism of monitoring and feedback
Inhabitants
  • develop dryland farming and herd interactions with the fragile ecosystem
  • monitoring and feedback regarding environmental illegalities and risks
  • monitor and respond to environmental feedback
  • develop social memory and create nodes of expertise
Enterprises
  • make attempts to lift the restrictions of resource shortage via industrial transformation and upgrading
Participation in projects or activities managed or co-managed with material incentives or functional purposesInhabitants
  • work for ecological projects, natural reserves, or ecotourism regions and obtain income from it
  • be motivated in ecological conservation by assessing government subsidies distribution
  • connect institutions and organizations across levels and scales
  • create nodes of expertise
  • combine knowledge and information for ecosystem management
  • funds from private sectors and NGOs
Enterprises
  • respond to policies for intensive land-use and industrial layout optimization that facilitate emission reduction and resource comprehensive utilization
  • be required to address the external diseconomy in supply-side structural reform
  • carry out local ecological projects and ecotourism regions
Scholars
  • cooperate with enterprises in generating eco-friendly technology
  • carry out eco-friendly innovations in the technology market facilitated by government subsidies
ENGOs
  • cohesive forces from various social actors to focus on territorial and practical issues of the ecosystem
Collaboration in stakeholder projects (active or passive) for continuous communication and information givingGovernment
  • construct and propagandize the concept that “lucid waters and lush mountains are invaluable assets.”
  • be inclusive toward grassroots voices and respond to them in a timely manner
  • sense-making
  • identify knowledge gaps
  • collaborative learning
  • facilitate information flows
  • combine knowledge and information for ecosystem management
Inhabitants
  • transmit information to the competent department based on social memory and monitoring on the internet
Scholars
  • pitch into the ecological diversion of technological innovation
Table 4. The evaluation system of adaptive governance.
System LayerStandard LayerIndicator LayerIndicator Direction
Ecosystem
Governance
Pollution ControlUrban sewage treatment rate (%)+
Harmless disposal rate of domestic garbage (%)+
Ratio of investment in environmental pollution control to GDP (%)+
Resource SavingComprehensive utilization rate of industrial solid waste (%)+
Ratio of urban water consumption saved to total water consumption (%)+
Ratio of water-saving irrigated area to arable land (%)+
Ecological RestorationRatio of soil and water loss control area to territorial area (%)+
Environmental water supply (100,000,000 m3 )+
Total area of afforestation (ha)+
Development RestrictionArea of the nature reserve (10,000 ha)+
Social System GovernanceLayout OptimizationEconomic agglomeration degree (km2/100,000,000 Yuan)+
Structure UpgradingIndustrial structure rationalization-
Industrial structure upgrading+
Technical InnovationNumber of authorized patent applications (per 10,000 persons)+
Ratio of R&D investment to GDP (%)+
Educational DevelopmentNumber of students above junior middle school (per 10,000 persons)+
Proportion of Education Investment in GDP (%)+
Table 5. The evaluation system of ESSD.
System LayerStandard LayerIndicator LayerIndicator Direction
EcosystemProvision ServiceWater resources per unit land area (10,000 m3/km2)+
Water resources per capita (m3/person)+
Basic coal reserves per capita (tons/person)+
Basic oil reserves per capita (tons/person)+
Basic natural gas reserves per capita (m3/person)+
Regulating ServiceRatio of forestland area to land area (%)+
Forest cover rate (%)+
Forest stock per unit area (m3/ha)+
Ratio of wetland area to land area (%)+
Ratio of natural grassland area to territorial area (%)+
Green coverage rate in built-up areas (%)+
Support ServiceRatio of desertification lands to the territorial area (%)-
Ratio of areas affected by natural disasters to land area (%)-
Grain yield per unit area (kg/ha)+
Social systemResource ConsumptionWater consumption per capita (cubic meters per person)-
Water consumption per unit of GDP (m3/10,000 yuan)-
Energy consumption per capita (tons of standard coal/person)-
Energy consumption per unit GDP (tons of standard coal/10,000 yuan)-
Emission IntensityWastewater discharge per unit GDP (tons/10,000 yuan)-
Ammonia nitride emission per unit GDP (kg/10,000yuan)-
Emission of chemical oxygen demand per unit of GDP (kg/10,000 yuan)-
Sulfur dioxide emissions per unit of GDP (kg/10,000 yuan)-
Smoke (powder) emission per unit GDP (kg/10,000 yuan)-
Output of solid waste per unit of industrial added value (kg/10,000 yuan)-
Pesticide application intensity (kg/ha)-
Agricultural fertilizer intensity (kg/ha)-
LandDevelopmentLand development intensity (%)-
Ratio of the cultivated area to national land area (%)-
Table 6. Regression results of the direct effect.
Model (1-1)Model (1-2)Model (1-3)
Intercept Term0.329 ***0.324 ***0.275 ***
(−0.050)(−0.052)(−0.052)
Control Variable
Pop0.153 *0.1340.078
(−0.084)(−0.089)(−0.077)
Urb0.280 **0.343 **0.495 ***
(−0.14)(−0.147)(−0.136)
Independent Variable
AG0.093 ***
(−0.029)
Eg 0.044 *
(−0.023)
Sg 0.032 *
(−0.016)
Waldchi-Squared Statistic2797.17 ***2348.74 ***3213.02 ***
Observed Value909090
Estimation MethodFGLSFGLSFGLS
Note. Cluster robust standard errors are reported in parentheses. * p < 0.1; ** p < 0.05; *** p < 0.01.
Table 7. Estimates results of the regulatory effect.
Physical Capital Input (Model 2)Human Capital Input (Model 3)
Model (2-1)Model (2-2)Model (2-3)Model (2-4)Model (3-1)Model (3-2)Model (3-3)Model (3-4)
Intercept Term0.224 ***0.284 ***0.331 ***0.340 ***0.233 ***0.277 ***0.325 ***0.350 ***
(−0.0483)(−0.0526)(−0.0527)(−0.0539)(−0.0507)(−0.0498)(−0.0416)(−0.0429)
Control variable
Pop−0.106−0.03440.180 **0.199 **0.001680.005150.02930.0424
(−0.088)(−0.091)(−0.078)(−0.0821)(−0.087)(−0.091)(−0.072)(−0.0745)
Urb0.767 ***0.562 ***0.324 **0.269 *0.710 ***0.564 ***0.479 ***0.399 ***
(−0.122)(−0.149)(−0.133)(−0.143)(−0.141)(−0.146)(−0.114)(−0.121)
Independent variable
EII−0.099 ***−0.102 ***−0.001−0.0161
(−0.019)(−0.021)(−0.020)(−0.022)
MHR −0.366 ***−0.544 ***−0.240 *−0.391 **
(−0.141)(−0.163)(−0.138)(−0.156)
Eg 0.036 * 0.0373 * 0.071 *** 0.0393 *
(0.022) (−0.0202) (0.024) (−0.0226)
Sg 0.0180.0167 −0.009−0.000954
(−0.016)(−0.0162) (−0.0158)(−0.0161)
Interaction term
EII *Eg −0.139 −0.0537
(−0.15) (−0.169)
MHR*Eg −1.792 −1.972
(−1.290) (−1.244)
EII*Sg 0.687 ***0.684 ***
(0.136)(−0.150)
MHR*Sg 3.823 ***3.459 ***
(0.63)(−0.65)
Wald
chi-squared statistic
1948.56 ***2303.78 ***4024.92 ***4299.49 ***2860.69 ***2190.98 ***4259.84 ***4536.12 ***
Observed value9090909090909090
Note. Cluster robust standard errors are reported in parentheses. * p < 0.1; ** p < 0.05; and *** p < 0.01.
Publisher’s Note: MDPI stays neutral with regard to jurisdictional claims in published maps and institutional affiliations.

