Article

Internet Development and Environmental Quality—Evidence from the Development of Chinese Cities

1
School of Economics and Statistics, Guangzhou University, Guangzhou 510006, China
2
Business School, Nanfang College Guangzhou, Guangzhou 510970, China
3
School of Management, Guangzhou University, Guangzhou 510006, China
4
Industry and Planning Research Institute, China Academy of Information and Communications Technology, Guangzhou 510030, China
5
School of Economics and Management, Southwest Jiaotong University, Chengdu 610031, China
*
Author to whom correspondence should be addressed.
Sustainability 2021, 13(20), 11308; https://doi.org/10.3390/su132011308
Submission received: 21 August 2021 / Revised: 15 September 2021 / Accepted: 5 October 2021 / Published: 13 October 2021

Abstract

:
Based on the data of the 283 prefecture-level cities in China from 2003 to 2018, this paper examines the impact of Internet development on environmental quality. The results show that China’s urban PM2.5 has a significant spatial spillover effect. In general, the Internet has a significant negative direct effect on urban environmental pollution, which means that the development of the Internet can improve urban environmental quality. This result remains robust under different methods. As the Internet has evolved over the years, its influence on environmental quality has increased and became more and more significant. In terms of regions, the spatial spillover effect of PM2.5 shows a pattern of eastern region < central region < western region < northeast region, where the eastern region is the only region with a statistically significant negative value for the coefficient, which indicates the direct effects of Internet development on the environmental quality. In addition, the statistic testing on mediating effect shows that the Internet’s effect on urban environment quality is mainly transmitted through the upgrading of industrial structure. With the industrial structure being used as the threshold variable, the influence of Internet development on environmental quality could be divided into two stages.

1. Introduction

Since the reform and opening-up, China’s economy has shown remarkable growth. With abundant resources and cheap labor, China’s gross domestic product (GDP) has grown at a higher rate than the world average over the same period and continues to maintain a strong momentum. In 2020, China’s GDP hit a record high of 100 trillion yuan, making it the world’s only major economy to achieve positive economic growth during the COVID-19 pandemic, contributing nearly 30% to the global economy and entering the ranks of higher-middle-income economies. In the future, China is expected to become the world’s largest economy, exerting greater influence on the global economy.
However, when examining China’s economic developments in the past, it is not difficult to discover that China’s rapid economic growth is inefficient and, to a large extent, at the expense of the environment. As China’s economic development has entered a new normal, it is inevitable for the country to deal with the increasing pressure of natural resources and environmental protection if it wishes to maintain its incremental achievement. Meanwhile, the dilemma between environmental quality and economic development is intensifying. Although the pace of achieving desirable environmental and development outcomes is accelerating, it is challenging to catch up with the degradation rate. Therefore, how to improve the environment has become an urgent research topic. Meanwhile, the rise of the Internet offers more possibilities for economic growth. The Internet breaks the boundaries of space and promotes virtual economy. New models and new business forms are emerging, such as the Internet economy and digital economy. The integration of the Internet and economic development fosters the rise of industrial digitalization and digital industrialization, which completely changes the country’s extensive development model. As a new generation of information technology, the Internet is bound to become a huge driving force of the digital economy, imposing a far-reaching influence on environmental quality.
Therefore, will the development of the Internet improve the quality of the urban environment in China? What is the internal logic between the two? Issues such as these have attracted widespread concern. Based on this, the paper uses the panel data of 283 cities in China from 2003 to 2018 as sample data, employs spatial econometric model, mediation and threshold regression analysis, and conducts empirical analyses to test the linear and nonlinear causal relationship between Internet development and environmental quality.

2. Literature Review

Since Grossman Krueger (1991) first proposed the Environmental Kuznets Curve, discussions of economic development and the environment have been emerging. After analyzing the development and the environmental process of most countries and regions, it was found that economic growth would first increase environmental pollution and then suppress it [1,2,3]. On the one hand, the irrational industrial structure caused by rapid industrialization is considered an important reason for increased environmental pollution; in other words, the manufacturing concentration accelerated environmental pollution [4]. Yu et al. used the nationwide shutdown caused by COVID-19 as a natural experiment to identify the primary industries that cause air pollution and found out that the impact on air quality mainly originated from the secondary industry [5]. On the other hand, industrial rationalization [6] and advancement [7] can improve air quality. Of course, the improvement of technological innovation level often plays a vital role in economic development and industrial structure upgrading, and it can effectively curb regional environmental pollution [7,8]. In addition, past studies have also analyzed the impact of population agglomeration [9,10], fiscal decentralization [11], environmental regulation [12], and other factors on environmental quality.
Internet technology is an important engine of economic development. In terms of Internet development, several indicators have been used, such as the comprehensive index of Internet development [13], network link strength [14], and Internet user size or penetration rate [15], to measure the level of Internet development. In general, the Internet has brought a disruptive impact on the economy and society, and the development of the Internet has a significant promotion effect and a positive spatial spillover effect on regional innovation capability enhancement [16], which also has a significant positive effect on the upgrading and rationalization of industrial structure [17]. Moreover, Internet technology has improved residents’ consumption structure and promoted consumption upgrading [18,19]. Relying on Internet technology, the development of e-commerce, digital finance, and mobile payments have also influenced household consumption [20].
With the emergence and development of global information technology, both domestic and international scholars have paid more attention to the role of the Internet in environmental governance. However, relevant literature is limited. Internet development often leads directly to high electricity consumption, which negatively affects environmental quality [21]. However, Pan W and Xiong J W found that there is no Granger causality between electricity consumption and carbon dioxide emissions based on China’s 1990–2013 data [22]; in addition, the key to reducing emissions lies in increasing investment and use of energy-saving and emission-reduction technologies in the power industry [23]. The diffusion of Internet technology has a specific effect on improving power use efficiency [24] and therefore has a positive effect on energy saving and emission reduction. From the perspective of transportation, motor vehicle exhaust emissions have become one of the major impacts affecting urban environmental quality [25]. However, governments at all levels have continuously improved motor vehicle emissions standards and installed exhaust gas purification devices to reduce air pollution caused by the growth of motor vehicles [26]. The advancement of Internet technology has led to the rapid growth of intelligent connected vehicles. With the popularization of new energy vehicles (battery-powered and hybrid cars), the energy mix has been dramatically improved, effectively reducing air pollution caused by engine exhaust gas.
The influence of the Internet on environmental pollution is beyond doubt. On the one hand, the Internet, a communication technology, has the characteristics of promoting information disclosure and sharing and reducing environmental pollution [27] and plays a role in energy conservation and emission reduction [28]. Haseeb A et al. found a long-term one-way causal relationship between the development of the Internet and CO2 emissions. They indicated that the emergence of the Internet has been beneficial to foster a green economy and improve environmental quality [29]. On the other hand, Internet access helps reduce air pollution levels [30]. Danish et al. found that information and communication technology (ICT) suppresses CO2 emissions in high-and middle-income countries by using cross-country data [31]. Guo Feng and Chen Kai analyzed the logical relationship and mechanism between the Internet and environment quality. Their empirical results show that the Internet has a significant negative direct effect on environmental emissions [32]. In addition, some scholars have found an inverted “U” relationship between ICT development and CO2 emissions [33]: for the region with a lower-to-mid level of Internet use, Internet development would significantly increase this region’s carbon emissions until a threshold is reached and then suppress the increase of its carbon emissions [34].
While the existing literature provides a valuable reference for studying the internal logic between the two, there are many inadequacies in research on the relationship between environmental quality and Internet development. Many studies mainly analyze the impact of carbon emissions through ICT, informatization, and the information industry, while few studies directly address their relationship. However, they have only conducted a simple regression analysis with no systematic discussion on the relationship between the effects of the two, let alone analyzing the heterogeneity effects and conducting nonlinear research. Therefore, this paper analyzes the impact of Internet development on environmental quality by using panel data of 283 cities at the prefecture-level and above in China from 2003 to 2018 with consideration of the spatial interaction among cities. The article also examines the influence mechanism of Internet development on environmental quality based on mediation analysis and constructs a threshold model to discuss these two’s nonlinear relationship and mechanism.

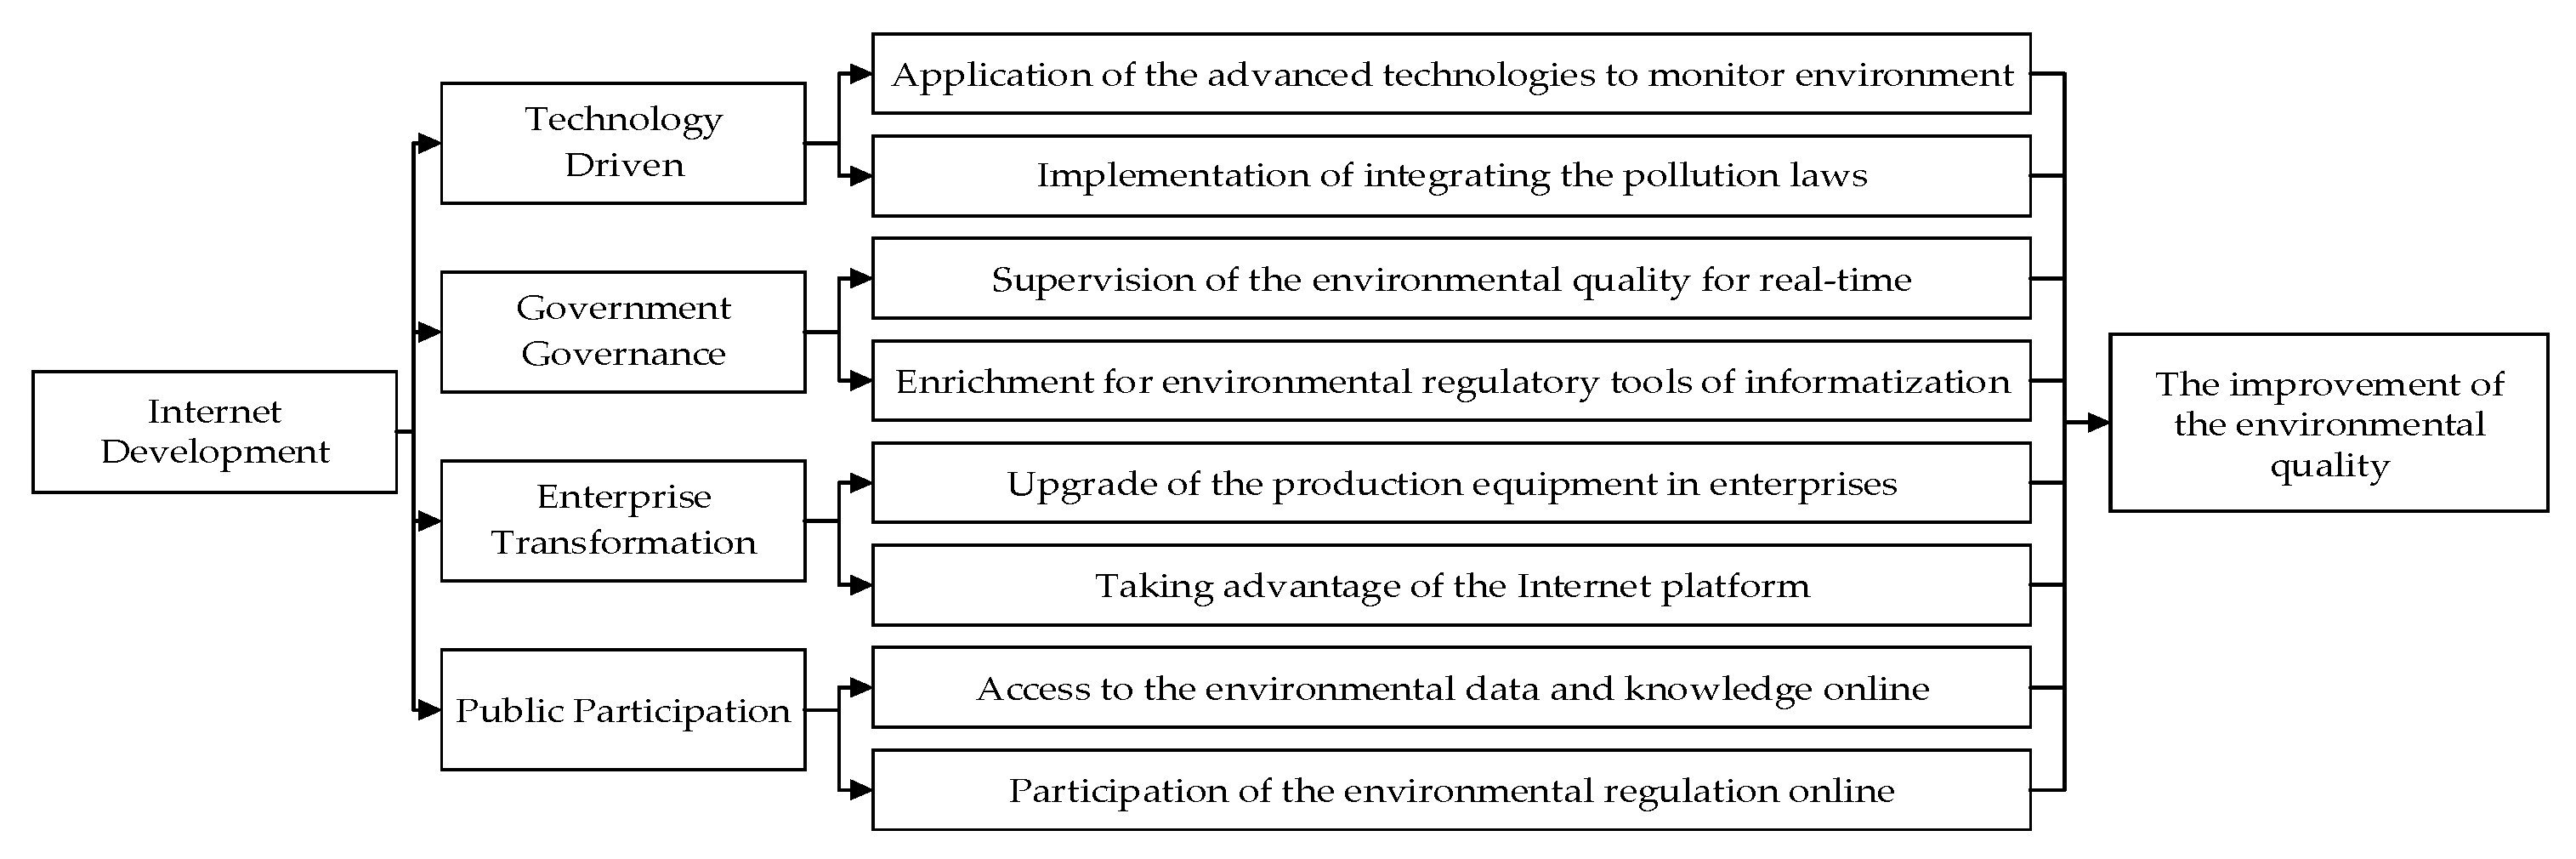
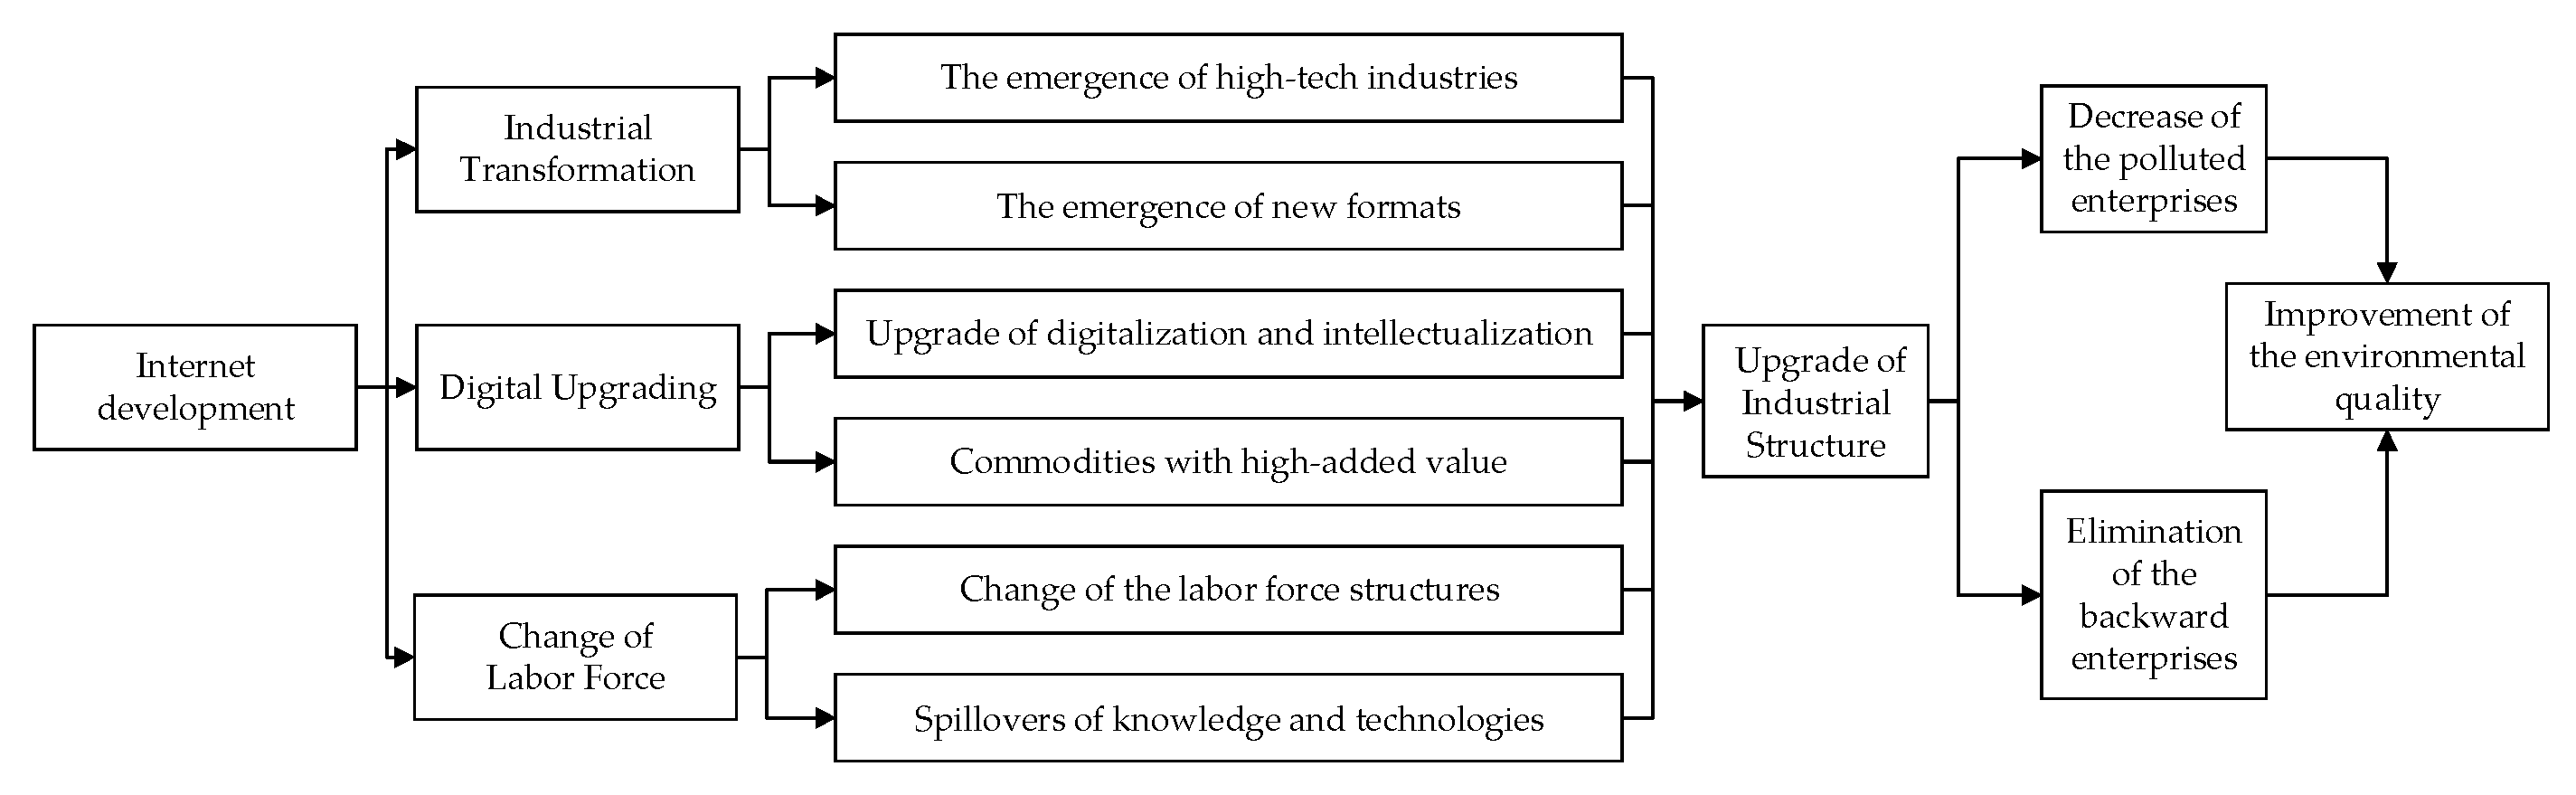
3. Impact Mechanism and Hypothesis

Environmental pollution control is a systematic project. The Internet, a technology with unique advantages of the cross space and time information dissemination, acquisition, and application, promotes the progress of whole society technology and provides the technical support for an environmental protection information-sharing mechanism. Overall, the development of the Internet facilitates the integration of strict and efficient environmental supervision, law enforcement, and real-time supervision of public environmental pollution, which directly impacts environmental quality through four angles: technology-driven, government governance, enterprise transformation, and public participation (Figure 1).
From the technology-driven perspective, the Internet has promoted the popularization and utilization of advanced technologies such as big data, cloud computing, and the Internet of Things. Information technology has been integrated into environmental pollution control. On the one hand, enterprises adopt the advanced intelligent monitoring system to promptly monitor (in real-time) the generation and emission of pollutants, thus improving the efficiency of cleaner production and environmental quality [35]. On the other hand, the application of big data technology can facilitate the integration and analysis of environmental monitoring data. A deep, systematic understanding of the correlation and change patterns of overall environmental quality and pollution data provides a basis for understanding environmental pollution control and the technical support for government decision-making on emission reduction. From the government governance perspective, Internet technology’s increasing maturity has raised the application level of environmental informatization [36]. The effective allocation of resources has made departmental environmental information linkage and resource sharing possible [37], which provides the necessary technical support for real-time environmental quality monitoring, supervision of the spatial distribution and dynamic evolution of pollutants, and promotes scientific decision-making and accurate prediction of environmental governance. In addition, the emergence of new technologies brought by the Internet has effectively made up for the shortage of traditional regulatory tools, greatly enriched environmental regulatory tools, and provided information support for the government to improve the efficiency of supervision and improve the level of environmental supervision and enforcement. From the enterprise transformation perspective, “Internet Plus” has triggered significant changes to the development of traditional high-polluting industries. It promoted the all-round upgrading and transformation of production equipment and blowdown equipment. Intelligent factories and digital workshops continue to emerge, while the “Internet plus manufacturing management” model improves the efficiency of production systems, energy conservation and emission reduction, and green production. In addition, the advantages of the Internet platform also help enterprises seek product innovation, develop cleaner production modes, and maximize the opportunities brought by green and low-carbon development. By forcing enterprises to improve production processes and promoting enterprises to accelerate innovation and upgrade through replacing traditional resource-intensive products with technology-intensive ones, energy consumption can be reduced in the production process. From the public participation perspective, environmental protection is closely related to everyone’s life [38]. The popularization of Internet technology provides new ways and opportunities for the public to obtain environmental information, form environmental awareness, and participate in environmental protection [39]. Therefore, the public can obtain environmental monitoring data and knowledge by using real-time communication technology and mobile terminal platforms. Meanwhile, the public can participate in environmental protection and report illegal behaviors through the online monitoring platform, which forces enterprises to reduce pollution and emissions, and thus achieve environmental improvement.
Based on the analysis above, the paper puts forward the hypothesis:
Hypothesis1: 
The development of the Internet is conducive to improving the quality of the environment.
The impact of the Internet technological progress on the optimization and upgrading of the industrial structure is far-reaching and lasting [40], and the upgrading of technological innovation can promote industrial restructure [41]. During the process, the influence mechanism of the Internet on environmental quality through the industrial structure includes (Figure 2):
First, by its very nature, the development of the Internet is the process of the emergence and growth of high-tech industries and emerging industries. High technologies increase enterprises’ technological components and upgrade enterprises to higher levels of the value chain; this is considered an important force in promoting industrial upgrading [42,43]. The development of the Internet has given birth to more emerging industries and accelerated the growth of information technology industries such as the Internet of Things, big data, 5G technology, and cloud computing, further optimizing and upgrading the industrial structure. In addition, the emergence of new business forms, such as the digital economy, digital trade, e-commerce, platform economy, and unmanned economy, has promoted the development of the tertiary industry, making the industrial system more complete and industry more coordinated.
Second, the development of the Internet can transform the traditional industry. This transformation is first reflected in the traditional industry, which, with the use of Internet technology, experiences digital, intelligent upgrading. In addition, Internet technology penetration and integration in various industries can enhance the flow and improve the allocation efficiency of innovative elements [44]. Traditional industries can absorb new technology and knowledge, accelerate the integration with information technology, improve operational efficiency, and form an efficient and intelligent production model [45,46]. Meantime, traditional industries can also use high-end digital technology to continuously improve product quality, reduce production costs, improve product added services, and enhance industry market competitiveness, promoting the transformation from the traditional industries to high value-added and thus achieve the advanced transformation of industrial structure.
Third, the use of the Internet and digital technology has improved the efficiency of the allocation of labor factors by reducing barriers to time and space, enriching workers’ employment and job choices [47], thus significantly increasing labor productivity in primary and secondary industries and exerting a strong substitution effect on the middle and low-end labor force [48]. As a result, the labor force would move from the first and second industries to the tertiary industry and from the low-level industries to the high-level industries. In addition, the typical feature of a professional division of labor is the technology spillover [49], in which the labor force acts as a bridge and enterprises can imitate and learn advanced technology through “learning by doing” and knowledge spillovers [50,51], potentially promoting the optimization and upgrading of industrial structure.
The development of the Internet not only optimizes the industrial structure but also indirectly affects the environmental quality. On the one hand, the industrial structure determines the proportion and category of resource consumption in different production stages. The upgrading of the industrial structure promotes more meticulous and professional collaboration among industries and their internal departments. Moreover, the improvement of technology directly reduces energy consumption and pollution emissions, affecting environmental quality. On the other hand, industry structure upgrading in a market economy would transfer limited resources from inefficient industries to high-efficiency ones. Emerging industries would often gain a competitive edge with their technological advantages, thus strengthening the market competition mechanism. In this process, traditional, lagged, and high-polluting industries are eliminated, while some enterprises are forced to improve their production process and management mode, thereby promoting the upgrading of industrial structure. Indeed, the degree of environmental pollution varies for different industrial structures. In general, the secondary industry, represented by the manufacturing and industry sector, is more dependent on traditional energy resources in its production process, producing more pollutant emissions, leading to direct deterioration of environmental quality. However, the tertiary industry is less dependent on resources and energy, and the pollution emissions are naturally less. The optimization and upgrading of the industrial structure are reflected in the increasing proportion of the tertiary industry and the declining proportion of the secondary industry, which undoubtedly improves environmental quality.
Hence, the paper puts forward the hypothesis:
Hypothesis2: 
The development of the Internet can optimize and upgrade the industrial structure and thus improve the quality of the environment.

4. Research Method

4.1. Model Settings

(1)
Standard panel data model
First, ordinary least squares (OLS) regression and the standard panel data set model were conducted using the 2003–2018 urban sample data without considering spatial correlation. The model is built as follows:
P M 2.5 i , t + 1 = β 0 + α i n t e r n e t i t + β i X i t + μ i t
where i represents a year, t represents a city, P M 2.5 i , t + 1 represents the air quality of PM2.5 in i year of t city in China, i n t e r n e t denotes the penetration rate of the Internet in t year; X i t denotes other control variables, including but not limited to the level of economic development, industrial structure and traffic conditions; μ i t is a random error term.
(2)
Spatial panel data model
Based on the standard model, the paper also considers the spatial dependence and spatial heterogeneity of the development level of the Internet and the change of environmental quality. As the concept of “space” varies in constructing the spatial model, the paper mainly considers the three mainstream spatial econometric models, namely the Space Durbin Model (SDM), Space Lag Model (SLM/SAR), and Space Error Model (SEM). In econometrics, the SDM indicates that the spatial unit is affected by its explanatory variables and by explanatory variables in adjacent areas. The model is as follows:
P M 2.5 i , t + 1 = ρ W L n P M 2.5 i , t + 1 + β 0 + α int i t + β i X i t + α 1 W int i t + θ i W X i t + μ i t
The Spatial Lag Model (SLM/SAR) indicates that the influence of explanatory variables on the dependent variable affects other regions through the transmission mechanism in space; that is, the dependent variable of a city is related not only to its explanatory variables but also to the dependent variables of adjacent cities. Based on the definition, the spatial weight matrix is included in the standard model, and the Spatial Lag Model is constructed as:
P M 2.5 i , t + 1 = ρ W P M 2.5 i , t + 1 + β 0 + α   i n t e r n e t i t + β i X i t + μ i t
The Spatial Error Model (SEM) indicates that the spatial spillover effect is random, in which the spatial covariance between different cities is used to reflect the error process. The primary purpose of the SEM is to resolve the errors caused by the inclusion of missing variables. The Spatial Error Model can be expressed as:
P M 2.5 i , t + 1 = + β 0 + α   i n t e r n e t i t + β i X i t + ( 1 - ρ W ) + μ i t
where P M 2.5 i , t + 1 represents the air quality of PM2.5 in i year of t city in China, internet represents the penetration rate of the Internet in t year, X i t denotes other control variables, ρ is the spatial autoregressive coefficient that can be used to measure the spatial spillover effect between cities, W i j is the spatial weight matrix of 283 × 283, and μ i t is the normally distributed random error.

4.2. Variable Description and Data Source

(1)
Explained variables
A total of 283 cities in China from 2003 to 2018 have been selected as the research sample, with a total of 4528 observations. PM2.5 data is adopted to represent the environmental quality level. In recent years, haze has become the norm in China, the control of haze has become an urgent problem to be solved by the Chinese government, and the primary task of haze control is to control PM2.5. PM2.5 is one of the major pollutants that determines the air quality index (Air Quality Index, or AQI), and air pollution is essentially the embodiment of environmental quality. In terms of improving air quality, China’s primary goal is to control PM2.5. This paper takes PM2.5 as a proxy variable for environmental quality, and the data are derived from the global annual PM2.5 grids data published by the Socioeconomic Data and Applications Center and hosted by Columbia University [52].
(2)
Core explanatory variable
Internet penetration (NET). Compared with the traditional use of web pages, domain names, websites, and other indicators to measure Internet development, the Internet penetration rate is more representative. Following the approach used by Ye Chusheng [53], the use of per capita Internet users is used as the core explanatory variable. This indicator reflects the breadth of Internet technology, which is calculated by the “number of Internet broadband subscribers /the total population at the end of the year” [54].
(3)
Control variables
Considering the heterogeneity between cities and preventing missing variables, the paper also includes other variables that have an essential impact on environmental quality based on reference to existing literature. Specifically, the level of economic development (GDP), density of population (PEO), industrial structure (INS), foreign direct investment (FDI), government fiscal expenditure (GOV), energy consumption intensity (ENERGY), and transport development (ROAD) are used as control variables. Specifically, “logarithm of GDP “ is used to measure the level of economic development, “the logarithm of total population per square kilometer” to measure the population density, “the ratio of value-added of the tertiary industry and GDP” to measure industrial structure; “FDI /GDP” to measure foreign direct investment (U.S. dollar to Chinese Yuan exchange rate published by the People’s Bank of China is used), “government expenditure /regional GDP” to measure fiscal expenditure, “the logarithm of per capita annual electricity consumption “ to measure energy consumption intensity, and “the logarithm of the paved road area per capita “ to measure transportation development.
(4)
Data resources
The sample includes 283 cities at the prefecture-level and above in Chinese mainland level, excluding Hong Kong, Macao, and Taiwan. Based on data availability, the time span of the study is 2003–2018. Given that time lag may exist between Internet development and environmental quality change, the level of PM2.5 in these 283 cities in year t + 1 is selected as a dependent variable and the driving forces in year t (2003–2017) as an independent variable. This also alleviates the model’s endogeneity. Relevant data are from the China City Statistical Yearbook, the provincial Statistical Yearbook, and the China Statistical Yearbook of Region, while appropriate methods are used to supplement the missing data. In order to make the study data series smoother, logs are taken for the non-ratio explanatory variables. The results are shown in Table 1 below.

4.3. The Spatial Weight Matrix Model

The assumption and selection of the spatial weight matrix have an essential influence on the credibility of the regression results of the spatial model. Therefore, in order to analyze the relationship between Internet development and environmental quality, this paper constructs four sets of weight matrices based on the existing literature as follows:
(1)
0–1 binary space weight matrix
The binary space weight matrix is built based on the existence of a neighboring relationship between cities. In particular, a rook contiguity matrix, which assumes two adjacent cities have a common border, is adopted. If the cities are adjacent, it is defined as 1; and if not, it is defined as 0 as follows:
W i j n = { 1 , i f 0 , i f t h e t h e t w o t w o c i t i e s c i t i e s a r e a r e n t a d j a c e n t a d j a c e n t
(2)
Geographical distance spatial weight matrix
The economic activity interaction between the two cities is closely related to their geographical distance. In general, the closer the two cities are, the more they are interconnected, whereas the further away the two cities are, the weaker they are economically connected. Therefore, this paper mainly uses the city longitude and latitude coordinates to measure the geographical distance between cities d i j , and applies the inverse distance as the spatial weight, which is built as W i j = 1 / d i j , i j .
(3)
Economic distance weight matrix
The 0–1 binary spatial weight matrix and the geographic distance matrix can reflect the spatial connection between cities to a certain extent. However, a close spatial relationship between neighboring regions does not guarantee frequent and close economic ties, and vice versa. Therefore, this paper also draws on the practice of Lin Guangping [55] to build an economic distance weighting matrix between cities based on the inverse of the mean difference between cities’ per capita GDP, which is defined as ( W i j = 1 / | Y ¯ j Y ¯ i | ), where Y represents the per capita GDP for each city.
(4)
Economic geography weight matrix
Taking both the economic and geospatial connection between cities into consideration, this paper forms an economic geospatial weight matrix. It is calculated by using the point multiplication algorithm in Matlab; that is, W = W 2 · W 3 .

5. Main Results

5.1. Preliminary Exploration of the Impact of Internet Development on Environmental Quality

(1)
Analysis of standard panel model results
Before conducting the empirical regression, the correlation between the variables was analyzed. It was found that the highest value of the correlation coefficient between other variables was only 0.562, except GDP and its square. After implementing the ordinary least square (OLS) method, this study found that the largest variance inflation factor (VIF) value among all of the variables in the model was 2.19 while the average VIF value was 1.63, both much less than the critical value of 10. The results showed that there is no multicollinearity in the model. This paper used the ordinary least square (OLS) method and ordinary panel regression, respectively, to analyze the impact of Internet development on environmental quality. As the Hausman test results reject the null hypothesis of random effect, a fixed-effect model is chosen. Table 2 shows the estimated results of whether to include control variables. Given the possibility of the existence of the Kuznets curve, all regression results were retained to compare the observations.
Whether control changes are included or not, the results of OLS regression and ordinary panel regression show that: first, the regression coefficient of the core explanatory variable, Internet development, is negative and significant at 1 or 5%. The paper uses PM2.5 to measure the quality of the urban environment: a decrease of PM2.5 index means an improvement of environmental quality, which directly indicates that the improvement of the level of Internet development has a significant positive effect on urban environmental quality. Second, the impact of GDP on haze emissions is significantly positive, and the quadratic term ratio of GDP is significantly negative. This means, with the continuous growth of the economy, environmental quality shows a trend of “pollution first and clean-up later.” Hence, the environmental Kuznets curve (EKC) exists in China. In addition, in the fixed effect model, the industrial structure and energy consumption have a significant impact on environmental quality.
(2)
Analysis of Spatial correlation
Meanwhile, the paper also adopted Moran’s I test and calculated Moran’s I values for 283 cities in different years based on the economic distance spatial weight matrix. The specific results are shown in Table 3. In general, before determining whether spatial measurement methods are appropriate, it is necessary to examine whether there is spatial dependence on the data, i.e., to test the spatial autocorrelation of PM2.5 in various municipalities. If the value of Moran’s I is greater than 0, it indicates positive spatial autocorrelation, where high values clusters are adjacent to other high values, and low values clusters are adjacent to other low values. In contrast, if the value is less than 0, negative autocorrelation is indicated. From the results of Table 3, the Moran’s I for PM2.5 is greater than 0 in the economic distance space weight matrix in 2004–2018 and is significant at 1%. This shows that the urban environmental quality of China has a strong spatial autocorrelation and tends to cluster spatially. Therefore, based on the above analysis, it is necessary to include spatial factors and employ spatial regression.

5.2. The Impact Analysis of the Development of the Internet in Spatial Connections Considering the Environmental Quality

The paper used economic distance, the per capita GDP in different cities, as the weight of spatial weight matrix and implemented the Space Durbin Model as a benchmark model. The estimated results of the impact of Internet development on environmental quality are shown in Table 4 below. The results of the Hausman test are significantly positive, so fixed-effects estimates are chosen as the basis for the conclusion, with random-effects estimates used as a reference. Models 1 and 2 show the estimated results using Internet development, GDP, and its square terms, while models 3 and 4 are the estimated results using all other control variables in the full sample.
The results show that the spatial autocorrelation coefficient ( ρ ) remains positive in different estimation results and has passed the significance test at the 1% level. This indicates that the interpreted variable Chinese city PM2.5 has an obvious spatial spillover effect; in other words, increased environmental pollution in one city leads to worsening pollution in neighboring cities. The results show that for every unit increase of PM2.5 concentration of haze pollution in neighboring cities, the concentration of PM2.5 of haze in the city would be increased by about 0.577 units, indicating a clustering tendency of haze pollution between cities. Regarding Internet development, the regression coefficient for a direct effect is negative while that for a spillover effect is positive and is significant at the 1% level. This shows that Internet technology has a positive direct effect on the improvement of local environmental quality; however, it tends to worsen the environmental quality in neighboring cities. A possible explanation for this might be that the integration of Internet technology and urban industrial structure in a city is often accompanied by the spatial transfer of high-polluting industries to neighboring areas. Meanwhile, the linear coefficient of GDP to haze emissions under the fixed effects is positive but not statistically significant, whereas the quadratic term ratio of GDP is significantly negative. This reveals that, given the direct spatial connection between cities, the environmental Kuznets EKC curve still exists, but not significantly. Overall, in the early stage of economic development, society pays more attention to increasing production output and ignores environmental problems to a certain extent. With a rising level of economic development, people become more aware of environmental protection: more money is used for haze pollution control, leading to a decline of PM2.5 after passing a threshold.
In terms of control variables, the tertiary industry has a significant role in promoting urban environmental quality, which means upgrading the industrial structure can improve environmental quality. Traditional industrial development relies too much on coal and other fossil fuels, which bring a large amount of pollutant emissions and aggravate the deterioration of environmental quality. With the economic development, the proportion of tertiary industry in the national economy keeps increasing and economic growth transforms from relying on resources and labor force to technology and become more intensive, green, and sustainable. This trend is consistent with the estimated results based on the regression of ordinary panels, which also confirms the rationality of analysis through spatial. The increase in population density does not necessarily lead to the deterioration of environmental quality; it also improves the environment. The coefficient of trade level is positive and significant: it has been viewed that opening-up increases haze pollution as the opening-up policy has caused the phenomenon of a “pollution haven” in China. As a large manufacturing country and the major participant in mid-stream industries in the global value chain, China has taken many high-polluting and high-energy manufacturing industries outsourced by developed countries. The results also show that the “pollution haven” has been a persistent phenomenon. Government intervention also has a positive effect on haze pollution, with a coefficient of 5.417, significant at the level of 5%. This indicates that, on average, the increase in the proportion of fiscal expenditure promotes environmental pollution emissions. In addition, both transport infrastructure and electricity consumption have a negative impact on PM2.5, but it is not significant.

5.3. Robustness Test

(1)
Spatial Durbin Model estimates with different weight matrices
The assumptions of the spatial weight matrix affect the estimation results of the model. In order to test the robustness of the above-mentioned benchmark regression model, the article further selected the 0–1 matrix, the geographical weight matrix, and the economic–geographic weight matrix, respectively, as three different weights to implement the Spatial Durbin Model. The Haussmann test was used to determine the selection of fixed effects or random effects. The results are as follows in Table 5. Firstly, the spatial autocorrelation coefficients are significantly positive at the level of 1% for all of these three weight matrices, and ρ in the full sample were 0.937, 0.986, and 0.813, respectively. Except the exact values, the signs (positive/negative) and significance levels are in line with the results of economic weight matrix estimates. By comparing their values, it is found that the PM2.5 spillover effect in the geographic matrix estimation results is most significant, which indicates that the spillover effect of environmental quality has a strong relationship with distance. Secondly, apart from the geographical weight matrix, whose impact of Internet development on environmental quality is not significant (but is still negative), the estimated results of the other two weighted matrices are significantly negative, consistent with the benchmark regression results. The improvement effect of Internet development on environmental quality is mainly reflected in neighboring cities or cities with strong economic ties with a “boundary effect” of haze pollution between cities. Therefore, the improvement effect of Internet development on environmental quality is more significant under the economic distance matrix or the adjacent matrix. In addition, the signs of other variables are generally consistent.
(2)
Estimates with spatial metering model
The Space Durbin Model, Space Lag Model, and Space Error Model are commonly used in research [56,57]. While taking the Spatial Durbin Model as the benchmark regression, the paper also used the Space Lag Model (SAR/SLM) and the Space Error Model (SEM). The fixed effect was chosen by using the Hausman test. Table 6 show that the spatial autocorrelation coefficient ρ or value γ is significantly positive at 1%, and the spatial autocorrelation coefficients of the two models are 0.702 and 0.73, respectively. This is consistent with the results of the benchmark regression. Furthermore, the coefficients of Internet development in both the Spatial Lag Model and the Spatial Lag Model are significantly negative at the level of 5%. In addition, the coefficients and significance levels of each variable are similar to those of the baseline regression. This reveals that the re-estimated results with different spatial models have strong robustness.
(3)
The estimated results with different core interpreted variables
Sulfur dioxide (SO2) is a common pollutant representing inter-regional pollution transmission (Cheng Guangshuai and Hu Jin rust, 2019). Meanwhile, the paper used negative index industrial SO2 emissions per 100 people to measure the quality of the urban environment and examined the robustness of the test model again. A random effect model was selected according to the results of the Hausman test for all variables. In Table 6, the Spatial Durbin Model with different core interpreted variables shows that the spatial autocorrelation coefficient value ρ is significantly positive at the confidence level of 1%, which is consistent with the regression results of PM2.5 in measuring the quality of the urban environment. In addition, the coefficients of Internet development are significantly negative at the level of 10%. The estimated results with different interpreted variables are relatively robust.

5.4. Heterogeneity Analysis

(1)
Time heterogeneity
In 2000, China’s three major portals, Sohu, Sina, and NetEase, became listed on the NASDAQ in the United States of America. The Internet was a booming trend. The article selected 2003–2018 as the research time frame, a period when China’s Internet development was fast. During this time frame, much happened, including the 2008 global financial crisis and the Internet’s transformation from PC to mobile in 2009, which led Internet development to enter a new era. In order to measure the temporal impact of Internet development on the environmental quality in a more direct way, the paper divided the full sample data into two different time periods, namely 2003–2009 and 2010–2017, and implemented the spatial Durbin model by using the economic distance space weight matrix. The Hausman test was conducted in which the null hypothesis is accepted, and the random effect model was chosen.
In Table 7, the results of the spatial Durbin model in different time periods show that the spatial autocorrelation coefficient is significantly positive at 1%. Overall, the spatial spillover effect of fog and haze in Chinese cities has decreased over time but has not changed significantly, considering the change from 0.3 to 0.2761 in all variable cases. In terms of each time period, the impact of Internet development is negative and not significant in 2003–2009, while the spillover effect of the Internet was not significant either. This indicates that Internet development during this period did not directly improve the environmental quality. However, with continuous Internet development, the regression results for the period 2010–2017 show that the impact of Internet development on environmental quality is negative, and at the confidence level of 5% is significant. In recent years, China has vigorously promoted the “Internet Plus” action. The continuing integration of Internet innovations and society combined with the increasing industrial digitalization changes the industrial structure and pushes the economy to shift to a low-carbon green development mode, thus improving environmental quality. In addition, GDP per capita, its quadratic term ratio, and population density have a significant impact on haze, with coefficient signs in line with the benchmark regression.
(2)
Regional heterogeneity
This paper divided all the sample cities into four regions: east, central, west, and northeast. The spatial Durbin model was conducted for each region, with specific results shown in Table 8. In the four regions, the spatial autocorrelation coefficients were all positive and are significant at the level of 1%, with the coefficients showing a pattern of eastern region < central region < western region < northeast region. This indicates an obvious spatial spillover effect and a specific spatial distribution of PM2.5 in Chinese cities. The results show that only the coefficient indicating the direct effects of Internet development on the environmental quality in the eastern region is significantly negative, showing a positive promotion effect of Internet development on environmental quality in the eastern region. This result may be explained by the fact that the eastern region itself is more developed and has a leading position in digital infrastructure, integration of the innovation achievements of the Internet with all areas of the economy and society (with the increasing popularity of 5G) and Internet development, resulting in a more visible improvement effect on environmental quality. In the estimated results of the central, western, and northeast regions, coefficients of the Internet are either positive or negative but not significant. Their results are for reference only: the coefficient of the central region is positive, which is possible because the central region is home to a larger portion of high-polluting industries and has become the prominent targeted place to implement pollution reduction measures using modern technologies.

6. Further Discussion

6.1. The Mediating Effect Test

In order to identify whether Internet development promotes environmental quality through other processes, this paper established a mediation model to assess the mechanism between Internet development and environmental quality. The models are specified as follows:
P M 2.5 i , t + 1 = β 0 + α   i n t e r n e t i t + λ j X i t + μ i t
M i t = β 0 + α 1   i n t e r n e t i t + λ j X i t + μ i t
P M 2.5 i , t + 1 = β 0 + α 2   i n t e r n e t i t + α 3 M i t + λ j X i t + μ i t
where i represents a city, t represents time, P M 2.5 i , t + 1 represents the environmental quality of each city, I n t e r n e t represents the level of Internet development of each city; M is a mediating variable denoting industrial structure, proxied by “the output value of the tertiary industry/GDP.” According to the theoretical basis for test mediating effect, if α is significant, it meets the requirements of mediating analysis for the follow-up tests. With α being significant: if α 1 , α 2 , and α 3 are all significant, then it is the case of partial mediation; if only α 1 and α 3 are significant whereas α 2 is not, then it is the case of full mediation; if neither α 1 or α 3 are significant, then there is no mediating effect.
Based on the economic distance weight matrix, the paper used the Spatial Durbin Model and the Spatial Lag Model and analyzed the mediating effect of industrial structure upgrading on urban environmental quality. Combined with the regression results in Table 9, it is shown that: firstly, without the influence of mediating variables, the coefficients of core explanatory variables on PM2.5 emissions are significantly negative; and secondly, the coefficients of core explanatory variables on mediating variables are significantly positive, indicating that the development of the Internet has a positive promotion effect on the upgrading of industrial structure. Thirdly, after introducing mediating variables, the influence of industrial structure upgrading on urban pollution emissions is significantly negative, as the coefficients of core explanatory variable Internet development on urban environmental quality are significantly negative and see a decline in absolute numbers. This indicates that the industrial structure upgrading has a partial mediating effect on the pollution reduction function of the Internet. An explanation for this is that the Internet can break the boundaries between industries and promote the integration of upstream and downstream industries as it enjoys a high level of innovation, permeability, and diffusion. During this process, knowledge, technology, and information replace traditional natural resources and the environment and become production factors. Through the effective allocation of resources via advanced technology, low-input and-low pollution industries become capable of achieving high output, thereby effectively improving the quality of the urban environment.

6.2. Threshold Effect Test

The above analysis results are apparent: the impact of Internet development on the improvement of urban environmental quality in China is heterogeneous. The mechanisms between Internet development and promoting environmental quality also vary, which may cause changes in environmental quality through other factors. In other words, a threshold effect may exist. Hence, this paper used the panel threshold model proposed by Hansen and analyzed whether there is a nonlinear relationship between environmental quality and Internet development. The basic model is as follows:
y i t = μ i + β 1 x i t × I ( q i t γ ) + β 2 x i t × I ( q i t > γ ) + ε i t
where q represents the threshold variable, λ represents the threshold value, ε i t is the random disturbance item, and I ( ) represents the characteristic function. Both the threshold value and the number of thresholds are usually determined by the intrinsic characteristics of the data. The model of multiple threshold values is as follows:
y i t = μ i + β 1 x i t × I ( q i t γ ) + + β n x i t × I ( γ n 1 < q i t γ ) + ε i t
Therefore, the article used “the output value of the tertiary industry /GDP” to measure the industrial structure and incorporated it as the threshold variable to examine the impact of Internet development on environmental quality. A single threshold of 48.64 was computed using 500 bootstrap simulations; hence, this paper rejects the null hypothesis of no threshold effect at the 5% significance level. Based on threshold analysis results (Table 10), it can be found that when the proportion of tertiary industry in urban development is less than 48.68, its coefficient on environmental quality is −11.13 and significantly negative at the level of 1%, which means it plays a significant role in improving the environmental quality. When the value is greater than 48.68, its coefficient remains negative, but Internet development’s effect on improving environmental quality has been reduced. Therefore, it can be concluded that the impact of Internet development on environmental quality has two stages. With the continuous change of industrial structure, the improvement effect would be greatly reduced once the proportion of tertiary industry in this city passes the critical value. This is also in line with the law of decreasing the marginal effect and the nature of urban development. A lower proportion of tertiary industry means that cities are dominated by manufacturing and industry sectors; therefore, changes caused by the increasing penetration of the Internet to the industrial structure are apparent: more service industries are beginning to emerge, thus improving environmental quality in a more obvious way. The paper also analyzed the raw data of the level of Internet development in the Chinese city in 2017. The number of cities with a tertiary-industry-to-GDP ratio greater than 48.68 has reached 207. In other words, Internet development is conducive to improving the environment’s quality for most cities in the future. Due to words and data limitations, the article did not conduct in-depth examinations of the threshold effect of other factors such as the level of economic development, which could be the basis for future research.

7. Conclusions and Prospects

Based on the data of 283 prefecture-level cities in China from 2003 to 2018, this paper employed a spatial econometric model, mediation and threshold regression analysis, and conducted empirical analyses to test the linear and nonlinear causal relationship between Internet development and environmental quality. Considering the influence of spatial correlation, PM2.5 in Chinese cities has an obvious spatial spillover effect. The Internet has a significant negative direct effect on urban environmental pollution, which means the development of the Internet has a significant effect on improving the quality of the urban environment. This result has strong robustness even under different spatial weight matrices, different spatial models and different core explanatory variables. In terms of time, Internet development did not directly improve the environmental quality in the early stages, but with the continuous improvement of Internet development, it continues to contribute more in improving environmental quality. By region, only the coefficient indicating the direct effects of Internet development on the environmental quality in the eastern region is significantly negative, while the estimated results of other regions, including the central, western, and northeast regions, are not significant. In addition, the statistic testing on the mediating effect shows that the Internet’s effect on the quality of the urban environment is mainly transmitted through the upgrading of industrial structure. With the industrial structure being used as the threshold variable, the influence of Internet development on environmental quality is divided into two stages. With the continuous change of industrial structure, the improvement effect would be greatly reduced once the proportion of tertiary industry in this city passes the critical value.
Based on the above conclusions, the article puts forward the following suggestions. Internet technology upgrading is the key driving force to maintain sustainable economic growth and improve ecological environment quality. Internet infrastructure is essential for Internet development; for that reason, cities should formulate a suitable Internet development strategy for their region, promote inclusive Internet and effectively improve Internet penetration. They should also encourage inter-cities information exchange and cooperation and utilize network technology spillover to improve intercity environmental quality, forming both the catch-up effect of information technology and the learning effect of cross-region environmental governance. In addition, as industrial structure development has obvious mediating effects and threshold effects on environmental improvement, it is crucial to promote cross-region technical cooperation actively, utilize the function of the Internet as public infrastructure effectively, and speed up the implementation of the “Internet Plus” strategy. Moreover, based on the region’s current industrial structure, it is also important to encourage enterprises to invest more in technological innovation, enhance industrial restructuring, promote the integration of the Internet and region’s real industries, and utilize benefits in the industrial structure-driven emission reduction. Finally, the study found that factors such as economic development, tertiary industry advancement, foreign direct investment (FDI), and government financial intervention would significantly impact urban environmental quality. This shows that the improvement of urban environmental quality requires a combination of policies to regulate and control. While it is essential to rely on the advancement of Internet technologies to reduce pollution emissions, the government should also play an active role in formulating scientific, rational urban development plans, vigorously developing modern service industries, and let the market play a decisive role in resource allocation.
Of course, there is still room for further improvement of existing research. This paper assessed Internet development and the quality of the environment with reference to existing literature. However, since economics has become an independent social science subject, its research paradigm and methodologies have evolved and become more objective. Although this paper used “Internet penetration” to measure Internet development, it has been noted that it is challenging to capture Internet development’s depth and breadth comprehensively. In the future, finding the right policy for quasi-natural experiments to assess the impact of the Internet on environmental quality could be the key direction of breakthrough. In addition, the generalizability of these results is yet to be verified. Whether the same conclusions can be drawn in global urban agglomerations, for example, the Guangdong–Hong Kong–Macao Greater Bay Area, the Beijing–Tianjin–Hebei urban agglomeration, and the Yangtze River Economic Belt in China, is also a question in need of further investigation.

Author Contributions

Conceptualization, X.Z.; methodology, X.Z.; software, P.C.; validation, R.X.; resources, P.C.; data curation, P.C.; writing—original draft preparation, X.Z.; writing—review and editing, X.Z.; visualization, X.Z.; supervision, R.X.; formal analysis, K.K.; literature collection, K.K. All authors have read and agreed to the published version of the manuscript.

Funding

This research was funded by Guangdong Provincial Department of Education (grant number 2021WTSCX123).

Institutional Review Board Statement

Not applicable.

Data Availability Statement

Data available in the global annual PM2.5 grids data published by the Socio-economic Data and Applications Center and hosted by Columbia University, the China City Statistical Yearbook, the provincial Statistical Yearbook, and the China Statistical Yearbook of Region.

Conflicts of Interest

The authors declare no conflict of interest.

References

  1. Aslan, A.; Destek, M.A.; Okumus, İ. Bootstrap Rolling Window Estimation Approach to Analysis of the Environment Kuznets Curve Hypothesis: Evidence from the United States. Environ. Sci. Pollut. Res. 2018, 25, 2402–2408. [Google Scholar] [CrossRef]
  2. Sun, P.; Wu, Y.; Bao, S.; Zhong, Y. A Study on Economic Growth and Smog Pollution: Testing Spatial Environmental Kuznets Curve Hypothesis in China. South China J. Econ 2019, 38, 100–117. (In Chinese) [Google Scholar]
  3. The Environmental Kuznets Curve Model for Greenhouse Gas Emissions in Canada—ScienceDirect. Available online: https://www.sciencedirect.com/science/article/pii/S0959652618304979 (accessed on 16 August 2021).
  4. The Spatial Correlation and Interaction between Manufacturing Agglomeration and Environmental Pollution—ScienceDirect. Available online: https://www.sciencedirect.com/science/article/pii/S1470160X15006111 (accessed on 16 August 2021).
  5. Yu, D.; Li, S. Industrial Structure Effect of China’s Urban Air Quality Improvement: A Natural Experiment of Covid-19. J. Financ. Econ. 2020, 47, 19–34. [Google Scholar]
  6. Zhu, M.; Wu, Q.; Zhang, H.; Chen, Z. The Threshold Effect of Rationalization of Industrial Structure on Air Quality in Shanxi Province. J. Resour. Ecol. 2020, 11, 206–212. [Google Scholar] [CrossRef]
  7. Xin, X.; Lyu, L. Spatial Differentiation and Mechanism of Technological Innovation Affecting Environmental Pollution in Major Chinese Cities. Sci. Geogr. Sin. 2021, 41, 129–139. (In Chinese) [Google Scholar]
  8. Gao, F.; Shao, H. The Impact of Financial Development, Technological Innovation on Environmental Pollution. Financ. Account. Mon. 2020, 21, 148–156. (In Chinese) [Google Scholar]
  9. Zhu, W.; Zhang, X. Population Aggregation, Economic Growth and Urban Air Quality: Spatial Econometric Analysis Based On Data Of 274 Prefecture Level Cities. Northwest Popul. J. 2021, 42, 37–50. (In Chinese) [Google Scholar]
  10. Liu, R.; Li, P. A Study on Environmental Quality Effect of Urban Expansion in China. Ecol. Econ. 2021, 37, 76–81. (In Chinese) [Google Scholar]
  11. Lu, W.; Luo, Q. The Impact of Sub-provincial Fiscal Decentralization and Promotion Competition on Environmental Quality: Theory and Evidence. Collect. Essays Financ. Econ. 2021, 1, 14–23. (In Chinese) [Google Scholar]
  12. Wang, Y.; Lu, Y. Fiscal Decentralization, Environmental Regulation and Regional Environmental Quality—Empirical Analysis Based on Mediation Effect and Threshold Effect. Inq. Econ. Issues 2021, 3, 120–137. [Google Scholar]
  13. Huang, Q.; Yu, Y.; Zhang, S. Internet Development and Productivity Growth in Manufacturing Industry: Internal Mechanism and China Experiences. China Ind. Econ. 2019, 8, 5–23. [Google Scholar]
  14. Liu, B.; Gu, C. Does the Internet Promote Value Chain Linkages between Two Countries. China Ind. Econ. 2019, 11, 98–116. (In Chinese) [Google Scholar] [CrossRef]
  15. An, T.; Yang, C. How the Internet Is Reshaping China’s Economic Geography: Micro Mechanism and Macro Effects. Econ. Res. J. 2020, 55, 4–19. (In Chinese) [Google Scholar]
  16. Ceng, C.; Jiang, W. Internet Development, Spatial Correlation and Regional Synergic Innovation. Stat. Decis. 2021, 37, 70–74. (In Chinese) [Google Scholar]
  17. Zuo, P.; Jiang, Q.; Chen, J. Internet Development, Urbanization and the Upgrading of China’s Industrial Structure. J. Quant. Tech. Econ. 2020, 7, 71–91. (In Chinese) [Google Scholar]
  18. Zhu, Z. Do Internet Skills Contribute to the Consumption Upgrading of Rural Residents? —Evidence from Chinese Social Survey 2015. Stat. Res. 2020, 37, 68–81. (In Chinese) [Google Scholar]
  19. Bahia, K.; Castells, P.; Cruz, G.; Masaki, T.; Pedros, X.; Pfutze, T.; Rodriguez Castelan, C.; Winkler, H.J. The Welfare Effects of Mobile Broadband Internet: Evidence from Nigeria; Policy Research Working Paper Series; The World Bank: Washington, DC, USA, 2020. [Google Scholar]
  20. He, Z.; Song, X. How Does Digital Finance Promote Household Consumption. Financ. Trade Econ. 2020, 41, 65–79. (In Chinese) [Google Scholar]
  21. Liu, H.; Zhang, J. Study on the relationship between Internet use, power consumption and economic growth. J. Northwest. Polytech. Univ. Sci. 2016, 36, 44–51. (In Chinese) [Google Scholar]
  22. Pan, W.; Xiong, J. An Empirical Study on Electricity Consumption, Economic Growth and CO2 Emission-Panel Data of China. Chin. J. Manag. Sci. 2018, 26, 152–159. (In Chinese) [Google Scholar]
  23. Liu, Z.; Zhu, K.; Yan, J.; Shi, Y. The Analysis of Power Sector Carbon Mitigation Potential in the Industrial Structure Optimization Scene. J. Ind. Eng. Eng. Manag. 2014, 28, 87–92. (In Chinese) [Google Scholar]
  24. Bernstein, R.; Madlener, R. Impact of Disaggregated ICT Capital on Electricity Intensity in European Manufacturing. Appl. Econ. Lett. 2010, 17, 1691–1695. [Google Scholar] [CrossRef]
  25. Sun, C.; Xu, S. Analysis of the Impact and Effect Test of Urban Vehicles Restriction on PM2.5 Emission. Chin. J. Manag. Sci. 2021, 29, 196–206. [Google Scholar]
  26. Liu, H.; Lei, M. The Causality between Traffic Congestion and Smog Pollution—An Empirical Study Using Convergent Cross. Mapp. Stat. Res. 2019, 36, 43–57. (In Chinese) [Google Scholar]
  27. Avom, D.; Nkengfack, H.; Fotio, H.K.; Totouom, A. ICT and Environmental Quality in Sub-Saharan Africa: Effects and Transmission Channels. Technol. Forecast. Soc. Chang. 2020, 155, 120028. [Google Scholar] [CrossRef]
  28. ICTs: Do They Contribute to Increased Carbon Emissions?—ScienceDirect. Available online: https://www.sciencedirect.com/science/article/pii/S0040162511002836 (accessed on 16 August 2021).
  29. Haseeb, A.; Xia, E.; Saud, S.; Ahmad, A.; Khurshid, H. Does Information and Communication Technologies Improve Environmental Quality in the Era of Globalization? An Empirical Analysis. Environ. Sci. Pollut. Res. 2019, 26, 8594–8608. [Google Scholar] [CrossRef]
  30. Park, Y.; Meng, F.; Baloch, M.A. The Effect of ICT, Financial Development, Growth, and Trade Openness on CO2 Emissions: An Empirical Analysis. Environ. Sci. Pollut. Res. 2018, 25, 30708–30719. [Google Scholar] [CrossRef]
  31. Zhang, J.; Wang, B.; Latif, Z. Towards Cross-Regional Sustainable Development: The Nexus between Information and Communication Technology, Energy Consumption, and CO2 Emissions. Sustain. Dev. 2019, 27, 990–1000. [Google Scholar] [CrossRef]
  32. Guo, F.; Chen, K. The Impact of Internet on Urban Environmental Quality From Spatial Perspective— Based on Spatial Durbin Model and Mediating Effect Model. Inq. Econ. Issues 2021, 1, 104–112. (In Chinese) [Google Scholar]
  33. Gholami, R.; Higón, D.A.; Hanafizadeh, P.; Emrouznejad, A. Is ICT the Key to Development? J. Glob. Inf. Manag. JGIM 2010, 18, 66–83. [Google Scholar] [CrossRef]
  34. Li, S.; Song, B. Effects Internet Development on Carbon Emissions: An Empirical Study Based on Panel Threshold Model. Ecol. Econ. 2019, 35, 33–36. (In Chinese) [Google Scholar]
  35. Chen, B.; Wang, W. Internet Development, Industrial Agglomeration Structure, and Green Innovation Efficiency. East China Econ. Manag. 2021, 35, 42–56. (In Chinese) [Google Scholar]
  36. Mol, A.P.J. Environmental Governance in the Information Age: The Emergence of Informational Governance. Environ. Plan. C Gov. Policy 2006, 24, 497–514. [Google Scholar] [CrossRef]
  37. Arts, K.; Ioris, A.A.R.; Macleod, C.J.A.; Han, X.; Sripada, S.G.; Braga, J.R.Z.; van der Wal, R. Environmental Communication in the Information Age: Institutional Barriers and Opportunities in the Provision of River Data to the General Public. Environ. Sci. Policy 2016, 55, 47–53. [Google Scholar] [CrossRef] [Green Version]
  38. Johansson, L.; Epitropou, V.; Karatzas, K.; Karppinen, A.; Wanner, L.; Vrochidis, S.; Bassoukos, A.; Kukkonen, J.; Kompatsiaris, I. Fusion of Meteorological and Air Quality Data Extracted from the Web for Personalized Environmental Information Services. Environ. Model. Softw. 2015, 64, 143–155. [Google Scholar] [CrossRef]
  39. Karatzas, K.; Kukkonen, J. (Eds.) Quality of Life Information Services towards a Sustainable Society for the Atmospheric Environment; COST Action: Brussels, Belgium, 2009; ISBN 978-960-6706-20-2. [Google Scholar]
  40. Xu, W.; Zhou, T. Progress of Internet Technology and Optimization and Upgrading of China’s Industrial Structure: Theory and Evidence. Rev. Ind. Econ. 2019, 04, 96–123. (In Chinese) [Google Scholar]
  41. Holl, A. Highways and Productivity in Manufacturing Firms. J. Urban Econ. 2016, 93, 131–151. [Google Scholar] [CrossRef]
  42. Humphrey, J.; Schmitz, H. How Does Insertion in Global Value Chains Affect Upgrading in Industrial Clusters? Reg. Stud. 2002, 36, 1017–1027. [Google Scholar] [CrossRef]
  43. Simonen, J.; Svento, R.; Juutinen, A. Specialization and diversity as drivers of economic growth: Evidence from High-Tech industries. Pap. Reg. Sci. 2015, 94, 229–247. [Google Scholar] [CrossRef]
  44. Tallon, P.P.; Pinsonneault, A. Competing Perspectives on the Link between Strategic Information Technology Alignment and Organizational Agility: Insights from a Mediation Model. MIS Q. 2011, 35, 463–484. [Google Scholar] [CrossRef]
  45. Ceccobelli, M.; Gitto, S.; Mancuso, P. ICT Capital and Labour Productivity Growth: A Non-Parametric Analysis of 14 OECD Countries. Telecommun. Policy 2012, 36, 282–292. [Google Scholar] [CrossRef] [Green Version]
  46. Xie, K.; Wu, Y.; Xiao, J.; Hu, Q. Value Co-Creation between Firms and Customers: The Role of Big Data-Based Cooperative. Assets Inf. Manag. 2016, 53, 1034–1048. [Google Scholar] [CrossRef] [Green Version]
  47. Acemoglu, D.; Restrepo, P. The Race between Man and Machine: Implications of Technology for Growth, Factor Shares, and Employment. Am. Econ. Rev. 2018, 108, 1488–1542. [Google Scholar] [CrossRef] [Green Version]
  48. Acemoglu, D.; Restrepo, P. Robots and Jobs: Evidence from US Labor Markets. Available online: http://papers.ssrn.com/sol3/papers.cfm?abstract_id=2941263 (accessed on 16 August 2021).
  49. Heo, P.S.; Lee, D.H. Evolution of the Linkage Structure of ICT Industry and Its Role in the Economic System: The Case of Korea. Inf. Technol. Dev. 2019, 25, 424–454. [Google Scholar] [CrossRef]
  50. Romer, P.M. Endogenous Technological Change. J. Polit. Econ. 1990, 98, S71–S102. [Google Scholar] [CrossRef] [Green Version]
  51. Ciccone, A.; Papaioannou, E. Human Capital, the Structure of Production, and Growth; C.E.P.R. Discussion Papers; European Central Bank: Frankfurt, Germany, 2005. [Google Scholar]
  52. van Donkelaar, A.; Martin, R.V.; Brauer, M.; Boys, B.L. Use of Satellite Observations for Long-Term Exposure Assessment of Global Concentrations of Fine Particulate Matter. Environ. Health Perspect. 2015, 123, 135–143. [Google Scholar] [CrossRef] [PubMed] [Green Version]
  53. Ye, C.; Ren, Z. The Economic Growth Effect and Structural Transformation Effect of Internet. Nanjing J. Soc. Sci. 2018, 18–29. (In Chinese) [Google Scholar] [CrossRef]
  54. Zhang, Y.; Li, Q. Empirical Analysis of Internet Factors on the Economic Development of Chinese Provinces. J. Shanxi Univ. Financ. Econ. 2008, 6, 38–44. (In Chinese) [Google Scholar]
  55. Lin, G.; Long, Z.; Wu, M. A Spatial Analysis of Regional Economic Convergence in China: 1978–2002. China Econ. Q. 2005, S1, 67–82. (In Chinese) [Google Scholar]
  56. James, L.; Robert, K.P. Introduction to Spatial Econometrics; Chapman and Hall/CRC: London, UK, 2009. [Google Scholar]
  57. Jiao, J.; Wang, J.; Cheng, K. Spatial-Temporal Evolution and Spillover Effects of Regional Innovation Ability in China. J. Econ. Geogr. 2017, 37, 11–18. (In Chinese) [Google Scholar]
Figure 1. The direct effect of Internet development on environmental quality.
Sustainability 13 11308 g001
Figure 2. The mechanism of how the Internet affects the environmental quality through the industrial structure.
Sustainability 13 11308 g002
Table 1. The descriptive statistics of the relevant variables.
ObsMeanStd. Dev.MinMax
pm25424543.2516719.183743.13141110.121
net42450.13032620.16596120.0014443.66348
gdp2424543.259913.7519611.5563101.467
gdp42456.4965471.0271423.3994510.0731
peo42455.7281620.90851771.547567.88666
ins424537.30546 9.0289578.5885.34
fdi42450.02046380.02316292.00 × 10−70.375789
gov42450.15905030.09008520.0312841.48516
energy42456.9692511.2689833.2753611.7224
road42452.1707480.6261965−1.171187.13847
Table 2. Estimates of the fixed effects of OLS and ordinary panel models.
VariablesOLSOrdinary Panel Estimation
Fixed EffectRandom Effect
net−34.75 ***−23.29 ***−11.12 ***−6.985 **−12.34 ***−7.541 ***
(−6.68)(−5.70)(−2.86)(-2.46)(−2.96)(−2.60)
gdp2−0.588 ***0.549 ***−1.103 ***−0.723 ***−1.029 ***−0.736 ***
(−3.52)(3.95)(−5.96)(−3.60)(−5.72)(−3.64)
gdp14.23 ***−7.129 ***11.76 ***8814 ***11.37 ***9379 ***
(6.73)(−3.94)(5.31)(3.33)(5.26)(3.52)
peo 14.45 *** 0.392 9.096 ***
(39.33) (0.41) (9.76)
ins −0.477 *** −0.379 *** −0.384 ***
(−15.63) (−8.46) (−8.74)
fdi −50.03 *** −10.38 −0.960
(−5.44) (−1.08) (-0.10)
gov −6.451 ** 4.519 −2044
(−2.46) (1.40) (−0.59)
energy −1.385 *** −1.782 *** −1.840 ***
(−5.34) (−4.42) (−5.03)
road 5.175 *** 0.128 0.407
(11.23) (0.18) (0.60)
C−19.20 ***4.31616.04 **41.70 ***15.52 **−10.36
(−2.81)(0.65)(2.30)(4.10)(2.21)(−1.03)
n424542454245424542454245
R20.1060.5110.1090.168
Hausman 164.41 ***166.23 ***164.41 ***166.23 ***
Note: ** p < 0.05, *** p < 0.01, the value in the parenthesis is the t-statistic.
Table 3. Moran’s I under each spatial weight matrix for different years.
YearIZPYearIZP
20040.81520.1010.000020120.85721.120.0000
20050.84420.8050.000020130.84120.7530.0000
20060.80819.9510.000020140.82420.330.0000
20070.85921.1840.000020150.8420.720.0000
20080.81320.040.000020160.83420.5740.0000
20090.85721.1320.000020170.82320.2920.0000
20100.85421.0510.000020180.84420.8160.0000
20110.84520.830.0000
Table 4. The estimated result of the baseline regression.
VariablesNo ControlsWith Controls
(1)(2)(3)(4)(5)(6)
Direct
Effect
Direct
Effect
Direct
Effect
SpilloverDirect
Effect
Spillover
ρ 0.662 ***0.646 ***0.558 *** 0.535 ***
(43.20)(40.77)(31.22) (28.87)
net−3908 ***−3868 ***−2433 **9002 ***−2327 **8735 **
(−4.04)(−3.86)(-2.52)(2.67)(−2.32)(2.49)
gdp2−0.213 **−0.151−0.335 ***−1.711 ***−0.346 ***−1781 ***
(−2.03)(−1.40)(−3.03)(−5.72)(−3.04)(-5.75)
gdp−1.2330.5991.78825.40 ***4294 ***23.86 ***
(−0.87)(0.41)(1.17)(6.49)(2.77)(5.89)
peo −1329 *4085 *3895 ***−0.728
(−1.78)(1.68)(5.35)(−0.37)
ins −0.0144 **−0.421 ***−0.014 ***−0.440 ***
(−2.47)(−8.70)(−2.57)(−8.82)
fdi 14.87 **−109.3 ***18.47 ***−116.3 ***
(2.52)(−6.45)(3.03)(−6.71)
gov 6.629 ***−32.00 ***6729 ***−34.24 ***
(2.61)(−5.13)(2.58)(−5.55)
energy −0.0415−0.956 **−0.263−0.710
(−0.17)(−2.18)(−1.05)(−1.57)
road −0.4450.712−0.3290.931
(−1.38)(0.71)(−0.99)(0.91)
C −38.68 *** −61.35 ***
(−4.36) (−3.69)
n424542454245424542454245
R20.23240.23240.368 0.309
EffectFEREFEFERERE
Hausman175.68 *** 254.48 *** 254.48 ***
Note: * p < 0.1, ** p < 0.05, *** p < 0.01, what in the parentheses are z.
Table 5. The estimated results of the Spatial Durbin Model with different weight matrices.
Variables0–1 MatrixThe Geographic MatrixEconomic Geography Matrix
(1)(2)(3)(4)(5)(6)
ρ 0.937 ***0.935 ***0.985 ***0.985 ***0.800 ***0.791 ***
(242.97)(237.39)(258.60)(255.81)(59.80)(57.26)
net−0.711 **−0.640 *−0.694−0.680−1780 **−1683 *
(−1.97)(−1.71)(−0.96)(−0.91)(−2.14)(−1.95)
gdp2−0.0259−0.0387−0.113−0.119−0.0664−0.0760
(−0.60)(−0.88)(−1.32)(−1.35)(−0.67)(−0.74)
gdp0.3001111 *−0.03141382−14660.442
(0.49)(1.80)(−0.03)(1.13)(−1.08)(0.32)
peo−0.3831004 ***−0.4092146 ***−1095 *3187 ***
(−1.26)(3.30)(-0.69)(3.69)(−1.69)(4.99)
ins−0.032 ***−0.0256 **−0.00212−0.01210.003600.00606
(−3.13)(−2.49)(−0.11)(−0.61)(0.17)(0.28)
fdi−3.965−2446−3887−2.29713.11 **16.24 ***
(−1.55)(−0.93)(−0.79)(−0.45)(2.55)(3.05)
gov2027 **1.784 *3045292733523296
(2.17)(1.87)(1.62)(1.52)(1.49)(1.43)
energy−0.0977−0.07910.09780.00330−0.121−0.265
(−1.07)(-0.86)(0.51)(0.02)(−0.57)(−1.24)
road−0.282 **−0.225 *−0.302−0.220−0.333−0.235
(−2.32)(−1.80)(−1.25)(−0.88)(−1.21)(−0.83)
C −6.693 * −39.21 −15.04
(−1.94) (−1.42) (−1.12)
n424542454245424542454245
R20.2610.4580.3240.4330.3160.381
Hausman395.1 *** −172.28484.4 ***
Note: * p < 0.1, ** p < 0.05, *** p < 0.01, what in the parentheses are z.
Table 6. The estimated results of core interpreted variables with different spatial models.
VariablesSpatial EffectSO2
SARSEMNo ControlsWith Controls
ρ 0.676 *** 0.274 ***0.291 ***0.158 ***0.189 ***
(44.57) (8.98)(9.64)(4.77)(5.78)
λ 0.712 ***
(49.85)
net−3815 ***−4146 ***−0.627 ***−0.664 ***−0.443 **−0.466 **
(−4.04)(−4.39)(−3.38)(−3.48)(−2.41)(−2.47)
gdp2−0.256 **−0.206 *0.0354 *0.02750.0375 *0.0453 **
(−2.45)(−1.94)(1.76)(1.35)(1.77)(2.13)
gdp2739 *−0.764−0.0110−0.405−0.305−0.861 ***
(1.95)(-0.52)(−0.04)(−1.47)(−1.05)(−2.98)
peo−1005−1521 ** 0.237 *−0.184 *
(−1.33)(−2.06) (1.66)(−1.71)
ins−0.080 ***−0.0114 −0.033 ***−0.039 ***
(−3.59)(−0.48) (−7.08)(−8.49)
fdi15.11 **26.42 *** −2.142 *−2042 *
(2.53)(4.55) (−1.91)(−1.79)
gov8181 ***7168 *** 0.372−0.218
(3.84)(3.09) (0.77)(−0.45)
energy−0.535 **−0.187 0.196 ***0.352 ***
(−2.35)(−0.75) (4.15)(7.41)
road−0.223−0.443 −0.331 ***−0.238 ***
(−0.69)(−1.39) (−5.39)(−3.80)
C −7.122 *** −3977
(−4.22) (−1.38)
n424542454245424542454245
R20.1920.0810.2010.1960.2400.234
EffectFEFEFEREFERE
Hausman176.1 ***151.4 ***41.70 *** −119.55
Note: * p < 0.1, ** p < 0.05, *** p < 0.01, what in the parentheses are value z.
Table 7. Estimated results of the Spatial Durbin Model with different time periods.
VariablesYear: 2003–2009Year: 2010–2017
Direct
Effect
Direct
Effect
SpilloverDirect
Effect
Direct
Effect
Spillover
ρ 0.326 ***0.300 *** 0.250 ***0.276 ***
(9.41)(8.43) (7.43)(8.35)
net−0.889−0.79312.53−1270−2044 *9320 **
(−0.33)(−0.28)(1.20)(−1.26)(−1.88)(2.22)
gdp21015 ***0.981 ***−3613 ***−1152 ***−1225 ***2524 ***
(4.53)(4.31)(-5.99)(-3.67)(-3.99)(3.41)
gdp−9.928 ***−7.895 ***41.06 ***598413.82 ***−44.60 ***
(−3.86)(−2.90)(5.65)(1.29)(3.13)(−4.36)
peo−1694 ***2459 ***−0.430−6654 **12.99 ***−1983
(−2.58)(3.57)(−0.22)(−2.38)(13.72)(−0.75)
ins−0.0624 *−0.113 ***0.315 ***−0.183 ***−0.0788 *−0.421 ***
(−1.68)(−2.87)(3.71)(−3.73)(−1.90)(−4.61)
fdi966210.36−103.3 ***−11.75−719773.56 **
(1.28)(1.29)(−4.34)(−1.03)(−0.60)(2.02)
gov8374139114.3938835584 *−34.74 ***
(1.54)(0.25)(1.44)(1.30)(1.80)(−3.30)
energy−0.329−0.674 *2867 ***0.4440.282−1209 **
(−0.83)(−1.69)(2.88)(1.34)(0.83)(−2.24)
road−0.823 **−0.779 *0.223−0.8460.5731437
(−2.09)(−1.84)(0.16)(−1.44)(0.95)(0.84)
C −103.7 *** 140.3 ***
(−4.64) (4.04)
n198119811981226422642264
R20.0050.244 0.1020.438
EffectFEREREFERERE
Hausman −200.61 −46.13
Note: * p < 0.1, ** p < 0.05, *** p < 0.01, what in the parentheses is z.
Table 8. The estimated results of Spatial Durbin Model for different regions.
VariablesEastCentralWestNortheast
ρ 0.584 ***0.571 ***0.644 ***0.619 ***0.647 ***0.642 ***0.713 ***0.701 ***
(17.58)(16.82)(23.41)(21.40)(21.53)(21.21)(22.24)(21.09)
net−1741 *−1969 **2.7554.118−2809−2718−3140−4155
(−1.84)(−2.01)(0.65)(0.94)(−1.11)(−1.05)(−1.06)(−1.39)
gdp20.04940.0230−0.799 ***−0.744 ***−0.991 ***−1033 ***1135 ***0.806 ***
(0.26)(0.12)−3.26)(−2.93)(−4.87)(−5.07)(5.00)(3.78)
gdp1896384936126591 *14.19 ***13.97 ***−12.46 ***−10.52 ***
(0.64)(1.26)(1.10)(1.95)(5.16)(5.28)(−4.08)(−3.68)
n130513051200120012301230510510
R20.4910.4870.5740.4080.2480.4770.3670.751
EffectFEREFEREFEREFERE
Hausman −14.9224.47 *** 3.20 11.49
Note: * p < 0.1, ** p < 0.05, *** p < 0.01, what in the parentheses is the value z; what in the table is the estimate results only for the core explanatory variables.
Table 9. The mediating effects of industrial structure upgrading on urban environment quality.
VariablesSDMSAR
PM2.5INSPM2.5PM2.5INSPM2.5
ρ 0.613 ***0.402 ***0.558 ***0.692 ***0.539 ***0.676 ***
(37.13)(18.18)(31.22)(48.15)(28.89)(44.57)
Net−3136 ***1124 *−2433 **−4312 ***4451 ***−3815 ***
(−3.25)(1.58)(−2.52)(−4.61)(7.21)(−4.04)
Ins −0.0144 ** −0.080 ***
(−2.47) (−3.59)
Control variablesYesYesYesYesYesYes
n424542454245424542454245
R20.32780.4350.36830.14140.1650.192
Note: * p < 0.1, ** p < 0.05, *** p < 0.01, what is in the parenthesis are the value z; what is in the table are just the estimated results of the core explanatory variables.
Table 10. The results of the threshold regression.
VariablesThresholdThe Industrial Structure <48.64The Industrial Structure
>48.64
net48.64 **−11.13 ***−4956 **
(−4.09)(−1.92)
n424542454245
Note: ** p < 0.05, *** p < 0.01, what in the parentheses are z.
Publisher’s Note: MDPI stays neutral with regard to jurisdictional claims in published maps and institutional affiliations.

