
UAV-Based Bridge Inspection via Transfer Learning

Abstract
:1. Introduction
- How can drone-based bridge inspection benefit from the CNN models via transfer learning?
- How much do heterogeneities and noises between training and testing datasets affect the CNN models via transfer learning?
- How much transfer learning must be used?
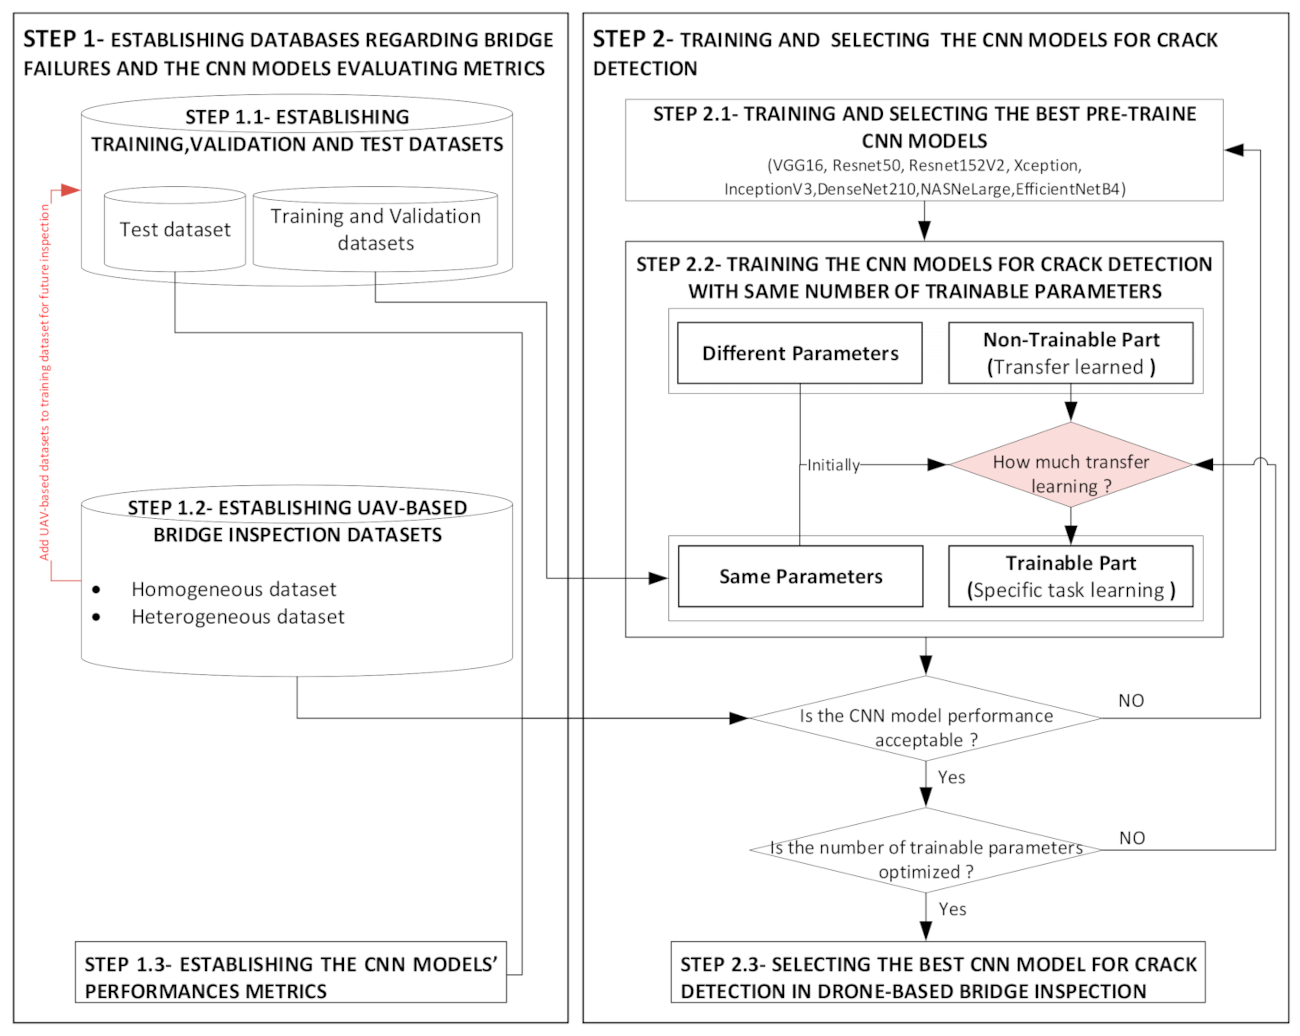
2. Methodology
- STEP 1-Establishing Databases Regarding Bridge Failures and the CNN Model’s Evaluating Metrics
- STEP 1.1-Establishing Training, Validation, and Test Datasets
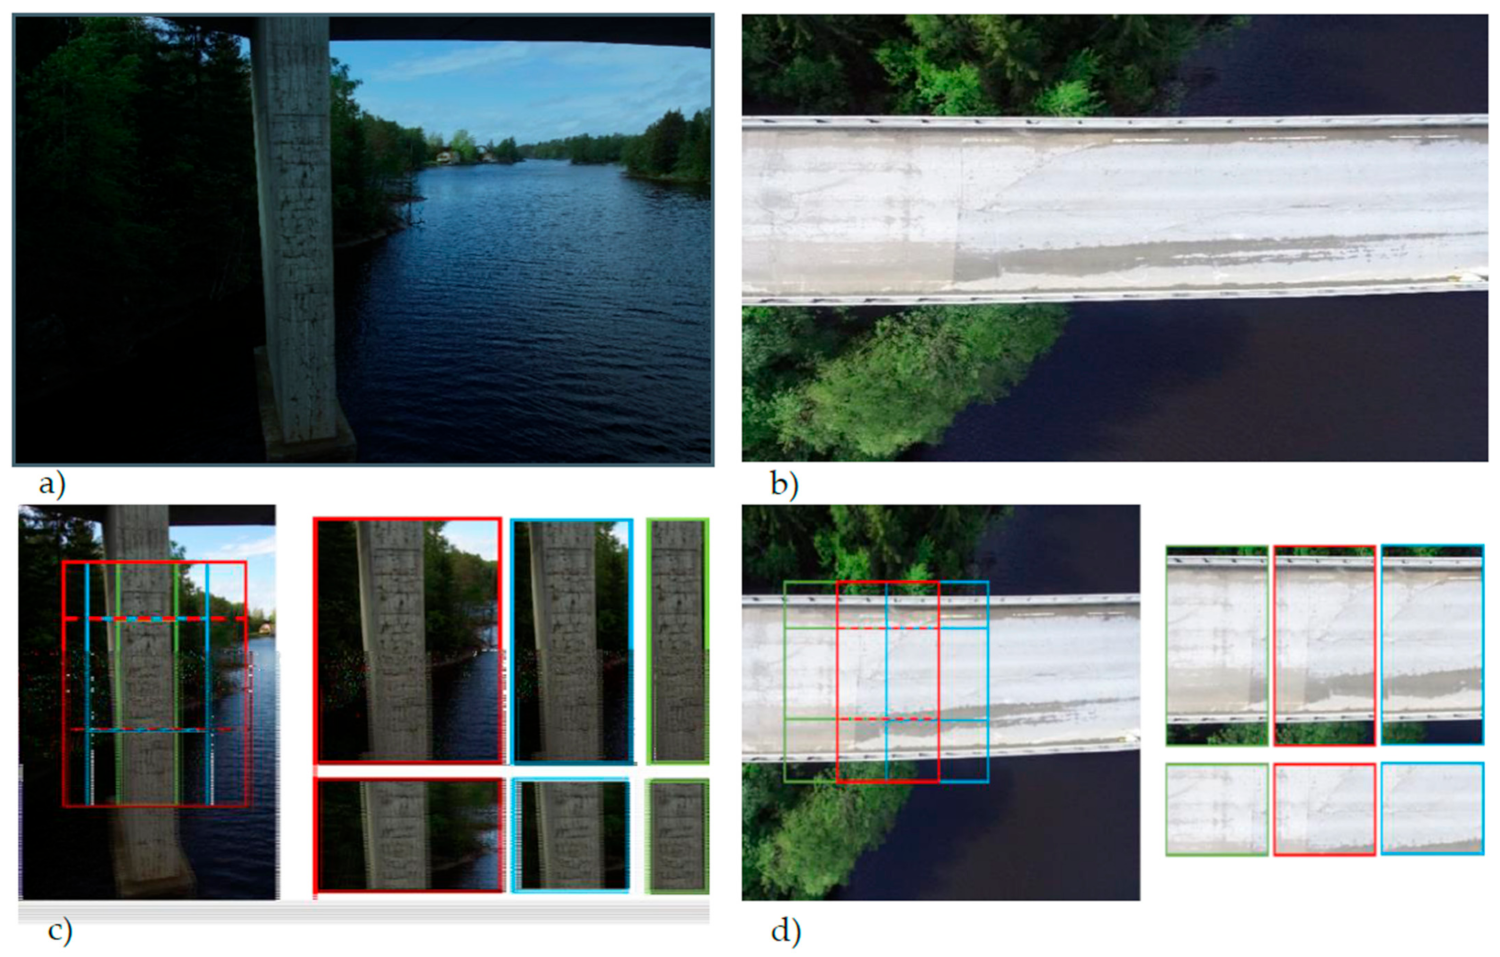
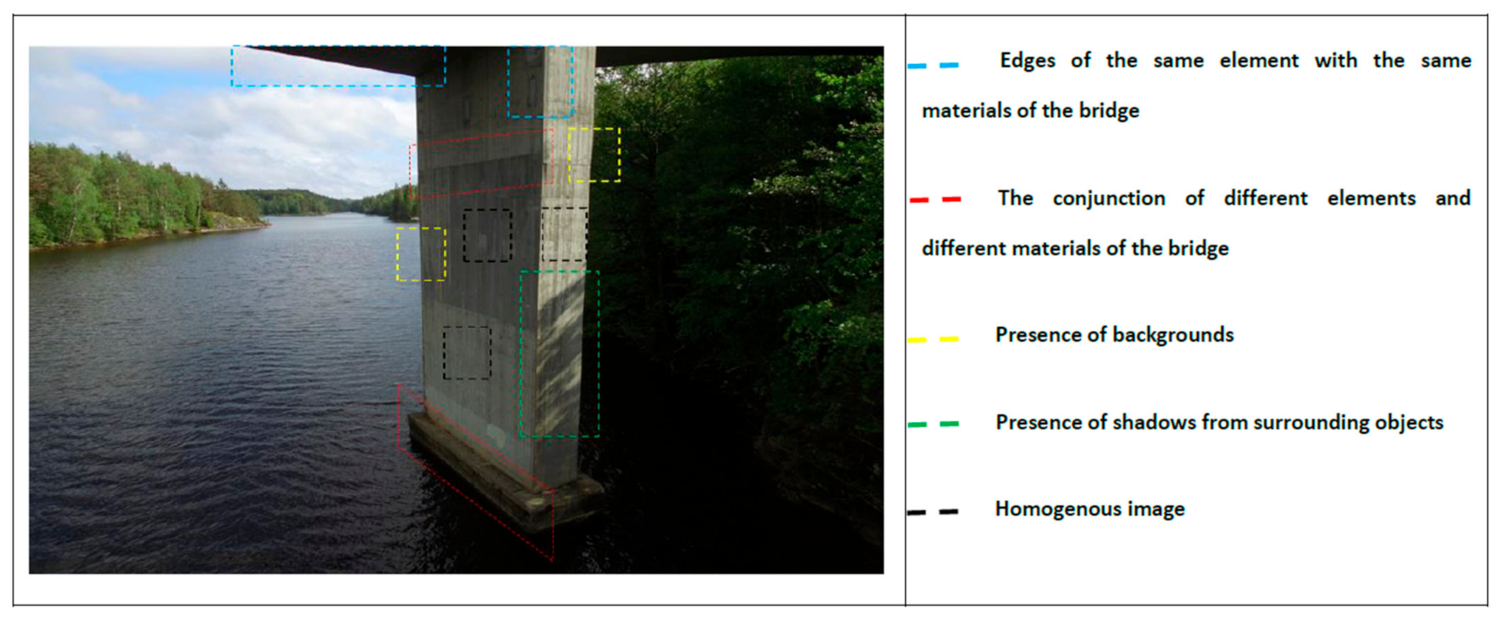
- STEP 1.2-Establishing UAV-Based Bridge Inspection Datasets
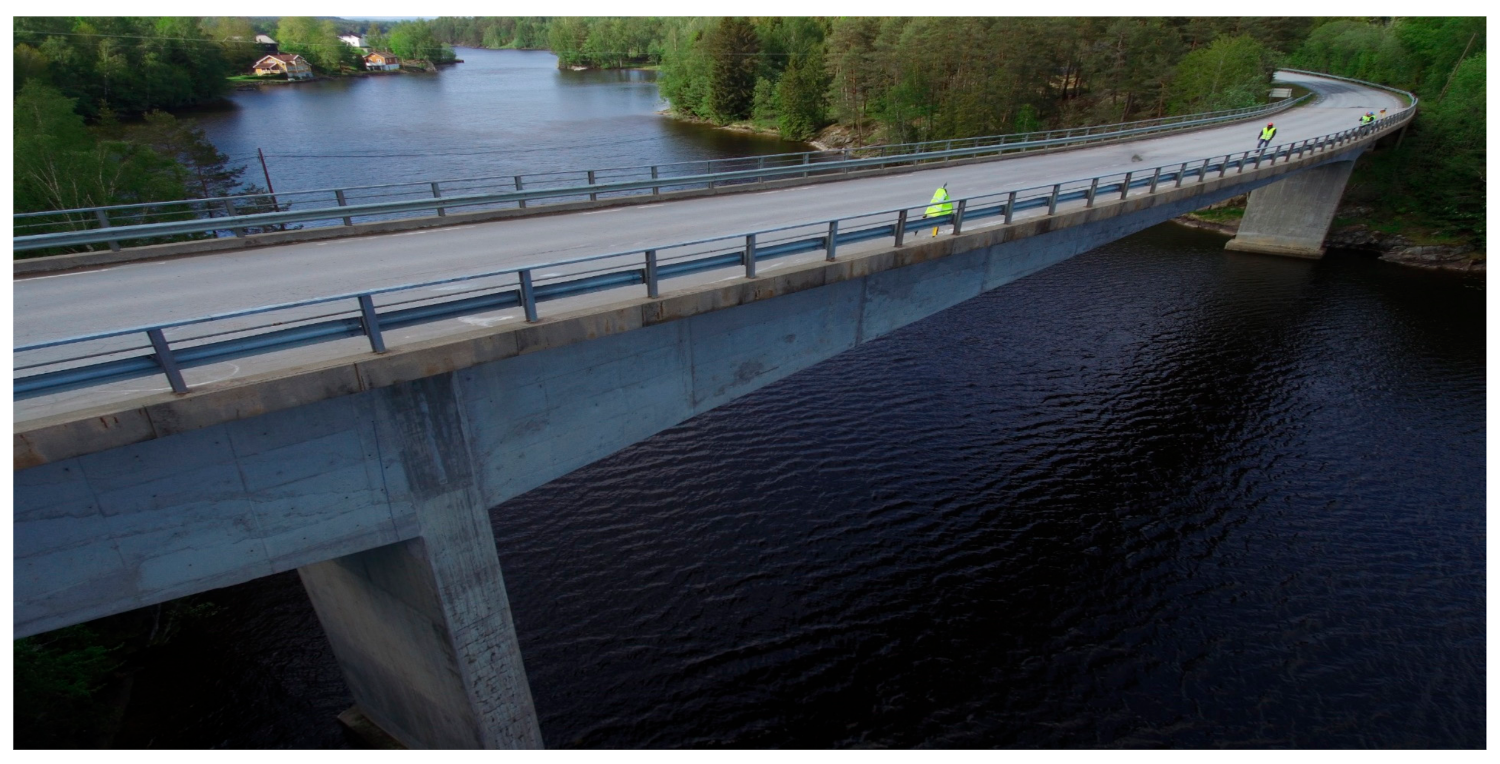
- STEP 1.2.1-Conducting UAV-Based Bridge Inspection
- STEP 1.3-The CNN Models’ Performance Metrics
- STEP 2-Selecting and Training the CNN Models for Crack Detection
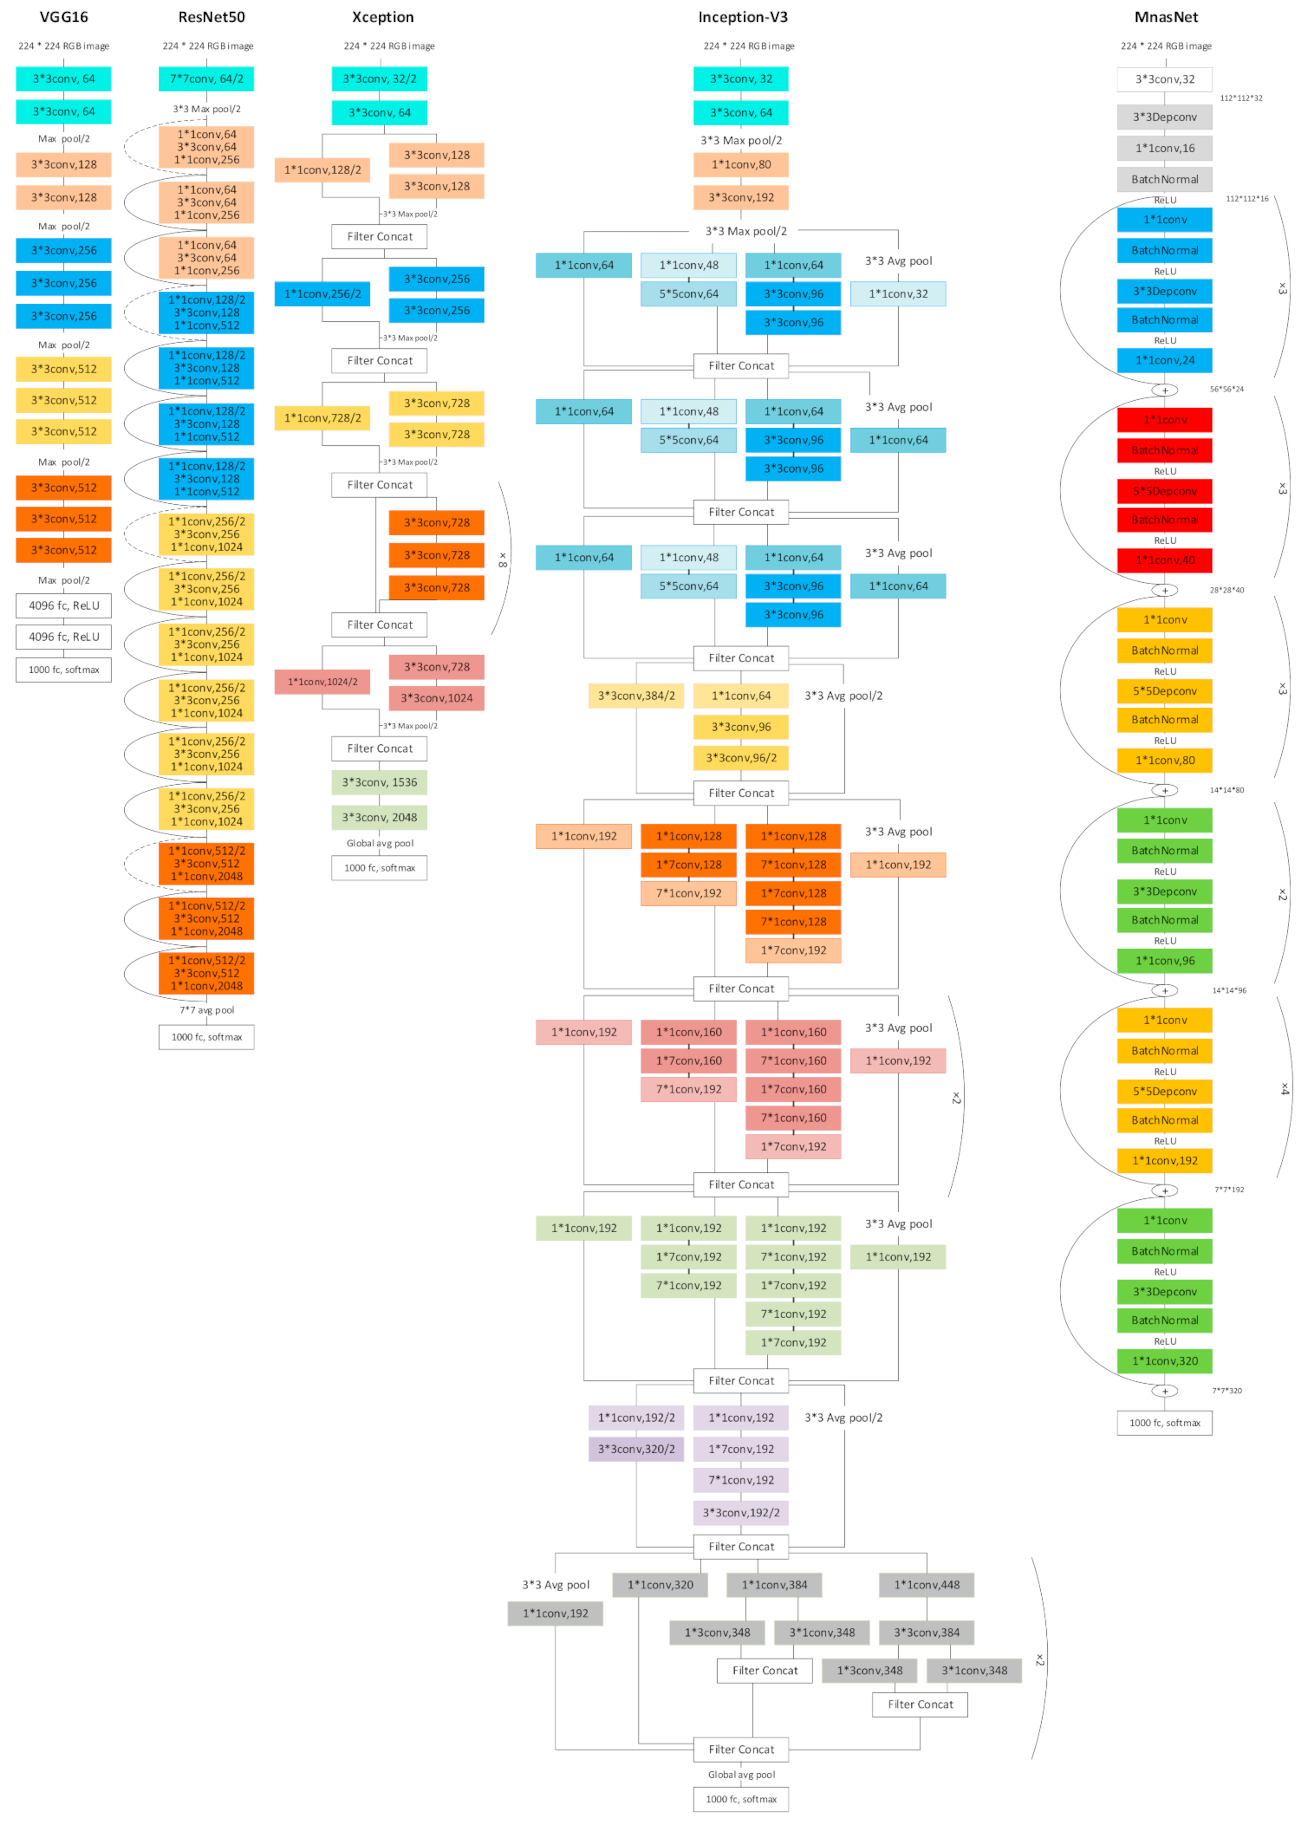
- STEP 2.1-Selecting the CNN Models
- STEP 2.2-Training the CNN Models
- STEP 2.2.1-The Performance of the CNN Models on the Sdnet2018 Test Dataset
- STEP 2.2.2-The Performance of the CNN Models on the UAV-Based Bridge Inspection Datasets
- STEP 2.3-Select the Best Model for Future Inspections
3. Results
3.1. The Effects of Transfer Learning
3.2. The Effects of Transfer Learning and Heterogeneities
3.3. Selecting the Optimized Amount of Transfer Learning
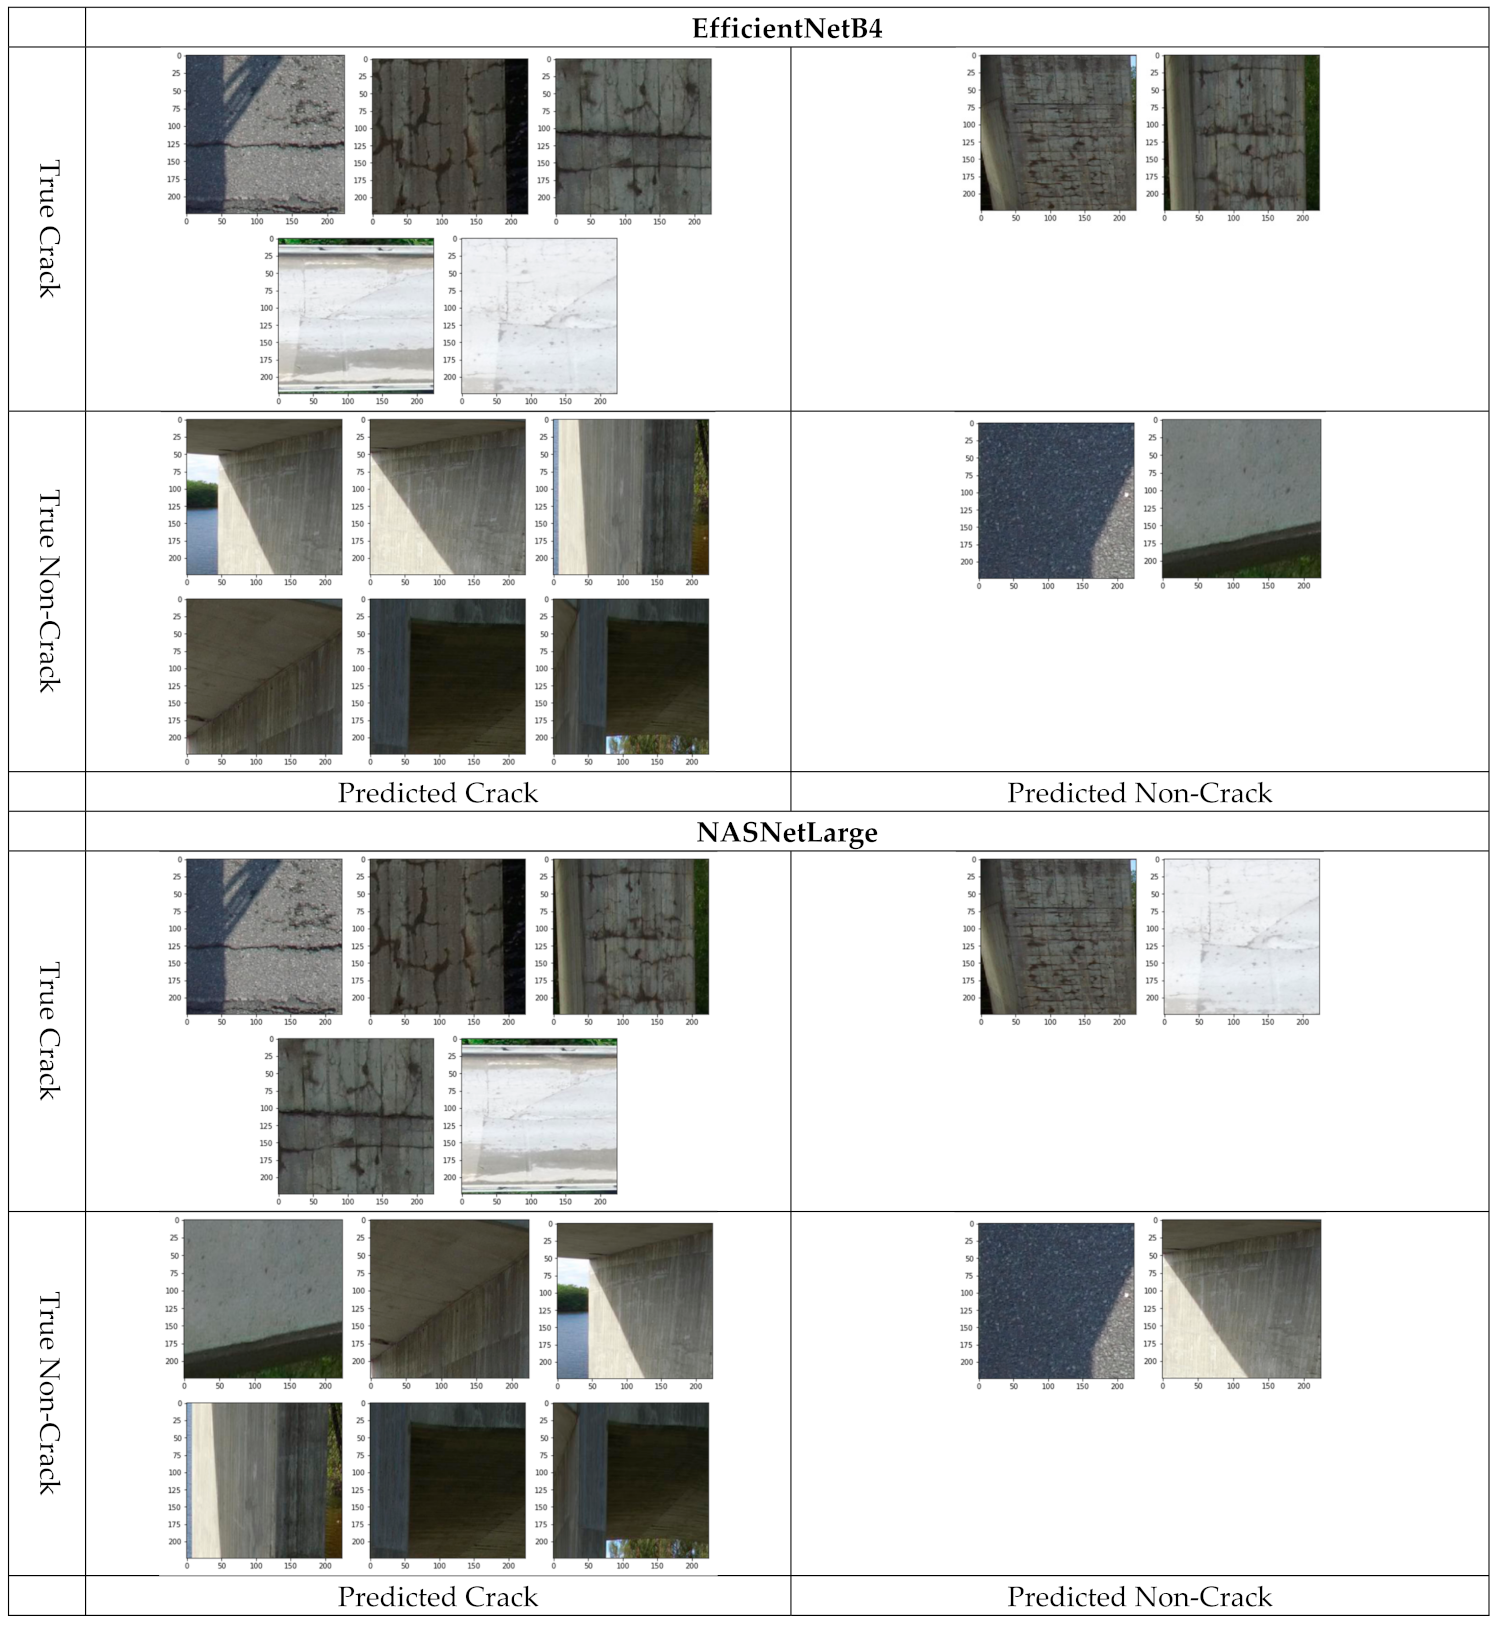
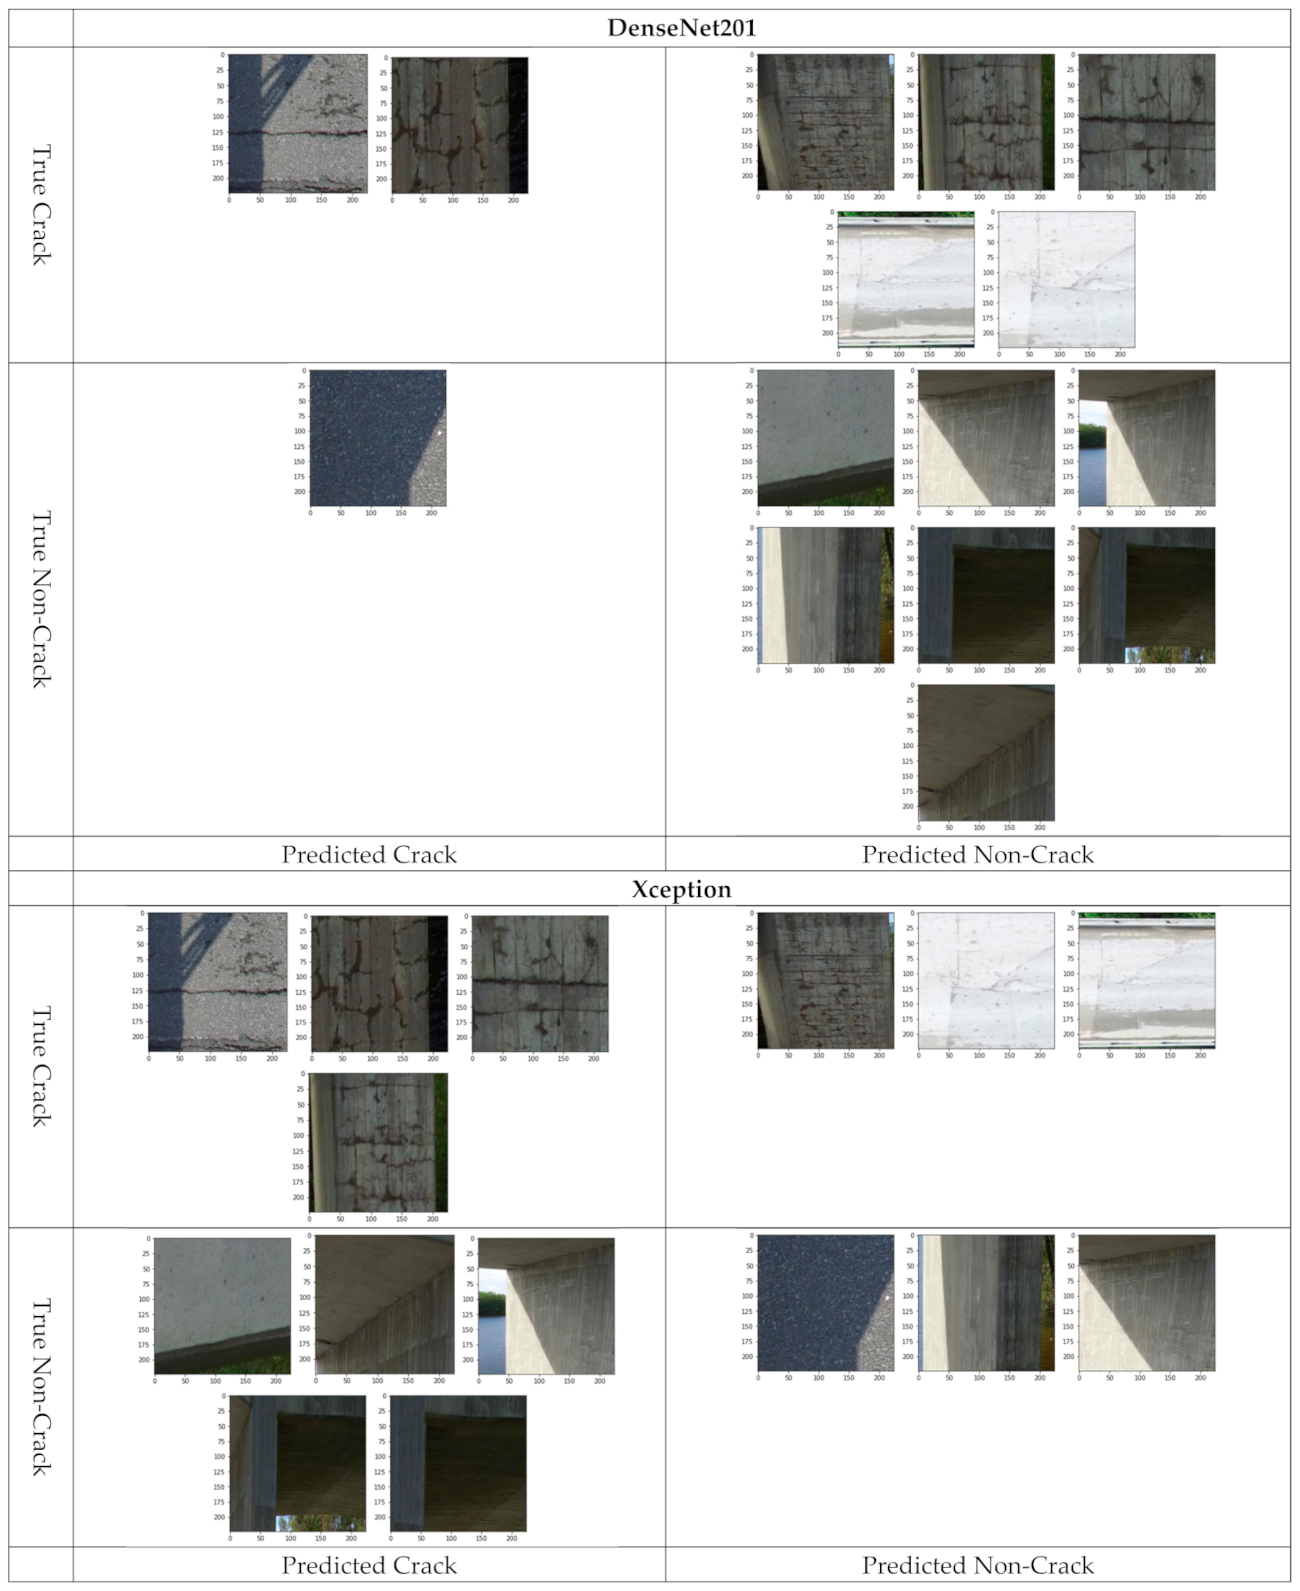
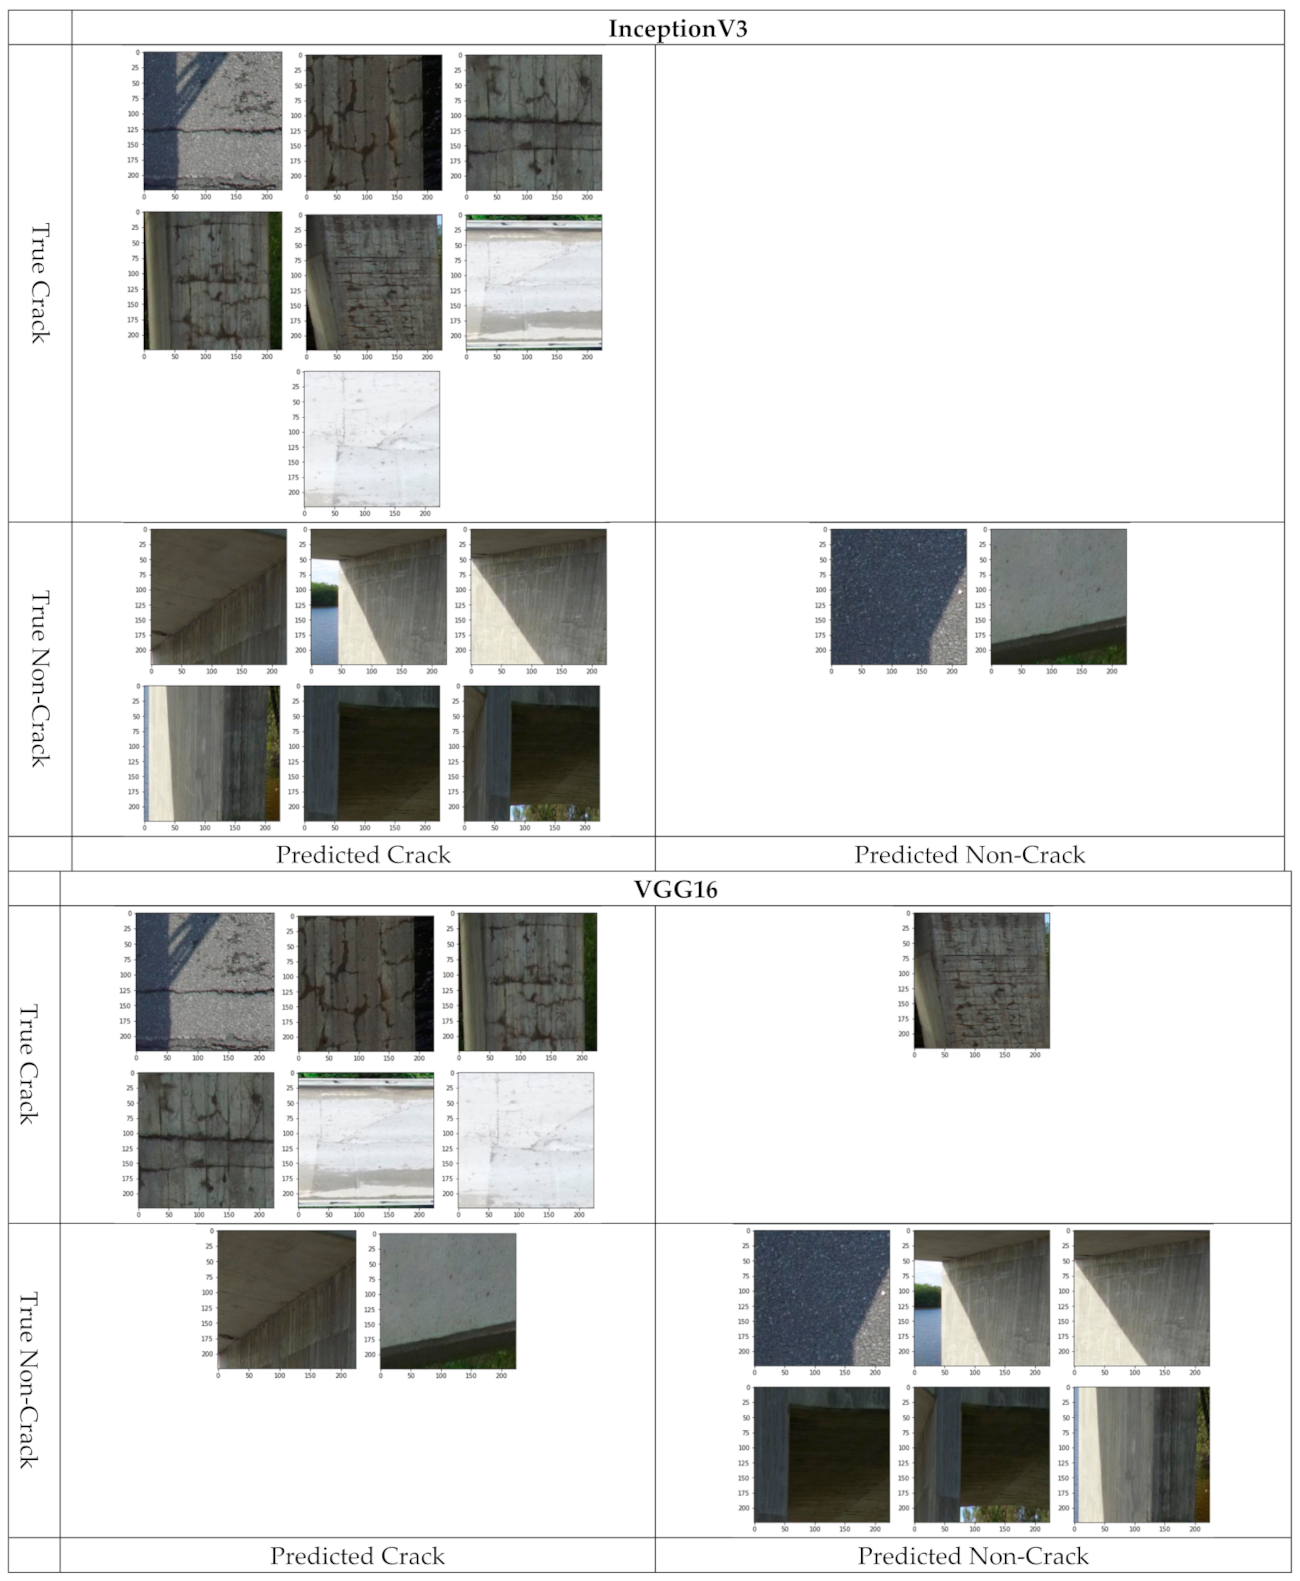
3.4. Visualizing the Performance of the CNN Models
4. Discussion
- How can drone-based bridge inspection benefit from the CNN models via transfer learning?
- How much do heterogeneities and noises between training and testing datasets affect CNN models via transfer learning?
- How much transfer learning must be used?
5. Conclusions
Author Contributions
Funding
Institutional Review Board Statement
Informed Consent Statement
Data Availability Statement
Conflicts of Interest
Appendix A

Appendix B

| Model | Precision | Recall | F1-Score | Support | |
|---|---|---|---|---|---|
| VGG16 | Cracked | 0.98 | 0.92 | 0.95 | 848 |
| Non-cracked | 0.94 | 0.98 | 0.96 | 1054 | |
| Macro avg | 0.96 | 0.96 | 0.96 | 1902 | |
| Weighted avg | 0.96 | 0.96 | 0.96 | 1902 | |
| Resnet50 | Cracked | 0.98 | 0.93 | 0.96 | 848 |
| Non-cracked | 0.94 | 0.99 | 0.97 | 1054 | |
| Macro avg | 0.96 | 0.96 | 0.96 | 1902 | |
| Weighted avg | 0.96 | 0.96 | 0.96 | 1902 | |
| Resnet152v2 | Cracked | 0.97 | 0.75 | 0.85 | 848 |
| Non-cracked | 0.83 | 0.98 | 0.9 | 1054 | |
| Macro avg | 0.9 | 0.87 | 0.87 | 1902 | |
| Weighted avg | 0.89 | 0.88 | 0.87 | 1902 | |
| Xception | Cracked | 0.94 | 0.92 | 0.93 | 848 |
| Non-cracked | 0.94 | 0.96 | 0.95 | 1054 | |
| Macro avg | 0.94 | 0.94 | 0.94 | 1902 | |
| Weighted avg | 0.94 | 0.94 | 0.94 | 1902 | |
| InceptionV3 | Cracked | 0.93 | 0.85 | 0.89 | 848 |
| Non-cracked | 0.89 | 0.95 | 0.92 | 1054 | |
| Macro avg | 0.91 | 0.9 | 0.9 | 1902 | |
| Weighted avg | 0.91 | 0.9 | 0.9 | 1902 | |
| DenseNet201 | Cracked | 0.98 | 0.94 | 0.96 | 848 |
| Non-cracked | 0.95 | 0.99 | 0.97 | 1054 | |
| Macro avg | 0.97 | 0.96 | 0.97 | 1902 | |
| Weighted avg | 0.97 | 0.97 | 0.97 | 1902 | |
| NASNetLarge | Cracked | 0.94 | 0.82 | 0.88 | 848 |
| Non-cracked | 0.87 | 0.96 | 0.91 | 1054 | |
| Macro avg | 0.9 | 0.89 | 0.89 | 1902 | |
| Weighted avg | 0.9 | 0.9 | 0.9 | 1902 | |
| EfficientNetB4 | Cracked | 0.98 | 0.94 | 0.96 | 848 |
| Non-cracked | 0.95 | 0.98 | 0.97 | 1054 | |
| Macro avg | 0.97 | 0.96 | 0.96 | 1902 | |
| Weighted avg | 0.96 | 0.96 | 0.96 | 1902 |
| Model | Precision | Recall | F1-Score | Support | |
|---|---|---|---|---|---|
| VGG16 | Cracked | 0.64 | 0.9 | 0.75 | 154 |
| Non-cracked | 0.83 | 0.49 | 0.61 | 154 | |
| Macro avg | 0.74 | 0.69 | 0.68 | 308 | |
| Weighted avg | 0.74 | 0.69 | 0.68 | 308 | |
| Resnet50 | Cracked | 0.6 | 0.75 | 0.67 | 154 |
| Non-cracked | 0.67 | 0.51 | 0.58 | 154 | |
| Macro avg | 0.63 | 0.63 | 0.62 | 308 | |
| Weighted avg | 0.63 | 0.63 | 0.62 | 308 | |
| Resnet152v2 | Cracked | 0.71 | 0.66 | 0.68 | 154 |
| Non-cracked | 0.68 | 0.73 | 0.71 | 154 | |
| Macro avg | 0.70 | 0.69 | 0.69 | 308 | |
| Weighted avg | 0.70 | 0.69 | 0.69 | 308 | |
| Xception | Cracked | 0.57 | 0.88 | 0.69 | 154 |
| Non-cracked | 0.73 | 0.33 | 0.46 | 154 | |
| Macro avg | 0.65 | 0.60 | 0.57 | 308 | |
| Weighted avg | 0.65 | 0.60 | 0.57 | 308 | |
| InceptionV3 | Cracked | 0.56 | 0.56 | 0.56 | 154 |
| Non-cracked | 0.56 | 0.56 | 0.56 | 154 | |
| Macro avg | 0.56 | 0.56 | 0.56 | 308 | |
| Weighted avg | 0.56 | 0.56 | 0.56 | 308 | |
| DenseNet201 | Cracked | 0.55 | 0.75 | 0.64 | 154 |
| Non-cracked | 0.61 | 0.39 | 0.48 | 154 | |
| Macro avg | 0.58 | 0.57 | 0.56 | 308 | |
| Weighted avg | 0.58 | 0.57 | 0.56 | 308 | |
| NASNetLarge | Cracked | 0.62 | 0.59 | 0.60 | 154 |
| Non-cracked | 0.61 | 0.64 | 0.62 | 154 | |
| Macro avg | 0.61 | 0.61 | 0.61 | 308 | |
| Weighted avg | 0.61 | 0.61 | 0.61 | 308 | |
| EfficientNetB4 | Cracked | 0.51 | 0.75 | 0.61 | 154 |
| Non-cracked | 0.53 | 0.27 | 0.36 | 154 | |
| Macro avg | 0.52 | 0.51 | 0.48 | 308 | |
| Weighted avg | 0.52 | 0.51 | 0.48 | 308 |
| Model | Precision | Recall | F1-Score | Support | |
|---|---|---|---|---|---|
| VGG16 | Cracked | 0.64 | 0.85 | 0.73 | 200 |
| Non-cracked | 0.77 | 0.52 | 0.62 | 200 | |
| Macro avg | 0.71 | 0.68 | 0.67 | 400 | |
| Weighted avg | 0.71 | 0.68 | 0.67 | 400 | |
| Resnet50 | Cracked | 0.65 | 0.86 | 0.74 | 200 |
| Non-cracked | 0.80 | 0.53 | 0.64 | 200 | |
| Macro avg | 0.72 | 0.70 | 0.69 | 400 | |
| Weighted avg | 0.72 | 0.70 | 0.69 | 400 | |
| Resnet152v2 | Cracked | 0.75 | 0.57 | 0.65 | 200 |
| Non-cracked | 0.65 | 0.81 | 0.72 | 200 | |
| Macro avg | 0.70 | 0.69 | 0.68 | 400 | |
| Weighted avg | 0.70 | 0.69 | 0.68 | 400 | |
| Xception | Cracked | 0.72 | 0.8 | 0.76 | 200 |
| Non-cracked | 0.78 | 0.69 | 0.73 | 200 | |
| Macro avg | 0.75 | 0.74 | 0.74 | 400 | |
| Weighted avg | 0.75 | 0.74 | 0.74 | 400 | |
| InceptionV3 | Cracked | 0.62 | 0.46 | 0.53 | 200 |
| Non-cracked | 0.57 | 0.72 | 0.64 | 200 | |
| Macro avg | 0.60 | 0.59 | 0.58 | 400 | |
| Weighted avg | 0.60 | 0.59 | 0.58 | 400 | |
| DenseNet201 | Cracked | 0.6 | 0.88 | 0.72 | 200 |
| Non-cracked | 0.78 | 0.42 | 0.55 | 200 | |
| Macro avg | 0.69 | 0.65 | 0.63 | 400 | |
| Weighted avg | 0.69 | 0.65 | 0.63 | 400 | |
| NASNetLarge | Cracked | 0.66 | 0.51 | 0.57 | 200 |
| Non-cracked | 0.6 | 0.74 | 0.66 | 200 | |
| Macro avg | 0.63 | 0.62 | 0.62 | 400 | |
| Weighted avg | 0.63 | 0.62 | 0.62 | 400 | |
| EfficientNetB4 | Cracked | 0.55 | 0.81 | 0.66 | 200 |
| Non-cracked | 0.65 | 0.35 | 0.45 | 200 | |
| Macro avg | 0.60 | 0.58 | 0.56 | 400 | |
| Weighted avg | 0.60 | 0.58 | 0.56 | 400 |
Appendix C
| Prediction | Precision | Recall | f1-Score | |
|---|---|---|---|---|
| 1 | Crack | 0.75 | 0.58 | 0.66 |
| Non-crack | 0.66 | 0.81 | 0.73 | |
| Accuracy | 0.69 | |||
| Weighted avg | 0.71 | 0.69 | 0.69 | |
| 2 | Crack | 0.73 | 0.57 | 0.64 |
| Non-crack | 0.65 | 0.79 | 0.71 | |
| Accuracy | 0.68 | |||
| Weighted avg | 0.69 | 0.68 | 0.68 | |
| 3 | Crack | 0.76 | 0.56 | 0.65 |
| Non-crack | 0.65 | 0.82 | 0.73 | |
| Accuracy | 0.69 | |||
| Weighted avg | 0.71 | 0.69 | 0.69 | |
| 4 | Crack | 0.75 | 0.57 | 0.65 |
| Non-crack | 0.66 | 0.81 | 0.72 | |
| Accuracy | 0.69 | |||
| Weighted avg | 0.7 | 0.69 | 0.69 | |
| 5 | Crack | 0.76 | 0.56 | 0.65 |
| Non-crack | 0.65 | 0.82 | 0.73 | |
| Accuracy | 0.69 | |||
| Weighted avg | 0.71 | 0.69 | 0.69 | |
| 6 | Crack | 0.72 | 0.54 | 0.62 |
| Non-crack | 0.63 | 0.79 | 0.7 | |
| Accuracy | 0.67 | |||
| Weighted avg | 0.68 | 0.67 | 0.66 | |
| 7 | Crack | 0.76 | 0.56 | 0.65 |
| Non-crack | 0.65 | 0.82 | 0.73 | |
| Accuracy | 0.69 | |||
| Weighted avg | 0.71 | 0.69 | 0.69 | |
| 8 | Crack | 0.76 | 0.58 | 0.66 |
| Non-crack | 0.66 | 0.81 | 0.73 | |
| Accuracy | 0.7 | |||
| Weighted avg | 0.71 | 0.7 | 0.7 | |
| 9 | Crack | 0.75 | 0.56 | 0.64 |
| Non-crack | 0.65 | 0.81 | 0.72 | |
| Accuracy | 0.69 | |||
| Weighted avg | 0.7 | 0.69 | 0.68 | |
| 10 | Crack | 0.75 | 0.55 | 0.63 |
| Non-crack | 0.64 | 0.82 | 0.72 | |
| Accuracy | 0.68 | |||
| Weighted avg | 0.7 | 0.68 | 0.68 | |
| Standard deviations | crack | 0.013703 | 0.012517 | 0.012693 |
| non crack | 0.009428 | 0.011547 | 0.010328 | |
| Variance | crack | 0.000188 | 0.000157 | 0.000161 |
| non crack | 0.000089 | 0.000133 | 0.000107 | |
| Standard deviations | Weighted avg | 0.010328 | 0.008233 | 0.010801 |
| Accuracy | 0.008233 | |||
| Variance | Weighted avg | 0.000107 | 0.000068 | 0.000117 |
Appendix D


References
- Ayele, Y. Drones for inspecting aging bridges. In Proceedings of the International Conference on Natural Hazards and Infrastructure, Chania, Crete Island, Greece, 23–26 June 2019; pp. 23–26. [Google Scholar]
- Ayele, Y.Z.; Droguett, E.L. Application of UAVs for bridge inspection and resilience assessment. In Proceedings of the 29th European Safety and Reliability Conference, Hannover, Germany, 22–26 September 2019; pp. 22–26. [Google Scholar]
- Puri, A. A Survey of Unmanned Aerial Vehicles (UAV) for Traffic Surveillance; Department of Computer Science and Engineering, University of South Florida: Tampa, FL, USA, 2005; pp. 1–29. [Google Scholar]
- Haddal, C.C.; Gertler, J. Homeland Security: Unmanned Aerial Vehicles and Border Surveillance; Congressional Research Service: Washington, DC, USA, 2010. [Google Scholar]
- Aliyari, M.; Ashrafi, B.; Ayele, Y.Z. Hazards identification and risk assessment for UAV–assisted bridge inspections. Struct. Infrastruct. Eng. 2020, 1–17. [Google Scholar] [CrossRef]
- Metni, N.; Hamel, T. A UAV for bridge inspection: Visual servoing control law with orientation limits. Autom. Constr. 2007, 17, 3–10. [Google Scholar] [CrossRef]
- Chen, S.; Laefer, D.F.; Mangina, E.; Zolanvari, S.I.; Byrne, J. UAV bridge inspection through evaluated 3D reconstructions. J. Bridge Eng. 2019, 24, 05019001. [Google Scholar] [CrossRef] [Green Version]
- Achuthan, K.; Hay, N.; Aliyari, M.; Ayele, Y.Z. A Digital Information Model Framework for UAS-Enabled Bridge Inspection. Energies 2021, 14, 6017. [Google Scholar] [CrossRef]
- Landstrom, A.; Thurley, M.J. Morphology-based crack detection for steel slabs. IEEE J. Sel. Top. Signal Process. 2012, 6, 866–875. [Google Scholar] [CrossRef] [Green Version]
- Gehri, N.; Mata-Falcón, J.; Kaufmann, W. Automated crack detection and measurement based on digital image correlation. Constr. Build. Mater. 2020, 256, 119383. [Google Scholar] [CrossRef]
- Nigam, R.; Singh, S.K. Crack detection in a beam using wavelet transform and photographic measurements. Structures 2020, 25, 436–447. [Google Scholar] [CrossRef]
- Shi, Y.; Cui, L.; Qi, Z.; Meng, F.; Chen, Z. Automatic road crack detection using random structured forests. IEEE Trans. Intell. Transp. Syst. 2016, 17, 3434–3445. [Google Scholar] [CrossRef]
- Peng, L.; Chao, W.; Shuangmiao, L.; Baocai, F. Research on crack detection method of airport runway based on twice-threshold segmentation. In Proceedings of the 2015 5th International Conference on Instrumentation and Measurement, Computer, Communication and Control (IMCCC), Qinhuangdao, China, 18–20 September 2015; pp. 1716–1720. [Google Scholar]
- Fujita, Y.; Mitani, Y.; Hamamoto, Y. A method for crack detection on a concrete structure. In Proceedings of the 18th International Conference on Pattern Recognition (ICPR’06), Hong Kong, China, 20–24 August 2006; IEEE: Piscataway, NJ, USA, 2006; Volume 3, pp. 901–904. [Google Scholar]
- Mandal, V.; Uong, L.; Adu-Gyamfi, Y. Automated road crack detection using deep convolutional neural networks. In Proceedings of the 2018 IEEE International Conference on Big Data (Big Data), Seattle, WA, USA, 10–13 December 2018; pp. 5212–5215. [Google Scholar]
- Salman, M.; Mathavan, S.; Kamal, K.; Rahman, M. Pavement Crack Detection Using the Gabor Filter. In Proceedings of the 16th International IEEE Conference on Intelligent Transportation Systems (ITSC 2013), Hague, The Netherlands, 6–9 October 2013. [Google Scholar]
- Li, S.; Zhao, X. Image-based concrete crack detection using convolutional neural network and exhaustive search technique. Adv. Civ. Eng. 2019, 2019. [Google Scholar] [CrossRef] [Green Version]
- Mei, Q.; Gül, M.; Azim, M.R. Densely connected deep neural network considering connectivity of pixels for automatic crack detection. Autom. Constr. 2020, 110, 103018. [Google Scholar] [CrossRef]
- Liu, Y.; Yao, J.; Lu, X.; Xie, R.; Li, L. DeepCrack: A deep hierarchical feature learning architecture for crack segmentation. Neurocomputing 2019, 338, 139–153. [Google Scholar] [CrossRef]
- Ayele, Y.Z.; Aliyari, M.; Griffiths, D.; Droguett, E.L. Automatic Crack Segmentation for UAV-Assisted Bridge Inspection. Energies 2020, 13, 6250. [Google Scholar] [CrossRef]
- Huang, Z.; Pan, Z.; Lei, B. Transfer Learning with Deep Convolutional Neural Network for SAR Target Classification with Limited Labeled Data. Remote Sens. 2017, 9, 907. [Google Scholar] [CrossRef] [Green Version]
- Kaya, A.; Keceli, A.S.; Catal, C.; Yalic, H.Y.; Temucin, H.; Tekinerdogan, B. Analysis of transfer learning for deep neural network based plant classification models. Comput. Electron. Agric. 2019, 158, 20–29. [Google Scholar] [CrossRef]
- Sevakula, R.K.; Singh, V.; Verma, N.K.; Kumar, C.; Cui, Y. Transfer learning for molecular cancer classification using deep neural networks. IEEE/ACM Trans. Comput. Biol. Bioinform. 2018, 16, 2089–2100. [Google Scholar] [CrossRef] [PubMed]
- Gopalakrishnan, K.; Khaitan, S.K.; Choudhary, A.; Agrawal, A. Deep Convolutional Neural Networks with transfer learning for computer vision-based data-driven pavement distress detection. Constr. Build. Mater. 2017, 157, 322–330. [Google Scholar] [CrossRef]
- Dung, C.V.; Anh, L. Autonomous concrete crack detection using deep fully convolutional neural network. Autom. Constr. 2019, 99, 52–58. [Google Scholar] [CrossRef]
- Russakovsky, O.; Deng, J.; Su, H.; Krause, J.; Satheesh, S.; Ma, S.; Huang, Z.; Karpathy, A.; Khola, A.; Bernstein, M.; et al. ImageNet Large Scale Visual Recognition Challenge. Int. J. Comput. Vis. 2015, 115, 211–252. [Google Scholar] [CrossRef] [Green Version]
- Dorafshan, S.; Thomas, R.; Maguire, M. SDNET2018: An annotated image dataset for non-contact concrete crack detection using deep convolutional neural networks. Data Brief 2018, 21. [Google Scholar] [CrossRef] [PubMed]
- Krizhevsky, A.; Sutskever, I.; Hinton, G.E. Imagenet classification with deep convolutional neural networks. Adv. Neural Inf. Process. Syst. 2012, 25, 1097–1105. [Google Scholar] [CrossRef]
- Zeiler, M.D.; Fergus, R. Visualizing and understanding convolutional networks. In Computer Vision—ECCV 2014, Proceedings of the 13th European Conference on Computer Vision, Zurich, Switzerland, 6–12 September 2014; Springer: Berlin/Heidelberg, Germany, 2014; pp. 818–833. [Google Scholar]
- Simonyan, K.; Zisserman, A. Very deep convolutional networks for large-scale image recognition. arXiv 2014, arXiv:1409.1556. [Google Scholar]
- Szegedy, C.; Liu, W.; Jia, Y.; Sermanet, P.; Reed, S.; Anguelov, D.; Erhan, D.; Vanhoucke, V.; Rabinovich, A. Going deeper with convolutions. In Proceedings of the IEEE Conference on Computer Vision and Pattern Recognition, Boston, MA, USA, 7–12 June 2015. [Google Scholar]
- He, K.; Zhang, X.; Ren, S.; Sun, J. Deep residual learning for image recognition. In Proceedings of the IEEE Conference on Computer Vision and Pattern Recognition, Las Vegas, NV, USA, 27–30 June 2016; pp. 770–778. [Google Scholar]
- Huang, G.; Liu, Z.; van der Maaten, L.; Weinberger, K.Q. Densely connected convolutional networks. In Proceedings of the IEEE Conference on Computer Vision and Pattern Recognition, Honolulu, HI, USA, 21–26 July 2017; pp. 4700–4708. [Google Scholar]
- Lin, M.; Chen, Q.; Yan, S. Network in network. arXiv 2013, arXiv:1312.4400. [Google Scholar]
- Zagoruyko, S.; Komodakis, N. Wide residual networks. arXiv 2016, arXiv:1605.07146. [Google Scholar]
- Huang, G.; Sun, Y.; Liu, Z.; Sedra, D.; Weinberger, K.Q. Deep networks with stochastic depth. In Proceedings of the European Conference on Computer Vision, Amsterdam, The Netherlands, 8–16 October 2016; Springer: Berlin/Heidelberg, Germany, 2016; pp. 646–661. [Google Scholar]
- Chollet, F. Xception: Deep learning with depthwise separable convolutions. In Proceedings of the IEEE Conference on Computer Vision and Pattern Recognition, Honolulu, HI, USA, 21–26 July 2017. [Google Scholar]
- Larsson, G.; Maire, M.; Shakhnarovich, G. Fractalnet: Ultra-deep neural networks without residuals. arXiv 2016, arXiv:1605.07648. [Google Scholar]
- Iandola, F.N.; Han, S.; Moskewicz, M.W.; Ashraf, K.; Dally, W.J.; Keutzer, K. SqueezeNet: AlexNet-level accuracy with 50x fewer parameters and <0.5 MB model size. arXiv 2016, arXiv:1602.07360. [Google Scholar]
- Khan, A.; Sohail, A.; Zahoora, U.; Qureshi, A.S. A survey of the recent architectures of deep convolutional neural networks. Artif. Intell. Rev. 2020, 53, 5455–5516. [Google Scholar] [CrossRef] [Green Version]
- Zoph, B.; Vasudevan, V.; Shlens, J.; Le, Q.V. Learning transferable architectures for scalable image recognition. In Proceedings of the IEEE Conference on Computer Vision and Pattern Recognition, Salt Lake City, UT, USA, 18–23 June 2018; pp. 8697–8710. [Google Scholar]
- Tan, M.; Chen, B.; Pang, R.; Vasudevan, V.; Sandler, M.; Howard, A.; Le, Q.V. Mnasnet: Platform-aware neural architecture search for mobile. In Proceedings of the IEEE/CVF Conference on Computer Vision and Pattern Recognition, Long Beach, CA, USA, 15–20 June 2019; pp. 2820–2828. [Google Scholar]
- Tan, M.; Le, Q. Efficientnet: Rethinking model scaling for convolutional neural networks. Proc. Mach. Learn. PMLR 2019, 97, 6105–6114. [Google Scholar]
- Kundu, S.; Nazemi, M.; Pedram, M.; Chugg, K.M.; Beerel, P.A. Pre-defined sparsity for low-complexity convolutional neural networks. IEEE Trans. Comput. 2020, 69, 1045–1058. [Google Scholar] [CrossRef] [Green Version]
- Weiss, K.; Khoshgoftaar, T.M.; Wang, D. A survey of transfer learning. J. Big Data 2016, 3, 1–40. [Google Scholar] [CrossRef] [Green Version]
- Prajapati, A.S.; Nagaraj, R.; Mitra, S. Classification of dental diseases using CNN and transfer learning. In Proceedings of the 2017 5th International Symposium on Computational and Business Intelligence (ISCBI), Dubai, United Arab Emirates, 11–14 August 2017; IEEE: Piscataway, NJ, USA, 2017. [Google Scholar]
- Kucuksubasi, F.; Sorguc, A. Transfer learning-based crack detection by autonomous UAVs. arXiv 2018, arXiv:1807.11785. [Google Scholar]


| Model | Total Parameters | Trainable Parameters | Non-Trainable Parameters | Total Number of Layers | FLOPs Billion |
|---|---|---|---|---|---|
| VGG16 | 14,714,688 | 11,799,040 | 2,915,648 | 19 | 30.7129 |
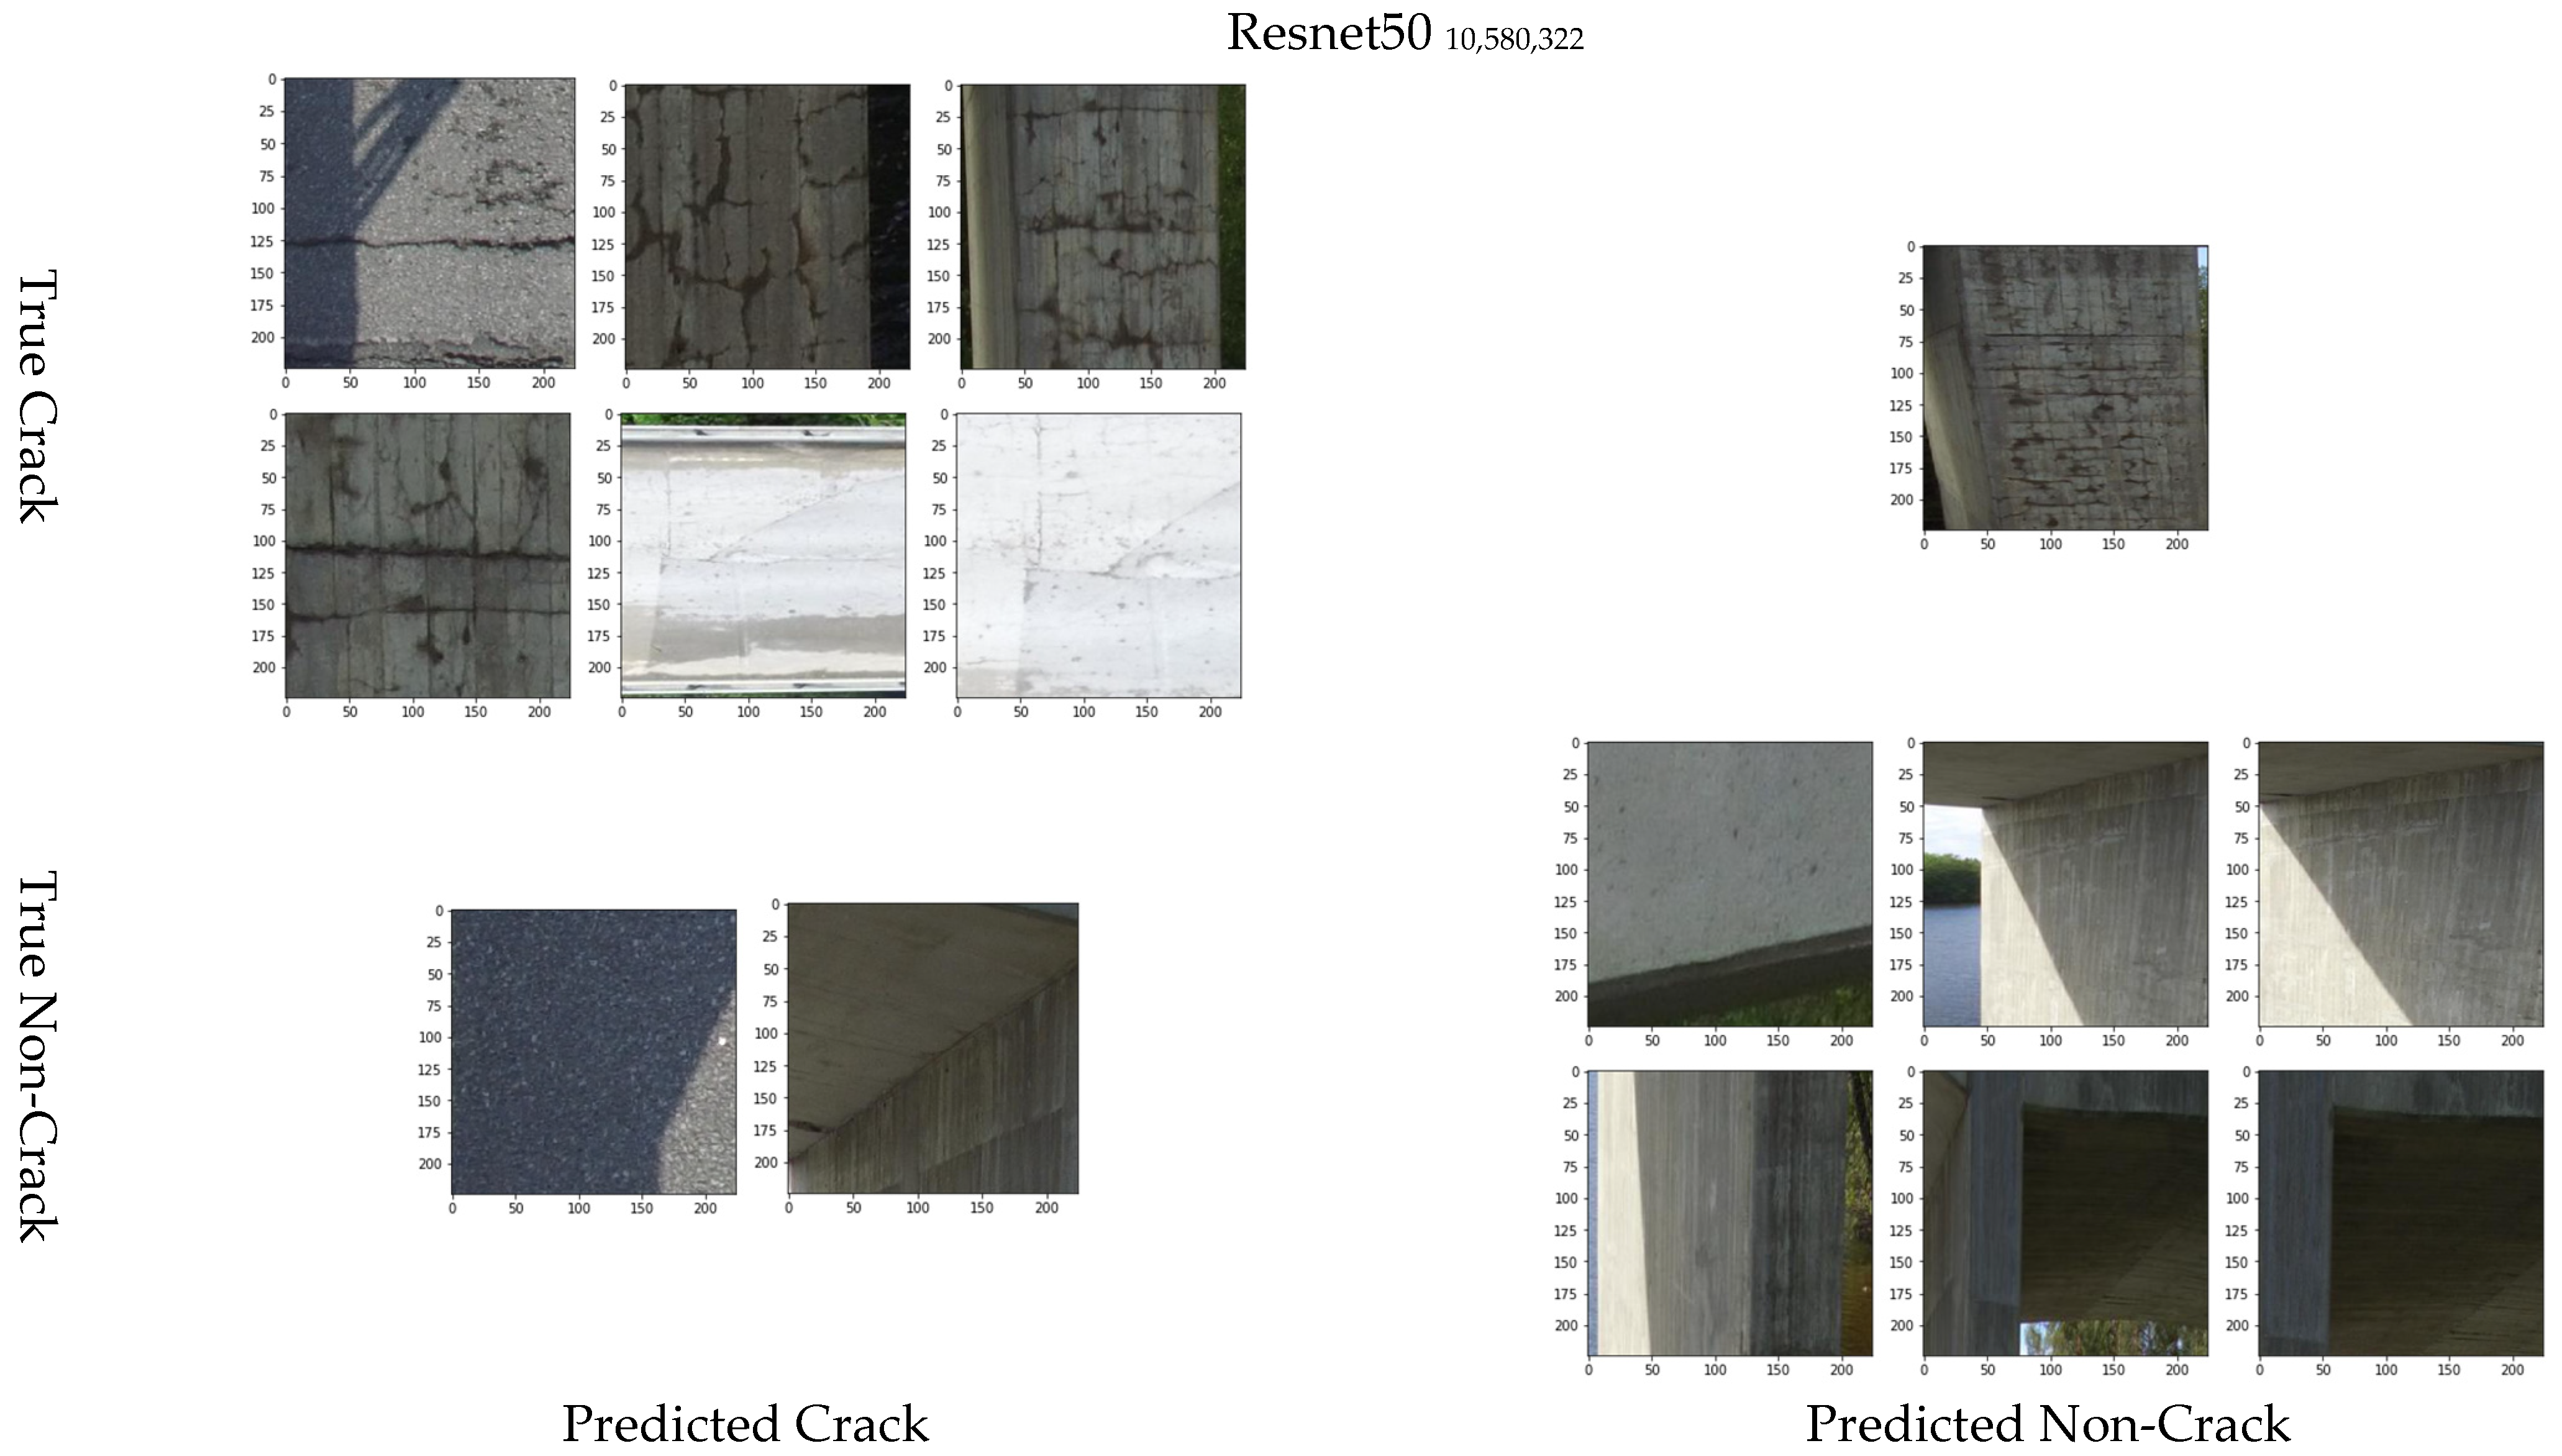
| Resnet50 | 24,177,954 | 10,580,322 | 13,597,632 | 175 | 7.7511 |
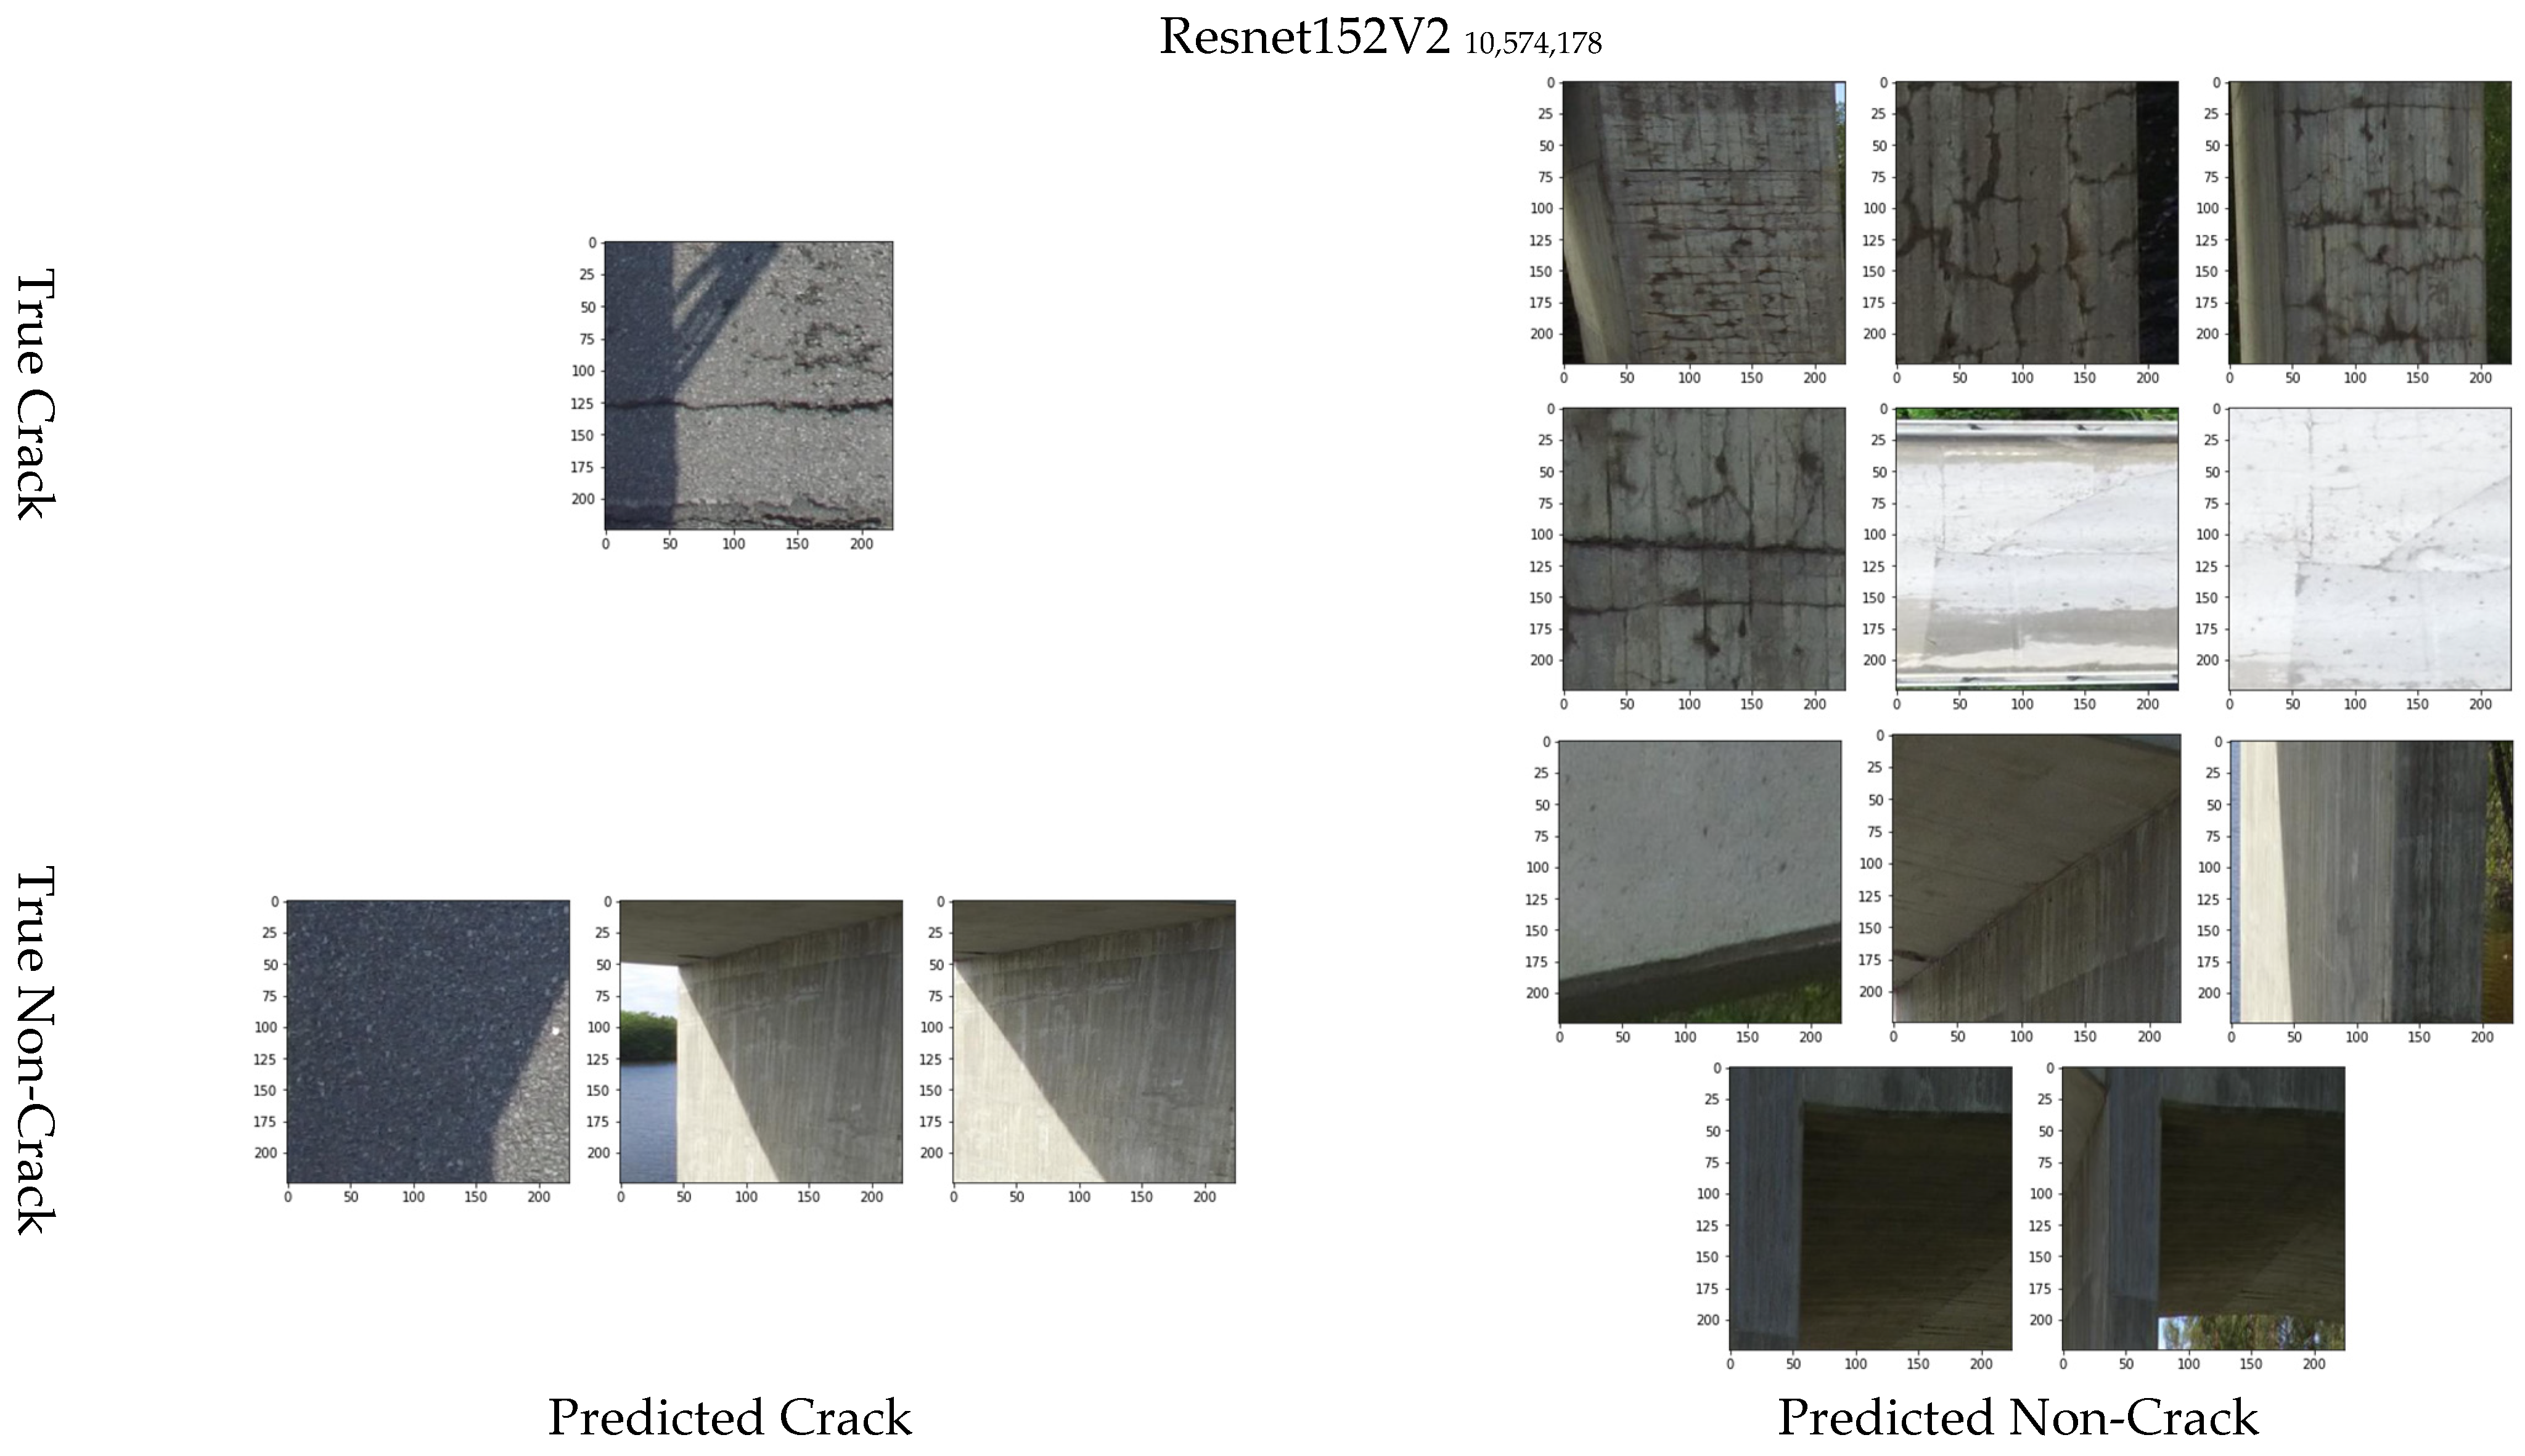
| Resnet152v2 | 58,921,890 | 10,574,178 | 48,347,712 | 564 | 21.8756 |
| Xception | 21,451,722 | 12,758,482 | 8,693,240 | 132 | 9.1340 |
| InceptionV3 | 22,392,834 | 12,848,546 | 9,544,288 | 311 | 5.6933 |
| DenseNet210 | 18,875,362 | 10,220,514 | 8,654,848 | 707 | 8.6316 |
| NASNetLarge | 86,079,220 | 11,216,802 | 74,862,418 | 1039 | 47.7934 |
| EfficientNetB4 | 17,673,823 | 10,581,832 | 7,091,991 | 474 | 3.0688 |
| Model | Training Accuracy | Validation Accuracy | Training Time (s/100 Epochs) | Parameters | FLOPs Billion | Layers |
|---|---|---|---|---|---|---|
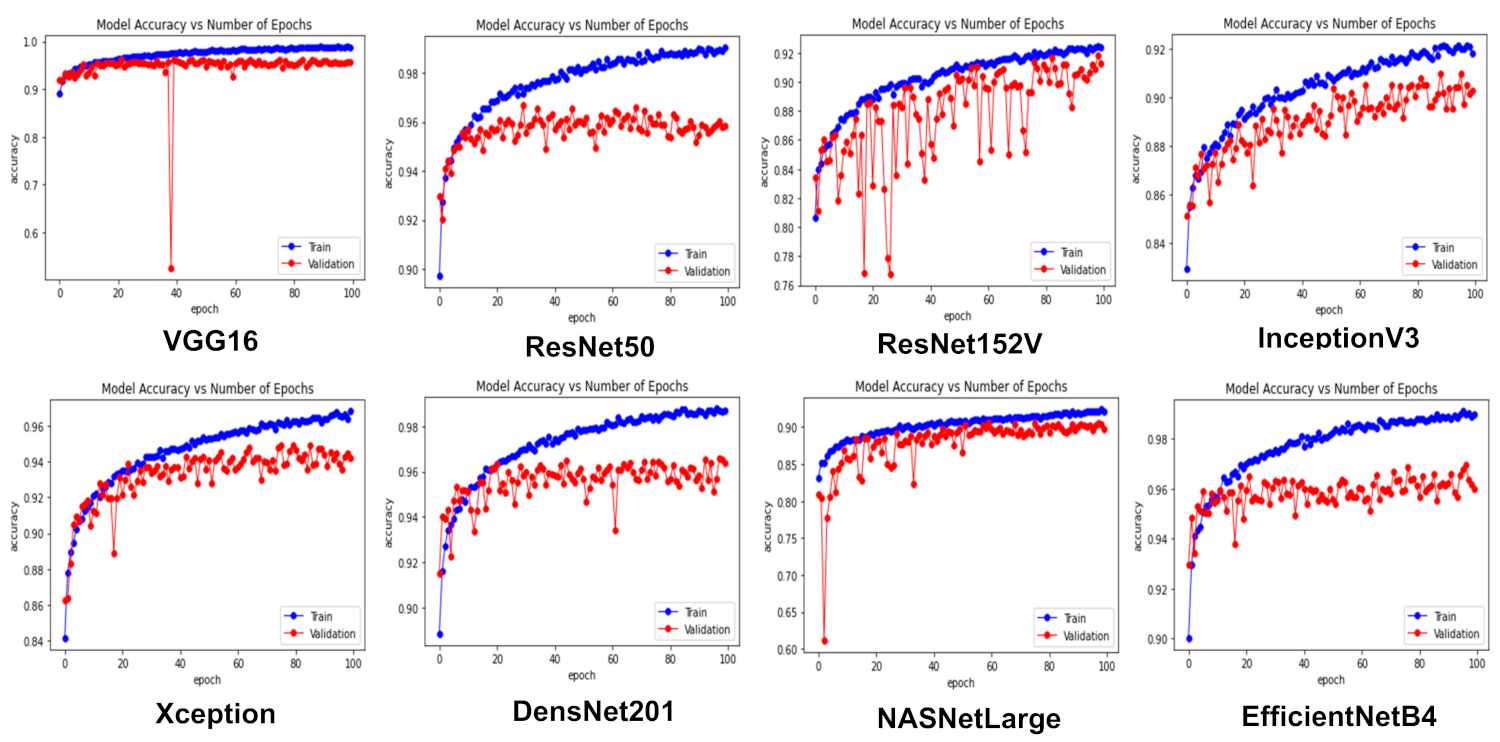
| VGG16 | 0.9881 | 0.9569 | 155,424 | 14,714,688 | 30.7129 | 19 |
| Resnet50 | 0.9902 | 0.9585 | 71,700 | 24,177,954 | 7.7511 | 175 |
| Resnet152v2 | 0.9120 | 0.8696 | 129,849 | 58,921,890 | 21.8756 | 564 |
| Xception | 0.968 | 0.9416 | 89,771 | 21,451,722 | 9.1340 | 132 |
| InceptionV3 | 0.9181 | 0.9027 | 77,915 | 22,392,834 | 5.6933 | 311 |
| DenseNet201 | 0.9867 | 0.9637 | 156,623 | 18,875,362 | 8.6316 | 707 |
| NASNetLarge | 0.9210 | 0.8975 | 337,903 | 86,079,220 | 47.7934 | 1039 |
| EfficientNetB4 | 0.9901 | 0.96 | 107,984 | 17,673,823 | 3.0688 | 474 |
| Model | Heterogeneous UAV-Based Bridge Inspection Dataset | Homogeneous UAV-Based Bridge Inspection Dataset | Accuracy UAV-Based Bridge Inspection Datasets | ||||||
|---|---|---|---|---|---|---|---|---|---|
| Crack Recall | Non-Crack Recall | Average Recall | Crack Recall | Non-Crack Recall | Average Recall | Crack Recall | Non-Crack Recall | Average Recall | |
| VGG16 | 0.90 | 0.49 | 0.69 | 0.85 | 0.52 | 0.68 | −5% | 3% | −1% |
| Resnet50 | 0.75 | 0.51 | 0.63 | 0.86 | 0.53 | 0.70 | 11% | 2% | 7% |
| Resnet152v2 | 0.66 | 0.73 | 0.69 | 0.58 | 0.81 | 0.69 | −9% | 8% | 0% |
| Xception | 0.88 | 0.33 | 0.60 | 0.80 | 0.69 | 0.74 | −8% | 36% | 14% |
| InceptionV3 | 0.56 | 0.56 | 0.56 | 0.46 | 0.72 | 0.59 | −10% | 16% | 3% |
| DenseNet201 | 0.75 | 0.39 | 0.57 | 0.88 | 0.42 | 0.65 | 13% | 3% | 8% |
| NASNetLarge | 0.59 | 0.64 | 0.61 | 0.51 | 0.74 | 0.62 | −8% | 10% | 1% |
| EfficientNetB4 | 0.75 | 0.27 | 0.51 | 0.81 | 0.35 | 0.58 | 6% | 8% | 7% |
| Model | Training Accuracy | Validation Accuracy | SDNET 2018 Accuracy | UAV Heterogeneous Dataset Accuracy | UAV Homogenous Dataset Accuracy | Trainable Parameters | Non-Trainable Parameters | Total Number of Layers |
|---|---|---|---|---|---|---|---|---|
| VGG16 | 0.9881 | 0.9569 | 0.96 | 0.69 | 0.68 | 11,799,040 | 2,915,648 | 19 |
| Resnet50 | 0.9902 | 0.9585 | 0.96 | 0.63 | 0.70 | 10,580,322 | 13,597,632 | 175 |
| Resnet152v2 | 0.9120 | 0.8696 | 0.88 | 0.69 | 0.69 | 10,574,178 | 48,347,712 | 564 |
| Xception | 0.968 | 0.9416 | 0.94 | 0.60 | 0.74 | 12,758,482 | 8,693,240 | 132 |
| InceptionV3 | 0.9181 | 0.9027 | 0.90 | 0.56 | 0.59 | 12,848,546 | 9,544,288 | 311 |
| DenseNet201 | 0.9867 | 0.9637 | 0.97 | 0.57 | 0.65 | 11,216,802 | 74,862,418 | 707 |
| NASNetLarge | 0.9210 | 0.8975 | 0.90 | 0.61 | 0.62 | 10,220,514 | 8,654,848 | 1039 |
| EfficientNetB4 | 0.9901 | 0.96 | 0.96 | 0.51 | 0.58 | 10,581,832 | 7,091,991 | 474 |
| Model | Training Accuracy | Validation Accuracy | Training Time (s/100 Epochs) | Trainable Parameters | Non-Trainable Parameters |
|---|---|---|---|---|---|
| Resnet50 10,580,322 | 0.9902 | 0.9585 | 71,700 | 10,580,322 | 13,597,632 |
| Resnet50 17,540,706 | 0.9909 | 0.9532 | 84,283 | 17,540,706 | 6,637,248 |
| 0.07% | −0.55% | 17.54% | 65.8% | 51.2% | |
| Resnet152V2 10,574,178 | 0.9120 | 0.8696 | 129,849 | 10,574,178 | 48,347,712 |
| Resnet152V2 16,942,434 | 0.9235 | 0.9127 | 137,043 | 16,942,434 | 41,979,456 |
| 1.26% | 4.96% | 5.54% | 60% | 13.17% |
| Model | UAV-Based Bridge Inspection Heterogeneous Dataset | UAV-Based Bridge Inspection Homogenous Dataset | |||||
|---|---|---|---|---|---|---|---|
| Precision | Recall | F1-Score | Precision | Recall | F1-Score | ||
| Resnet50 10,580,322 | Cracked | 0.60 | 0.75 | 0.67 | 0.65 | 0.86 | 0.74 |
| Non-cracked | 0.67 | 0.51 | 0.58 | 0.8 | 0.53 | 0.64 | |
| Weighted avg | 0.63 | 0.63 | 0.62 | 0.72 | 0.70 | 0.69 | |
| Resnet50 17,540,706 | Cracked | 0.83 | 0.71 | 0.76 | 0.78 | 0.76 | 0.77 |
| Non-cracked | 0.75 | 0.86 | 0.80 | 0.76 | 0.79 | 0.77 | |
| Weighted avg | 0.79 | 0.78 | 0.78 | 0.77 | 0.77 | 0.77 | |
| Resnet152V2 10,574,178 | Cracked | 0.71 | 0.66 | 0.68 | 0.75 | 0.57 | 0.65 |
| Non-cracked | 0.68 | 0.73 | 0.71 | 0.65 | 0.81 | 0.72 | |
| Weighted avg | 0.70 | 0.69 | 0.69 | 0.70 | 0.69 | 0.68 | |
| Resnet152V2 16,942,434 | Cracked | 0.60 | 0.58 | 0.59 | 0.72 | 0.56 | 0.63 |
| Non-cracked | 0.59 | 0.62 | 0.61 | 0.64 | 0.79 | 0.70 | |
| Weighted avg | 0.60 | 0.60 | 0.60 | 0.68 | 0.67 | 0.67 | |
| Model | Training Accuracy | Validation Accuracy | SDNET 2018 Accuracy | Heterogeneous UAV-Based Bridge Inspection Accuracy | Homogenous UAV-Based Bridge Inspection Accuracy | Accuracy UAV-Based Bridge Inspection Datasets |
|---|---|---|---|---|---|---|
| Resnet50 10,580,322 | 0.9902 | 0.9585 | 0.96 | 0.63 | 0.70 | 7% |
| Resnet50 17,540,706 | 0.9909 | 0.9532 | 0.96 | 0.78 | 0.77 | −1% |
| 0.07% | 0.55% | 0% | 15% | 7% | ||
| Resnet152V2 10,574,178 | 0.9120 | 0.8696 | 0.88 | 0.69 | 0.69 | 0% |
| Resnet152V2 16,942,434 | 0.9235 | 0.9127 | 0.91 | 0.60 | 0.67 | 7% |
| 1.26% | 4.96% | 3% | −9% | −2% |
| Model | Training Accuracy | Validation Accuracy | SDNET 2018 Accuracy | UAV-Based bridge Inspection Heterogeneous Accuracy | UAV-Based Bridge Inspection Homogenous Accuracy | Training Time (s/100 Epochs) |
|---|---|---|---|---|---|---|
| Resnet50 10,580,322 | 0.9902 | 0.9585 | 0.96 | 0.63 | 0.70 | 71,700 |
| Resnet50 17,540,706 | 0.9909 | 0.9532 | 0.96 | 0.78 | 0.77 | 84,283 |
| Resnet50 No transfer learning | 0.9702 | 0.9574 | 0.95 | 0.57 | 0.62 | 218,990 |
| 17,540,706-No transfer learning | −2.07% | 0.42% | −1% | −21% | −15% | −134,707 |
| VGG16 11,799,040 | 0.9881 | 0.9569 | 0.96 | 0.69 | 0.68 | 155,424 |
| VGG16 No transfer learning | 0.9723 | 0.9485 | 0.94 | 0.81 | 0.83 | 351,676 |
| 11,799,040-No transfer | −1.58% | −0.84% | −2% | 12% | 15% | −196,252 |
| Input | Feature Maps (First Part of Networks) | Feature Maps (Middle Part of Networks) | Feature Maps (Last Part of Networks) | |
|---|---|---|---|---|
| VGG16 |  |  |  |  |
| Resnet50 |  |  |  |  |
| Resnet152V2 |  |  |  |  |
| Xception |  |  |  |  |
| InceptionV3 |  |  |  |  |
| DenseNet210 |  |  |  |  |
Publisher’s Note: MDPI stays neutral with regard to jurisdictional claims in published maps and institutional affiliations. |
© 2021 by the authors. Licensee MDPI, Basel, Switzerland. This article is an open access article distributed under the terms and conditions of the Creative Commons Attribution (CC BY) license (https://creativecommons.org/licenses/by/4.0/).
Share and Cite
Aliyari, M.; Droguett, E.L.; Ayele, Y.Z. UAV-Based Bridge Inspection via Transfer Learning. Sustainability 2021, 13, 11359. https://doi.org/10.3390/su132011359
Aliyari M, Droguett EL, Ayele YZ. UAV-Based Bridge Inspection via Transfer Learning. Sustainability. 2021; 13(20):11359. https://doi.org/10.3390/su132011359
Chicago/Turabian StyleAliyari, Mostafa, Enrique Lopez Droguett, and Yonas Zewdu Ayele. 2021. "UAV-Based Bridge Inspection via Transfer Learning" Sustainability 13, no. 20: 11359. https://doi.org/10.3390/su132011359
APA StyleAliyari, M., Droguett, E. L., & Ayele, Y. Z. (2021). UAV-Based Bridge Inspection via Transfer Learning. Sustainability, 13(20), 11359. https://doi.org/10.3390/su132011359