1. Introduction
Extreme heat and cold temperatures have caused nearly 90,000 fatalities in Europe since 1980 [
1]. However, while heatwaves are projected to occur more frequently and with an increased intensity [
2], cold waves are projected to decline due to global warming. Despite efforts directed toward mitigating climate change, the latest Intergovernmental Panel on Climate Change (IPCC) report indicates that it is likely that the Earth will warm the 1.5 ℃ considered the point of no return in the early 2030s [
3]. This means that regardless of mitigation actions, adaptation to climate change is a needed strategy to limit the impacts of global warming.
Several studies have estimated the global costs of climate change adaptation [
4,
5,
6,
7]. The World Bank (2010), for instance, estimated the global adaptation costs as between USD 70 and 100 billion per year in the case of a 2 °C rise in global temperatures by 2050. Although the estimations in these studies may be, to a certain degree, inaccurate due to uncertainty, they show the order of magnitude of the future required investment [
7,
8]. The capital is needed, to a large extent, for physical infrastructure, but also for “soft” options, such as change in institutions and policies, capacity building, and strategy development [
7].
Governments are facing the challenge of making adaptation investment decisions that maximize welfare under the constraints of limited budgets and competing demands for resources. In addition, climate adaptation investments cannot be considered in isolation: in most cases, climate adaptation is one component in a quest for sustainable development as well as an additional criterion, not the main objective, to which a policy or an investment needs to adhere. Therefore, policymakers are facing a growing complexity in committing to long-term investment decisions for which technical, socioeconomic, and political uncertainties need to be considered.
Scientific research in various disciplines is working toward supporting complex and uncertain contexts by developing, among others, useful methods, tools, and datasets. Traditionally, the work focused on reducing uncertainty by collecting and processing additional data, addressing either a lack of information or random variation through statistical analysis [
9]. However, uncertainties in climate adaptation decisions cannot, for the most part, be faced by addressing a lack of information or statistical analysis (data may simply not exist). For instance, for rare, extreme events, no one certainly knows how the future will unfold.
These deep uncertainties are unknowable at present, but can be reduced over time [
10,
11]. In the context of climate adaptation policy making, relevant approaches have been developed to help policymakers, planners, and system designers to formulate flexible adaptive plans that tackle uncertainties. The most relevant approaches are: adaptive policy making [
9,
12], adaptation pathways [
13,
14], and real options analysis [
15,
16,
17]. In addition, many other methodologies, tools, and techniques take uncertainty into account within their design or process. A few examples of uncertainty consideration are scenario planning [
18], Monte Carlo analysis [
19], multi-layer decision analysis [
20], safety margin strategies [
21], the integrated management system developed in the CHAMP project (2009–2011), the Urban Adaptation Support Tool (
https://climate-adapt.eea.europa.eu/knowledge/tools/urban-ast/step-0-0) (accessed on 13 October 2021), and the RAMSES transition model [
22].
Adaptation pathways have demonstrated significant potential for policy making under conditions of deep uncertainty [
10,
13,
23,
24,
25,
26,
27,
28]. Its strength relies on: (i) its flexibility, as pathways are designed to be adjusted over time, thereby ensuring the system adapts to the changing social, environmental, and economic conditions [
13,
14]; and (ii) its level of implementation, dependent on the urban context (hazards affected, socio-economic characteristics, institutional awareness to climate change, etc.) and starting point (existing diagnostics, adaptation planning already in place, etc.). The adaptation pathway can be designed, at a detailed level, quantitatively linked to the use of models and tools (e.g., impact modeling, cost-benefit analysis, etc.) or it can be designed broadly with more qualitative information to foresee the needs for a detailed pathway definition.
The main objective of this paper is to showcase the application of adaptation pathways to develop a flexible roadmap to enhance heat resilience in a case study, Antwerp. It presents the key steps and decisions adopted to transfer the adaptation pathway approach to the local context. First, this paper presents a structured methodology for designing climate adaptation pathways, followed by a description of the step-by-step methodology applied in Antwerp that results in the selection of the best alternative options for climate heatwave risks. Finally, a summary of the lessons learned is provided, and challenges of this approach for further development are discussed. The research, based on a previous work [
29], describes a high-level heat–health adaptation pathway, covering the heatwave impact on productivity and health at city level in Antwerp to ensure the city adapts to the future economic, social, and environmental conditions.
2. Materials and Methods
2.1. Adaptation Pathways
Based on the work conducted in the RAMSES FP7 project, the adaptation pathway approach is a type of adaptive policy making that can be aligned with the Urban Adaptation Support Tool (UAST) (
Figure 1) based on the following six steps. The adaptation pathway can be developed into the implementation step of the UAST; therefore, it can be useful as an additional tool for the UAST, which provides the required flexibility to develop a dynamic adaptation plan.
The adaptation pathway methodology, defined in the RAMSES FP7 project [
22,
30], starts with the contextualization of the city’s problem. This step consists of the conceptualization of the impact chain, which graphically represents the connection between city hazards, exposure, and their potential impacts, in which climate and non-climate drivers, and potential impacts on the city (or specific sectors) are identified. Through the identification of key variables for the impact analysis, a threshold analysis can be performed.
The second step consists of collecting information in relation to climatic drivers, socio-economic changes, and the urban, technical, and political context to conduct a vulnerability and risk analysis [
31]. The first and second steps allow the definition of the city’s challenges (objectives) based on the definition of present, near future, and far future acceptable risk level (thresholds) and the detection of the key problems (vulnerabilities and hotspots).
The third step consists of identifying potential adaptation options based on existing city plans, examples of other cities, and a literature review. These options may be presented in an adaptation canvas that visually illustrates the potential solution space for the given system. Afterward, each option is characterized based on selected criteria, such as effectiveness, cost-efficiency, co-benefits, potential barriers, or time of implementation, amongst others [
22], that have to be agreed upon by the stakeholders.
The fourth step consists of grouping the previously identified adaptation options into possible adaptation packages (pathways design) and performing a cumulative assessment of the effectiveness and efficiency of each pathway alternative. This can be performed quantitatively or semi-quantitatively. The semi-quantitative approach considers previously collected information, expert judgment, and additional information extracted from the literature (published papers and grey literature). The quantitative approach is based on modeling; therefore, it considers local geographical information and the exact location of the adaptation options. Thus, the modeling helps to visualize the development of the hazard over the domain and assists in the identification of areas where problems may arise. It also indicates a spatial effectiveness of the adaptation options. Independent of which approach is used, the cumulative assessment allows for the exploration of the most suitable options to tackle the key thresholds in a specific context. Then, a set of pathways is designed that sequence the adaptation options over time and identify tipping points.
Lastly, a dialogue with the stakeholders involved in the climate adaptation process is required to foresee the fourth, fifth, and sixth steps—key elements for the implementation, monitoring, and evaluation of these pathways. The sixth step, monitoring and evaluation, is strongly linked with the initial one in which the city objectives, goals, and thresholds are established. Ideally, objectives articulate specific, precise, and measurable targets that relate to the achievement of a goal. Such measurable objectives (e.g., key performance indicators or performance options) provide the basis for developing and evaluating options as well as later monitoring, evaluation, and learning. The objectives allow thinking through the different adaptation options that could better contribute to achieve the goals.
2.2. Urban Climate Modeling and Lost Working Hours
The effectiveness of adaptation measures to reduce outdoor air temperature and lost working hours are derived from a paper by Hooyberghs et al. [
29]. In summary, the methodology employed in that work includes UrbClim modeling for present and future urban climate, followed by the use of EnergyPlus for building energy simulations. The derived indoor temperatures and humidity were used for the calculation of the wet bulb globe temperature (WBGT). The WBGT index is used as indicator by several organizations (e.g., ISO and OSHA) to assess the heat stress to which a person is exposed in their working environment. The International Standards Organization occupational exposure standard ISO 7243:2017 [
32] is applied to evaluate the presence or absence of heat stress over the working day (up to 8 h) to heat stress. This information helps to the manage the rest and work periods whenever the occupational exposure limits are exceeded [
33,
34].
The calculation of the lost working hours (LWH), which is based on the U.S. Association Advancing Occupational and Environmental Health non-acclimatized standard by the National Institute for Occupational Safety and Health (NIOSH), was calculated using the Bernard formula for non-acclimatized working environments [
35]:
Consequently, in Antwerp, normal working conditions are considered to be when the WBGT is lower than 27.6 °C. If the temperature exceeds the threshold of 27.6 °C, the worker needs some rest periods during the working day. If the WBGT exceeds 31.9 °C, then work can no longer continue.
3. Results
According to Hooyberghs (2015) [
36], a temperature rise in the future is expected, which may potentially increase morbidity and mortality in the city of Antwerp. Therefore, heatwaves are one of Antwerp’s concerns due to their consequences ranging from increased thermal discomfort and productivity reduction to increases in health problems. To reduce this climate risk and identify proper adaptation solutions, the adaptation pathway methodology was applied in Antwerp (steps 1 to 4) to construct a heatwave adaptation pathway (steps 5 and 6 are not presented in this paper).
In step 3, we followed a semi-quantitative methodology, a straight approach, to minimize risks associated with the lack of adequate information. This approach, despite providing a rougher approach than the quantitative one, helps to present the most plausible pathway alternative, ranking the different pathways and identifying the need for a future detailed pathway definition.
The methodology applied in steps 1 to 4 is presented below.
3.1. Impact Chains
As stated above, an adaptation pathway helps to specify the problem that a city may need to tackle and to find appropriate solutions. These objectives cannot be set at the beginning of the process as their definition depends on a deeper understanding of the hazard and its potential impacts in the city’s context. Therefore, an iterative approach is necessary through impact chain conceptualization (this section) and the analysis of the city’s vulnerability and risk (
Section 3.2) to define these adaptation objectives.
As a first step, the Belgian Federal Heat Plan (2016) was reviewed to identify the main impacts caused by heatwaves in Antwerp. These range from dermatitis or edema of the extremities to insolation, exhaustion, and heat stroke. Research studies were also analyzed to identify the potential impacts of heatwaves on the productivity of workers or students, which range from loss of concentration to muscle cramps.
After reviewing previous information, two impact chains were prioritized and aligned with work performed under the RAMSES FP7 Project [
30]. Climatic and non-climatic drivers, together with potential impacts in Antwerp, were represented on a canvas for each impact chain to help to understand the problem.
The exposure to the heatwave hazard was determined for outdoor (for the heat-to-human-health impact chain) and indoor (for the heat-to-work-productivity impact chain) heat. Outdoor heat depends on landscape and built environment factors that are heavily influenced by urban configurations. Indoor heat depends on outdoor heat and the indoor heat exposure. In this study, the temperature of warm nights and warm days (daily minimum and maximum temperature) was selected for the threshold analysis on the human health impact chain. The climate variables used to define heatwave exposure and microclimate are, primarily, temperature, humidity, direct heat radiation, diffuse heat radiation, and wind speed at the work place [
37]. A combined measure of these factors is named the wet bulb globe temperature (WBGT). The WBGT was selected for the threshold analysis on the work productivity impact chain as described in [
29].
3.1.1. Threshold in Heat-to-Human-Health Impact Chain
We considered the federal alert system for the threshold value determination in Antwerp. The federal alert system establishes 30 °C (as the maximum temperature) and 18 °C (or the minimum temperature) as daily thresholds. Considering these thresholds, the triggered situations for the reference period, near future, and far future were identified (
Table 1), and the maximum, minimum, and average temperature value of these triggered situations were obtained (
Table 2).
Taking the Federal Heat Health Plan (2016) into account, we considered two thresholds as undesirable: the maximum of the minimum temperature reached in each period (worst scenario) and the average of the minimum temperature reached in each period (medium scenario). The adaptation objectives were later defined based on these thresholds (explained further below). For both maximum and minimum temperatures, we prioritized the minimum temperature as the main indicator for heatwave impact on health due to its stronger impact, as it directly effects human rest and thus health [
38].
3.1.2. Threshold in Heat-to-Work-Productivity Impact Chain
The RAMSES project calculated the lost working hours (LWH), derived from the WBGT calculation, in a prototype office building located in Antwerp and considered the north- and south-facing orientation of rooms [
39]. The work conducted in RAMSES indicates that building orientation and modification in working regimes may be used as adaptation options to reduce heat impacts on productivity, which were considered in this work in the following step. In the north-facing rooms, 1.1% of the working hours are lost. In the south-facing rooms, 4.2% of the working hours are lost. Therefore, we considered 1% of LWH as an acceptable threshold in the worst-case scenario and 3% in the medium-case scenario.
3.1.3. Adaptation Objectives
Considering the minimum temperature projections (
Table 2) and subtracting the daily thresholds for the minimum temperature established by the federal alert system (18 °C), together with the stakeholders, we defined the following adaptation objectives for health. In the worst-case scenario, for the minimum air temperature, the adaptation objectives are: 5.1 °C reduction in the reference period, 6.3 °C in the near future, and 9.2 °C in the far future. In the medium-case scenario, for the minimum temperature, the adaptation objectives are: 3.1 °C reduction in the reference period, 3.2 °C in the near future, and 4.2 °C in the far future.
A similar approach was followed to define the adaptation objectives for the work productivity (indoor environment) impact chain. We defined the following adaptation objectives for the work productivity impact chain. In the worst-case scenario, the adaptation objectives are: 3% reduction for the reference period, 6% for the near future, and 7% in the far future. In the medium-case scenario, the adaptation objectives are: 1% reduction for the reference period, 4% for the near future, and 12% in the far future.
3.2. Assessing Risk and Vulnerability
The climate-related impacts on human health depend strongly on the level of exposure and vulnerability to climate events. In this analysis, three levels of exposure are distinguished: individual, building, and city levels. This section provides the input for the adaptation option section.
3.2.1. System Analysis
The exposure refers to the presence of people, livelihoods, species, ecosystems, environmental services, resources, infrastructure, economic assets, and social or cultural sites that could be affected or adversely impacted by the identified hazards [
40]. For the identified three levels, the most sensitive populations, buildings and infrastructure, and city services and areas were identified.
This exposure classification allowed us to identify and better organize the potential impacts and effects related to the different exposed elements (
Figure 2).
3.2.2. Vulnerability Analysis
Vulnerability refers to the propensity or predisposition of a given system to be affected by a threat. Therefore, vulnerability depends on the sensitivity to damage and the ability of such system to cope and/or adapt. The sensitivity or susceptibility is the degree to which a system or species is positively or negatively affected by the variability in the climate variables [
40]. Adaptive capacity is defined as the ability to adjust to potential damage, to take advantage of opportunities, or to respond to consequences’ [
40,
41].
A climate vulnerability analysis for urban areas was performed. The analysis provided a top-down and broad view of climate risks faced by the city, by distinguishing the three levels of exposure previously identified.
The vulnerability analysis considers different key indicators for the detection of sensitivity and coping capacity. This information is overlapped with the hazard maps and combined with the thresholds for alert levels identified for each of the impact chains. This allows detecting the areas of the city at highest risk (hot spots). The most sensitive elements at the different levels and the relevant indicators of sensitivity and coping capacity are presented in
Appendix A.
3.3. Adaptation Options
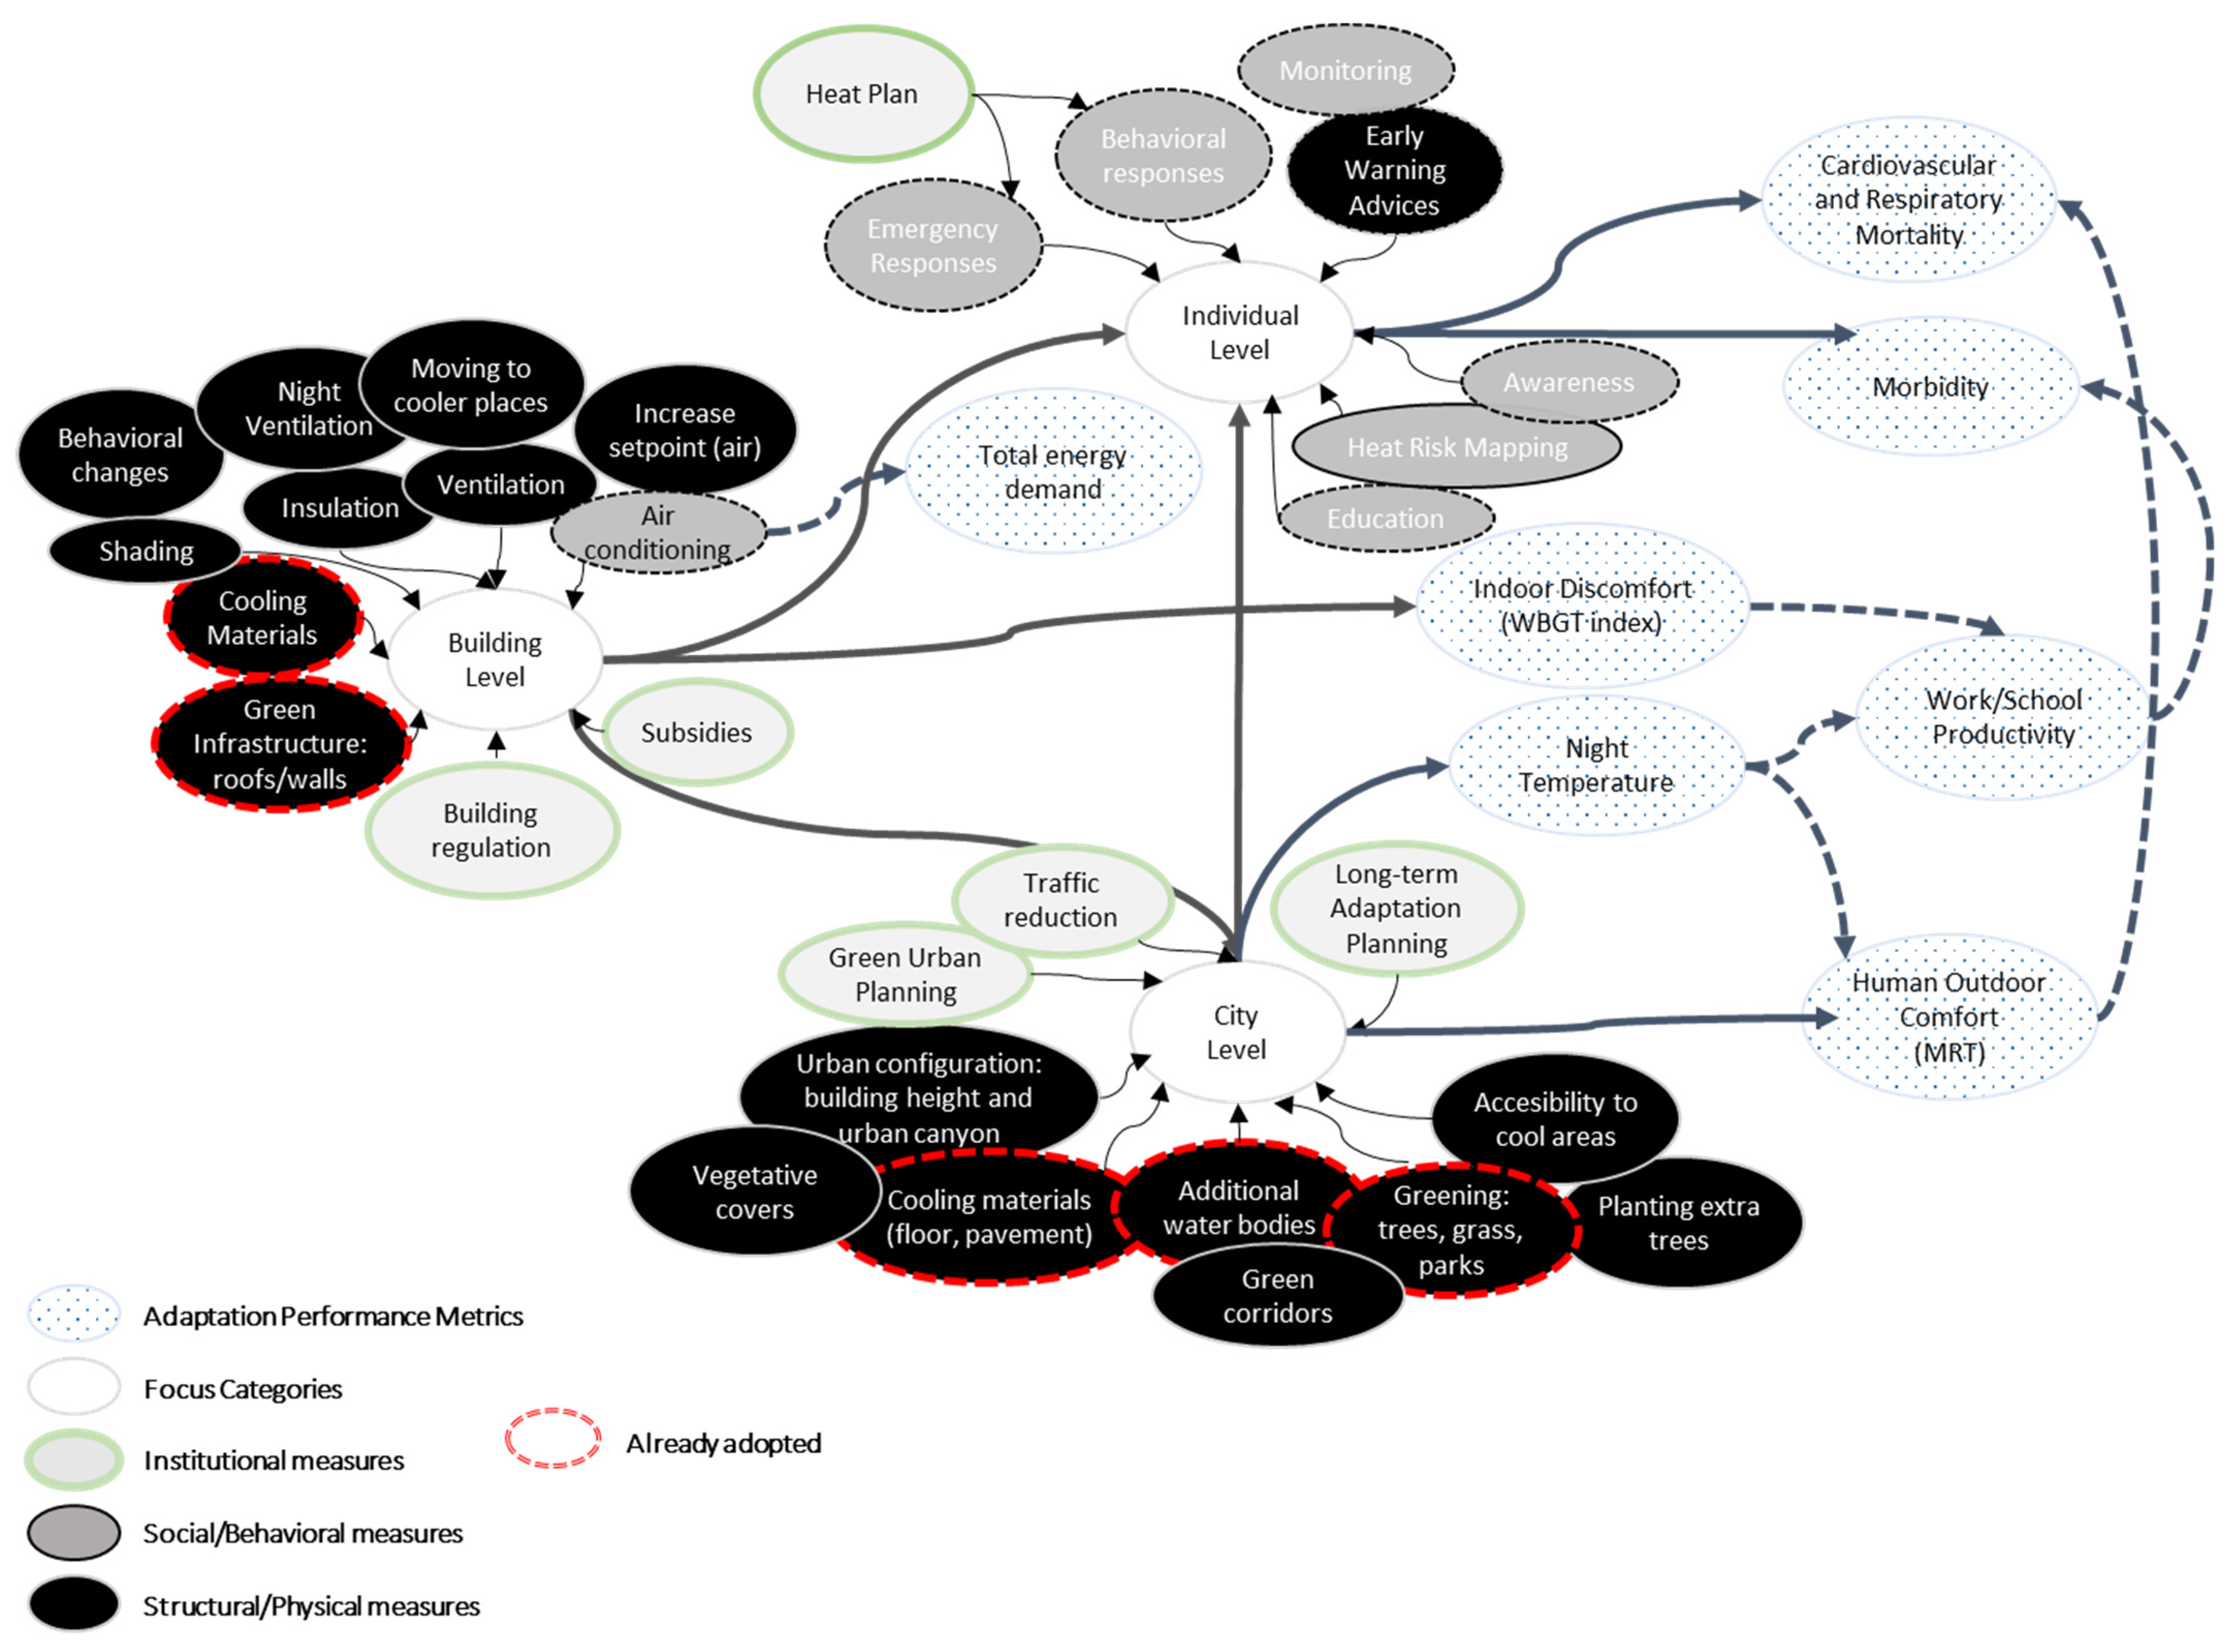
Taking the vulnerability analysis as a basis, city stakeholders can better understand the problems the city is facing and will face. This helps to identify potential adaptation options. To support this dialogue, an adaptation canvas was developed to visually illustrate the potential solution space and the relationships between the three focus categories (individuals, buildings, and city).
The adaptation canvas shows the different types of options (institutional, social, and structural) already adopted, but also allows for the mapping of new options and to contrast them with the stakeholder. It helps to understand the relationship between the options and their beneficiaries (
Figure 3).
The canvas in
Figure 3 shows that, at the individual level, several adaptation options are already in force, especially for preparation and prevention (Belgium Federal Heat Plan 2016 and Flemish Regional Heat Plan). At the building and city levels, a starting point is present, but additional options are possible, especially for protection. The identification of appropriate adaptation options is based on the RAMSES FP7 and RESIN H2020 research projects [
42].
All the adaptation options (old and new) need to be characterized [
43]. This characterization consists of a general description of the adaptation options, indicating objective(s), type, scale, implementing time, life time, effectiveness, cost-efficiency, co-benefits (other effects), responsibilities for implementation, barriers, amongst others. This information is crucial for the development of pathway alternatives.
3.4. Pathway Designs
The pathway design consists of grouping the previously identified adaptation options to develop possible adaptation packages (pathway alternatives). Effectiveness describes if a pathway alternative tackles the objectives (reaches the threshold). Stakeholders set the basis of the criteria to develop a pathway. Characterization, which may include effectiveness and other criteria, prioritizes and sequences the implementation of options (and stakeholders may be involved). Then, individual effectiveness information (the amount by which the risk threshold is reduced) is used to sequence the adaptation options over time (in each pathway alternative); the threshold is marked and tipping points are identified. If the included adaptation options do not reach the defined threshold, then more options are included. Lastly, the cumulative effectiveness is visually represented. This visual information allows for the understanding of the cumulative assessment and to identify the options that are not needed in the present (to reach the adaptation objectives at present), but are needed for the near or far future (to reach those future thresholds). Therefore, this visual information is important to sequence the adaptation options over time (pathways) and identify tipping points.
This step relies on the previously defined step in
Section 3.1 regarding threshold and adaptation objective definitions (worst-case and medium-case scenarios), which provide the basis for developing and evaluating options as well as later monitoring, evaluation, and learning.
4. Results
In this Section, the pathway design step results are presented. The results of the previous steps are included in the methodology to help to understand the methodological sequence.
4.1. Adaptation Pathway Alternatives: Building Level
In Antwerp, the adaptation options for the building level were grouped into four different adaptation pathways (
Figure 4).
The first adaptation pathway alternative considers all the adaptation options that aims for the maximum effectiveness capacity of the selected options. The second considers all of them except those that imply energy consumption (such as ventilation and air conditioning), and aims to align the mitigation and adaptation objectives. The third adaptation pathway considers only structural–technological options that allow depicting the hard options. The last pathway considers structural options (both ecosystem-based and technological-based ones), but without energy consumption.
The implementation time and co-benefits are considered in the sequencing of the options over the pathway design. For example, air conditioning is rejected as an option in all of the adaptation pathways due to its negative climate effect (greenhouse gas emissions).
Figure 5,
Figure 6,
Figure 7 and
Figure 8 illustrate the pathway alternatives and their effectiveness in helping to identify the potential to reduce the impact of heatwaves and the possibility to reach the thresholds at different periods (note that the three options of the working schemes are also represented in pathways 1 and 2 to help to visualize the best alternative).
Pathway alternative 1 shows that the morning and evening working scheme (7:00–11:00 and 17:00–20:00) is the most effective of the options. Considering only the regular working scheme and moving to cooler places are enough for ensuring that both thresholds (red and black) are not exceeded in the near future. However, for the far future, it is necessary to implement a new adaptation option to maintain an acceptable level of LWH below the threshold. At this tipping point, activating daily ventilation or solar blinds would be enough, so one of these options will need to be selected.
Pathway alternative 2 shows that the social options of changing working schemes and moving workers to cooler places together with solar blinds are enough for keeping LWH below both thresholds (red and black) in buildings.
The pathway alternative 3 shows that implementing only the daily ventilation option is enough to keep the LWH below the maximum acceptable levels for the reference period and the near future. For the far future, depending on which threshold is considered as acceptable, additional adaptation may be necessary (for the worst-case scenario) or not (for the medium scenario). In this case, solar blinds is considered the additional option for the far future.
Pathway alternative 4 shows that implementing solar blinds is enough for the reference period. In the near future, depending on the threshold level considered, it may (for the medium-case scenario) or may not (for the worst-case scenario) be enough; therefore, additional adaptation will need to be considered (greening). The additional ecosystem-based options can reduce the inside building temperature, reducing the lost working productivity. However, with the information we have, we only know the outside air temperature reduction and not its effect on indoor temperature.
Figure 9 shows all the adaptation pathway alternatives at the building level on a temporal scale. All the adaptation alternatives considered are included and different pathways are illustrated.
All adaptation pathways start with the existing system and, depending on the arrow, can follow soft options, such as changing the working regime, or the city can start to implement more effective, but costly solutions, such as solar blinds and ventilation. Then, additional options need to be implemented in order to keep the LWH below the threshold. The possible pathways are:
Existing system—changing working regime—move to a cooler place—solar blinds;
Existing system—changing working regime—move to a cooler place—ventilation;
Existing system—changing working regime—ventilation;
Existing system—ventilation—green walls;
Existing system—solar blinds—green walls—cool materials or green roofs.
4.2. Adaptation Pathway Alternatives: City Level
At the city level, the adaptation options were grouped into three different adaptation pathway alternatives (
Figure 10).
The first adaptation pathway considers all the adaptation options aiming for the maximum effectiveness capacity of the selected options. The second pathway rejects the adaptation options with the longest implementation time (such as planting 50% extra trees or greening 60% of the city, which are unrealistic for the reference period or the near future). The last pathway considers all options with less land-use barriers (so planting 25% and 50% extra trees, and greening 60% of the city are not considered) and more co-benefits (selecting, for example, pedestrianizing versus traffic reduction as the former has air quality as co-benefit and provides additional social benefits for the population).
Figure 11,
Figure 12 and
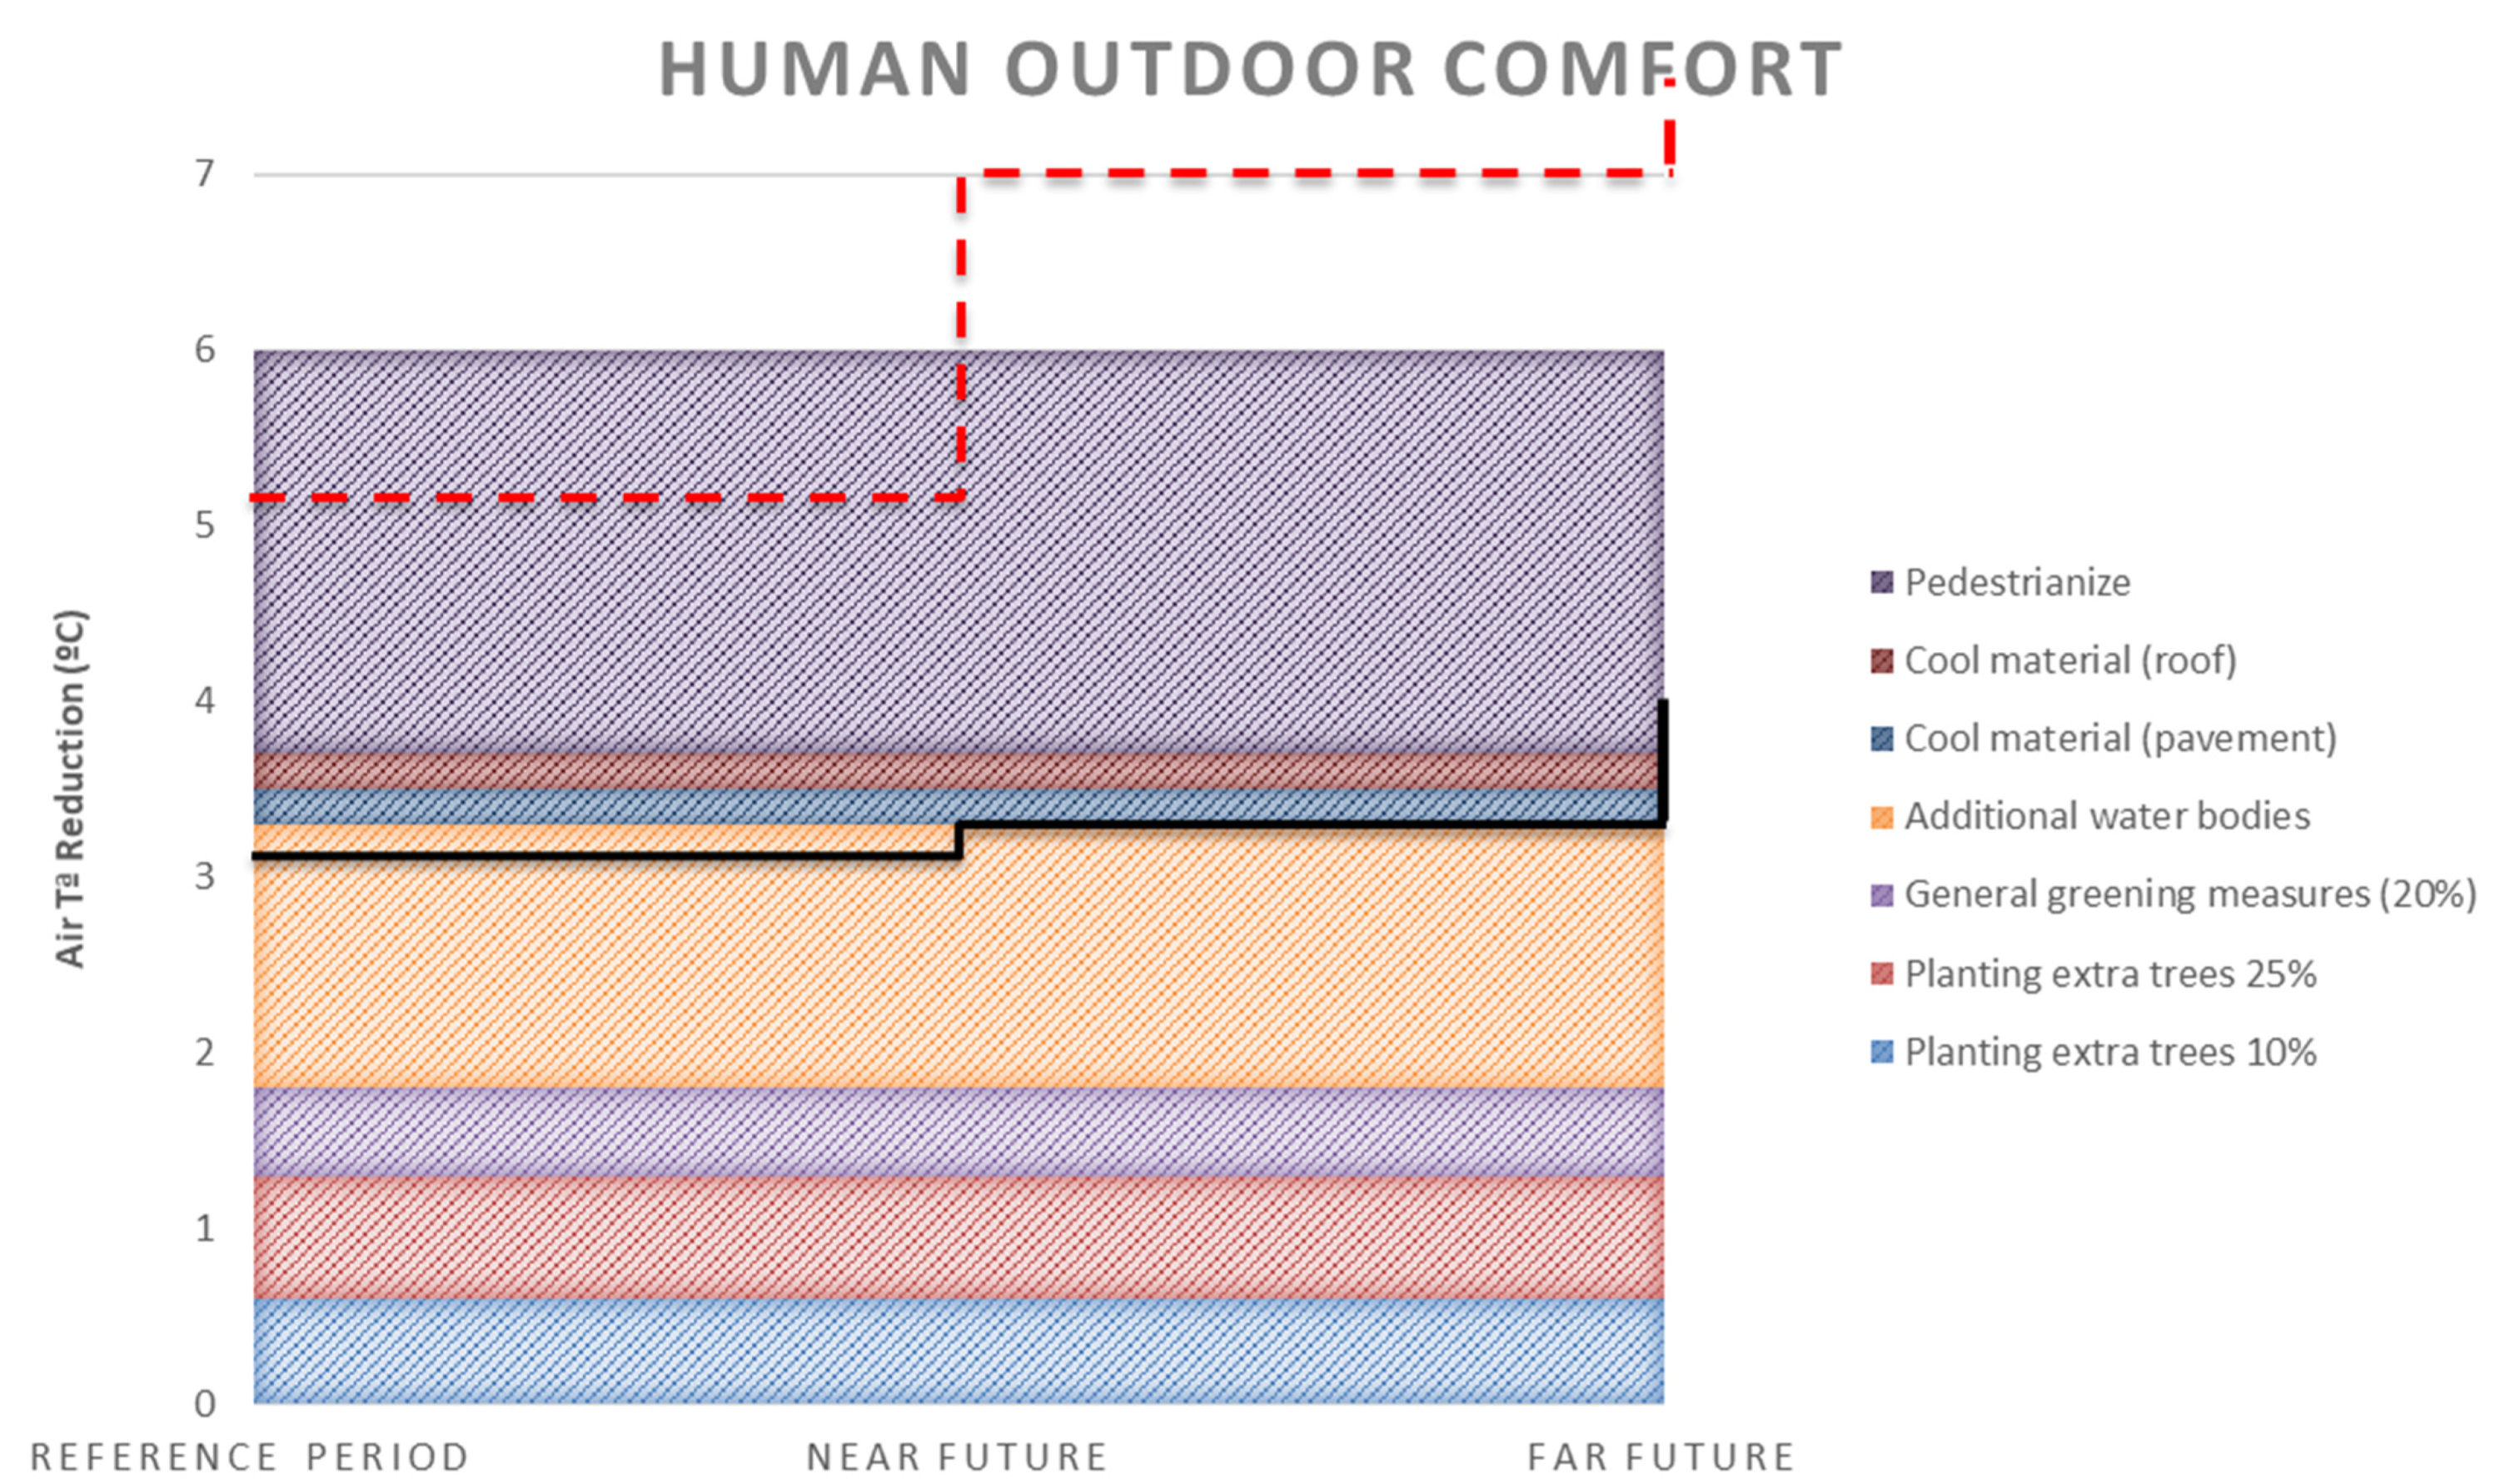
Figure 13 illustrate the adaptation pathway alternatives and the effectiveness in order to identify the group of options that are necessary to reach the thresholds at different periods.
For pathway alternative 1, the considered adaptation options are effective for the three periods. Therefore, some of the adaptation options can be rejected (especially during the reference or near future periods) as air temperature is reduced below the thresholds in some of the options.
Pathway alternative 2 shows that the set of options considered reduces the air temperature below the black threshold line but not below the red threshold line. This pathway is good for the reference period, but the city needs to consider additional options in the near and far future.
Pathway 3 is effective in the reference period and the near future. For the far future, the city needs to include additional adaptation options in order to keep human comfort below the acceptable thresholds. In addition,
Figure 14 shows the adaptation pathway alternatives at the city level on a temporal scale. All the adaptation alternatives considered are included and different pathways are illustrated.
All the adaptation pathways start with the existing system and then the arrows show the different possibilities. In the near future and far future, extra greening is included, as well as urban configuration and accessibility to cool areas. The possible pathways are:
Existing system—planting extra trees (10%)—additional water bodies—cool roofs—cool pavement—pedestrianize—planting extra trees (25%)—greening (20%)—urban configuration—planting extra trees (50%)—greening (60%);
Existing system—planting extra trees (10%)—additional water bodies—cool roof—cool pavement—pedestrianize—planting extra trees (25%)—greening (20%)—accessibility to cool areas;
Existing system—planting extra trees (10%)—additional water bodies—cool roof—cool pavement—traffic reduction—pedestrianize—planting extra trees (25%)—greening (20%)—planting extra trees (50%)—greening (60%)—accessibility to cool areas;
Existing system—planting extra trees (10%)—additional water bodies—cool roof—cool pavement—traffic reduction—pedestrianize—planting extra trees (25%)—greening (20%)—accessibility to cool areas;
Existing system—planting extra trees (10%)—pedestrianize—planting extra trees (25%)—greening (20%)—urban configuration—planting extra trees (50%)—greening (60%)—accessibility to cool areas.
The representation of these pathways allows a visual understanding of the available possibilities. In the future, dialogue is needed with the stakeholders involved in the climate adaptation process to foresee the key elements in the implementation and monitoring of these pathways.
5. Discussion
In the building-level adaptation pathways, the social–behavioral adaptation options, such as changing working schemes or moving workers to cooler places, can avoid more costly options, such as installing solar blinds (especially during the reference period). However, although the morning and evening working scheme (7:00–11:00 and 17:00–20:00) is the most effective of the working schemes, the social acceptance of the first option will be lower because the current working hours in Antwerp are 9:00 to 13:00 in the morning and 14:00 to 17:00 in the afternoon. The other two options entail less changes compared to the current working hours in Antwerp offices.
A tipping point occurs in the near future when these soft options are not enough and structural–technological options, such as solar blinds or ventilation, will need to be implemented to avoid exceeding the LWH threshold of 6% in the near future. The worst-case scenario will occur in the far future, when it will be necessary to implement structural options, such as green roofs, green walls, and cooling materials outside the building to protect the indoor temperature of the building. Notably, the effectiveness of these structural options of greening and including cool material was determined considering outside maximum temperature; we did not assess their the effect on lost working hours. As these adaptation options are planned to be implemented in the near and far future, the city has time to conduct additional research and assess the reduction in lost working hours provided by these options.
In the city-level adaptation pathways, there is a need to implement many adaptation options to keep the current thermal comfort levels below the acceptable threshold (e.g., planting extra trees, additional water bodies, cooling materials, pedestrianizing, traffic reduction, amongst others). Therefore, the use of ecosystem-based or technological options (e.g., green infrastructure and cooling materials) is not enough, and additional options, such as institutional options (e.g., traffic reduction) and grey solutions (urban configuration), will be needed. However, a tipping point occurs in the near future when the initial options will not be enough, and more effort will be required (such as increasing the greening percentage) to reduce the minimum temperature of 7 °C in the near future. The most difficult challenge will occur in the far future, when it will be necessary to include all the identified options to reduce the minimum temperature of 10 °C.
Importantly, the effectiveness of improving the accessibility to cool areas was not assessed in this study. As this adaptation option is planned to be implemented in the near and far future, the city has time to perform additional research. The city has expressed their concern regarding accessibility to cool areas, so it is a potential option to be included in the future in the pathway.
The implementation time of some of the options is too long, which makes them unsuitable in the reference period, such as planting 50% more trees or greening 60% of the city. The mentioned options have implementation barriers related to space availability, creating challenges for their implementation. Therefore, these two options are excluded in the second pathway.
6. Conclusions
The implementation of the pathway approach in Antwerp visualizes the relationship between the three studied elements (individuals, buildings, and city) that need to be considered, as the adaptation options applied at one level affect the others.
Even though the pathway design was presented as a step-by-step methodology, the adaptation pathway approach is a systemic cyclical process with many interdependences. One of the critical aspects of this process is the co-definition of the adaptation objectives based on the thresholds definition. These objectives need to be set by the city stakeholders after obtaining a deeper understanding of the hazard and its potential impacts in the city’s context.
Therefore, we conclude that this adaptation process supports cities in the definition of their plans for urban transitions to their successful adaptation, but also has secondary outcomes for some of the most relevant aspects for climate adaptation for cities: modeling climate projections and scenarios to understand future climate impacts, and to illustrate the effects of specific adaptation options for cities; understanding how to make architecture and infrastructure more resilient to climate change, and how to assess the effects of improved architectural design on cities; evaluating the costs of climate change and the benefits of different adaptation options; and understanding the effects that climate change has on health and how different adaptation options can reduce these impacts on public health.
Another important aspect of the adaptation pathway approach is its flexibility. A step-by-step methodology is defined in this document; each organization can personalize this approach to align with their reality. Therefore, this flexible pathway approach is a method that can support the transition and transformation toward future city resilience, managing the deep climate uncertainty. The adaptation pathways can be designed with different levels of detail depending on the urban context analyzed (hazards affected, socioeconomic characteristics, institutional awareness of climate change, etc.) and the corresponding baselines and starting points (existing diagnostics, adaptation planning already in place, etc.). Depending on the urban context and starting point, the adaptation pathway can be designed at a high level with less resolution or at a detailed level.
The presented study can be improved in several ways. First, indoor thermal comfort and outdoor thermal comfort are critical elements for heat-health impact analysis, as they strongly influence the work productivity and health problems in exposed populations. Our findings highlight the need to strengthen the data collection especially for the indoors indicators. For example, monitoring real thermal conditions will be important to improve the actual pathways. Second, indicators on mortality, morbidity, and even work productivity (absences and days off work) are required to know more about the effectiveness of the implemented adaptation options. Therefore, having this information can provide a good input for the pathway and can allow the pathway to be adjusted according to the evidence. Lastly, this study did not cover the night temperature effect on work and school productivity (the effect of daily temperature was analyzed, but the effect of night temperature was not covered). In future research, it would be beneficial to also consider the night temperature in the analysis of loss of productivity.
Author Contributions
Conceptualization, M.M. and N.P.; methodology, M.M.; H.H. and N.P.; case study implementation, M.M., N.P., G.L. and H.H.; municipality data resources, G.L.; writing—original draft preparation, M.M.; writing—review and editing, M.M., N.P., G.L., J.S., H.H. and S.Z.; visualization, M.M., N.P. and S.Z. All authors have read and agreed to the published version of the manuscript.
Funding
This work was supported by the European Community’s Seventh Framework Programme (grant agreement no. 308497), Project RAMSES “Reconciling Adaptation, Mitigation and Sustainable Development for Cities” (2012–2017). In addition, this study has received partial funding from the European Union’s Horizon 2020 research and innovation programme under grant agreement no. 653522 (RESIN−Climate Resilient Cities and Infrastructures project).
Institutional Review Board Statement
Not applicable.
Informed Consent Statement
Not applicable.
Data Availability Statement
The data presented in this study are available upon request.
Acknowledgments
We thank the rest of the VITO Urban Climate Team for sharing the data collected in the RAMSES FP7 project regarding indoor heat stress.
Conflicts of Interest
The authors declare no conflict of interest.
Appendix A
The following table shows the most sensitive elements at the different levels and the relevant indicators of sensitivity and coping capacity. The latter is divided in two concepts: coping capacity, referring to current situation, and adaptive capacity, referring to a future state.
| Level of Exposure | Sensitivity Indicators | Coping Capacity Indicators |
| Individual | - -
Children (aged 0–17 years), with special attention to the youngest (0–4 years) - -
Isolated people or single elderly (living in a service flat), focusing on those older than 65 years. - -
Elderly, focusing on those older than 65 years.
| Coping capacity:
- -
education level of the population - -
awareness level of the population - -
adaptation options already adopted by the population
Adaptive capacity:
- -
income - -
financial aid
|
| Building | - -
Hospitals - -
Residential care centers (residents > 65 years) - -
Child care - -
Schools
| Coping capacity:
- -
Number of available hospital beds - -
Air conditioning available - -
Building code: building regulations - -
Eco-house green roofs and façades information and subsidies
Adaptive capacity:
- -
Change working schemes - -
Increase daily ventilation - -
Nightly ventilation - -
Install solar blinds - -
Move from south-facing room to north-facing room - -
Higher set point temperature
|
City
Level | - -
Pedestrian/bike lines - -
Public areas - -
Parks
Population particularly exposed in these areas:
- -
Athletes who practice outdoor physical activities - -
Outdoors public workers (gardeners, dustmen, zoo keepers, policemen, etc.) who work in public areas during the hottest hours of the day. - -
The sensitive population that uses parks (e.g., children, elderly, etc.)
| Coping capacity:
- -
Geometric proportion of urban canyons - -
Shadows created by the urban surrounding - -
Distribution and localization of green parks - -
Vegetation elements, such as grass, trees, and green roofs
Adaptive capacity:
- -
Pilot projects: micro-simulations in railway station district, main public spaces, Groenplaats, and Zuiderdokken - -
Definition of ambition heat-neutral city development - -
Green Plan 2015: blue-green macroinfrastructure - -
Functional green planning instrument
|
References
- Naumann, G.; Russo, S.; Formetta, G.; Ibarreta, D.; Forzieri, G.; Girardello, M.; Feyen, L. Global Warming and Human Impacts of Heat and Cold Extremes in the EU, EUR 29959 EN; Publications Office of the European Union: Luxembourg, 2020; ISBN 978-92-76-12954-7. [Google Scholar] [CrossRef]
- Russo, S.; Dosio, A.; Graversen, R.G.; Sillmann, J.; Carrao, H.; Dunbar, M.B.; Singleton, A.; Montagna, P.; Barbola, P.; Vogt, J.V. Magnitude of Extreme Heat Waves in Present Climate and Their Projection in a Warming World. J. Geophys. Res. Atmos. 2014, 119, 12500–12512. [Google Scholar] [CrossRef] [Green Version]
- IPCC. Summary for Policymakers. In Climate Change 2021: The Physical Science Basis. Contribution of Working Group I to the Sixth Assessment Report of the Intergovernmental Panel on Climate Change; MassonDelmotte, V., Zhai, P.A., Pirani, S.L., Connors, C., Péan, S., Berger, N., Caud, Y., Chen, L., Goldfarb, M.I., Gomis, M., et al., Eds.; Cambridge University Press: Cambridge, UK, 2021. [Google Scholar]
- Bruin, K.; Dellink, R.B.; Ruijs, A.; Bolwidt, L.; Buuren, A.; Graveland, J.; Groot, R.S.; Kuikman, P.J.; Reinhard, S.; Roetter, R.P.; et al. Adapting to Climate Change in The Netherlands: An Inventory of Climate Adaptation Options and Ranking of Alternatives. Clim. Chang. 2009, 95, 23–45. [Google Scholar] [CrossRef] [Green Version]
- Stern. Stern Review on the Economics of Climate Change (Pre-Publication Edition). Executive Summary; HM Treasury: London, UK, 2006.
- UNFCCC. Investment and Financial Flows to Address Climate Change; Information Services of the UNFCCC Secretariat: Bonn, Germany, 2007; ISBN 92-9219-042-3. [Google Scholar]
- World Bank. The Costs to Developing Countries of Adapting to Climate Change: New Methods and Estimates. Consultation Draft; World Bank: Washington, DC, USA, 2010. [Google Scholar]
- Sarkar, M.S.K.; Begum, R.A.; Pereira, J.J.; Jaafar, A.H.B. Review of Costs and Methods for Climate Change Adaptation. J. Environ. Sci. Technol. 2012, 5, 397–406. [Google Scholar]
- Walker, W.E.; Haasnoot, M.; Kwakkel, J.H. Adapt or Perish: A Review of Planning Approaches for Adaptation under Deep Uncertainty. Sustainability 2013, 5, 955–979. [Google Scholar] [CrossRef] [Green Version]
- Haasnoot, M.; Kwakkel, J.H.; Walker, W.E.; ter Maat, J. Dynamic Adaptive Policy Pathways: A Method for Crafting Robust Decisions for a Deeply Uncertain World. Glob. Environ. Chang. 2013, 23, 485–498. [Google Scholar] [CrossRef] [Green Version]
- Walker, W.E.; Marchau, V.A.W.J.; Swanson, D. Addressing Deep Uncertainty Using Adaptive Policies: Introduction to Section 2. Technol. Forecast. Soc. Chang. 2010, 77, 917–923. [Google Scholar] [CrossRef]
- Walker, W.E.; Rahman, S.A.; Cave, J. Adaptive Policies, Policy Analysis, and Policy-Making. Eur. J. Oper. Res. 2001, 128, 282–289. [Google Scholar] [CrossRef] [Green Version]
- Haasnoot, M.; Middelkoop, H.; Offermans, A.; van Beek, E.; van Deursen, W.P.A. Exploring Pathways for Sustainable Water Management in River Deltas in a Changing Environment. Clim. Chang. 2012, 115, 795–819. [Google Scholar] [CrossRef] [Green Version]
- Reeder, T.; Ranger, N. How do you adapt in an uncertain world? Lessons from the Thames Estuary 2100 project. In Expert Perspectives Series Written for the World Resources Report 2010–2011; World Resources Institute: Washington, DC, USA, 2010. [Google Scholar]
- Gersonius, B.; Morselt, T.; van Nieuwenhuijzen, L.; Ashley, R.; Zevenbergen, C. How the Failure to Account for Flexibility in the Economic Analysis of Flood Risk and Coastal Management Strategies Can Result in Maladaptive Decisions. J. Waterw. Port Coast. Ocean Eng. 2012, 138, 386–393. [Google Scholar] [CrossRef] [Green Version]
- Kim, K.; Park, H.; Kim, H. Real Options Analysis for Renewable Energy Investment Decisions in Developing Countries. Renew. Sustain. Energy Rev. 2017, 75, 918–926. [Google Scholar] [CrossRef]
- Linquiti, P.; Vonortas, N.S. The Value of Flexibility in Adapting to Climate Change: A Real Options Analysis of Investments in Coastal Defense. Clim. Chang. Econ. 2012, 3, 1250008. [Google Scholar] [CrossRef] [Green Version]
- Swart, R.J.; Raskin, P.; Robinson, J. The Problem of the Future: Sustainability Science and Scenario Analysis. Glob. Environ. Chang. 2004, 14, 137–146. [Google Scholar] [CrossRef]
- Zhang, S.X.; Babovic, V. A Real Options Approach to the Design and Architecture of Water Supply Systems Using Innovative Water Technologies under Uncertainty. J. Hydroinform. 2012, 14, 13–29. [Google Scholar] [CrossRef]
- Harvey, H.; Hall, J.; Peppé, R. Computational Decision Analysis for Flood Risk Management in an Uncertain Future. J. Hydroinform. 2012, 14, 537–561. [Google Scholar] [CrossRef] [Green Version]
- Hallegatte, S. Strategies to Adapt to an Uncertain Climate Change. Glob. Environ. Chang. 2009, 19, 240–247. [Google Scholar] [CrossRef]
- Mendizabal, M.; Abajo, B.; Martinez, J.A.; Gutierrez, L.; García-Blanco, G.; Feliu, E. Deliverable 8.2 Transition Model; 2016 RAMSES Project (Grant Agreement No. 308497). Available online: https://ramses-cities.eu/index.php?eID=tx_nawsecuredl&u=0&file=fileadmin/fe_file_repository/08_Workpackage_8/Deliverable%208.2/D8_2_Transition_Model_RAMSES__1_.pdf&t=1634372703&hash=1ef35cc31f8602753c60e0e1a5f2247c93f90836 (accessed on 10 September 2021).
- Barnett, J.; Graham, S.; Mortreux, C.; Fincher, R.; Waters, E.; Hurlimann, A. A Local Coastal Adaptation Pathway. Nat. Clim. Chang. 2014, 4, 1103–1108. [Google Scholar] [CrossRef]
- Kingsborough, A.; Borgomeo, E.; Hall, J.W. Adaptation Pathways in Practice: Mapping Options and Trade-Offs for London’s Water Resources. Sustain. Cities Soc. 2016, 27, 386–397. [Google Scholar] [CrossRef]
- Lawrence, J.; Reisinger, A.; Mullan, B.; Jackson, B. Exploring Climate Change Uncertainties to Support Adaptive Management of Changing Flood-Risk. Environ. Sci. Policy 2013, 33, 133–142. [Google Scholar] [CrossRef]
- Rosenzweig, C.; Solecki, W. Hurricane Sandy and Adaptation Pathways in New York: Lessons from a First-Responder City. Glob. Environ. Chang. 2014, 28, 395–408. [Google Scholar] [CrossRef] [Green Version]
- Siebentritt, M.; Halsey, N.; Smith, M.S. Regional Climate Change Adaptation Plan for the Eyre Peninsula. Prepared for the Eyre Peninsula Integrated Climate Change Agreement Committee. 2014, p. 67. Available online: file:///C:/Users/MONICA~1/AppData/Local/Temp/climate-change-adaptation-2014-plan.pdf (accessed on 10 September 2021).
- Wise, R.M.; Fazey, I.; Stafford Smith, M.; Park, S.E.; Eakin, H.C.; Archer Van Garderen, E.R.M.; Campbell, B. Reconceptualising Adaptation to Climate Change as Part of Pathways of Change and Response. Glob. Environ. Chang. 2014, 28, 325–336. [Google Scholar] [CrossRef] [Green Version]
- Hooyberghs, H.; Verbeke, S.; Lauwaet, D.; Costa, H.; Floater, G.; De Ridder, K. Influence of Climate Change on Summer Cooling Costs and Heat Stress in Urban Office Buildings. Clim. Chang. 2017, 144, 721–735. [Google Scholar] [CrossRef]
- Mendizabal, M.; Peña, N.; García-Blanco, G.; Feliu, E.; Terenzi, A.; Latinos, V.; Peleikis, J.; Anza Porras, B.; Forino, G.; Firus, K.; et al. RAMSES Transition Handbook & Training Package; TMG ICLEI European Secretariat: Freiburg, Germany, 2018; 119p. [Google Scholar] [CrossRef]
- Tapia, C.; Abajo, B.; Feliu, E.; Mendizabal, M.; Martinez, J.A.; Fernández, J.G.; Laburu, T.; Lejarazu, A. Profiling Urban Vulnerabilities to Climate Change: An Indicator-Based Vulnerability Assessment for European Cities. Ecol. Indic. 2017, 78, 142–155. [Google Scholar] [CrossRef]
- ISO 7243:2017 Ergonomics of the Thermal Environment—Assessment of Heat Stress using the WBGT (Wet Bulb Globe Temperature) Index. Available online: https://www.iso.org/obp/ui/#iso:std:iso:7243:ed-3:v1:en (accessed on 10 September 2021).
- Kjellstrom, T.; Gabrysch, S.; Lemke, B.; Dear, K. The ‘Hothaps’ Programme for Assessing Climate Change Impacts on Occupational Health and Productivity: An Invitation to Carry out Field Studies. Glob. Health Action 2009, 2, 2082. [Google Scholar] [CrossRef] [PubMed]
- Kjellstrom, T.; Holmer, I.; Lemke, B. Workplace Heat Stress, Health and Productivity—An Increasing Challenge for Low and Middle-Income Countries during Climate Change. Glob. Health Action 2009, 2, 2047. [Google Scholar] [CrossRef] [PubMed]
- Bernard, T.; Pourmoghani, M. Prediction of Workplace Wet Bulb Global Temperature. Appl. Occup. Environ. Hyg. 1999, 14, 126–134. [Google Scholar] [CrossRef]
- Hooyberghs, H.; Lauwaet, D.; Lefebvre, W.; Maiheu, B.; de Ridder, K.; González-Aparicio, I.; Acero, J.A.; Mendizabal, M. Agglomeration-Scale Urban Climate and Air Quality Projections; D4.2 from RAMSES Project; Grant Agreement No. 308497 (Project RAMSES). 2015. Available online: https://ramses-cities.eu/fileadmin/uploads/Deliverables_Uploaded/D4.2_Agglomeration-scale_urban_climate_and_air_quality_projections.pdf (accessed on 10 September 2021).
- Parsons, K. Heat Stress Standard ISO 7243 and Its Global Application. Ind. Health 2006, 44, 368–379. [Google Scholar] [CrossRef]
- Sherwood, S.C.; Huber, M. An Adaptability Limit to Climate Change Due to Heat Stress. Proc. Natl. Acad. Sci. USA 2010, 107, 9552–9555. [Google Scholar] [CrossRef] [Green Version]
- Mendizabal, M.; Peña, N. Transition Reports for the Selected Case Studies; D8.3 from RAMSES Project; Grant Agreement No. 308497 (Project RAMSES). 2017. Available online: https://ramses-cities.eu/index.php?eID=tx_nawsecuredl&u=0&file=fileadmin/fe_file_repository/08_Workpackage_8/Deliverable%208.3/D8.3_Transition_Reports_for_the_selected_case_studies-min.pdf&t=1634373381&hash=8e9a4253a240309caa66de4bfa8b4617dba5b0a4 (accessed on 10 September 2021).
- IPCC. Climate Change 2014: Impacts, Adaptation, and Vulnerability. Final Draft IPCC WGII AR5; IPCC: Geneva, Switzerland, 2014; p. 2593. [Google Scholar]
- ISO 14090:2019(En) Adaptation to Climate Change—Principles, Requirements and Guidelines; ISO: Geneve, Switzerland, 2019.
- Mendizabal, M.; Gutierrez, L.; Carreño, S.; Martínez, J.A.; García, G.; Abajo, B.; Feliu, E. Standardization of Adaptation Measures, Heat Related Adaptation Option Harmonization; D3.4. This Document Has Been Prepared in the Framework of the European Project RESIN—Climate Resilient Cities and Infrastructures. 2016. Available online: https://www.researchgate.net/publication/342067487_Standardization_of_adaptation_measures (accessed on 10 September 2021).
- Moser, S.C.; Ekstrom, J.A. A Framework to Diagnose Barriers to Climate Change Adaptation. Proc. Natl. Acad. Sci. USA 2010, 107, 22026–22031. [Google Scholar] [CrossRef] [Green Version]
Figure 1.
RAMSES pathway approach and its alignment with the Urban Adaptation Support Tool.
Figure 1.
RAMSES pathway approach and its alignment with the Urban Adaptation Support Tool.
Figure 2.
Expected impacts identified by level of exposure.
Figure 2.
Expected impacts identified by level of exposure.
Figure 3.
Institutional (bordered in green), social (shaded in gray), and structural (shaded in black) adaptation options already adopted (bordered in red), and new options.
Figure 3.
Institutional (bordered in green), social (shaded in gray), and structural (shaded in black) adaptation options already adopted (bordered in red), and new options.
Figure 4.
Adaptation pathway alternatives grouped according several criteria.
Figure 4.
Adaptation pathway alternatives grouped according several criteria.
Figure 5.
Pathway alternative 1 for work productivity: (a) considering the morning and evening working scheme (7:00–11:00 and 17:00–20:00); (b) considering a working scheme of 7:00–12:00 and 15:00–17:00; and (c) considering only a morning working scheme (6:00–13:00). The dashed red line indicates the worst-case scenario threshold and the black line indicates the medium-case scenario threshold.
Figure 6.
Pathway alternative 2 for work productivity: (a) considering a working scheme of 7:00–11:00 and 17:00–20:00; (b) considering a working scheme of 7:00–12:00 and 15:00–17:00; and (c) considering a working scheme of 6:00–13:00. The dashed red line is the worst-case scenario threshold and the black line is the medium-case scenario threshold.
Figure 7.
Pathway alternative 3 for work productivity. The dashed red line indicates the worst-case scenario threshold and the black line indicates the medium-case scenario threshold.
Figure 7.
Pathway alternative 3 for work productivity. The dashed red line indicates the worst-case scenario threshold and the black line indicates the medium-case scenario threshold.
Figure 8.
Pathway alternative 4 for work productivity: (a) considering solar blinds (part 1); and (b) considering ecosystem-based options (part 2). The dashed red line indicates the worst-case scenario threshold and the black line is the medium-case scenario threshold.
Figure 8.
Pathway alternative 4 for work productivity: (a) considering solar blinds (part 1); and (b) considering ecosystem-based options (part 2). The dashed red line indicates the worst-case scenario threshold and the black line is the medium-case scenario threshold.
Figure 9.
Building-level adaptation pathway. The different pathways are indicated with arrows. In the bottom part, the lost working productivity (LWP, %) is presented; the upper part presents the maximum temperature values in different time periods (reference, near future, and far future). The adaptation options indicated in light blue need to be implemented as soon as possible. Darker blue indicates the adaptation options that need to be implemented in the near future. The dark blue represents the adaptation options that need to be implemented in the far future. The effectiveness of the adaptation options indicated in green has not been assessed in terms of LWP, but their effectiveness on air temperature reduction is described.
Figure 10.
Adaptation options linked with lines with 3 adaptation pathway alternatives considering the following grouping criteria—implementation time, land-use barriers, and co-benefits—and considering all options.
Figure 10.
Adaptation options linked with lines with 3 adaptation pathway alternatives considering the following grouping criteria—implementation time, land-use barriers, and co-benefits—and considering all options.
Figure 11.
Adaptation pathway 1 for human comfort. The dashed red line is the worst-case scenario threshold and the black line is the medium-case scenario threshold.
Figure 11.
Adaptation pathway 1 for human comfort. The dashed red line is the worst-case scenario threshold and the black line is the medium-case scenario threshold.
Figure 12.
Adaptation pathway 2 for human comfort. The dashed red line is the worst-case scenario threshold and the black line is the medium-case scenario threshold.
Figure 12.
Adaptation pathway 2 for human comfort. The dashed red line is the worst-case scenario threshold and the black line is the medium-case scenario threshold.
Figure 13.
Adaptation pathway 3 for human comfort. The dashed red line is the worst-case scenario threshold and the black line is the medium-case scenario threshold.
Figure 13.
Adaptation pathway 3 for human comfort. The dashed red line is the worst-case scenario threshold and the black line is the medium-case scenario threshold.
Figure 14.
City-level adaptation pathway. Different pathways are illustrated (with arrows). In the bottom part, the minimum temperature (°C) threshold is presented, and the upper part presents the minimum temperature values in different time periods (reference, near future, and far future). The adaptation options indicated in light blue need to be implemented as soon as possible. Those in darker blue need to be implemented in the near future. The dark blue represents the adaptation options that need to be implemented in the far future. The effectiveness of the adaptation option in green has not been assessed, but it is considered in the pathway.
Table 1.
Number of times that the federal plan would be triggered based on mean values of the climatic projections.
Table 1.
Number of times that the federal plan would be triggered based on mean values of the climatic projections.
| Period | No. of Times (per Period) | No. of Times (per Year) |
|---|
| 2009–2013 | 4 | 1 |
| 2026–2045 | 31 | 1.6 |
| 2081–2100 | 80 | 4.2 |
Table 2.
The maximum, minimum, and average temperatures involved in each event that would trigger the federal plan. All values are in °C.
Table 2.
The maximum, minimum, and average temperatures involved in each event that would trigger the federal plan. All values are in °C.
| Period (Years) | Maximum, Minimum, and Average | Tmax | Tmin |
|---|
| 2010–2013 | Max | 33.1 | 23.09 |
| Average | 31.95 | 21.11 |
| 2026–2045 | Max | 36.7 | 24.3 |
| Average | 32.23 | 21.22 |
| 2081–2100 | Max | 40.18 | 27.23 |
| Average | 32.81 | 22.21 |
| Publisher’s Note: MDPI stays neutral with regard to jurisdictional claims in published maps and institutional affiliations. |
© 2021 by the authors. Licensee MDPI, Basel, Switzerland. This article is an open access article distributed under the terms and conditions of the Creative Commons Attribution (CC BY) license (https://creativecommons.org/licenses/by/4.0/).


