1. Introduction
The shrinking city is a young, crucial issue related to human sustainably development which needs to be given more attention. It is not a new thing, but it is a new problem that needs to be solved urgently. After the industrial revolution, cities grew explosively [
1]. Both the number and the size of cities have shown a rapid growth which is unprecedented in human history. Since the 1990s, the urbanization rates of the United Kingdom, the United States, Germany, and France have far exceeded 50% [
2,
3,
4,
5]. However, at the beginning of the 20th century, some cities in these countries ended their growth process, and a series of problems such as urban population decline, economic recession, industrial imbalance, and a surge in unemployment appeared. For example, Leipzig, Germany, lost more than 100,000 people from 1951 to 1998, accounting for 20% of the total population [
6]; Liverpool, the United Kingdom, began to experience a large-scale population decline in the mid-19th century. As of 2008, its population had decreased by 49% compared to 1931 [
7]. Similar cases include the city of Hakodate in Japan, Detroit and Pittsburgh in the United States, and Leksa in Finland, etc. These cities all once flourished during the industrialization period, but they have all undergone a historic transformation from prosperity to decline.
The phenomenon of the shrinking city does not only appear in highly urbanized developed countries. In the process of large-scale urbanization, shrinking cities in China have begun to appear. China’s urbanization has entered the turning point of the times, with large cities that cannot be contained on the one hand, and small cities that cannot be supported on the other [
2]. Relevant studies have used different statistical calibers to identify and analyze shrinking cities. Due to the differences in the definition and the criteria of a shrinking city, the results obtained by related scholars are not in complete accord. After analyzing the data of the Fifth Census (2000) and the Six Census (2010), Zhang believed that more than 26% of the prefecture-cities and 37% of the county-level cities in China have experienced relative shrinking [
3,
4]; Long pointed out that between 2000 and 2010, 180 cities in China experienced negative population growth [
5]. After analyzing the data of 663 cities in China from 2007 to 2016, Wu found that 84 cities had different degrees of shrinking [
6,
7]. Although the conclusions obtained by various scholars are different, it should not be ignored that these results show that the phenomenon of urban shrinkage has indeed occurred in China. Furthermore, the number and scale of the shrinking cities are still expanding.
In order to reveal the mechanism of the population loss and the series of problems, the “shrinking city” was formally proposed by scholars [
8], and a few scholars have carried out in-depth research on it and achieved a series of fruitful results. As shown in
Table 1, de-industrialization, suburbanization, and political system transformation have become the main reasons for the shrinking cities in European and American countries [
9,
10].
Due to the late start of urbanization in China, the shrinking city mainly occured in the 21st century, with the data explosion and rapid development of science and technology. Therefore, the phenomenon of the shrinking city in China not only has similar incentives to the developed countries but also has its unique side. The continuous construction and improvement of infrastructures such as transportation networks and telecommunications have greatly increased the flow of the population and resources in China. Besides this, many cities have abolished household registration restrictions, and some cities have provided excellent talent introduction policies to attract talents. The weakening and canceling of the restriction policy and the establishment and strengthening of the encouragement policy are gradually breaking the shackles of the population flow in China. According to China’s national census data, in 2010, 261 million people left their registered places for more than half a year, with 82% of the total migrants being in eastern cities and 18% in being in central and western cities. Since the 21st century, China’s population migration has become larger, faster and more frequent.
Urbanization is the process of population and resource agglomeration. In the urbanization process, some cities continue to expand, while others shrink. City shrinkage has many causes, such as economic development, climate, location, political factors and so on [
32]. However, to sum up, the final reason is the city’s decreased attraction. The gathering of resources accelerates the gathering of the population, and the value creation and consumption demand of the population gathering further promote the re-distribution of resources. Cities with strong “attraction” tend to gather a lot of excellent resources and become the inflow places of population, while cities with weak “attraction” naturally become outflow places. Therefore, we proposed the hypothesis that urban resources are a combination of the ability of cities to compete for external resources and the reflection of the endowment of urban resources. The level of urban resources is closely related to urban shrinkage. The level of urban resources determines the attractiveness of the city, reflecting the direct cause of urban shrinkage. However, few pieces of literature conducted an in-depth analysis of the shrinking city from the urban resource perspective. The objectives in this study are therefore to: (1) establish the URD model to measure the urban resource degree, and (2) to select factors to analyze how they influence the shrinking cities. Given the spillover effect and heterogeneity of the influencing factors, SDM and GTWR were used to conduct a spatial spillover (SSM) and spatial heterogeneity (SHM) analysis of the URD of shrinking cities in northeast China. Finally, policy implications are proposed to provide supports for policy-making.
2. Urban Resource Degree (URD) of the Shrinking Cities
2.1. Methodology
URD is the synthesis metric of the city’s ability to compete for external resources and the resource endowment. Here, the resource is a general concept involving all of the tangible and intangible necessities for urban development, such as land, water, labor, culture, policy, and so on. Previous pieces of literature have focused on the URD from the perspectives of urban competitiveness [
33,
34,
35,
36,
37] and sustainability development [
38,
39,
40,
41,
42]. Although these focuses can reflect the URD to some degree, they are more comprehensive conceptual frameworks which are not limited to the URD. Therefore, they cannot be used to analyze URD accurately and pertinently. Besides this, some scholars have conducted an in-depth analysis of the resources between different cities [
43,
44,
45,
46,
47] and different industries [
48,
49,
50,
51] in urban agglomeration through the gravity model. The gravity model can reflect the resource competence ability of two cities exactly, but cannot reflect the resource competence ability of one city compared to all other cities. From the concept of URD, it can be said that industrial agglomeration is the external performance of URD, and URD is the internal motivation of urban industrial agglomeration. Therefore, this paper proposed a weighted comprehensive industrial agglomeration model (WCIA) to measure the city’s URD. The WCIA is as follows:
- (1)
Spatial Gini coefficient
is the total Gini coefficient of industry i; is the Gini coefficient of industry i in city j; xj is the percentage of the total employment in city j compared to the total employment in an urban agglomeration. Sij is the ratio of industry i in city j to the total employment of industry i in an urban agglomeration. indicates that the industrial agglomeration degree is high. Otherwise, shows that the industrial distribution is balanced.
- (2)
Weight assignment
Suppose that there is an industry set of city
i The Gini coefficient of industry
j in city
i at time
t is recorded as
. The decision sets are as follows:
According to the numerical properties of
xtij, it can be divided into the positive index and negative index. In this paper, the range transformation method is used to normalize the positive index and negative index.
and
are the positive normalization index and negative normalization index, respectively.
and
are the maximum and minimum values of the
j-th index. The weight of industry
j of the city
i in time
t is
where
. The entropy of industry
j in time
t is
The weight of the Gini coefficient of industry
j in time
t is
- (3)
Urban resource degree (URD)
This paper combines the level of industrial agglomeration to form the overall concept of urban resources to reflect the city’s resource endowment and its ability to compete for external resources. In Equation (8),
is the URD of city
i at time
t;
is the Gini coefficient of industry
i in city
j at time
t.
2.2. Materials and Indicators Selection
The Shrinking City International Research Network (SCIRN) formally defined urban shrinkage as a city that has at least 10,000 residents, has experienced negative population growth for more than 2 years, and has undergone some structural crisis in economic structural transformation [
52]. Since then, relevant research focused on urban shrinkage has achieved fruitful results. Oswalt defines urban shrinkage as cities that will lose a large number of residents, and stipulates that the annual population loss rate should be more than 1% [
53]. After the establishment of the “China Shrinking Cities Research Network”, scholars have systematically combed and summarized previous research and analyzed the development status of urban shrinkage in China. Zhang [
54] and Long et al. [
55] measured China’s urban shrinkage through the data of the two national censuses in 2000 and 2010. Meanwhile, Zhang et al. judged China’s shrinking cities as “one body, two wings and three dimensions” based on remote sensing data and geospatial data [
56]. Liu et al. analyzed shrinking cities based on night light data [
57].
Here, we can know that the academic community has not yet reached a consensus on the criteria for the determination of urban shrinkage, but the generally agreed upon view is that the decrease in the urban population is the core feature of shrinking cities. Professor Wu Kang of Capital University of Economics and Trade comprehensively interpreted the definition of the shrinking city, and based on the urban population data of municipalities directly under the central government, provincial capital cities, prefecture-level cities and county-level cities from 2007 to 2016, the cities with a lower population in 2016 than in 2007 and negative population growth in three consecutive natural years were identified [
58]. Results showed that 80 out of 660 cities meet the criteria for shrinking cities.
There are 24 shrinking cities (see
Table 2) in the three provinces of Northeast China, accounting for 30% of the total shrinking cities. The three provinces in Northeast China are an old industrial base in China. In the 1930s, the most advanced industrial system in Northeast Asia was built, which once occupied 98% of China’s heavy industrial base. In recent years, there has been a slowdown in the speed of economic development and the phenomenon of population outflow, resulting in a large number of shrinking cities. Northeast China is an important industrial agglomeration and economic development pioneer in China. However, there is a lot of urban shrinkage in these areas. It is worth exploring the deep-seated reasons for this phenomenon. Therefore, 24 shrinking cities in Northeast China were taken as research objects, and the URD was measured.
2.3. Data Source
In China, there are 20 industry categories, 97 major categories, 473 medium categories and 1380 sub categories according to the National Economic Industry Classification Standard compiled by the National Bureau of Statistics. Given the research’s purpose and operability, data-accessible, resource-intensive industries were selected as the sector indicators to measure the urban resource degree. Only the agglomeration of high-tech, high value-added and resource-intensive industries can truly reflect the level of urban resources. To reflect the URD of cities, we selected the manufacturing industry; mining industry; scientific research and technical service industry; information transmission, software and information technology service industry; and financial industry. The relevant data are from China Statistical Yearbook, China Urban Statistical Yearbook, China Urban Construction Statistical Yearbook, China Energy Statistical Yearbook, and the Urban Statistical Yearbook, the regional statistical bulletin, and some network data from some provinces, municipalities, prefecture-level cities and county-level cities.
2.4. Urban Resource Degree (URD)
The URD of 24 cities in Northeast China from 2007 to 2016 is listed in
Table 3.
From
Figure 1, the overall performance of the URD in Liaoning province is in the state of being basically stable, with a small fluctuation from 2007 to 2016. For the five prefecture-level cities, the URD of Fuxin was at a low level from 2007 to 2016, with a small fluctuation between 0.1 and 0.26. Besides this, Jinzhou’s URD also remained at a low level. Except for 0.33 in 2012 and 0.42 in 2014, the other years were below 0.3. The URD of Fushun decreased significantly in 2013, and remained around 0.4 in the other years. After the comparison of 2007 to 2016, the overall performance of Fuxin, Jinzhou and Fushun’s URD declined slightly in the past ten years. Instead, the URD of Anshan and Yingkou was kept above 0.4, except in 2013, and presented a slight increase in the period. The URD of the only two county-level cities, Haicheng and Beipiao, of the seven shrinking cities in Liaoning Province changed greatly from 2007 to 2016. The URD of Haicheng experienced a great decline, a sharp rise, and then a substantial decline change: the URD of Haicheng (1) decreased from 0.256 to 0.047 in 2007–2009; (2) increased from 0.047 to 0.586 in 2009–2014; and (3) decreased from 0.586 to 0.162 in 2016. In contrast, the URD of another county-level city, Beipiao, was always the lowest in the seven shrinking cities in Liaoning Province. The changes of the URD are shown in
Figure 2,
Figure 3 and
Figure 4.
From
Table 3, the URD in Liaoning shows a trend of rising first and then decreasing. The resource degree of the cities in Jilin and Heilongjiang fluctuates slightly at a relatively low level.
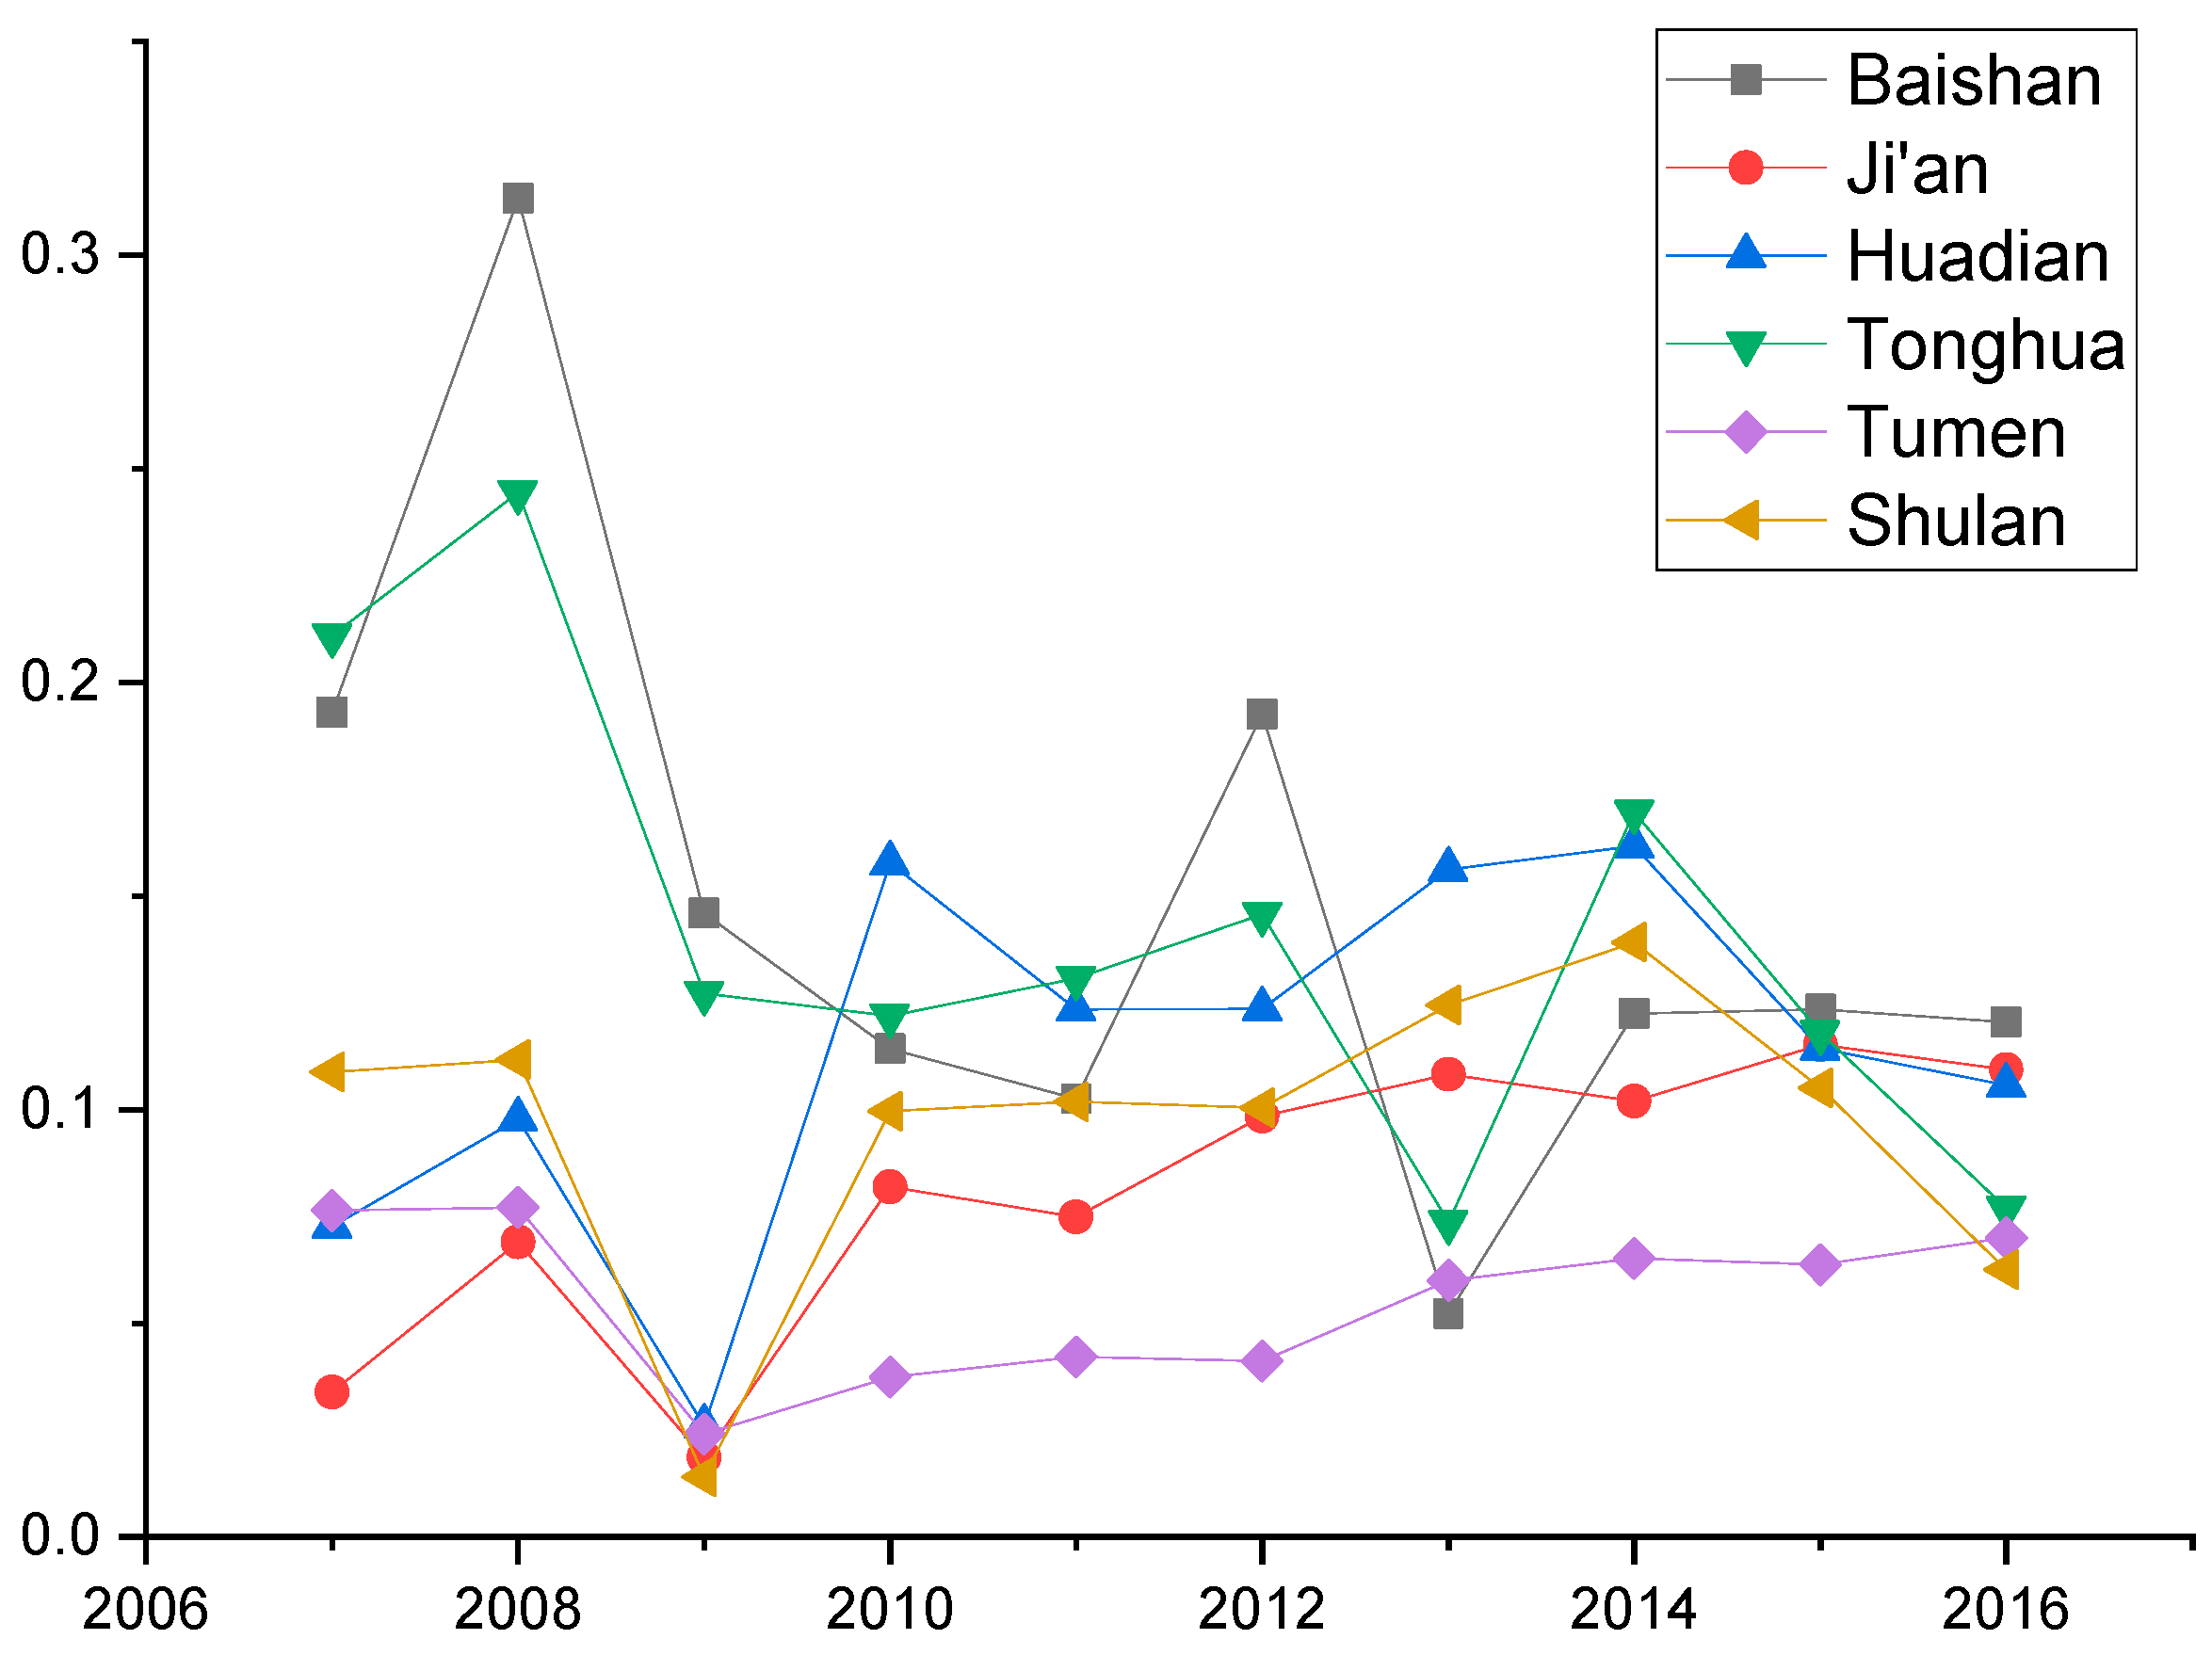
Figure 2 illustrates the changes of the URD in the six shrinking cities in Jilin. Although the URD changes in the six cities are different, the differences are gradually narrowing and tending to converge. It is worth noting that the six shrinking cities were in a state of less than 0.2, except for Tonghua and Baishan in 2008. Tonghua and Baishan are the only two prefecture-level cities of the six shrinking cities in Jilin. As shown in
Figure 3, the URD of Tonghua and Baishan were at high levels from 2007 to 2009, which were much higher than those of the other cities in the period. The URD of the two cities reached peaks which were 0.313 and 0.245, respectively. However, after 2009, compared with other shrinking cities, the URD of Tonghua and Baishan no longer existed. In 2016, the URD of the two cities was 0.077 and 0.120, respectively, and the difference with other cities almost disappeared. As for Huadian, Shulan, Ji’an and Tumen, the URD of the four county-level cities was less than that of the two prefecture-level cities. As of 2016, the URDs of Ji’an and Huadian were 0.109 and 0.106, which increased by 0.076 and 0.033, compared with 0.034 and 0.073 in 2007. However, the URD of Tumen and Shulan decreased from 0.076 and 0.109 in 2007 to 0.07 and 0.062 in 2016, respectively.
In conclusion, the URD of the six shrinking cities in Jilin Province had a short-term upward fluctuation from 2007 to 2016, but the overall trend was downward. Besides this, the gap of the URD between the prefecture-level city and county-level city gradually narrowed. Tonghua and Baishan lost the advantages brought by their administrative levels.
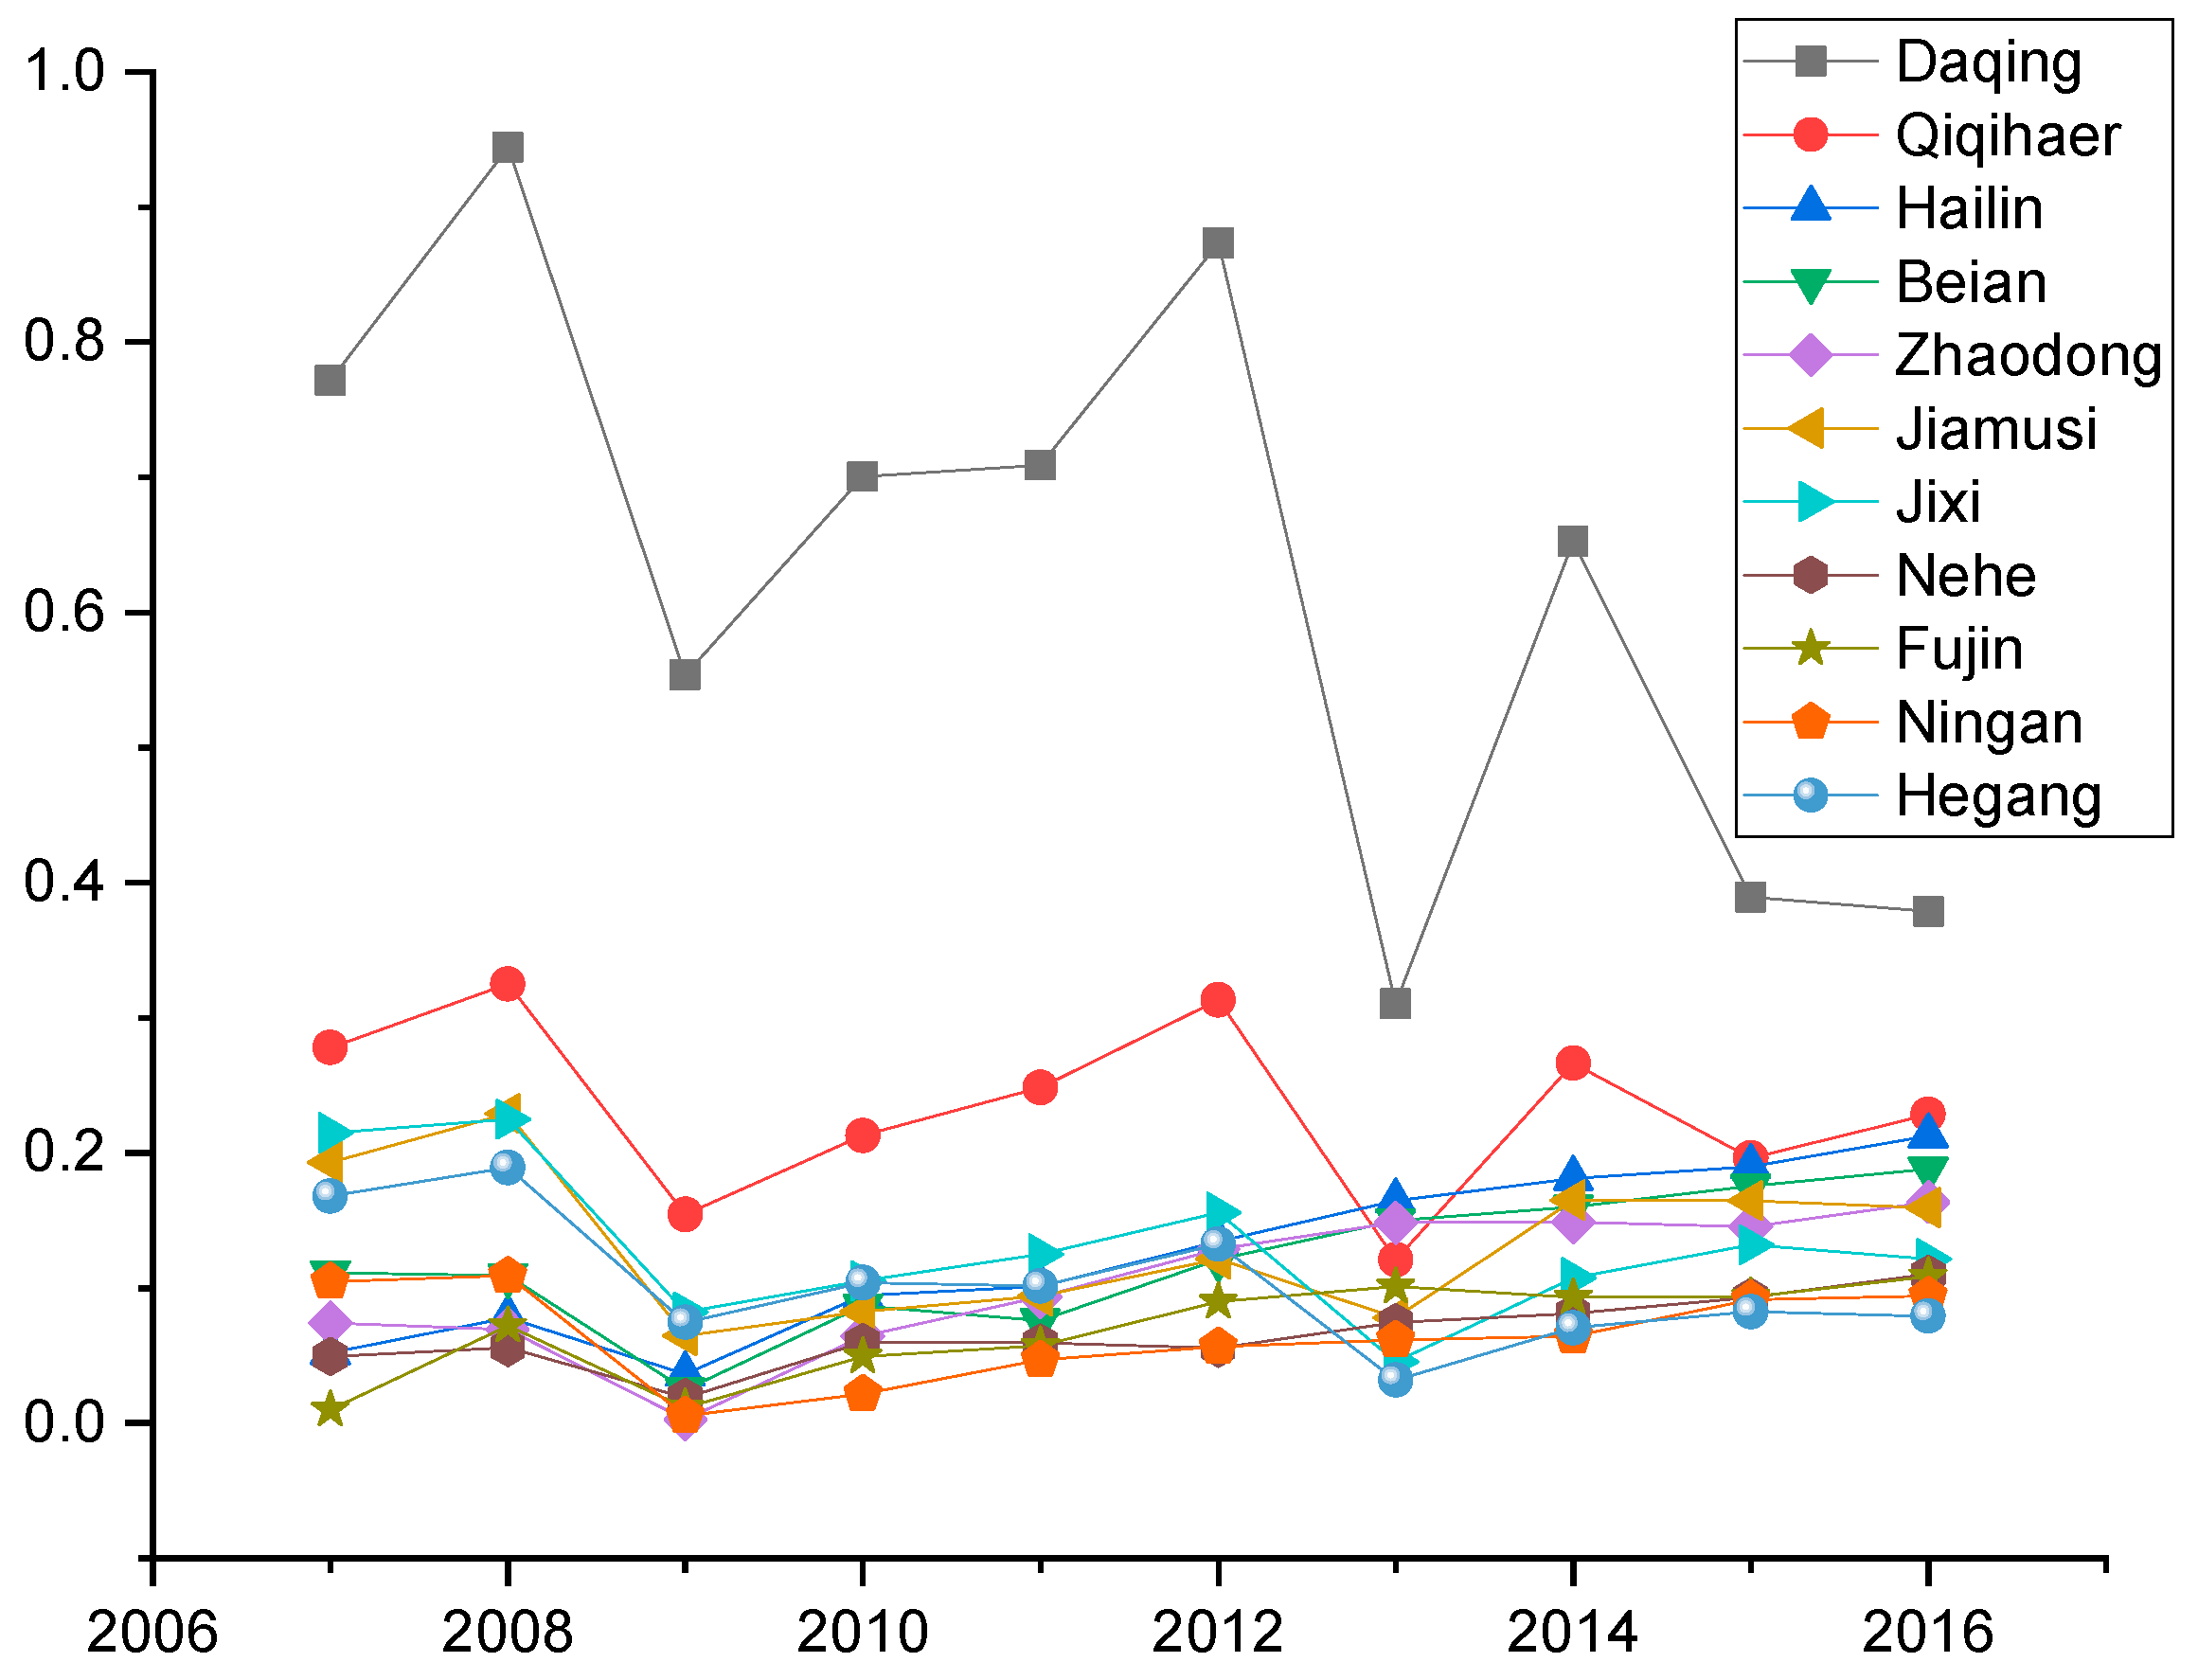
In
Figure 3, there are six county-level cities and five prefecture-level cities in Heilongjiang Province. Notably, although it has decreased over the years, the URD of Daqing is far higher than that of other shrinking cities in Heilongjiang Province. Besides this, the URD of other prefecture-level shrinking cities, e.g., Jixi, Jiamusi, Qiqihar and Hegang, had different changes in the periods. The URD of Qiqihar was between 0.2 and 0.33, and ranks the second among 11 cities, only next to that of Daqing. Unlike that of Daqing and Qiqihar, the URD of Jixi and Jiamusi fluctuated slightly from 0.08 to 0.22, and always ranked the third to sixth among the 11 cities. Besides this, the URD of the final prefecture-level shrinking city, Hegang, declined sharply after 2013, and was the last in the 11 shrinking cities in 2013, 2015 and 2016. Compared with the prefecture-level cities, the URD of the six county-level cities of Hailin, Bei’an, Zhaodong, Fujin, Nehe, and Ning’an were all ranked behind the five prefecture-level cities before 2012. However, after 2013, the URD of Hailin, Bei’an and Zhaodong increased significantly, and they always ranked second to sixth among the 11 cities.
In summary, over time, the advantage of the URD of prefecture-level cities gradually weakened. On the contrary, the URD in county-level cities increased slightly, and the ability of cities to compete for and control resources increased.
3. Factors That Influence the URD and how, from the Spatial Spillover and Spatial Heterogeneity Perspectives
3.1. Influence Factors
In order to reflect various points of the previous pieces of literature from different perspectives, this paper conducted a literature review to extract the influence factors of URD. In order to avoid multicollinearity, this paper selects factors based on representativeness and the minimalist principle. We used the Factor Analysis Method (FAM) to reduce the dimension of 29 influences in
Table 4. According to the relevant experience, the selected eigenvalues of the principal components must be greater than 1, and the cumulative variance contribution rate should be more than 80%. Therefore, given the results in 2007, 2011 and 2016, the top 10 principal components with cumulative variance contribution rates of 83%, 91% and 89% were selected. The rotating component matrix of the influencing factors of URD is shown in
Table 4.
Factors: X1—R&D investment; X2—Number of patent applications; X3—Actual use of foreign capital; X4—SME registration application approval cycle; X5—House price to income ratio; X6—GDP per capita; X7—Disposable income per capita; X8—The total retail sales of social consumer goods; X9—Proportion of secondary and tertiary industries; X10—Investment in the fixed assets of the whole society; X11—Amount of public transportation per 10,000 people; X12—Road mileage per capita; X13—Hydropower supply capacity; X14—Proportion of the education expenditure to financial expenditure; X15—Number of secondary schools per 10,000 people; X16—Proportion of the medical expenditure to financial expenditure; X17—Number of hospitals per 10000 people; X18—Urban population density; X19—Per capita garden area; X20—Greening rate of the built-up area; X21—Days of reaching air standards per year; X22—Industrial SO2 treatment rate; X23—Wastewater treatment rate; X24—Comprehensive utilization rate of solid waste; X25—Resource abundance; X26—Number of provincial cultural relic protection units per million people; X27—Number of cultural venues per capita; X28—Contributions per capita; X29—Average number of students in Colleges and universities per 10,000 people.
From
Table 4, 29 influencing factors are divided into the following 10 principal components. The detailed information of the 10 principal components is listed in
Table 5.
3.2. SSA and SHA for the Factors of URD
To reveal the spatial spillover and spatial heterogeneity of the URD in the 24 shrinking cities, we used the Spatial Durbin Model (SDM) and Spatiotemporal Geographically Weighted Regression model (GTWR) to perform the SSA and SHA.
- (1)
SDM for SSA
The SDM is as follows:
where
is the marginal influence of the dependent variables of adjacent regions.
is the marginal effect of the independent variable on the dependent variable.
γ measures the marginal effects of independent variables in adjacent regions on the dependent variables.
is a variable matrix of the independent variables.
- (2)
GTWR for SHA
Because the data may be non-stationary in time and space, the influence of the independent variable on the dependent variable is different in different times and regions; that is, there is heterogeneity in time and space. GTWR is an extended model of Geographically Weighted Regression (GWR), which embeds the time dimension into the regression model. It takes into account the data changes of the URD of the shrinking cities in time and space. Therefore, GTWR is more in line with the actual situation.
Here,
is the URD of city
i,
is the longitude coordinate of city
i,
is the latitude coordinate of city
i, and
is the time coordinate of city
i. Therefore,
is the space-time longitude and latitude coordinates of city
i.
is the constant term, and
is the independent variable regression coefficient.
is the
k-th independent variable of city
i.
is the random error. The coefficient estimation of GTWR is as follows:
H is the space–time bandwidth, which is selected according to the minimum cross-validation (
CV).
3.3. Data Source and Processing
Part of the raw data comes from the China Statistical Yearbook, China Urban Statistical Yearbook, China Urban Construction Statistical Yearbook, China Energy Statistical Yearbook, Urban Statistical Yearbook, and some regional statistical bulletins and network data. Specifically, the R&D investment and social electricity consumption of the prefecture-level cities are from China’s urban statistical yearbook. Instead, in 2011–2016, the R&D investment and social electricity consumption of county-level cities are from China’s urban statistical yearbook. In 2007–2010, the R&D investment of county-level cities is from the statistical yearbook of local provinces and the relevant statistical bulletin. The social electricity consumption is from the Power Industry Statistical Data Collection, the Statistical Yearbook of local cities, and related statistical bulletins. Besides this, the raw data of the built-up area are from the China Urban Construction Statistical Yearbook and Regional Statistical Yearbook. The SME registration application approval cycle and the contributions per capita were obtained from the Internet and field questionnaires. The housing price income ratio was calculated according to the average price of commercial housing and the regional per capita income.
is the house price to income ratio, TPH is the house price and TIF is the total annual household income. is the residential housing area per capita, PP is the household size, the average price per square meter, and PTI is the annual income per capita.
- b
Resource Abundance
The ratio of mining employees to the total number of employees is used to characterize the regional resource abundance.
- c
Hydropower Supply Capacity
The water and electricity supply capacity of each region is measured by the satisfaction degree of the residents with the local water and electricity supply.
- d
SME Registration Application Approval Cycle
Due to the large difference in the actual situation of each region, there is a gap in the registration approval process, integrated services, network information platform construction, and the scale and type of small and medium-sized enterprises. In order to facilitate the data collection and enhance the comparability of the data, this paper measures the SME registration approval cycle from the perspective of the interviewees’ satisfaction, and collects the receipt of the SME registration approval cycle in each region by issuing questionnaires.
3.4. Results
In this paper, ArcGIS software and the GTWR plug-in were used to carry out the spatial-temporal weighted regression of URD in Northeast China Shrinking Cities (NCSC).
- (1)
Results for SSA
The test results of LM, Hausman and LR for the non-spatial panel data are shown in
Table 6.
As shown in
Table 6, the Hausman test is significantly positive. Therefore, we rejected the null hypothesis and selected the fixed effect model. The joint significance test LR time-fixed and space-fixed test results are 216.29 and 113.18, respectively. Therefore, LM (error), Robust LM (error), LM (lag), and Robust LM (lag) test of the space and time dual fixed model were selected to verify the specific form of the model. The results showed that there are spatial lag effects of both variables and error terms. That is, SDM is suitable to conduct the SSA.
Table 6 is the results of the SDM for SSA.
In
Table 7, the Wald test spatial lag and Wald test spatial error statistics passed the 1% significance test. Therefore, SDM cannot degenerate into SAR or SEM. The total effect, direct effect and indirect effect of SDM are listed in
Table 8.
The direct effect, the indirect effect and the total effect of the influencing factors on the shrinking cities are shown in
Figure 4.
From the direct effect perspective, TIA, GML, EDL, EDQ, PSC, US, MCQ have positive influences on the URD of the shrinking cities. Notably, EDL and EDQ have the greatest positive effects on URD, reaching 0.501 and 0.469, respectively. As we know, the development of EDL and EDQ requires the URD as the foundation. Therefore, it can be said that while URD promotes EDL and EDQ, economic development also has a significant role in promoting the URD. Besides this, the influence coefficient of TIA on URD is 0.401, revealing that technological innovation is an important motivation for attracting resource accumulation. In addition, GML can enhance the charm of cities and create a friendly environment for the entry of external resources. However, EL and HCD have no significant effect on the URD of the shrinking cities. This reflects that the natural environment and the human environment do not work on the URD of shrinking cities. It is worthy of noting that RE is the only factor that has a negative impact on the URD of the shrinking cities in Northeast China. The influence coefficient is −0.244, and has passed the significance test of 1%. It shows that the better the resource endowment is, the more unfavorable it will be to the URD, i.e., the “resource curse” proposed by relevant research [
59].
- b.
The Indirect Effect
From the indirect effect perspective, TIA, El, RE and HCD have significant positive indirect effects on the URD of shrinking cities. In other words, they have spill-over effects on URD. As we can see, the indirect effect of TIA on URD is 0.394, reflecting that the spill-over effects of technological innovation could improve the URD of the overall region. Instead, GML, EDL, EDQ, PSC and US have negative indirect effects on URD. That is, the negative spill-over effects of these factors would weaken the attraction of the shrinking cities for external resources, producing vicious competition.
- (2)
Results for SHA
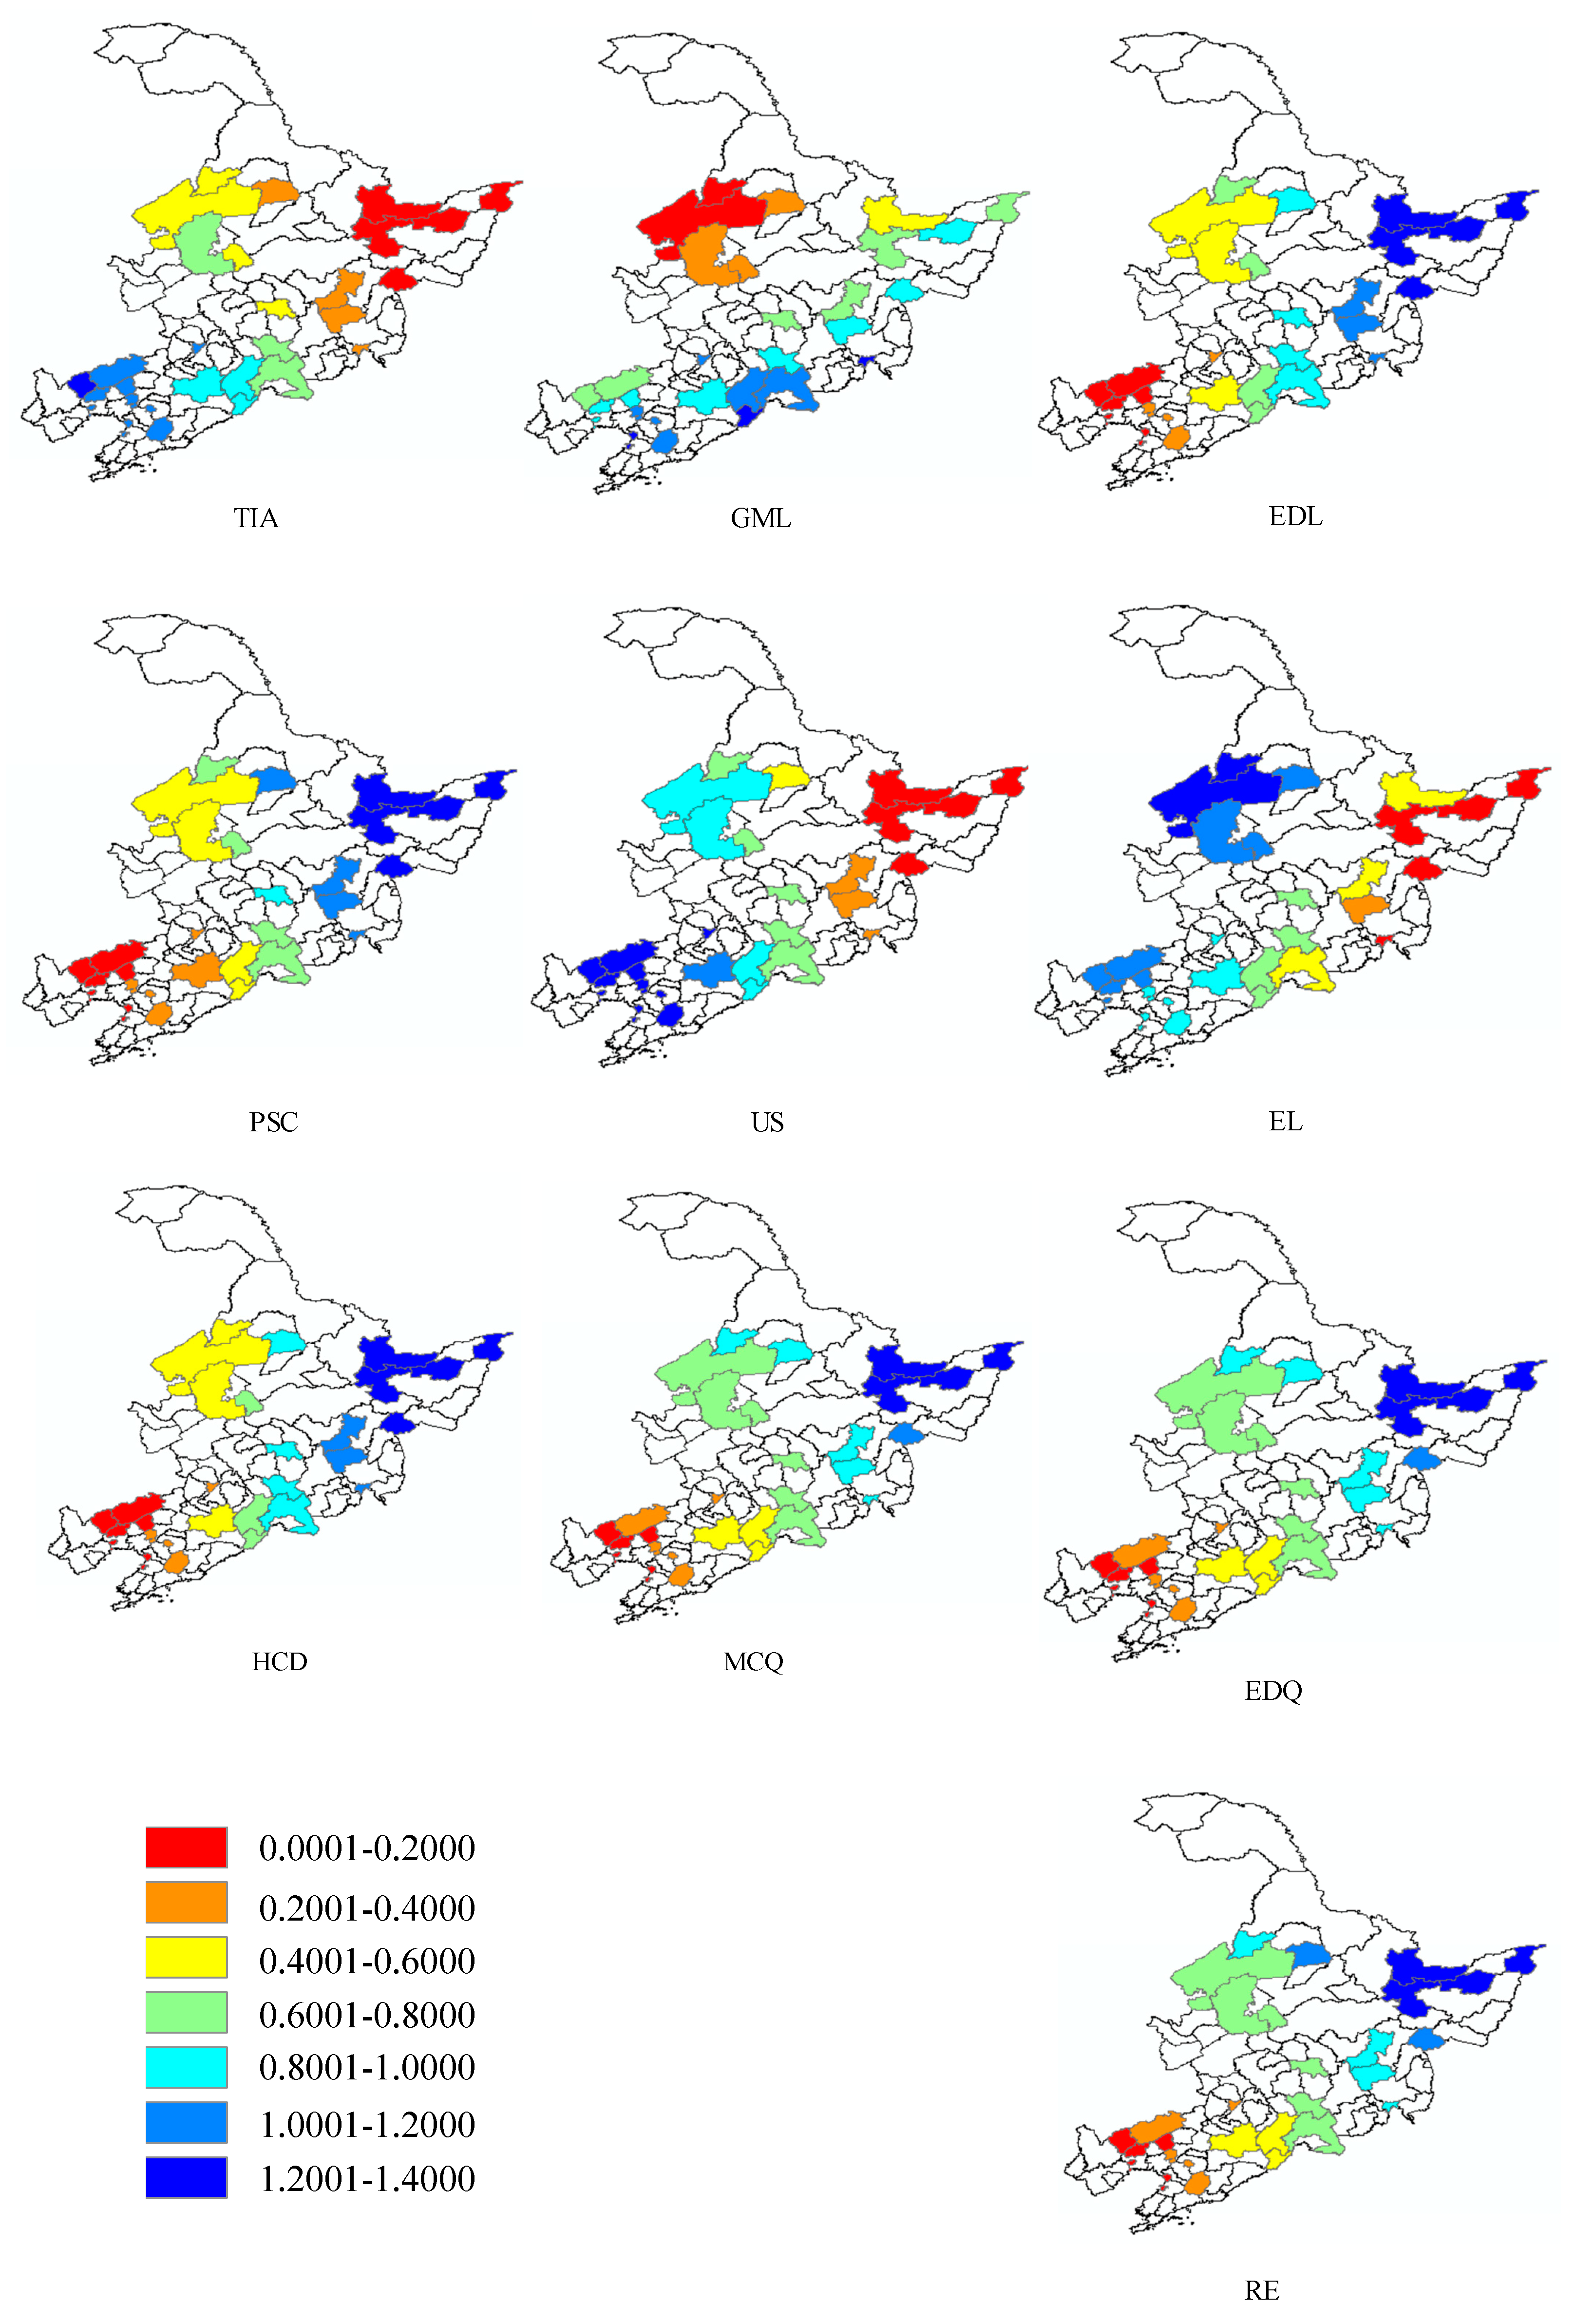
In order to reveal the spatial heterogeneity of the factors’ influences on the URD of the shrinking cities, GTWR is used to conduct the SHA. The results are shown in
Figure 5.
Figure 4 illustrates the spatial heterogeneity of the influencing factors on the URD of the 24 shrinking cities in northeast China. The influence of TIA, US, EL on URD gradually weakens from the west to the east, and the coefficients are between 0.8 and 1.4 for the western cities such as Anshan, Fushun, Fuxin and Jinzhou. Instead, the influence of EDL, EDQ, PSC, HCD, MCQ and RE gradually strengthens from the west to the east, and the coefficients are between 1.0 to 1.4 for the URD of Hegang, Jiamusi, and Fujin. Notably, the influence of GML on the URD of the shrinking cities in Northeast China showed a trend of gradually increasing from the northwest to the southeast. The URDs of Qiqihar, Daqing, and Bei’an are influenced least. Anshan, Fushun, and Tonghua are the most affected, and the influence coefficient reaches more than 1.0.
5. Conclusion
In order to reveal how the factors influence the shrinking cities in Northeast China from the perspective of equality, this paper established the URD model to measure the urban resource degree. Given the spillover effect and heterogeneity of the influencing factors, SDM and GTWR were used to conduct an empirical analysis of the URD of shrinking cities. The findings are summarized as follows:
- (1)
In the study periods, the overall performance of the URD in Liaoning province is basically stable, with small fluctuation. Besides this, the URD of the six shrinking cities in Jilin Province has a short-term upward fluctuation, but the overall trend is downward. Notably, in the shrinking cities of Heilongjiang province, the URD of Daqing is far higher than that of other shrinking cities. On the contrary, Hegang’s ability to compete for and control resources has declined sharply. Other cities have no drastic changes of the URD.
- (2)
The advantage of the URD of prefecture-level cities is gradually lost, and that of county-level cities is slightly improved. This reflects the fact that the ability gap to compete for and control resources between prefecture-level shrinking cities and county-level shrinking cities is narrowed.
- (3)
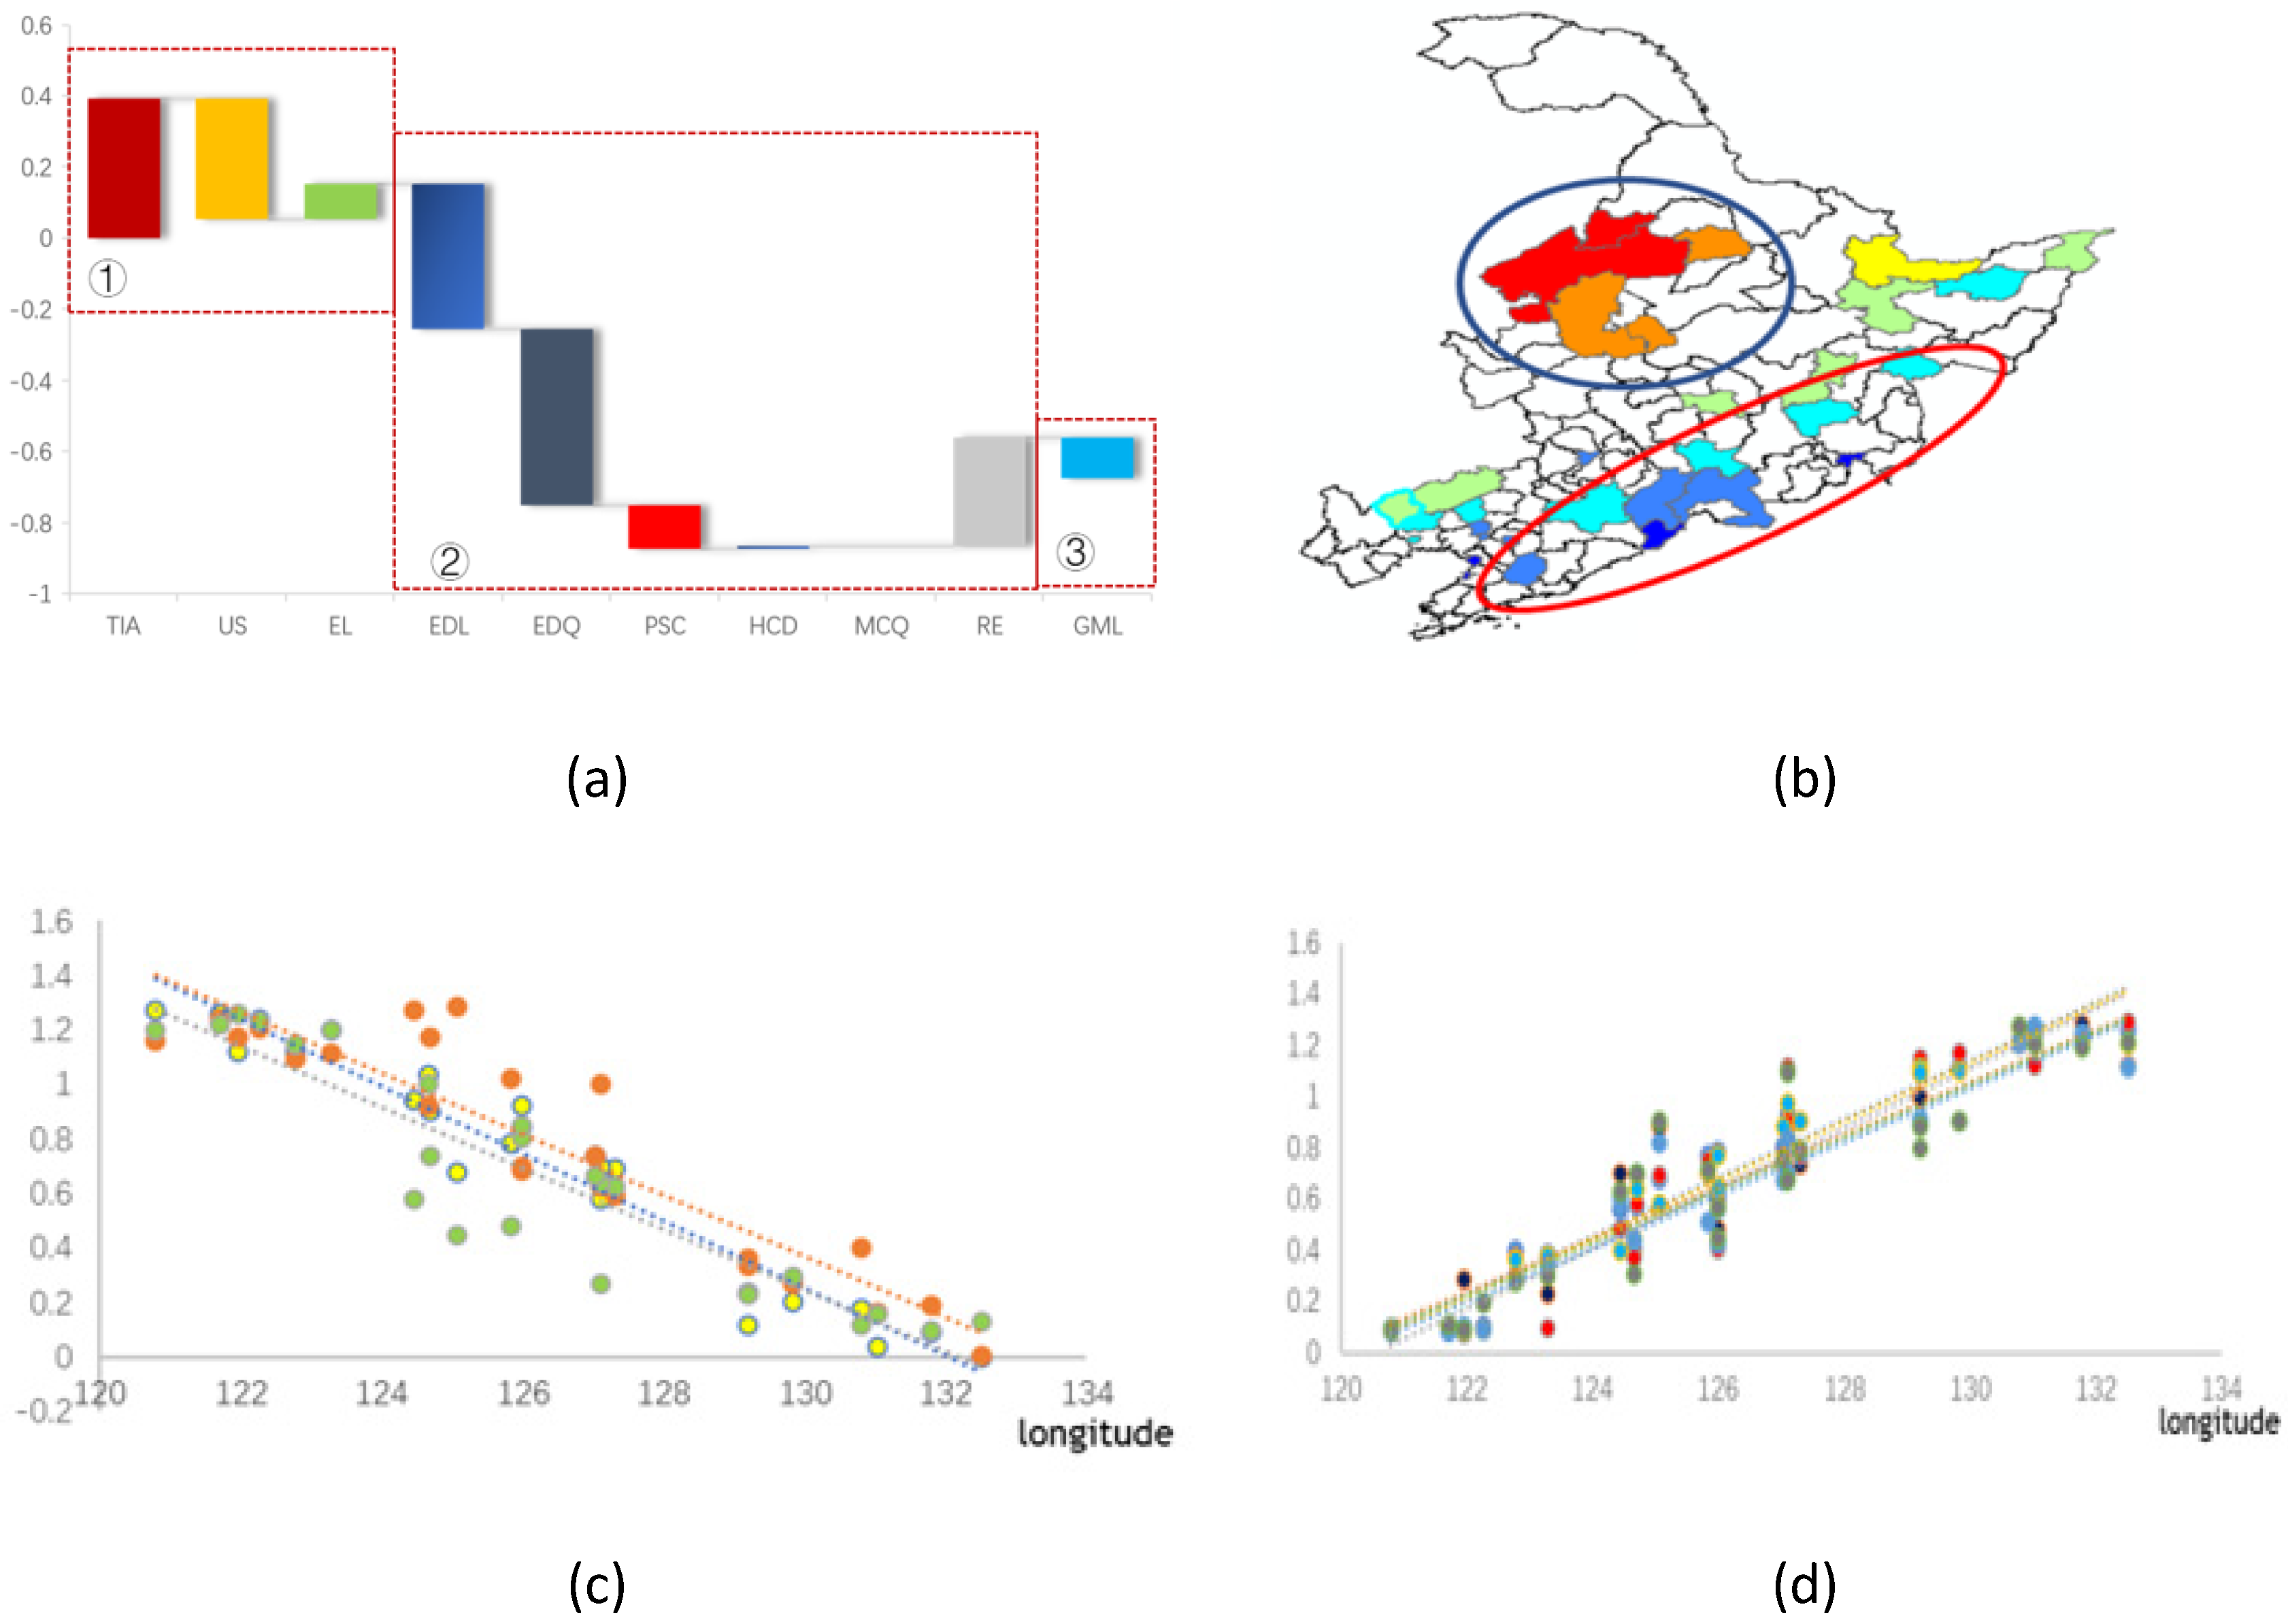
From the SSA and SHA perspectives, the influence factors can be categorized into three types, beginning with the “High West + Low East and Negative–Positive Spillover” of TIA, US and EL. Fuxin, Jinzhou, Anshan, Fushun and other shrinking cities in Liaoning Province are strongly affected by these factors. Next is the “Low West and High East + Positive–Negative Spillover” of EDL, EDQ, PSC, HCD, MCQ and RE. Hegang, Jiamusi, Fujin, Ningan, Jixi, etc are affected by these factors. Finally, there is the “Low Northwest and High Southeast + Negative Spillover” of GML. A few shrinking cities in Liaoning, Jilin and Heilongjiang are influenced by GML significantly.
From that above results, we proposed the policy implications from the perspectives of (1) strengthening competitive industries and implementing urban transformation and upgrading, (2) strengthening system design and optimizing regional urban arrangement, and (3) increasing investment in science and technology, and enhancing the innovation capabilities. URD indicates the resource endowment and the ability to compete with external resources of the shrinking cities. Therefore, it is indispensable to create reasonable planning and layout within the region in order to avoid disorderly development resulting from the negative spillover effect and make full use of the positive spillover effects of these factors to achieve the comprehensive effect of “1 + 1 > 2”. We hope the findings can provide supports for related policy-making.


