Article

The Relationship between the Implementation of ERP Systems and the Financial and Non-Financial Reporting of Organizations

by
Laura-Eugenia-Lavinia Barna
1,*,
Bogdan-Ștefan Ionescu
2 and
Liliana Ionescu-Feleagă
3
1
Accounting Doctoral School, Bucharest University of Economic Studies, 010374 Bucharest, Romania
2
Management Informatics Systems Department, Bucharest University of Economic Studies, 010374 Bucharest, Romania
3
Accounting Department, Bucharest University of Economic Studies, 010374 Bucharest, Romania
*
Author to whom correspondence should be addressed.
Sustainability 2021, 13(21), 11566; https://doi.org/10.3390/su132111566
Submission received: 28 August 2021 / Revised: 3 October 2021 / Accepted: 10 October 2021 / Published: 20 October 2021

Abstract

:
Numerous studies have shown that ERP systems can improve organizational performance and efficiency. Thus, the main concepts addressed in the paper are ERP systems, their performance and the manner in which they improve financial and non-financial reporting. The purpose of this paper is to observe the relationship between ERP systems and financial reporting. The role of these systems is to ensure transparency over the financial and non-financial reporting process of an organization. The research method is represented by an archival analysis (organization’s annual reports) to highlight the relationship between ERP systems and financial and non-financial reporting, given the impact of ERP systems on the information used to prepare financial and non-financial reports and how the organization changes after implementing these systems. The results highlight the significant role of ERP systems within an organization, in terms of performance and improvements in financial and non-financial reporting.

1. Introduction

Any organization tries to find ways to report reliable information, in order to “obtain financial benefits” [1]. ERP systems are an integrated system solution that “can cover all operations throughout the organization” [2,3,4]. ERP systems are organized modularly, containing such basic modules as procurement, sales, finance, accounting, human resources and other modules specific to each organization, depending on the specifics of the activity. These integrated systems are able to manage most activities within an organization. Data processed using ERP systems are stored in a common database, which facilitates the flow of information [4] between the departments of any organization.
Various studies conducted by [5] found that the implementation of ERP systems has a positive impact on organizational performance. Positive differences in financial and non-financial reporting were identified between organizations that implemented or did not implement ERP systems. ERP systems focus on information quality, strategy, control, decision making, performance and reporting [6], in order to provide real-time operational or financial information, creating strong relationships and efficient communication between departments [7]. Thus, ERP systems offer a superior quality of accounting information, helping managers to make the most efficient decisions regarding the organization.
Ref. [8] they observed that the main objectives of an organization are to ensure the continuity of its activity and to considerably reduce costs. Additionally, various studies found that organizations that implement ERP systems report a significant improvement in financial information (indicators such as return on assets (ROA)) compared to those that do not implement these systems. The implementation of ERP systems improves non-financial performance, highlighting a positive relationship between return on assets and stock return [9].
The successful implementation of ERP systems has a positive impact on establishing business strategy, but also on organizational efficiency. However, there are situations in which the implementation of ERP systems fails, and the main reasons for these are changes in the activities carried out and other factors of vulnerability not considered at the right time.
The purpose of this paper is to observe the relationship between ERP systems and financial and non-financial reporting processes, and to determine their impact on the quality of information used in this process and the ways in which the organization changes after implementing these systems.
The paper is divided into four parts. The following section introduces the literature review, in order to demonstrate the contribution this article makes to the literature, and explains the research methodology, presenting the sample and data collection processes. The third section discusses the results, followed by several interpretations and conclusions.

2. Materials and Methods

2.1. Theoretical Background

Technological and scientific progress has emerged from research conducted by humans to streamline their work [10]. Many organizations aim to improve their work to provide a quick response to business managers [11].
The need of the organizations to carry out their activity as efficiently as possible has led to them showing greater interest in the information systems market. According with [12], the main reason why organizations feel the need to implement ERP systems is “a way of streamlining business operations, enhancing job performance and generating value by improving the integration of best practice job processes, management functions, real-time reporting and knowledge analysis capabilities”. An IT system that allows the integration of all activities within the organization is the integrated ERP system. An ERP system is an information system used to integrate all the activities of the organization. These ERP systems are based on a unique IT platform, ensuring an optimal transfer of information between people and departments [13]. They ensure the management and automation of a very large amount of information. A feature of these ERP systems is that they can be focused on different activities, helping to monitor and control the processes and activities within the organization. ERP systems standardize, streamline and integrate business processes in the departments of finance, human resources, procurement, sales and distribution, accounting, and more [14]. Additionally, they store all the information in a single database with the role of facilitating the correct flow of information between departments, through a simple query of the database.
The main objectives regarding the adoption of ERP systems are [15]:
  • the replacement of the in-house legacy system;
  • to increase business process efficiency;
  • to decrease operating cost;
  • to redesign some business processes.
The main purpose of accounting is to provide financial information about transactions occurring within the organization, in different financial periods. ERP systems play the role of integrating all the information within the organization and generating real-time financial and non-financial data that are useful in the decision-making process. Without data, the decision-making process would not be possible and would be very vague. The main purpose of accounting is to provide financial information about transactions that change the financial status of the organization from one period to another.
The role of ERP systems is to help “an organization to stay competitive in today’s business climate” [12]. Additionally, ERP systems ensure that the information collected is correct and complete and is useful to stakeholders, so that the financial and non-financial reports of an organization can be prepared. Financial reporting provides accurate and real-time information to stakeholders and managers so that the most important decisions for the organization can be made (improving efficiency and financial statements, making the best decisions related to investors or creditors). Additionally, stakeholder theory involves describing and examining the relationship between the legitimate interests of stakeholders, the management practices of stakeholders and the achievement of an organization’s objectives. In other words, it represents organizational management and a business ethic. Stakeholder theory is the basis of corporate governance intended to minimize financial, legal and reputational risks, but also to reduce potential conflicts of interest between owners, managers and the wider stakeholder community, while promoting integrity within organizations. The purpose of this theory is to better understand the needs of stakeholders, mainly by establishing the limits of operation and formulating recommendations for increasing the efficiency of governance.
The agents interested in financial and non-financial information, but who are also involved in the organization of the activity, are owners, investors, employees, suppliers, customers and competitors. Their role within organizations is to ensure the functioning and survival of the organization, so that its activity takes place within normal parameters. The results presented in the monthly or annual reports influence the decisions of the interested parties regarding the settlement and continuity of the activity, as well as the avoidance of conflicts of interest between the interested parties.
The purpose of ERP systems is to ensure that the monitoring, control and integration of all activities and processes is carried out by an organization. Additionally, ERP systems can be “seen as a tool to support management activities that involve making decisions about the complexity of organizational problems” [16]. Thus, all information processed with these systems has either a direct or indirect impact on financial and non-financial performance. ERP systems are used in generating reports and performing various accounting analyses, providing an overview of financial and non-financial operations. Financial and non-financial reporting is important for stakeholders because it aims to improve the process of setting objectives and developing strategies, but also to improve the allocation of resources and decision-making.
Creating value within an organization by implementing ERP systems depends on the fact that any information processed using them is qualitative and provides support for the strategy and control of the organization, as well as on the decision-making process.
According to IFRS 8, the manager is required to report on the internal structure and evaluate the performance and allocation of resources in order to provide a more accurate picture of the company’s situation at a given time [6] (p. 7).
Moreover, ERP systems ensure the accurate and complete reporting of the information processed with these information systems, because the architecture of these systems has four characteristics:
  • integration—interconnecting the functions of the organization in a database;
  • standardization—the rules of the organization are based on good practices;
  • centralization and real-time data generation;
  • automation of daily tasks.
Assessing the characteristics of ERP systems, it was found that organizations consider ERP systems as a powerful tool that provides support in automating the organization’s activities [17]. According to [18], an ERP system is “an application used to plan and handle the capital efficiently, productively, and profitability”. So, the purpose of these systems is to “reduce costs, enhancement of productivity, enhancing service quality and better decision-making”.
It was found that ERP systems have the ability to integrate all activities within the organization due to the fact that the system is the means of providing functions for each department and offering competitive advantages to an organization (for example, improving productivity and the financial cycle, providing a detailed analysis of financial and non-financial information, making a better inventory, generating high-quality information) [7]. The other benefits include reduced time spent in information processing for financial and non-financial reports, data sharing, visible data, reduced redundancies, improved supply chain efficiency, and reduced costs.
Financial benefits refer to the ability to obtain profit and improve other indicators (such as return on assets (ROA), return on investments (ROI), total stockholder return (TSR)), and non-financial benefits refer to customer satisfaction, productivity, and the satisfaction of users of financial accounting information [1]. The benefits can be seen only 2 years after the implementation of ERP systems.
The main role of ERP systems is to ensure an improvement in operational efficiency and business strategy.
The existence of an internal control framework within an organization is intended to ensure the credibility of financial and non-financial reporting, and to mitigate fraud risks [19].
The ERP system implemented within the organization has an impact on performance, management accounting techniques and activities, and non-financial information [20] (p. 401).
The measurement of the performance of an organization depends first of all on the size of the organization and secondly on the activity carried out by the organization. ERP systems can provide faster access to operational data [21] (p. 307) and improve transaction processing and information quality.
The process of implementing an ERP system within the organization is complex, consisting of a multitude of phases (presented in Figure 1) requiring a time interval of between 6 months and 2 years depending on the different requirements of the organization.
Management accounting techniques do not change significantly after the implementation of ERP systems. These systems only influence the way in which the analysis of information is performed after data processing with the systems, because the information is much more consistent.
Management accounting activities have been improved after the implementation of ERP systems because many tasks were then automated and redundancies were decreased.
The quality of financial accounting information depends very closely on the perspective from which it is viewed. For example, from the macroeconomic point of view, the quality of information is influenced by various factors including the characteristics of the organization, corporate governance systems, and the audit method. There are also external factors (legal, political) that may influence the organization’s activity [23].
Non-financial reporting provides information with respect to the sustainable development of an organization [24]. Non-financial reports must contain accurate, verifiable and comparable data and information over time, as well as the series of policies and procedures applied and applicable by the company within the value chain [24].
IT systems and changes in the structure of the organization significantly influence employee behavior, according to the results obtained by [25]. An outdated IT system determines a reduction in employees’ productivity, as they become stressed because they cannot complete their work and must stay overtime to complete their task on time.
Organizations invest in ERP systems to integrate the functionalities of the two separate systems used by the organization into one [26], so as to store information in a single database, facilitating easier access to information.
The main parameters underlying a decision to implement an ERP system are turnover, number of employees, and quantity of manufactured products (if it is an organization with production activity), if the organization has branches in other countries [22].
Another important factor underlying the choice of the ERP system is the organization’s dimensions, which all depend on the costs generated by the implementation of the new system. Another factor is the time required to implement the ERP system.
The benefits of implementing these integrated ERP systems include a series of activities within the organization, taking into account both strategic and operational benefits and tangible and intangible results (internal integration, improving information and services to the customer, productivity, reducing costs) [27]. The role of these systems is to add value to the organization by significantly improving the results and efficiency of the organization [28]. Additionally, the transparency of the information used for financial reporting after the implementation of ERP systems was observed by [22]. The quality of information is very important in the decision-making process of the organization [29].

2.2. Research Methodology

In this article, the research method used by the authors to identify the relationship between the implementation of ERP systems and the financial and non-financial reporting of organizations was archive analysis (annual reports and other public information), through which we tracked the impact of using ERP systems when preparing financial and non-financial reports before and after implementing these systems.
We accessed the official pages of ERP systems [30,31,32,33,34] in order to identify a sample of organizations that have implemented the selected ERP systems. The sample includes 37 organizations operating in various fields such as the pharmaceutical industry, food industry, chemical industry, providers of high-tech products, suppliers of IT systems and components, as well as utilities, retail, aviation, financial and accounting services.
In order to identify the year of implementation of the ERP systems within the organizations, the authors consulted the annual reports published on the organizations’ websites or specialized websites where the managers of the organizations offered interviews about the effects of ERP system implementation within the organization In total, 15 organizations were not considered in the final sample due to data limitations.
In order to observe the impact of the implementation of ERP systems, we processed data from the annual reports published on the organizations’ websites, taking information from before and after the implementation of these systems, through which we selected various indicators specific to financial reporting (liquidity, solvency, risk, debt, efficiency indicators and rates of return), as well as elements specific to non-financial reporting (operational indicators, corporate governance).
The objective was to investigate whether there is a relationship between the implementation of ERP systems and the financial and non-financial reporting of the organization, considering also any change that occurred after the implementation.
The reason the authors chose these indicators was that all the data processed with ERP systems are presented in annual reports, thus having a massive impact on the financial and non-financial indicators of the organization, but also on the strategy to continue the activity next year.
In Table 1, we present the variables used in this article.
The role of financial and non-financial indicators is to provide information as to whether an organization is successful or not. Managers, suppliers and investors are interested in financial indicators, but also in establishing the business plan for the next year. Financial indicators enable the signaling of critical moments for the organization.
The most followed indicator by investors in the management of the organization is the rate of return on equity, because this can indicate to what extent their investment is profitable or not.
Non-financial indicators highlight the long-term viability of the organization, as well as the way in which the activity of the organization is perceived. The most important non-financial indicator can be represented by the analysis of corporate governance, through which the organizations are internally controlled and supervised by the board of directors, who watch over the interests of the involved parties (shareholders, associates).
According to [37], there is a close correlation between corporate governance and transparency (the way information is disseminated) because a high degree of transparency is associated with the use of high-quality governance practices. Thus, transparency is considered a mirror of good governance practices, and an efficient system of governance involves attracting investment, transparency increases the degree of trust in the organization’s activity. Thus, investors can take the risk of placing capital within the organization.
The operational indicator chosen by the authors for analysis was the time spent working on a certain task to observe whether the labor productivity was improved or not after the implementation of the ERP system.

3. Results and Discussion

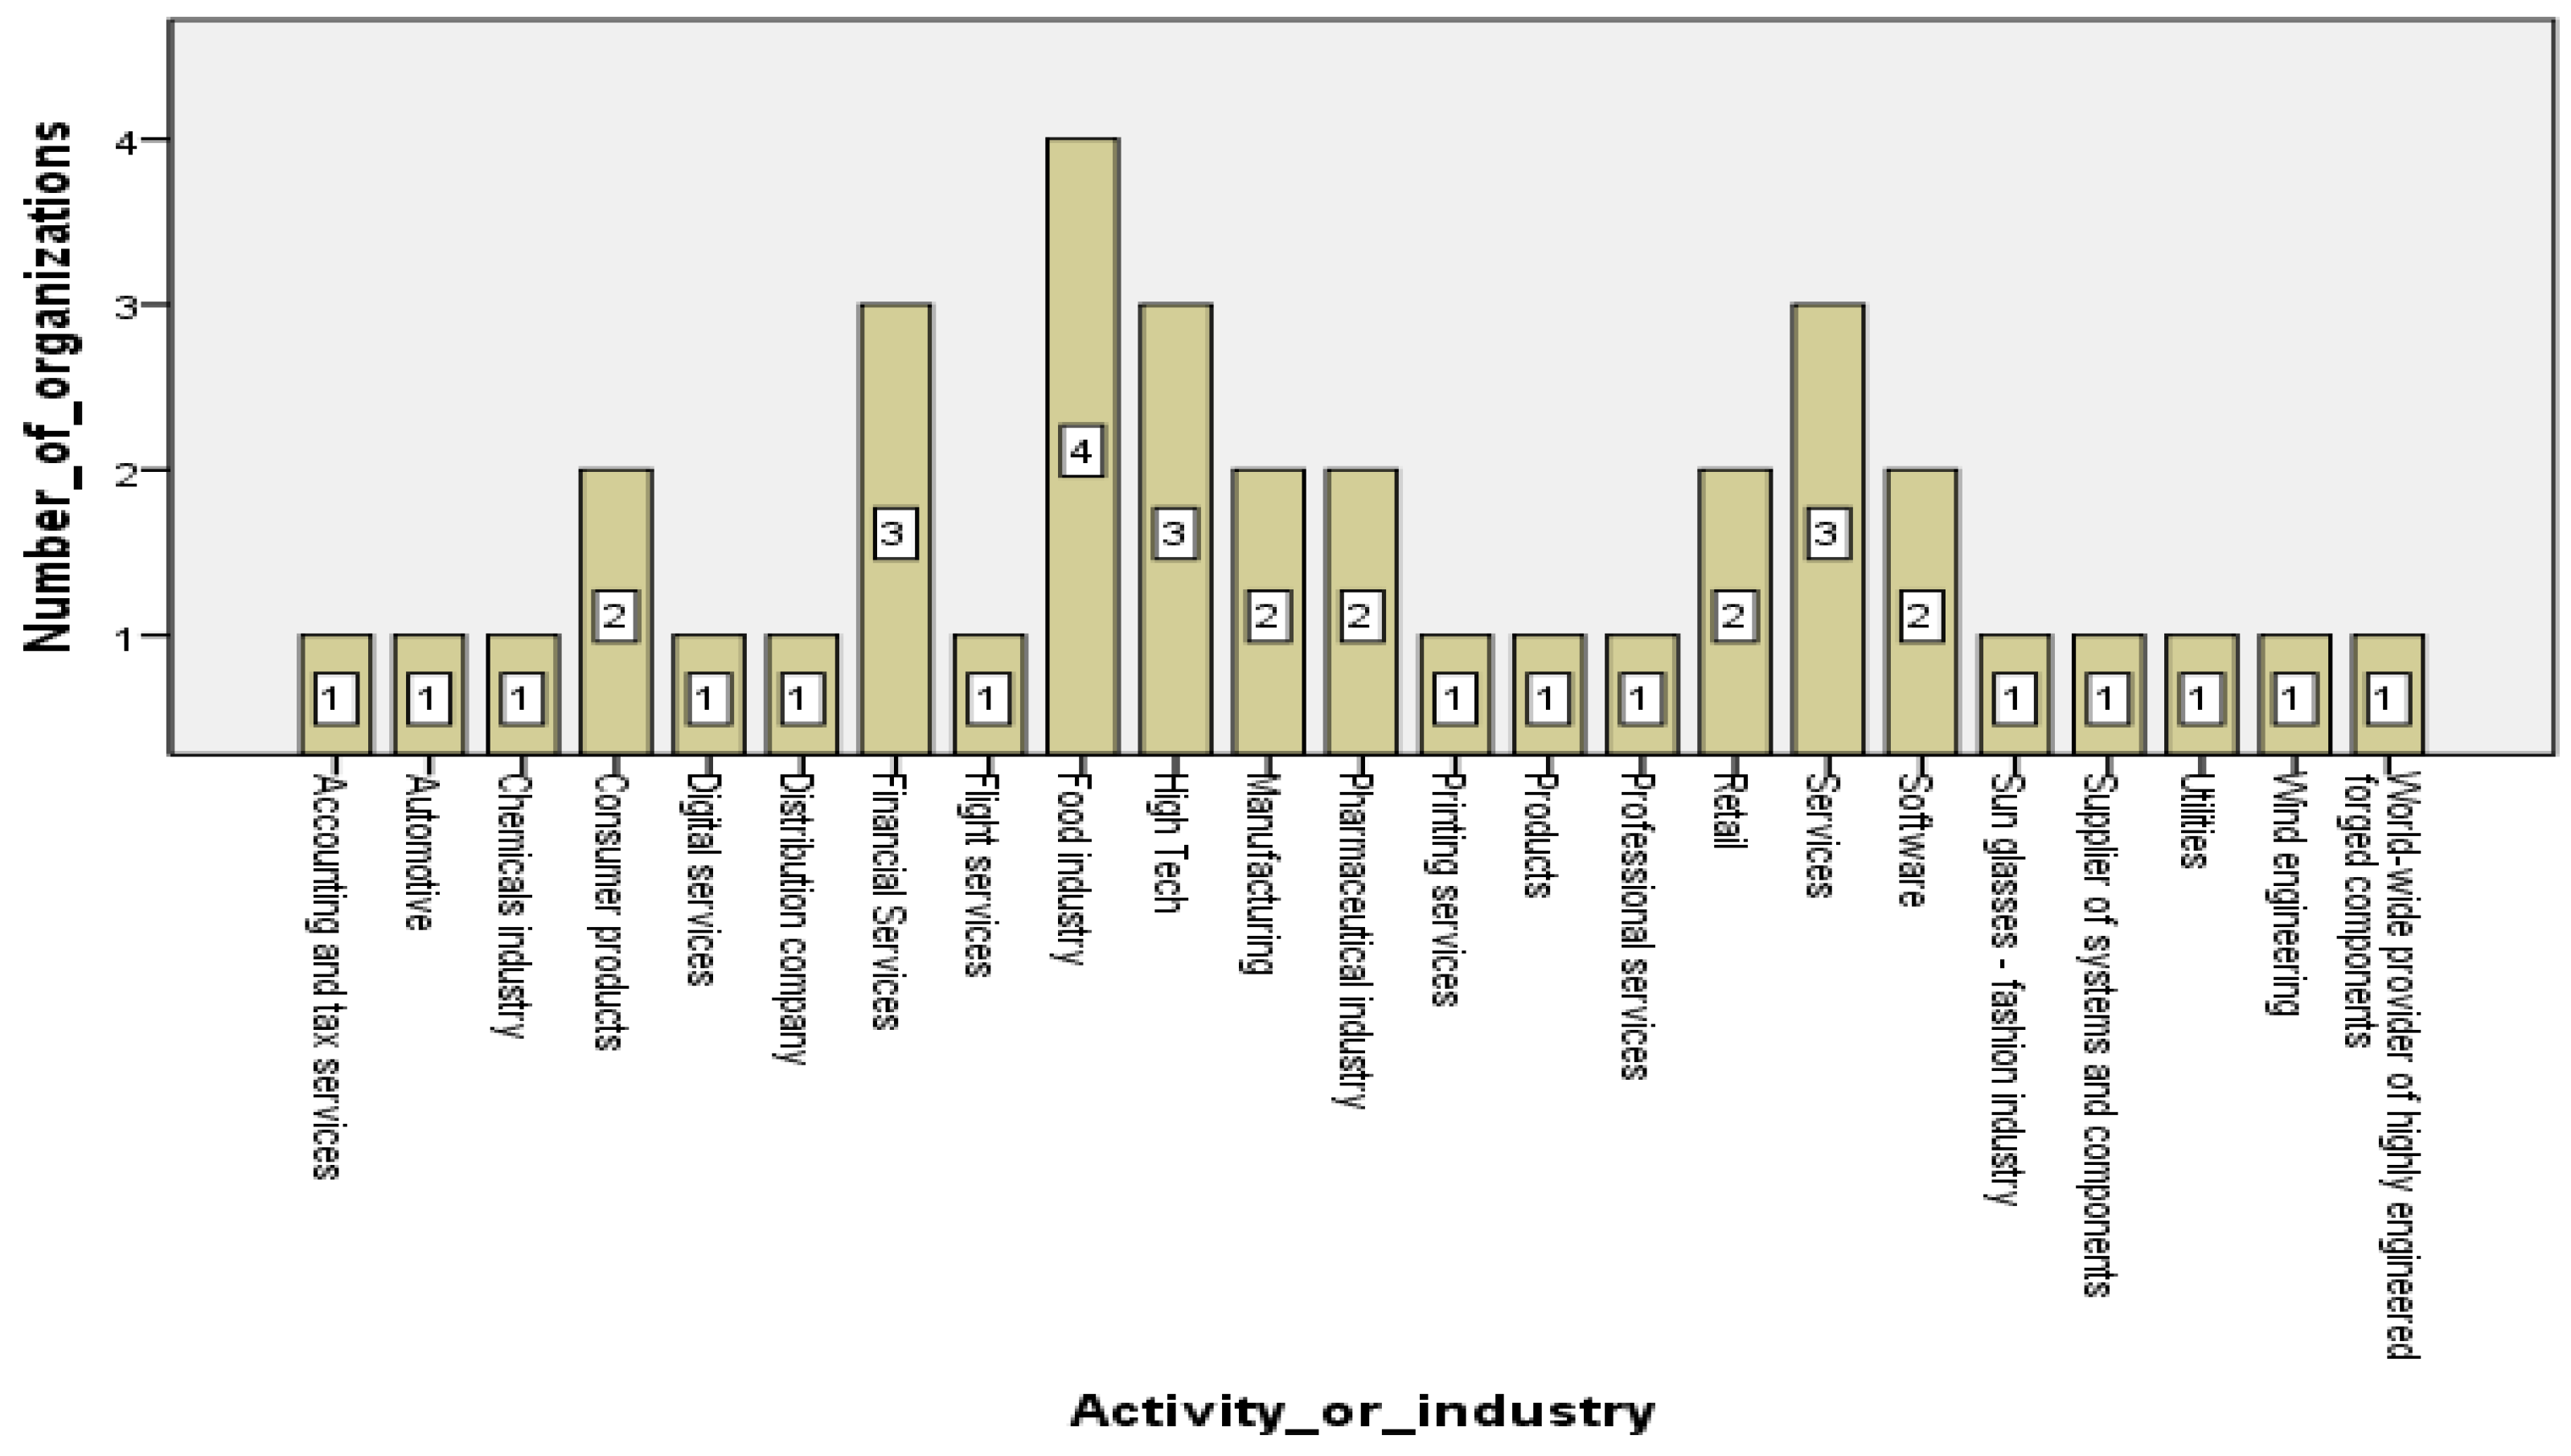
The organizations were chosen based on the lists of organizations that have implemented ERP systems, which is presented on the websites of ERP system providers [30,31,32,33,34]. The organizations subject to analysis carried out their activity in different fields, these being presented in Figure 2.
The sample of organizations allowed the authors to form an opinion on how ERP systems influence the activity of different organizations depending on the field of activity.
The analysis of the results in this article is divided into two parts: a section where the main financial indicators will be analyzed (based on the processing of data collected from annual reports) and a section where non-financial indicators are analyzed (following the analysis of annual reports presented by organizations).
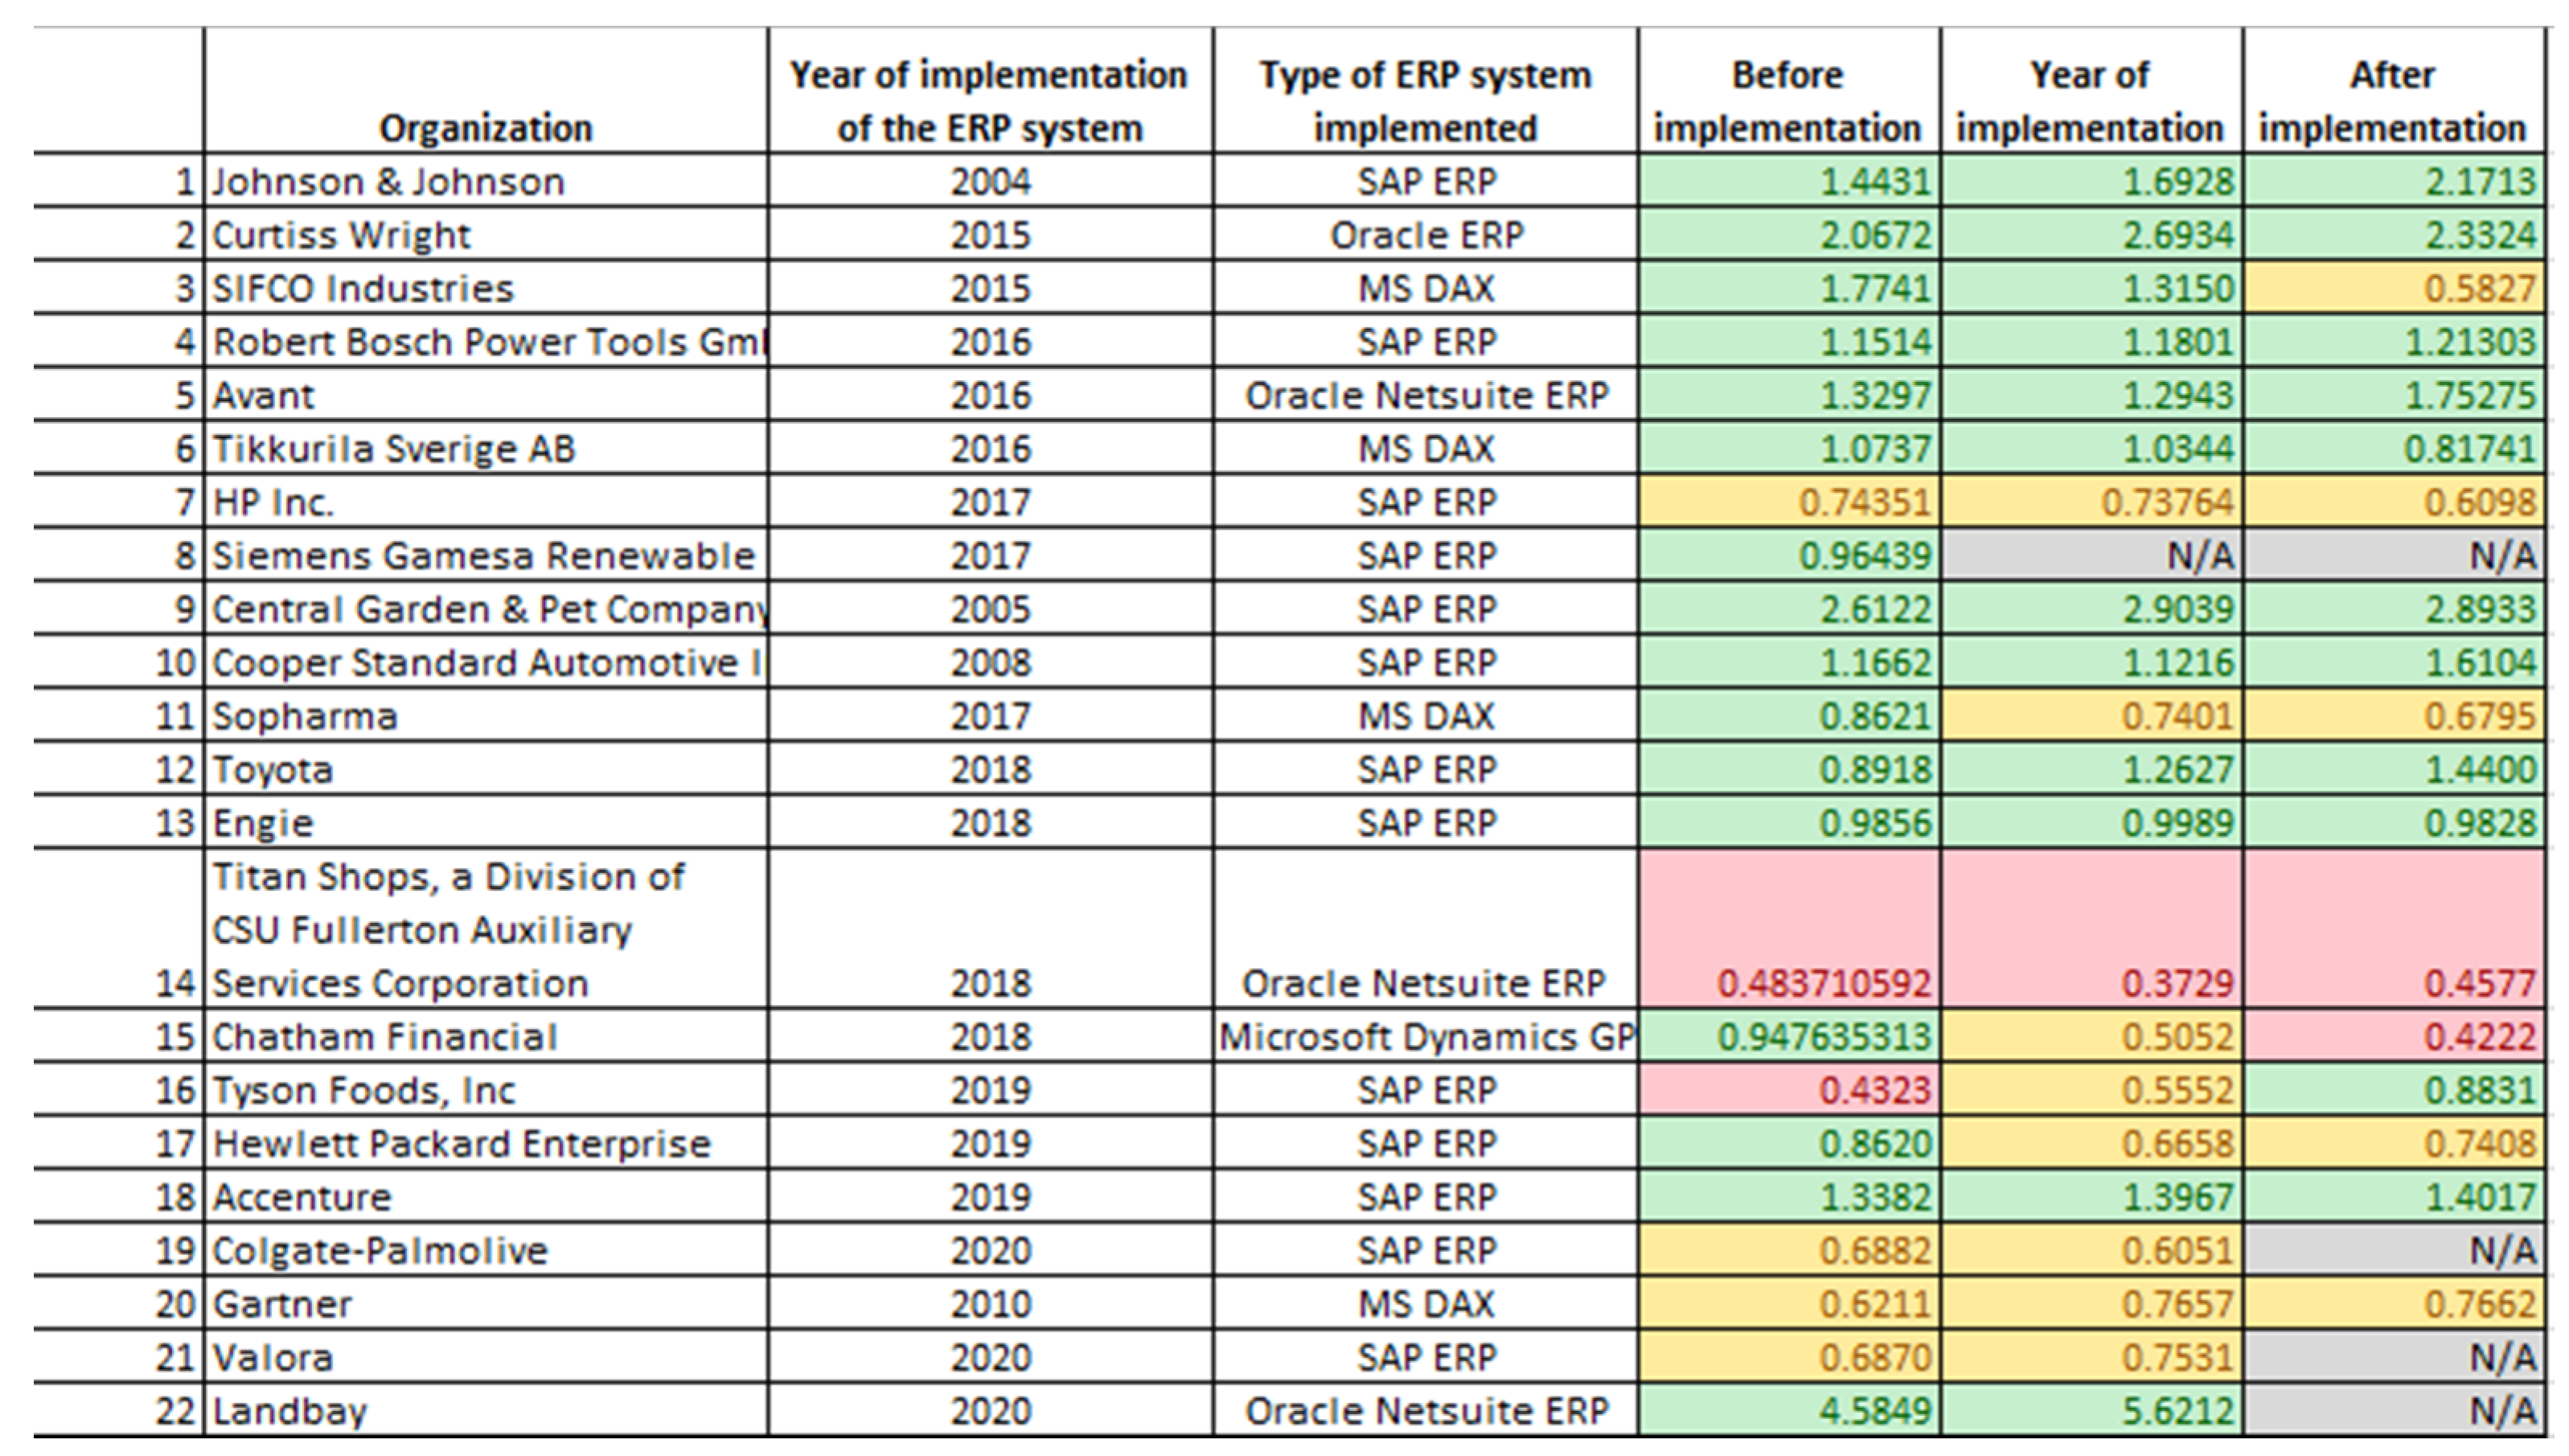
Analyzing the current liquidity rates for a period of three years (considering the year before implementation, the year of actual implementation and the year after the implementation of ERP systems), we identified the following situations, presented in Figure 3: approximately 18.18% of the selected organizations have difficulty in honoring their short-term obligations (highlighted with red), while 81.82% have a level of current liquidity above 1.5, providing assurance that those organizations have the capacity to honor short-term obligations (highlighted with green).
After analyzing in detail, it was noticed that in the year of implementation, some organizations had a lower level than in the year before implementation; this is because their short-term debts were high compared to their current assets, as these were represented by the cost of implementing these systems.
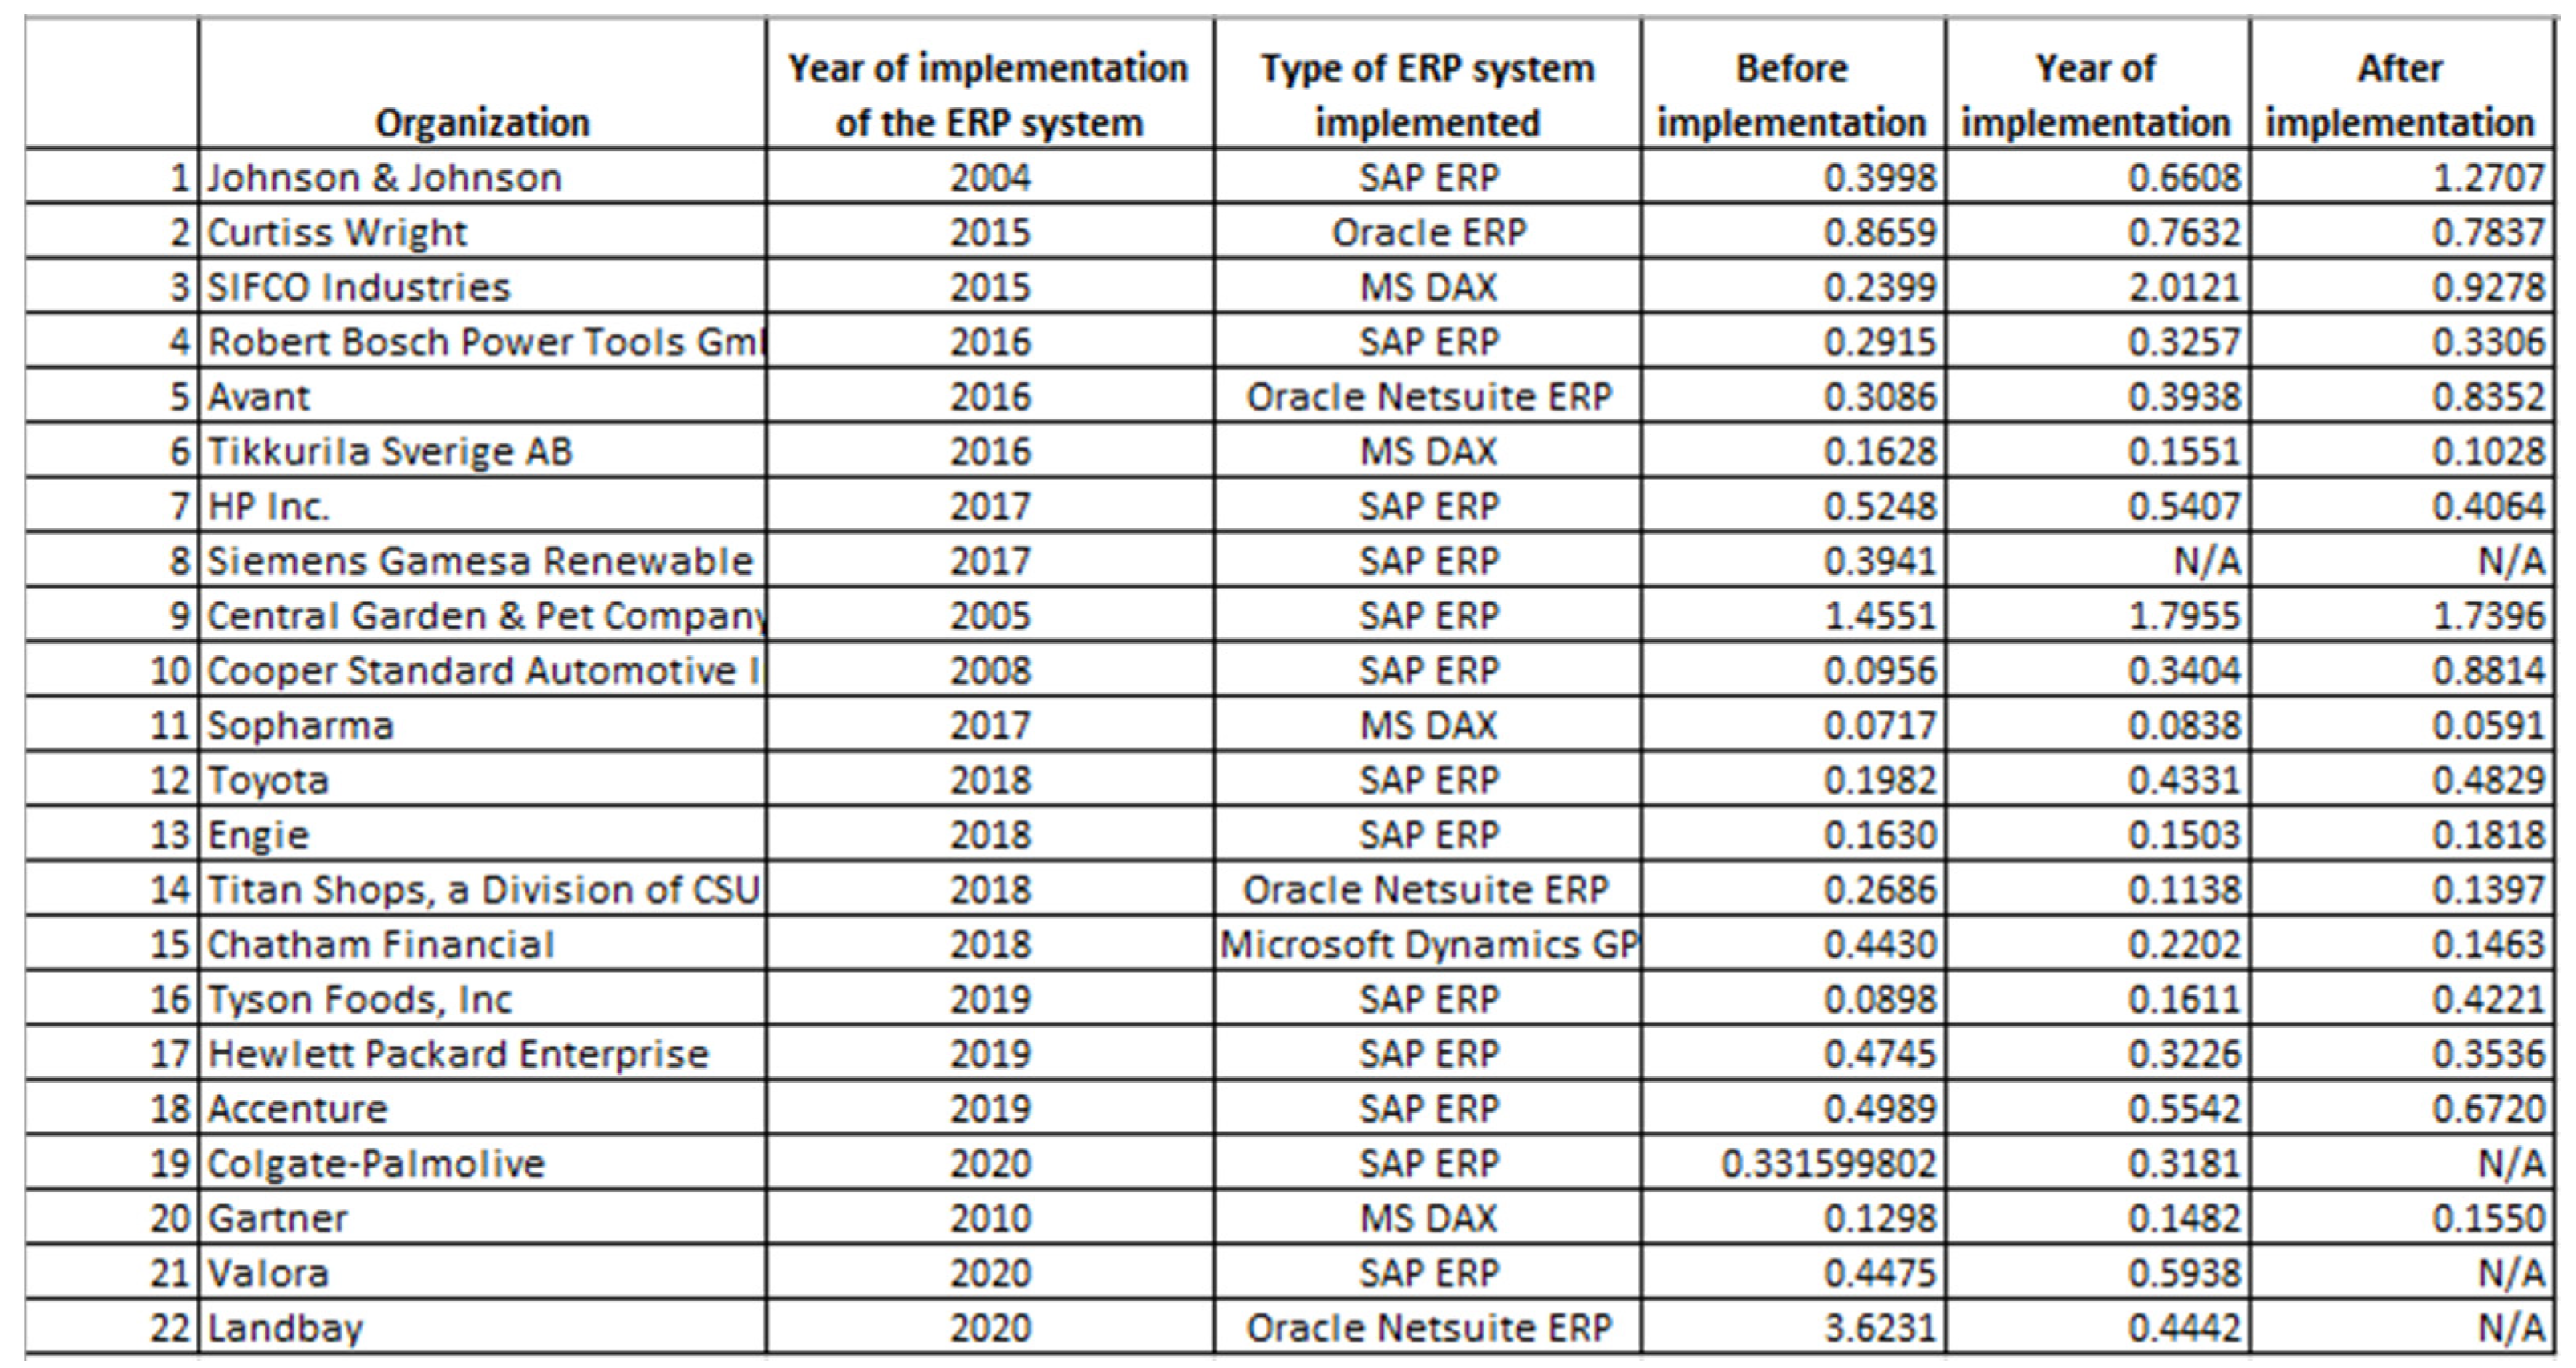
According to Figure 4, 45.45% had a full capacity to honor their payments at maturity (exceeding the level of 0.8–1), and these cells are colored green. In approximately 22.72%, there is a possibility of problems arising when payments are due, and these are highlighted with yellow and red.
The intermediate liquidity rate (Quick ratio) provides information about an organization’s ability to pay its short-term debt, using mostly the liquid assets on its balance sheet.
The liquidity rate provides information on the state of short-term cash and investments. Following the implementation of ERP systems, in approximately 50% of the organizations, an improvement in these rates was observed (see values on Figure 5).
Regarding the global solvency rate presented in Figure 6, approximately 72% of the analyzed organizations were solvent (because they exceeded a level of 1.4, as highlighted with green), and 22.72% were close to insolvency. Only one organization in the sample became insolvent due to the implementation of the ERP system.
The overall solvency ratio reflects the degree to which the total debt of the organization can be covered by its total assets.
In Figure 7, we calculate the patrimony solvency rate, and it can be noticed that 72% of the analyzed organizations have a good level of patrimony, managing to use their own capital without resorting to bank loans. The rest of the organizations contracted bank loans to finance and continue their activities.
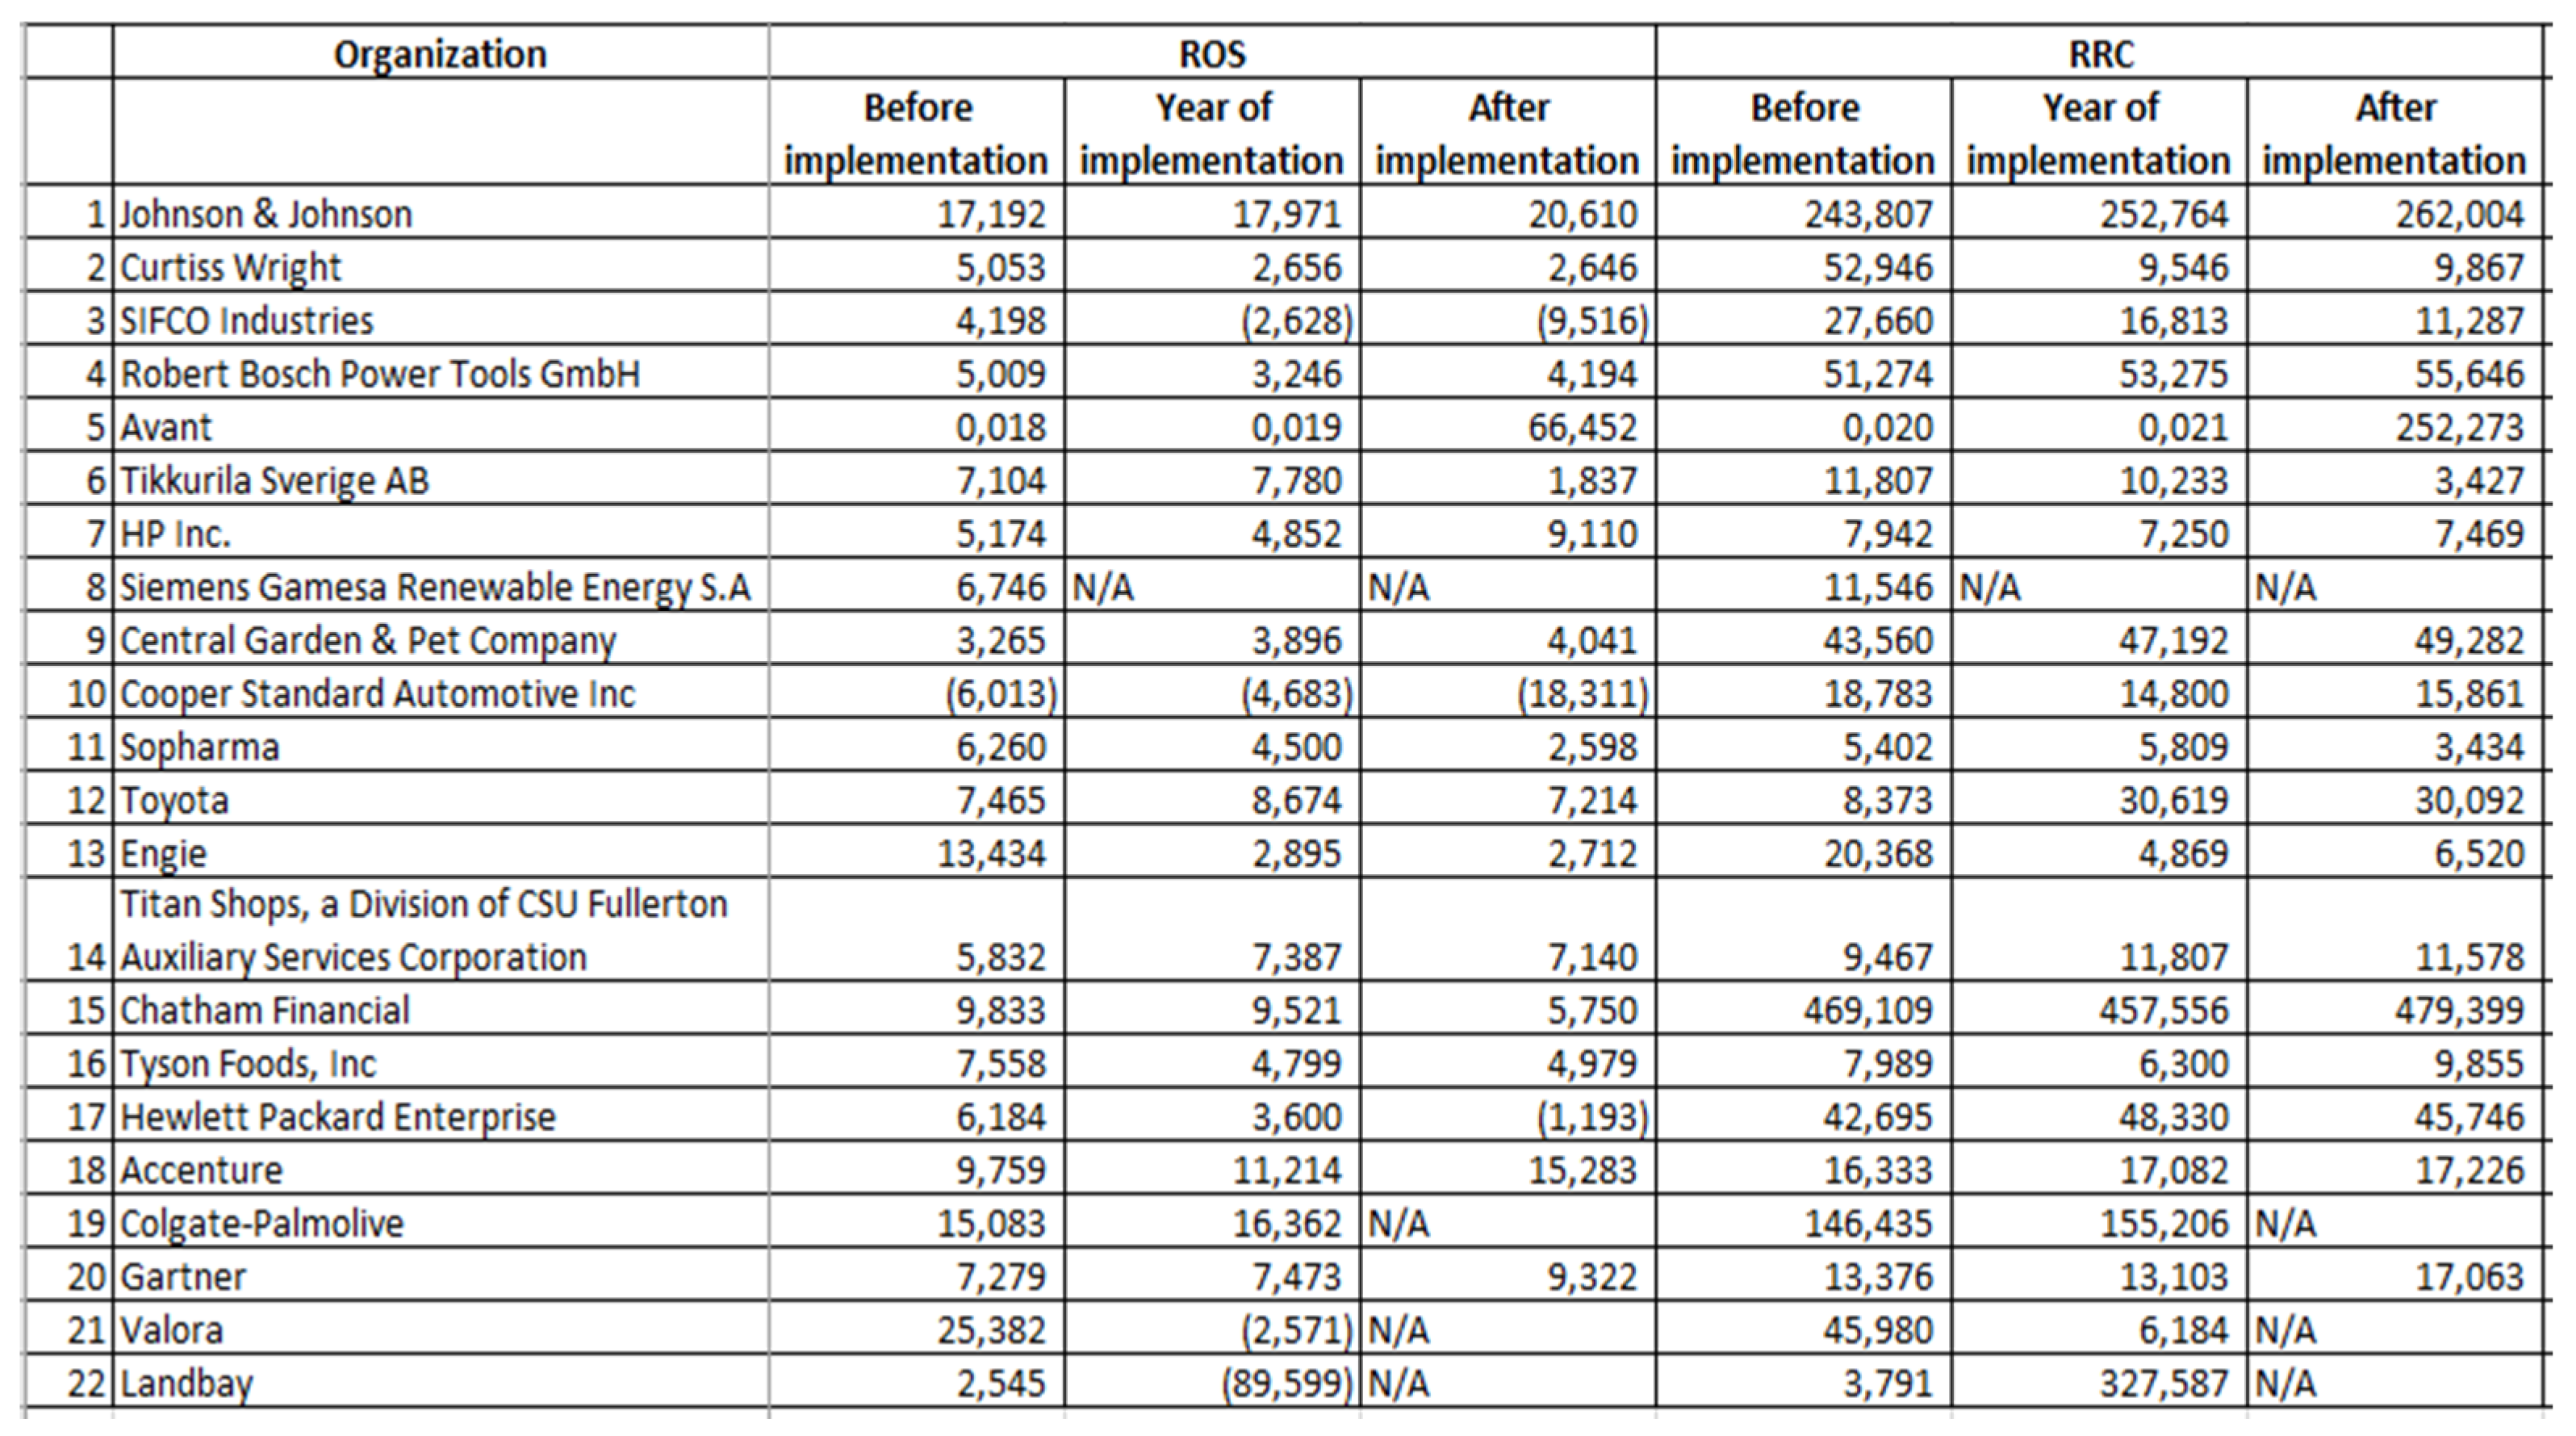
The purpose of rates of return is to measure the efficient use of the organization’s resources to finance its activity. According to [67], rates of return are defined as “a ratio between an indicator of results (profit or loss) and an indicator that reflects an activity flow (net turnover, resources consumed) or a stock (equity, total assets)”. In Figure 8 and Figure 9, we calculate the rates of return based on the data collected from the annual reports of the selected organizations in the sample. Some information is not available in the annual reports (for example, Siemens Gamesa Renewable Energy S.A.), and in some cases, the most up-to-date annual report after the implementation year is not available (for example, Colgate-Palmolive, Valora, Landbay); thus, such information is replaced by “N/A”.
Return on assets (ROA) measures the efficiency of the capital allocated to the fixed and current assets of the organization. In most of the cases presented in Figure 8, it can be seen that the ROA increased significantly after the implementation of the ERP system, but there was also a decrease in certain organizations in the year after the implementation of the ERP system. Return on equity (ROE) shows the efficiency of using equity, highlighting the organization’s ability to make a profit using equity.
Return on sales (ROS) highlights the elasticity of net profit in relation to turnover, and return on consumed resources (RRC) shows the degree to which the organization’s resources are capitalized in order to make a profit. Some organizations showed an increasing trend, others a decreasing one, with all depending on the impact of the implementation of the ERP system on the operating expenses.
Regarding financial indicators, we can also analyze the speed and duration of the rotation of the assets. According to [35], the speed of rotation of assets highlights the intensity of exploitation of the organization’s assets, thus showing how much capital has been invested to obtain annual turnover. However, via the duration of the rotation we can observe the number of days necessary for the recovery of the assets. In Figure 10, we present and analyze the speed and duration of the rotation of the assets.
According to the data presented in Figure 10, we noticed a higher speed of rotation of assets and a lower duration of rotation of assets (for example, the Avant organization before the implementation of ERP systems had a very fast speed of rotation of assets of 245.50 rotations, so the assets can be rotated in a single day; on the other hand, a very low rotation speed of 0.004 rotations was displayed by the organization Cooper Standard Automotive Inc., in which the duration of the rotation of assets was 98,449 days). The acceleration of the rotation speed determines a favorable improvement in the performance of the organization, and its slowing down has a negative effect.
In the year of implementation of the ERP system, there was a decrease in the speed of rotation of assets, which determines an increase in the number of days required for asset rotation for approximately 50% of the analyzed organizations, depending on their turnover and current assets.
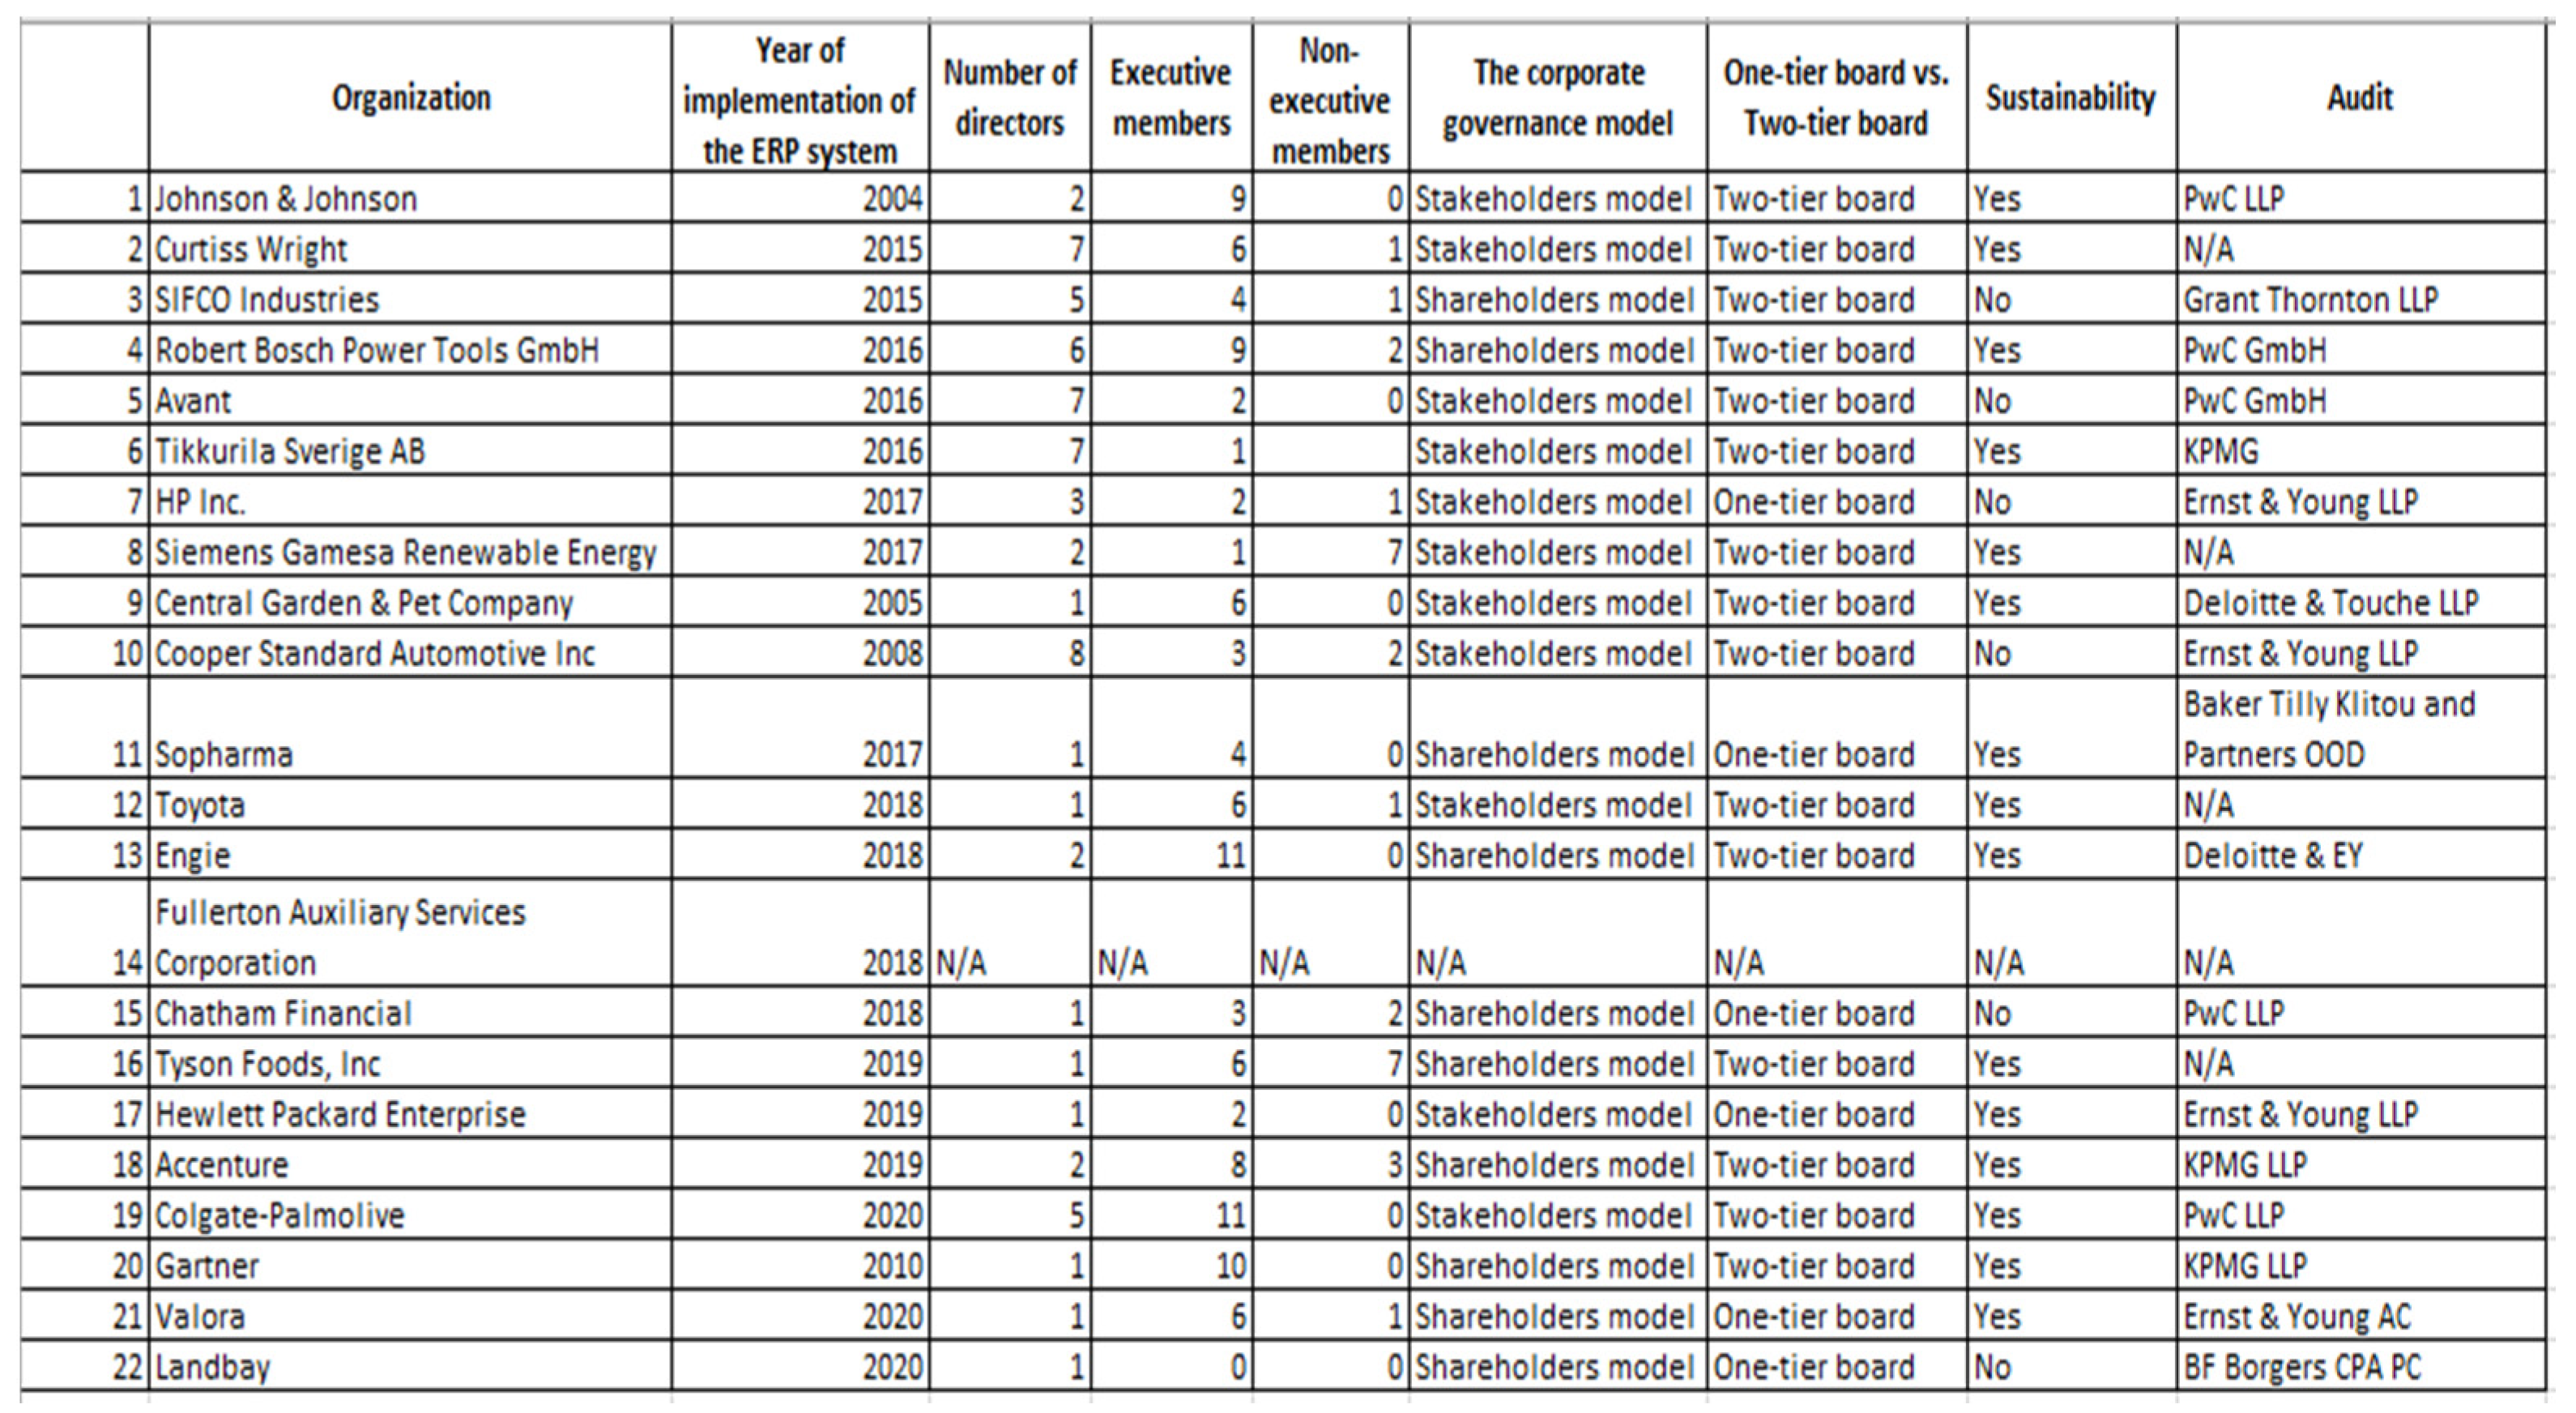
In the second part, we analyzed some representative non-financial indicators related to corporate governance, these being presented in Figure 11. Corporate governance includes the principles based on which an organization is governed and controlled.
In this analysis, we chose as criteria the number of directors, the number of executive and non-executive members, the corporate governance model, a unitary or dual system (one-tier or two-tier board), whether or not sustainability is ensured, and which organization ensures the audit of financial statements.
Approximately 68% of the analyzed organizations consider sustainability in their development. Additionally, 68% of them have a two-tier board. The corporate governance model used by the analyzed organizations is mostly the stakeholders model, which allows the incorporation of corporate responsibility to protect the interests of all stakeholders (for example, shareholders, potential investors, employees, customers, suppliers, business partners, government, local government, media) that have an impact on the activity of an organization or are influenced by them.
The two-tier board aims to protect shareholders and ensure the transparency of the information published in the annual reports. To ensure the high credibility of this information, regular, independent and efficient audits must be performed. The analyzed organizations benefit from audit services from external auditors (Ernst & Young, PwC, KPMG, Grant Thornton and others) which communicate with internal auditors.
Analyzing in detail the annual reports of the selected organizations in the sample, we identified the benefits offered by the implementation of ERP systems. According to [38] from 2019, using these technologies enables a high-quality service for customers. In their 2020 report, [38] showed that the organization’s strategy is focused on customer needs, using ERP systems to redesign certain activities. The flexibility and cost reduction benefits offered by ERP systems were observed mainly by [43], this being presented in the 2019 annual report (post-implementation of ERP systems).
In the report presented in 2020 by [44], they noted that the ERP system used (SAP) improves efficiency in the process of supply and production, and can deal with significant increases in consumer demand for their products. Thus, they noticed a significant reduction in production costs.
After the implementation of an ERP system, [47] presented a strong financial performance, because the data processed with ERP systems are much more accurate, giving the organization the opportunity to develop sustainably. The same benefits have been observed by other organizations, such as [50,53,56,65].

4. Conclusions

The technological development over the period in question has significantly influenced the perception of the organizations regarding the development and continuation of activity, and the degree of implementation of ERP systems has increased significantly. ERP systems play the role of replacing a multitude of systems used in the past in the financial and accounting reporting process, because these systems are based on a modular structure capable of adaptation to the needs of the organization.
Even if the implementation of ERP systems is more difficult, more expensive or more time-consuming (the implementation process can take between six months and one or three years), its success has a positive impact on financial and non-financial indicators. In the annual reports of selected organizations, we have identified that the implementation of ERP systems does not affect internal control in terms of financial reporting ([65], 2020), enabling the significant progress made in validating and accurately reporting with these systems.
According to the annual report published on the Valora website in 2020, we can see how the ERP system’s modules can be combined with customized ones, depending on the activity carried out by an organization. The purpose of combining these modules is to create an open environment that increases the visibility of information for many employees in the organization, given that all information processed is stored in the common database of the ERP system.
After analyzing the financial and non-financial data, which were collected from the annual reports published by organizations on their websites, we conclude that for the most part these indicators have improved significantly, and only in a few cases did we encounter negative situations as a result of implementing these systems. The results obtained refer to the theoretical context, as the purpose of ERP systems is to allow users of financial information to monitor and control the information within the organization, so as to improve the quality of the activity and the decisions made in organizations. As we mentioned in the theoretical background section, the information derived from ERP systems is useful to the interested parties, as it helps to establish the strategy of the organization.

Author Contributions

The three authors contributed equally to the article to find and extract relevant ideas from the references selected. Also, the three authors worked together on the processing, data analysis and formulation of final conclusions. All authors have read and agreed to the published version of the manuscript.

Funding

This research received no external funding.

Institutional Review Board Statement

Not applicable.

Informed Consent Statement

Not applicable.

Data Availability Statement

The data used in this article were collected from annual reports published on organization’s website, which are presented in the section of references.

Conflicts of Interest

The authors declare no conflict of interest.

Implications and Limitations

The initial population was represented by a sample of 37 organizations, out of which 15 organizations were removed, because their annual reports were not available. For the remaining organizations, where the year of implementation of the ERP systems was 2020, the annual reports for 2021 were not available, thus data were not collected.

References

  1. Galy, E.; Sauceda, M.J. Post-implementation practices of ERP systems and their relationship to financial performance. Inf. Manag. 2014, 51, 310–319. [Google Scholar] [CrossRef]
  2. Hadidi, M.; Al-Rashdan, M.; Hadidi, S.; Soubhi, Y. Comparison between Cloud ERP and traditional. ER J. Crit. Rev. 2020, 7, 140–142. [Google Scholar]
  3. Lee, D.; Lee, S.M.; Olson, D.L. The effect of organizational support on ERP implementation. Ind. Manag. Data Syst. 2010, 110, 269–283. [Google Scholar] [CrossRef]
  4. Mainu, R.O.; Twum, A.D.; Konadu, A.; Ohene-Amoako, D. Assessing the Impact of Implementing ERP Systems on the Operational Performance of Businesses. Int. J. Econ. Manag. Sci. 2019, 8, 1–10. [Google Scholar]
  5. Nicolaou, A.I.; Bhattacharya, S. Organizational performance effects of ERP systems usage: The impact of post-implementation changes. Int. J. Account. Inf. Syst. 2006, 7, 18–35. [Google Scholar] [CrossRef]
  6. Ammar, S.; Mardini, G.H. Enterprise resource planning enabling segmental information reporting practices of UK-FTSE 100. Account. Financ. 2020, 61, 1205–1237. [Google Scholar] [CrossRef]
  7. Chen, H.-J.; Huang, S.Y.; Chiu, A.-A.; Pai, F.-C. The ERP system impact on the role of accountants. Ind. Manag. Data Syst. 2012, 112, 83–101. [Google Scholar] [CrossRef] [Green Version]
  8. HassabElnaby, H.R.; Hwang, W.; Vonderembse, M.A. The impact of ERP im-plementation on organizational capabilities and firm performance. Bench-Marking: Int. J. 2012, 19, 618–633. [Google Scholar] [CrossRef]
  9. Wier, B.; Hunton, J.; HassabElnaby, H.R. Enterprise resource planning systems and non-financial performance incentives: The joint impact on corporate performance. Int. J. Account. Inf. Syst. 2007, 8, 165–190. [Google Scholar] [CrossRef]
  10. Azan, W.; Bollecker, M. Management control competencies and ERP: An empirical analysis in France. J. Model. Manag. 2011, 6, 178–199. [Google Scholar]
  11. Velcu, O. Exploring the effects of ERP systems on organizational performance. Ind. Manag. Data Syst. 2007, 107, 1316–1334. [Google Scholar] [CrossRef]
  12. Anita, I.; Sharbani, H. The effect of Enterprise Resource Planning (ERP) systems implementation on organizational performance. In Proceedings of the International Conference on Economics, Entrepreneurship and Management 2021 (ICEEM 2021), Istanbul, Turkey, 20–21 December 2021. [Google Scholar]
  13. Senior Software. Available online: https://www.seniorsoftware.ro/demonstratie-gratuita-erp/?utm_source=adwords&utm_term=senior%20software%20erp&utm_content=353865631881&Network=Search&SiteTarget=&gclid=EAIaIQobChMI1ey2r6nF8gIVSuuyCh2u4QmeEAAYASAAEgLhNfD_BwE (accessed on 10 June 2021).
  14. Shaker, A. What is an ERP? Available online: https://ro.linkedin.com/pulse/ce-este-un-erp-alina-shaker (accessed on 25 July 2021).
  15. Law, C.C.; Ngai, E.W. ERP systems adoption: An exploratory study of the organizational factors and impacts of ERP success. Inf. Manag. 2007, 44, 418–432. [Google Scholar] [CrossRef]
  16. Elhasnaoui, S. Analysis of the role of IT Governance on ERP Systems implementation. Int. J. Web-Based Learn. Teach. Technol. 2021, 16, 18–26. [Google Scholar] [CrossRef]
  17. Rom, A.; Rohde, C. Enterprise resource planning systems, strategic enterprise management systems and management accounting: A Danish study. J. Enterp. Inf. Manag. 2006, 19, 50–67. [Google Scholar] [CrossRef]
  18. Sheik, P.A.; Sulphey, M. Enterprise Resource Planning (ERP) As a Potential Tool for Organizational Effectiveness. Webology 2020, 17, 317–327. [Google Scholar] [CrossRef]
  19. Dashtbayaz, M.L.; Salehi, M.; Safdel, T. The effect of internal controls on financial reporting quality in Iranian family firms. J. Fam. Bus. Manag. 2019, 9, 254–270. [Google Scholar] [CrossRef]
  20. Rodriguez, C.S.; Spraakman, G. ERP systems and management accounting: A multiple case study. Qual. Res. Account. Manag. 2012, 9, 398–414. [Google Scholar] [CrossRef]
  21. Granlund, M.; Malmi, T. Moderate impact of ERPS on management accounting: A lag or permanent outcome? Manag. Account. Res. 2002, 13, 299–321. [Google Scholar] [CrossRef] [Green Version]
  22. Pohludka, M.; Stverkova, H.; ´ Slusarczyk, B. Implementation and Unification of the ERP System in a Global Company as a Strategic Decision for Sustainable Entrepreneur. Sustainability 2018, 10, 2916. [Google Scholar] [CrossRef] [Green Version]
  23. Ciocan, C.C.; Carp, M.; Georgescu, I. The Determinants of the Financial Re-porting Quality: Empirical Evidence for Romania. Audit. Financ. 2021, 2, 301–319. [Google Scholar] [CrossRef]
  24. Nechita, E. The Value Relevance of Non-Financial Reporting in Determining the Market Value of Equity. Audit. Financ. 2021, 19, 320–336. [Google Scholar] [CrossRef]
  25. Gärtner, B.; Feldbauer-Durstmüller, B.; Duller, C. Enterprise Size Impact on the ERP System Implementation. Int. J. Strateg. Manag. 2013, 13, 17–30. [Google Scholar] [CrossRef]
  26. Elragal, A.A.; Al-Serafi, A.M. The Effect of ERP System Implementation on Business Performance: An Exploratory Case-Study. Commun. IBIMA 2011, 670212, 1–20. [Google Scholar] [CrossRef] [Green Version]
  27. Dumitru, V.F.; Albu, N.; Albu, C.N.; Dumitru, M. ERP implementation and organizational performance. A Romanian case study of best practices. Amfiteatru Econ. J. 2013, 15, 518–531. [Google Scholar]
  28. Mandal, P.; Gunasekaran, A. Issues in implementing ERP: A case study. Eur. J. Oper. Res. 2003, 146, 274–283. [Google Scholar] [CrossRef]
  29. Luciana, D.; Soewarno, N. Isnalita impact of enterprise resource planning systems on the accounting information relevance and firm performance. Russ. J. Agric. Socio-Econ. Sci. 2018, 80, 81–87. [Google Scholar] [CrossRef]
  30. Epicor. Available online: https://www.epicor.com/en/ (accessed on 11 June 2021).
  31. Microsoft Dynamics AX, Nav, G. Available online: https://dynamics.microsoft.com/en-us/ (accessed on 10 June 2021).
  32. Oracle. Available online: https://www.oracle.com/ro/erp/ (accessed on 10 June 2021).
  33. Oracle Netsuite. Available online: https://www.netsuite.com/portal/products/erp.shtml (accessed on 10 June 2021).
  34. SAP ERP. Available online: https://www.sap.com/products/enterprise-management-erp.html (accessed on 10 June 2021).
  35. CECCAR. Analiza Rentabilității și Riscul Întreprinderii. Available online: https://www.ceccarbusinessmagazine.ro/analiza-rentabilitatii-si-riscul-intreprinderii-a5226/ (accessed on 17 August 2021).
  36. Robu, V.; Anghel, I.; Șerban, E.C. Analiză Economico-Financiară a Firmei; Editura Economica: Bucharest, România, 2014; pp. 349–372. [Google Scholar]
  37. Mohagheghi, P.; Gilani, W.; Stefanescu, A.; Fernandez, M.A. An empirical study of the state of the practice and acceptance of model-driven engineering in four industrial cases. Empir. Softw. Eng. 2012, 18, 89–116. [Google Scholar] [CrossRef]
  38. Accenture—Annual Reports 2018, 2019 and 2020. Available online: https://www.accenture.com/us-en/about/company/annual-report (accessed on 10 August 2021).
  39. Avant—Annual Report 2015. Available online: https://www.avant.org.au›annual-report-2015 (accessed on 10 August 2021).
  40. Avant—Annual Report 2016. Available online: https://www.avant.org.au>DownloadAsset (accessed on 10 August 2021).
  41. Avant—Annual Report 2017. Available online: https://www.avant.org.au>DownloadAsset (accessed on 10 August 2021).
  42. Central Garden & Pet Company—Annual Reports 2004, 2005 and 2006. Available online: https://ir.central.com/sec-filings/annual-reports (accessed on 10 August 2021).
  43. Chatham Financial—Annual Reports 2017, 2018 and 2019. Available online: https://www.chathamfinancial.com/insights/2019-annual-european-business-review (accessed on 10 August 2021).
  44. Colgate-Palmolive—Annual Reports 2019 and 2020. Available online: https://investor.colgatepalmolive.com/financial-information/annual-reports/ (accessed on 11 August 2021).
  45. Cooper Standard Automotive Inc.—Annual Reports 2007, 2008 and 2009. Available online: https://www.annualreports.com/Company/cooper-standard-holdings-inc (accessed on 11 August 2021).
  46. Curtiss Wright—Annual Reports 2014, 2015 and 2016. Available online: https://investors.curtisswright.com/financials/annual-reports-and-proxy/default.aspx (accessed on 11 August 2021).
  47. Engie—Annual Reports 2017, 2018 and 2019. Available online: https://www.engie.com/en/financial-results (accessed on 11 August 2021).
  48. Gartner—Annual Report 2009, 2010 and 2011. Available online: https://investor.gartner.com/financial-information/sec-filings/default.aspx (accessed on 11 August 2021).
  49. Hewlett Packard Enterprise—Annual Reports 2018, 2019 and 2020. Available online: https://investors.hpe.com/financial/annual-reports (accessed on 11 August 2021).
  50. HP Inc.—Annual Reports 2016, 2017 and 2018. Available online: https://investor.hp.com/financials/annual-reports-and-proxies/default.aspx (accessed on 11 August 2021).
  51. Johnson & Johnson—Annual Reports 2003, 2004 and 2005. Available online: https://www.annualreports.com/Company/johnson-johnson (accessed on 11 August 2021).
  52. Landbay—Annual Reports 2019. Available online: https://sec.report/Document/0001672572-19-000006/ (accessed on 11 August 2021).
  53. Landbay—Annual Reports 2020. Available online: https://sec.report/Document/0001017386-20-000187/ (accessed on 11 August 2021).
  54. Robert Bosch Power Tools GmbH—Annual Report 2015. Available online: https://assets.bosch.com/media/en/global/bosch_group/our_figures/publication_archive/pdf_1/gb2015.pdf (accessed on 11 August 2021).
  55. Robert Bosch Power Tools GmbH—Annual Report 2016. Available online: https://www.annualreports.com/HostedData/AnnualReportArchive/b/bosch_2016.pdf (accessed on 11 August 2021).
  56. Robert Bosch Power Tools GmbH—Annual Report 2017. Available online: https://www.annualreports.com/HostedData/AnnualReportArchive/b/bosch_2017.pdf (accessed on 11 August 2021).
  57. Siemens Gamesa Renewable Energy S.A—Annual Report 2016. Available online: https://www.siemensgamesa.com/-/media/siemensgamesa/downloads/en/investors-and-shareholders/annual-reports/2016/2016-annual-report.pdf (accessed on 12 August 2021).
  58. SIFCO Industries Inc.—Annual Reports 2014, 2015 and 2016. Available online: https://sifco.com/investor-relations/annual-reports/ (accessed on 12 August 2021).
  59. Sopharma—Annual Reports 2016, 2017 and 2018. Available online: https://www.sopharmagroup.com/en/investor/financial-reports (accessed on 12 August 2021).
  60. Tikkurila Sverige AB—Annual Reports 2015, 2016 and 2017. Available online: https://www.tikkurilagroup.com/investorsreports-and-presentations/annual-reports (accessed on 12 August 2021).
  61. Titan Shops, a Division of CSU Fullerton Auxiliary Services Corporation—Annual Report 2017. Available online: https://www.titancompany.in/sites/default/files/Titan%20Annual%20Report%202017-18_0_0.pdf (accessed on 12 August 2021).
  62. Titan Shops, a Division of CSU Fullerton Auxiliary Services Corporation—Annual Report 2018. Available online: https://www.titancompany.in/sites/default/files/Titan%2035th%20ANNUAL%20REPORT%202018-19_1.pdf (accessed on 12 August 2021).
  63. Titan Shops, a Division of CSU Fullerton Auxiliary Services Corporation—Annual Report 2019. Available online: https://www.titancompany.in/sites/default/files/Annual_Report_2019_20.pdf (accessed on 12 August 2021).
  64. Toyota—Annual Reports 2017, 2018 and 2019. Available online: https://global.toyota/en/ir/library/annual/ (accessed on 12 August 2021).
  65. Tyson Foods Inc.—Annual Reports 2018, 2019 and 2020. Available online: https://ir.tyson.com/reports/annual-reports/default.aspx (accessed on 12 August 2021).
  66. Valora—Annual Reports 2019 and 2020. Available online: https://www.valora.com/en/investors/publications/ (accessed on 12 August 2021).
  67. Bordeianu, S. Analiza Diagnostic pe baza Ratelor de Rentabilitate. Available online: http://www.oeconomica.uab.ro/upload/lucrari/820062/08.pdf (accessed on 18 August 2021).
Figure 1. Process of implementing an ERP system. Source: [22].
Sustainability 13 11566 g001
Figure 2. Selected organizations operating in various fields, initial sample. Source: Author’s creation based on sources [38,39,40,41,42,43,44,45,46,47,48,49,50,51,52,53,54,55,56,57,58,59,60,61,62,63,64,65,66].
Sustainability 13 11566 g002
Figure 3. Current liquidity rate. Source: Author’s creation based on information collected from annual reports.
Sustainability 13 11566 g003
Figure 4. Intermediate liquidity rate (Quick ratio). Source: Author’s creation based on information collected from annual reports.
Sustainability 13 11566 g004
Figure 5. Liquidity rate at first sight. Source: Author’s creation based on information collected from annual reports.
Sustainability 13 11566 g005
Figure 6. Global solvency rate. Source: Author’s creation based on information collected from annual reports.
Sustainability 13 11566 g006
Figure 7. Patrimony solvency rate. Source: Author’s creation based on information collected from annual reports.
Sustainability 13 11566 g007
Figure 8. Return on assets (ROA) and return on equity (ROE) (expressed in %). Source: Author’s creation based on information collected from annual reports.
Sustainability 13 11566 g008
Figure 9. Return on sales (ROS) and return on resources consumed (RRC) (expressed in %). Source: Author’s creation based on information collected from annual reports.
Sustainability 13 11566 g009
Figure 10. Speed and duration of rotation of the assets. Source: Author’s creation based on information collected from annual reports.
Sustainability 13 11566 g010
Figure 11. Corporate governance. Source: Author’s creation based on information collected from annual reports.
Sustainability 13 11566 g011
Table 1. Financial and non-financials indicators selected for our study.
VariablesFormulaShort Description
Financial indicators
Current liquidity rateCurrent assets/Short-term debtsLiquidity indicators reflect the organization’s ability to pay its short-term obligations at maturity based on current assets represented by stocks, receivables, investments.
Intermediate liquidity rate (Quick ratio)Current assets and inventories/Short-term debts
Liquidity rate at sightCash and cash equivalents + Short-term investments/Current debts
Global solvency rateTotal assets/Total debtsSolvency indicators provide information on the ability to cover total debts.
Patrimony solvency rateOwn capital/Own capital + Bank credits
Return on assets (ROA)Operating result/Operating assets × 100 OR Gross profit/Total assets × 100Profitability indicators show whether the organization uses all resources to generate profit. Rates of return provide information about the efficiency of the business activity of the organization, mainly reflecting the relationship between turnover and profit or total costs related to the sale. The rate of return on assets highlights the performance when using the total asset, with respect to the invested capital to obtain the performance in the developed activity.
Return on equity (ROE)Net profit/Own capital × 100
Return on sales (ROS)Profit/Turnover × 100
Return on consumed resources (RRC)Operating result/Operating expenses × 100
Speed of rotation of the assetsTurnover/Average of current assets, where average of current assets = (Initial sold + Final sold)/2These indicators measure the speed and turnover of current assets. The speed of rotation assets highlights the intensity of exploitation of the organization’s assets, thus showing how much capital has been invested to obtain annual turnover. However, from the duration of the rotation we can observe the number of days necessary for the recovery of the assets.
Duration of rotation of the assetsAverage of current assets/Turnover × T, where T = 365 days
Non-financial indicators
Number of directorsThe information provided in the annual reportsThese indicators are needed to observe how many members are needed in the decision-making process and whether the set objectives are met.
Executive members
Non-executive members
The corporate governance modelThe reason we chose this indicator was to see if the selected organizations want to maximize their financial results (shareholders model) or if they incorporate corporate responsibility to protect the interests of all stakeholders (stakeholders model).
One-tier board vs. two-tier boardThe purpose of this indicator is to highlight the structure of the organizations selected for the sample.
SustainabilityThis indicator represents all the forms and methods of socio-economic development that ensure a balance between social, economic and ecological aspects and elements of natural capital. If an organization decides to be sustainable, it can obtain financial and non-financial benefits.
AuditThis indicator shows the degree of credibility presented in the reports.
Source: Author’s creation adapted after sources [35,36].
Publisher’s Note: MDPI stays neutral with regard to jurisdictional claims in published maps and institutional affiliations.