Abstract
S city in China has implemented a waste classification system and constructed a waste classification model with government-led market and public participation. In order to explore the effectiveness of waste classification input in S city, this paper conducts analyses from the points of view of the classification facility’s construction, environmental effectiveness, social acceptability and operation sustainability, based on interviews with and questionnaire surveys completed by related parties. The results show that the current waste classification facility system in S city is basically completed; high rates of both properties and residents comply with the waste classification system. S city has established a government-led waste classification pattern that depends on social participation. This pattern has been recognized and accepted by residents and is economically sustainable. At the same time, it is pointed out that the current marginal effectiveness of the waste classification input is showing a declining trend. Future investment should shift from investment in facilities and equipment to incentives for autonomous management by residents, and the corresponding evaluation of investment and effectiveness should also change accordingly. This requires the government to guide the refined management system.
1. Introduction
In recent years, China’s economic growth has been strong. With the acceleration of the urbanization process and the surge in the urban population, the dilemma of “urban garbage besieged cities” has become one of the main problems causing urban environmental pollution in China [1,2]. According to the National Bureau of Statistics of China, China’s urbanization rate reached 60.6% at the end of 2019 and is still increasing at an annual rate of 1%. The amount of domestic waste produced in China’s cities exceeds 150 million tons per year and is growing at an annual rate of 8–10% [3], posing a huge threat to the sustainable development of Chinese cities.
China proposes a waste sorting system to tackle its waste problem. In June 2019, China issued the “Notice on the comprehensive development of household Waste classification in cities at the prefecture level and above”, and made the following decision: Starting from 2019, the classification of municipal domestic waste at the prefectural level and above was to be fully implemented, and the waste classification system will be established in cities by 2025.
At present, the mandatory classification of household waste in S city mainly promotes the implementation of the classification policy through the mobilization of four levels of organizations: city–district–subdistrict–community. This mobilization method promotes participation by the government, residents and enterprises in tackling the public issue of waste classification. Through multilevel supervision and evaluation, the effect of waste classification in S city has been improved. However, some scholars have doubts about the effectiveness of the input of the government, neighborhood committees, and property companies on the sustainability of the current waste classification pattern, and whether this pattern can be replicated and promoted in other cities in China. To this end, based on this research project, our paper investigated the cost allocation of waste classification in residential areas of S city, analyzed the input effectiveness of the subdistrict office, neighborhood committee and property company, and explored sustainable waste classification in S city.
2. Literature Review
2.1. Cost Composition of Urban Waste Management System
In many countries, the cost composition of the MSW management system is mainly analyzed from the perspective of the whole city and the whole life cycle [4,5]. Goran Boskovic et al. [5] pointed out that the cost of MSW system includes the cost of waste collection, transportation and disposal. Waste collection and transportation can account for up to 70% of the urban MSW system costs. Rosaria Chifari et al. [6] analyzed the cost of the Japanese MSW management system, they pointed out that the system cost included the cost of three stages of waste collection, treatment and disposal. They pointed out that the cost of the three stages had economies of scale, and the elasticity of the collection cost was less than that of the disposal cost. Vitor Sousa [7] developed and designed a municipal solid waste management system. In economic analysis, operational and investment costs were included in environmental externalities costs to analyze the total social costs. It was pointed out that the environmental benefits will grow with the improvement of waste recovery and the recycling rate. The two options that combined the highest recycling targets with higher transport efficiency and more composting produced the best economic results, reducing the total costs to society by 31% and 33%, respectively.
Thus, higher waste collection and recycling efficiency can not only improve environmental benefits, but also reduce the total cost to society. Meanwhile, the cost of waste collection is an important part of the input of waste management. With the advancement of waste classification, the cost of waste collection has gradually increased. At the same time, the cost of this stage has the characteristic of having little elasticity, so continuous and large investment in the waste collection part is required. In the process of promoting waste classification, it is of great significance to study the cost of waste collection to promote sustainable waste management.
2.2. Identification of Influencing Factors of Waste Management Service Cost
The factors that affect the cost of waste management service system include the amount of waste disposal, population density, service supply mode, classification and so on. Besides, population size, density and waste production have a significant impact on the cost. Rosaria Chifari [6] studied the Japanese municipal solid waste management system and pointed out that a 1% increase in total waste throughput would lead to a 0.89% increase in total cost. In large cities with a population of more than 50,000, if population density increases by 1%then total costs will decrease by 0.07%. Folz [8] studied the effects of waste recycling in 25 U.S. states between 1989 and 1996. He found that the average total recycling cost for all cities increased by 220% between 1989 and 1996, with cities with a population of more than 50,000 increasing their costs the most. However, unit costs fell by 13% over the same period. With the increase in population and recycling volume, there are economies of scale in waste recycling. The larger the population size and recycling scale of a city, the lower the unit cost.
The way of waste management services also has an impact on costs [9,10]. Many scholars have studied the impact of the supply pattern of municipal solid waste management services on the cost. In 1965, Hirsch [11] was the first to conduct empirical research on the impact of the production forms of municipal services (public production or private production) on costs. He took 24 cities in St. Louis County as samples, and the amount of waste collection, weekly frequency of collection, collection point (individual or collective), residential density, and service types of financing (general budget or specific tax) and service management form as explanatory variables of the average cost. The study found that there is no significant difference between public and private production service costs. Subsequently, Kitchen of Canada, Kemper and Quigley of America and Pommerehne and Frey of Switzerland [12,13] fine-tuned Hirsch’s model and concluded that private production could significantly reduce costs. Rosaria Chifari [6] analyzed the cost of the Japanese municipal solid waste management system and pointed out that private supply could significantly reduce the cost of the waste system. Therefore, the introduction of social capital can help reduce the cost of waste management and improve the effectiveness of waste classification.
2.3. Burden of Waste Management Cost
Internationally, in order to cope with the growing demand for waste disposal services, many developed countries have established Extended Producer Responsibility systems to internalize the waste disposal costs by assuming responsibility for the post-consumption disposal of products [14]. For example, Germany has established the green dot binary disposal system, which provides an economic guarantee for the recycling of recyclable waste. Other developed countries have established waste tax systems based on the principle of “who produces is responsible”. However, although the waste tax has played a role in promoting the sustainable management of solid waste, some scholars point out that the effectiveness of the charge needs to be improved.
Xin Ren and Shunong Hu [15] point out that cost of recovery is the biggest challenge for MSW services, especially in developing countries. The study also concluded that user fees for MSW services are more effective than 3R (Reduce, Reuse, Recycle) incentives. This shift has implications for MSW management, such as designing cost recovery mechanisms and incentives or performance standards. In addition, the target of cost recovery for MSW services cannot be separated from the overall structure of government revenue and expenditure. Without responding to public doubts about the financial performance of municipal solid waste services, local authorities are likely to continue to face public resistance to any increase in user charges.
Karadağ Doğan et al. [16] studied the cost of municipal solid waste collection services in Istanbul and pointed out that the collection of Environmental Cleanliness Tax (ECT) was a means for the government to respond to the economic pressure of waste management. However, the ECT collection rate has decreased year by year (84 percent in 1994 and 64 percent in 2001), increasing the financial burden on local governments. To achieve the maximum tax efficiency, municipalities must increase tax collection rates and reduce unit collection costs. The privatization of solid waste services can reduce collection costs and increase tax recovery rates, resulting in more efficient use of municipal economic resources.
Historically, waste management services in China have mostly been paid for by the government. As early as 2004, China promulgated the garbage charging system. Some cities have established a household waste charging system, which is mostly tied in with property fees, water and electricity charges, which cannot achieve the purpose of reducing the amount of waste and promoting waste management. At present, the waste charging system is still facing resistance from residents, and the collection rate is low. The input of the waste management service is mostly related to the structure of urban fiscal revenue and expenditure.
It can be seen that the design of cost recovery mechanism and incentive system can help improve the effectiveness of waste classification and realize its sustainable management [17,18]. Internationally, the cost of waste is generally borne by the producer. The costs of the EPR system, the waste fee and tax system and the waste terminal disposal tax system are all essentially borne by consumers, which helps residents to participate in waste classification and realize the sustainability of waste classification.
2.4. Waste Classification Management and Effect Evaluation
The original purpose of waste classification was to reduce the environmental impact of terminal treatment. Since the 1990s, the circular economy has become a development trend across the international community. Both Germany and Japan began to set the development goals of circular economy [19,20], taking the recycling of waste as an important purpose of waste management, which resulted in the requirement for refined waste classification categories. Internationally, many countries have implemented waste classification policies. Although the classification methods are different, they are all based on reducing the difficulty of waste disposal to achieve the purpose of waste reduction. Western developed countries began to classify and manage domestic waste in the 1970s. After more than half a century of exploration, they have constructed diversified domestic waste classification patterns.
As for the effectiveness of MSW classification, many scholars have studied the performance of MSW classification from the perspective of the whole life cycle, including collection, clearance, treatment and other links [21,22,23,24]. Sunil Kumar et al. [25] assessed the status of municipal solid waste management in some Indian cities. The indicators include whether there is a penalty clause, whether there are brochures, whether to have communal bins, whether there is a point-to-point collection system, the type of fuel to use for transporting waste, the means of waste treatment, whether the waste transfer station is established, whether there are leach collection and treatment facilities, whether there are biogas recovery facilities, the remaining service life of the landfill (years), etc. Hari et al. [26] constructed a performance evaluation system for municipal solid waste disposal systems; the set parameters evaluated mainly included the system cost, fuel consumption, working time and recovery efficiency, and the performance evaluation system was then applied to the four types of waste pickup systems in a particular Swedish city. The study concluded that sorting and collecting was the most effective pattern. High participation rates and rates of sorting recycling have significantly reduced the cost of household waste collection.
Elvira Olay-Romero et al. [27] believed that the performance evaluation of MSW classification should include facility convenience, service quality, operation sustainability of operators and environmental effectiveness. Chao Luo et al. [28] constructed a sustainable evaluation index system, including economic indicators, social indicators, technical indicators and energy indicators. Junting Zhang et al. [29] believed that waste classification performance should include waste collection, transportation and recycling. The environmental impact, economic viability and social acceptability of waste classification should also be considered, and life cycle assessment (LCA) has been used to assess the overall environmental impact of municipal waste management in strategic planning and decision-making processes. Existing life cycle assessment studies cover a range of details from waste treatment technologies to applied modeling methods in solid waste management life cycle assessment. A global comparison of 45 cases shows that the implementation of integrated solid waste management systems in place of single landfill, incineration or open dumping treatments could provide an environmental benefit of 33–154% in terms of the impact of global warming trends. Multiple impact assessments of solid waste management systems are designed to achieve environmentally effective, economically affordable and socially acceptable goals. Luciana da Silva et al. [30] constructed a sustainability indicator system for the management of municipal solid waste in large and medium-sized cities around the world, covering generation, collection, landfill treatment, recycling, energy use, economic costs, culture, environmental education and social mobilization of MSW. The proposed set of 49 indicators is designed to promote sustainability, and meet the global commitment of cities to implement policies related to sustainable urban management, the sustainable development goals and sustainable governance in cities.
It can be seen that the emphasis of the performance evaluation index system is different in different periods of waste classification. In the early stages of the implementation of the waste classification policy, the emphasis is on constructing the infrastructure of the waste classification system; in the middle and later stages, the emphasis is on the participation in the whole process of waste classification and its environmental, economic and social benefits [31,32,33,34]. At present, China is in the early and middle stages of constructing its waste classification policy, so the evaluation of waste classification performance needs to focus on infrastructure construction, personnel participation, social acceptability and environmental effectiveness of the classification pattern.
2.5. Review
The cost of waste classification and collection is an important part of the cost of urban waste management systems. It has the characteristics of rigidity and economies of scale, and decreases with the optimization of waste classification patterns and the improvement of the classification effect. It is an international practice that the cost of waste classification should be borne by the producer, which makes it easier to promote the reduction of waste. Internationally, with the continuous development and improvement of the waste classification system, the evaluation points for the effectiveness of waste classification input have a gradual change trend, focusing on whether the classification input at different stages is environmentally effective, economically feasible, and socially acceptable, reflecting the sustainability of waste classification management.
At present, S city has only been forced to promote waste classification for two years, and the government’s assessment of waste classification has mainly focused on facilities and equipment construction, publicity activities, recycling services, effectiveness of classification and other aspects. Based on the research in the literature and the current progress of waste classification in S city, the infrastructure construction, the amount of separated wet waste, and the participation of property companies and residents in classification are the key indicators to analyze to assess the current environmental effectiveness, economic feasibility, and social acceptability of waste classification in S city, identifying factors that affect the effectiveness of waste classification, and providing reference material for the sustainable promotion of the classification pattern.
3. Research Methods and Hypothesis
3.1. Research Area
S city is one of the economic centers in China. With high economic development and high population density, the production of domestic waste in S city has surged. Over the past 40 years since the reform and opening up of China, the annual household waste production in S city has increased nearly 8 times [35]. S city has implemented a waste classification policy for 20 years, but this is the first time that it has implemented a mandatory waste classification policy.
In China, the funds for waste classification in residential areas come from subdistrict offices, neighborhood committees and property companies. Among them, subdistrict offices’ funds come from government allocations; the neighborhood committee is a non-governmental autonomous organization with less funds; a property company is a company that signs property contracts with residents and provides property services. At the same time, according to the newly promulgated waste classification regulations, the property company needs to perform the responsibility of waste classification.
3.2. Data Source
The investment data of subdistrict offices, neighborhood committees and property companies in this paper comes from a questionnaire survey of residential communities in S city in 2020. Using the method of stratified sampling, 144 residential areas were selected according to the classification standard score of residential waste classification. The contents of the questionnaire survey mainly include the specific input of subdistrict offices, neighborhood committees and property companies in the residential waste classification. Our investigation was supported by the municipal waste management office of S city.
The data concerning residents’ participation in waste classification comes from the research on the construction of a star rating system for community waste classification and reduction in 2019. The research was supported by Cheng Sheng environmental protection Co., Ltd. (Yixing, China). Different representative communities were selected in the research; they were chosen from 5 districts and counties, 16 streets and towns, covering 80 residential communities of various types. A total of 897 valid questionnaires filled in by residents were finally collected.
The score of residential waste classification assessment comes from the Appearance and Environment Department of S city. The assessment criteria for scoring are mainly composed of the organizational system, classification timeliness, daily management, recycling management, social evaluation, and third-party evaluation.
3.3. Research Methods
At present, it is common to study the cost of waste in cities at home and abroad. Most studies focus on the whole waste disposal and management system, focusing on the corresponding cost analysis for the whole process and life cycle of waste. There are some cost analyses on waste collection stage, but they still focus on analyzing the overall cost of urban collection and transportation. There are fewer cost analyses based on the community, and the existing ones are only case studies of the community. Therefore, the innovation of this paper is to study the input and effectiveness of waste classification from the residential area level.
The questionnaire on the cost of waste classification in residential areas investigated the input of subdistrict offices, neighborhood committees and property companies in waste classification. Through calculation, we have obtained various inputs of subdistrict offices, neighborhood committees and properties in 34 residential areas. The subdistrict offices, neighborhood committees and property companies corresponding to each community are different. The housing type, population and number of households in each community are also different.
We want to study the impact of the input of subdistrict offices, neighborhood committees and property companies on the effectiveness of community waste classification through the method of correlation analysis.
In the economic feasibility analysis, the data concerning the input of 81 property companies were used to analyze economic feasibility, but each community corresponds to only one property company, and subdistrict offices and neighborhood committees usually govern several communities. Therefore, we believe that the input of property companies in the community is unique, and it is also meaningful to analyze the input of property companies. We used SPSS for correlation analysis and regression analysis.
3.4. Hypothesis
Based on the existing literature and the research purpose, in order to evaluate the replicability and sustainability of waste classification pattern in S city, we put forward these four assumptions from the points of view of infrastructure construction, environmental effectiveness, social acceptability and economic feasibility:
Hypothesis 1.
Waste classification input in S city promotes the construction of infrastructure.
Hypothesis 2.
Waste classification input in S city promotes the separation of wet waste.
Hypothesis 3.
Waste classification input in S city promotes the participation of residents and waste treatment enterprises.
Hypothesis 4.
The operation of the waste classification model in S city is sustainable.
4. Results
4.1. Effectiveness Analysis of the Construction of Waste Classification Facilities
The questionnaire investigated the input of the subdistrict office, neighborhood committee and property company in waste classification in the residential area. The input data include infrastructure input, consumable input, publicity input, labor input and so on. The results show that in the annual increase in the total cost of waste classification, the subdistrict office bears the most, the neighborhood committee bears the least, and the property company bears the middle amount.
Among the new costs of waste classification, subsidies for community volunteers account for the highest proportion, and the second highest is the labor cost of residential properties. Publicity, facilities, subsidies for secondary classification, inspectors’ salaries, the purchase of green account services, trash cans, community supplies, subsidies for wet waste treatment equipment, and waste classification incentives all account for a relatively small proportion of the overall cost.
From Table 1 and Table 2, we can see that the integration of the urban sanitation system and the renewable resources system has basically achieved full coverage. The communities with integration points accounted for 97.1% of the total. The allocation of waste classification facilities in residential areas is the key point. In the investigated area, on average, 1.41 dustbin rooms have been built, 1.24 rebuilt, 2.05 fixed time placement sites have been built, 18.35 monitoring points for waste classification have been built, 1.85 wash basins have been built, 0.91 waste trucks have been added, and 22.65 new 240 L trash bins have been added, 3.47 new 120 L trash bins are added, and 5.88% of the communities had facilities for on-site wet waste disposal. It can be seen that at present, the construction of waste classification facilities in S city has basically been completed, which can guarantee the orderly operation of the waste classification system.

Table 1.
The construction of the urban sanitation system and renewable resource system integration point of the investigated community.
Table 2.
The construction of waste classification facilities in the investigated community.
To sum up, hypothesis one passed the test. Waste classification input in S city promotes the construction of infrastructure.
4.2. Environmental Effectiveness Analysis
According to the current situation of waste classification in S city, this paper uses the amount of wet waste to evaluate the environmental effect. An important purpose of waste classification is the separation of dry and wet waste. The dry and wet separated waste can be screened and filtered at the transfer station, and then transported to the waste incineration plant for incineration. The separation of wet waste not only reduces the transport weight, but also ensures higher combustion efficiency in later incineration. This can improve the efficiency of the incineration landfill plant, and reduce the burden on the environment.
According to Table 3, there is a significant positive correlation between the input of subdistrict offices and property companies and the amount of generated wet waste. It shows that the additional input of the subdistrict office and property companies due to waste classification has a significant positive impact on the separation of wet waste in residential areas. The increase in waste sorting input has promoted the separation of wet waste and improved the effectiveness of waste sorting in residential areas. Among them, the input of the subdistrict office, the number of households in the community and the type of housing in the community are significantly positively correlated with the amount of wet waste; in the input of the neighborhood committee and the input in other aspects are significantly positively related to the amount of wet waste; and the input of the property company, total property input, consumables input, labor input, waste sorting rewards, residential housing types, number of households, etc. are all significantly positively correlated with the amount of wet waste.
Table 3.
The relationship between the input of subdistrict offices, neighborhood committees, and property companies and the amount of wet waste.
Therefore, from the perspective of the environmental effectiveness of waste classification, the newly added input in waste classification has a significant effect on the separation of wet waste. At present, the input in waste classification by subdistrict office, neighborhood committees and property companies are very effective. Therefore, hypothesis two passed the test.
4.3. Analysis of Social Acceptability
According to the survey, 76.47% of the property companies said that the management cost of the community increased due to waste classification, which means that the property company actively responded to the requirements of the “S City Waste Classification Management Regulations” and invested manpower and material resources in the classification of domestic waste in residential areas. An important link has been constructed in the waste classification system.
Judging from the results of the survey on waste classification by residents, the residents’ awareness rate concerning waste classification was 96.2%, the participation rate was 90.5%, and the rate of correct responses was 84.6%. This shows that the current waste classification system in S city has a high degree of residents’ participation, and the residents, as important participants, have promoted the realization of waste classification.
It can be seen from the survey results that S city has established a waste classification pattern led by the government and actively participated in by society, having been recognized and accepted by the residents. Therefore, hypothesis three passed the test.
4.4. Operation Sustainability Analysis
From Figure 1, it can be obtained that the wages of inspection staff accounted for the highest proportion of costs, and other inputs due to waste classification, input in trash bins, waste classification incentives, publicity and training costs, and consumables accounted for a large proportion.
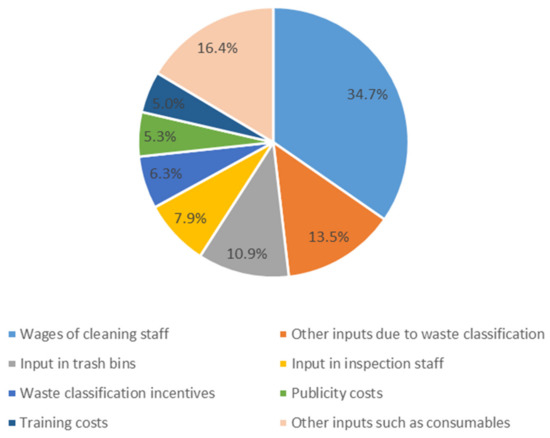
Figure 1.
Distribution of various inputs of property companies in waste classification.
A stepwise regression analysis of the total input in the community property company and the waste classification input is as follows:
Total property input = −0.516 + 0.266 consumables input + 1.07 labor input + 0.687 publicity input + 2.025 incentives + 0.004 number of households in the community − 7.451 × 10⁻⁵ wet waste volume − 1.168 × 10⁻⁷ dry waste volume (linear regression R2 = 0.963).
According to Table 4, after the ANOVA test, the equation is significant; thus, it can be seen that labor input and number of households in the community have an impact on property company inputs.
Table 4.
ANOVA test of regression model of property input.
The correlation analysis between the residential area’s waste classification assessment score, the amount of wet waste, the amount of dry waste and the amount of recyclable waste and each type of input of the property company was then carried out. As Table 5 and Table 6 show, the results are as follows: the score is only positively correlated with the input of the property company in the trash room, while there is no correlation between other input and the score. The amount of wet waste is positively related to the input in monitoring, deodorizing hand sanitizer, electricity, water, waste classification publicity, waste classification training and other inputs.
Table 5.
The relationship between the score and property company input.
Table 6.
The relationship between the amount of wet waste and property company input.
From the perspective of the scoring system of the City Appearance and Environment Bureau, the score is only positively correlated with the input in the property company’s trash bin room. From the perspective of the environmental effectiveness of waste classification, the amount of wet waste is significantly positively correlated with many inputs of the property.
By stepwise regression analysis between the amount of wet waste and various inputs of the property, we can obtain:
Amount of wet waste = 886.808 + 0.012 Increase in cleaners’ salaries due to waste classification + 0.185 Input of hand sanitizer, deodorant and other consumables (linear regression R2 = 0.281)
According to Table 7, by the ANOVA test, the equation is significant. There is a linear correlation between the amount of wet waste and the increase in cleaners’ salaries due to waste classification and the input of hand sanitizer, deodorant and consumables. Increasing the number of cleaners and ensuring the input of consumables such as hand sanitizer and deodorant can effectively increase the amount of wet waste generated in residential areas.
Table 7.
ANOVA test of regression model of the amount of wet waste.
From the above analysis of the effectiveness of the property company’s investment, it can be seen that on the one hand, the marginal benefit of the current input on the improvement of the waste classification assessment score shows a decreasing trend; on the other hand, the property input has a significant role in promoting the separation of wet waste. Although the existing evaluation indicators focusing on facilities promote waste classification for a period of time, they have shown a marginal declining trend, and the promotion potential is limited. The targeted input of the property in the residential area is conducive to the separation of wet waste in the community and improves the effectiveness of waste classification. At present, only infrastructure and human input cannot promote the sustainable development of waste sorting. Under the condition of complete infrastructure and personnel support, the improvement of the waste classification effect in the future cannot only rely on government investment, but needs to be corrected by improving the autonomy of residents. Promoting the multiagent participation of property companies and residents can further improve the classification effect.
Therefore, for hypothesis four, we see that the marginal performance of the government’s input in the construction of classified facilities system decreases, but the input of property companies supported by residents is effective, which brings economies of scale. Therefore, the transformation of the government’s input pattern and the continuous support of the residents are the key factors for the sustainability of this pattern.
5. Discussion
Xiao, Y et al. [36] pointed out in their 2007 study, at a time when source-separated collection at the household level was not a common practice in China, that the separation ratio of MSW in Beijing was only approximately 15%. Before the mandatory waste classification policy was issued in 2019, due to the low value of garbage, residents’ awareness of environmental protection was not strong enough, and residents lacked the incentives for source classification, so the waste source classification rate was not high. Dong Qing Zhang et al. [37] pointed out that systematic waste separation was a critical component of a successful integrated waste management system, and waste needs to be sorted at the source as much as possible in order to reduce the amount of waste requiring disposal. More accessible recycling facilities need to be provided and publicized to promote recycling behaviors [38,39,40]. Therefore, from the perspective of facility construction, wet waste separation and residents’ participation, waste classification in S city has achieved a phased victory.
However, the marginal benefit of the current investment mode shows a declining trend. If the current investment mode is still followed, on the one hand, it will bring the government’s finances under pressure; on the other hand, the government cannot achieve the sustainable management of waste classification. Efforts by the government alone are not enough in the process of promoting waste classification [41]. Xiangru Li et al. [42] pointed out that appropriate classification methods and patterns, sustainable publicity and supervision of source classification behavior, as well as sufficient financial support, will be key factors for domestic waste classification and resource management. At present, the financial support for waste classification in S city mainly comes from government investment, which is not sustainable in the long run [43,44]. To promote the sustainable management of waste classification, the participation of multiple stakeholders is required [45,46].
First, laws should be improved and punishment clauses refined. Only when citizens’ environmental obligations are expressed in laws can the call of “protecting the environment is everyone’s responsibility” in the government work report be fulfilled [47]. The specific requirements of “waste classification” should be included in the Environmental Protection Law, the Law on the Prevention and Control of Environmental Pollution by Solid Waste and other laws and regulations, and the punishment provisions should be added. It is necessary to draw lessons from the legislative experience in the field of waste classification in other countries, formulate laws related to the recycling of commodity packaging and household appliances, make it clear that consumers are responsible for waste classification and bear the costs of recycling, and make clear the obligations of production enterprises for recycling. Second, it is key to establish a “producer pays” and “polluter pays” system. The principle of “pollution has a price” should be established, and a new form of collecting waste fees from citizens or institutions should be established by setting up accounts of the actual amount of waste to be put in place. The metering fee system, quantitative free fee system or quota fee system should be carried out, and an interest mechanism for the penalty for wrong classification should be established.
Author Contributions
Conceptualization, Y.Z. and W.H.; methodology, Y.Z. and W.H.; software, Y.Z.; validation, Y.Z.; formal analysis, Y.Z.; investigation, Y.Z. and W.H.; resources, Y.Z. and W.H; data curation, Y.Z.; writing—original draft preparation, Y.Z.; writing—review and editing, Y.Z. and W.H.; visualization, Y.Z.; supervision, W.H.; project administration, W.H. All authors have read and agreed to the published version of the manuscript.
Funding
This research received no external funding.
Institutional Review Board Statement
Not applicable.
Informed Consent Statement
Informed consent was obtained from all subjects involved in the study. Written informed consent has been obtained from the patients to publish this paper.
Data Availability Statement
The data presented in this study are available on request from the corresponding author. The data are not publicly available due to China’s waste management departments are sensitive to costs, so it is not convenient to disclose them.
Acknowledgments
The authors thank the City Appearance and Environment Bureau of S city for providing the survey data.
Conflicts of Interest
The authors declare no conflict of interest.
References
- Kuang, Y.; Lin, B. Public participation and city sustainability: Evidence from Urban Garbage Classification in China. Sustain. Cities Soc. 2021, 67, 102741. [Google Scholar] [CrossRef]
- Li, W.; Wang, J. Household waste management in Shanghai and its implications for the second-tier cities in China. J. Clean. Prod. 2021, 321, 128980. [Google Scholar] [CrossRef]
- Ye, Q.; Anwar, M.A.; Zhou, R.; Asmi, F.; Ahmad, I. China’s green future and household solid waste: Challenges and prospects. Waste Manag. 2020, 105, 328–338. [Google Scholar] [CrossRef] [PubMed]
- Rogge, N.; De Jaeger, S. Measuring and explaining the cost efficiency of municipal solid waste collection and processing ser-vices. Omega 2013, 41, 653–664. [Google Scholar] [CrossRef]
- Boskovic, G.; Jovicic, N.; Jovanovic, S.; Simovic, V. Calculating the costs of waste collection: A methodological proposal. Waste Manag. Res. 2016, 34, 775–783. [Google Scholar] [CrossRef] [PubMed]
- Chifari, R.; Lo Piano, S.; Matsumoto, S.; Tasaki, T. Does recyclable separation reduce the cost of municipal waste management in Japan? Waste Manag. 2017, 60, 32–41. [Google Scholar] [CrossRef] [PubMed]
- Sousa, V.; Dias-Ferreira, C.; Vaz, J.M.; Meireles, I. Life-cycle cost as basis to optimize waste collection in space and time: A methodology for obtaining a detailed cost breakdown structure. Waste Manag. Res. 2018, 36, 788–799. [Google Scholar] [CrossRef]
- Folz, D.H. The Economics of Municipal Recycling: A Preliminary Analysis. Public Adm. Q. 1995, 19, 299–320. [Google Scholar]
- Campos-Alba, C.M.; Garrido-Rodriguez, J.C.; Plata-Diaz, A.M.; Perez-Lopez, G. The selective collection of municipal solid waste and other factors determining cost efficiency. An analysis of service provision by spanish municipalities. Waste Manag. 2021, 134, 11–20. [Google Scholar] [CrossRef]
- Williams, I.D.; Kelly, J. Green waste collection and the public’s recycling behaviour in the Borough of Wyre, England. Resour. Conserv. Recycl. 2003, 38, 139–159. [Google Scholar] [CrossRef]
- Hirsch, W.Z. Cost functions of an urban government service: Refuse collection. Rev. Econ. Stat. 1965, 47, 87–92. [Google Scholar] [CrossRef]
- Kitchen, H.M. A statistical estimation of an operating cost function for municipal refuse collection. Public Financ. Q. 1976, 4, 56–76. [Google Scholar] [CrossRef]
- Kemper, P.; Quigley, J. The Economics of Refuse Collection; Ballinger: Cambridge, UK, 1976. [Google Scholar]
- Simoes, P.; Marques, R.C. On the economic performance of the waste sector. A literature review. J. Environ. Manag. 2012, 106, 40–47. [Google Scholar] [CrossRef]
- Ren, X.; Hu, S. Cost recovery of municipal solid waste management in small cities of inland China. Waste Manag. Res. 2014, 32, 340–347. [Google Scholar] [CrossRef]
- Dŏgan, K.; Süleyman, S. Cost and financing of municipal solid waste collection services in Istanbul. Waste Manag. Res. 2003, 21, 480–485. [Google Scholar] [CrossRef]
- Hang, S.; Hu, D.; Lin, T.; Li, W.; Zhao, R.; Yang, H.; Pei, Y.; Jiang, L. Determinants affecting residents’ waste classification intention and behavior: A study based on TPB and A-B-C methodology. J. Environ. Manag. 2021, 290, 112591. [Google Scholar]
- Chen, S.; Huang, J.; Xiao, T.; Gao, J.; Bai, J.; Luo, W.; Dong, B. Carbon emissions under different domestic waste treatment modes induced by garbage classification: Case study in pilot communities in Shanghai, China. Sci. Total Environ. 2020, 717, 137193. [Google Scholar] [CrossRef]
- Minelgaite, A.; Liobikiene, G. Waste problem in European Union and its influence on waste management behaviours. Sci. Total Environ. 2019, 667, 86–93. [Google Scholar] [CrossRef]
- Honma, S.; Hu, J.-L. Cost efficiency of recycling and waste disposal in Japan. J. Clean. Prod. 2021, 284, 125274. [Google Scholar] [CrossRef]
- Espinoza Perez, L.; Ziegler-Rodriguez, K.; Espinoza Perez, A.T.; Vasquez, O.C.; Vazquez-Rowe, I. Closing the gap in the mu-nicipal solid waste management between metropolitan and regional cities from developing countries: A life cycle assessment approach. Waste Manag. 2021, 124, 314–324. [Google Scholar] [CrossRef] [PubMed]
- Greene, K.L.; Tonjes, D.J. Quantitative assessments of municipal waste management systems: Using different indicators to compare and rank programs in New York State. Waste Manag. 2014, 34, 825–836. [Google Scholar] [CrossRef] [Green Version]
- Ibanez-Fores, V.; Bovea, M.D.; Coutinho-Nobrega, C.; de Medeiros-Garcia, H.R.; Barreto-Lins, R. Temporal evolution of the environmental performance of implementing selective collection in municipal waste management systems in developing countries: A Brazilian case study. Waste Manag. 2018, 72, 65–77. [Google Scholar] [CrossRef] [PubMed]
- Romano, G.; Ferreira, D.C.; Marques, R.C.; Carosi, L. Waste services’ performance assessment: The case of Tuscany, Italy. Waste Manag. 2020, 118, 573–584. [Google Scholar] [CrossRef]
- Kumar, S.; Bhattacharyya, J.K.; Vaidya, A.N.; Chakrabarti, T.; Devotta, S.; Akolkar, A.B. Assessment of the status of municipal solid waste management in metro cities, state capitals, class I cities, and class II towns in India: An insight. Waste Manag. 2009, 29, 883–895. [Google Scholar] [CrossRef] [PubMed]
- Sharma, H.B.; Vanapalli, K.R.; Samal, B.; Cheela, V.R.S.; Dubey, B.K.; Bhattacharya, J. Circular economy approach in solid waste management system to achieve UN-SDGs: Solutions for post-COVID recovery. Sci. Total Environ. 2021, 800, 149605. [Google Scholar] [CrossRef] [PubMed]
- Olay-Romero, E.; Turcott-Cervantes, D.E.; Hernandez-Berriel, M.D.C.; Lobo-Garcia de Cortazar, A.; Cuartas-Hernandez, M.; de la Rosa-Gomez, I. Technical indicators to improve municipal solid waste management in developing countries: A case in Mexico. Waste Manag. 2020, 107, 201–210. [Google Scholar] [CrossRef] [PubMed]
- Luo, C.; Ju, Y.; Giannakis, M.; Dong, P.; Wang, A. A novel methodology to select sustainable municipal solid waste management scenarios from three-way decisions perspective. J. Clean. Prod. 2021, 280, 124312. [Google Scholar] [CrossRef]
- Zhang, J.; Qin, Q.; Li, G.; Tseng, C.H. Sustainable municipal waste management strategies through life cycle assessment method: A review. J. Environ. Manag. 2021, 287, 112238. [Google Scholar] [CrossRef] [PubMed]
- Da Silva, L.; Marques Prietto, P.D.; Pavan Korf, E. Sustainability indicators for urban solid waste management in large and medium-sized worldwide cities. J. Clean. Prod. 2019, 237, 117802. [Google Scholar] [CrossRef]
- Massoud, M.; Lameh, G.; Bardus, M.; Alameddine, I. Determinants of Waste Management Practices and Willingness to Pay for Improving Waste Services in a Low-Middle Income Country. Environ. Manag. 2021, 68, 198–209. [Google Scholar] [CrossRef]
- Sanjeevi, V.; Shahabudeen, P. Development of performance indicators for municipal solid waste management (PIMS): A review. Waste Manag. Res. 2015, 33, 1052–1065. [Google Scholar] [CrossRef]
- Suttibak, S.; Nitivattananon, V. Assessment of factors influencing the performance of solid waste recycling programs. Resour. Conserv. Recycl. 2008, 53, 45–56. [Google Scholar] [CrossRef]
- Tong, Y.D.; Huynh, T.D.X.; Khong, T.D. Understanding the role of informal sector for sustainable development of municipal solid waste management system: A case study in Vietnam. Waste Manag. 2021, 124, 118–127. [Google Scholar] [CrossRef] [PubMed]
- Guo, W.; Xi, B.; Huang, C.; Li, J.; Tang, Z.; Li, W.; Ma, C.; Wu, W. Solid waste management in China: Policy and driving factors in 2004–2019. Resour. Conserv. Recycl. 2021, 173, 105727. [Google Scholar] [CrossRef]
- Xiao, Y.; Bai, X.; Ouyang, Z.; Zheng, H.; Xing, F. The composition, trend and impact of urban solid waste in Beijing. Environ. Monit. Assess 2007, 135, 21–30. [Google Scholar] [CrossRef]
- Zhang, D.Q.; Tan, S.K.; Gersberg, R.M. Municipal solid waste management in China: Status, problems and challenges. J. Environ. Manag. 2010, 91, 1623–1633. [Google Scholar] [CrossRef]
- Li, Y.; Chu, Z.; Zhang, H.; Huang, W.C.; Liu, F. Predicting the implementation effect of the municipal solid waste mandatory classification policy based on the residents’ behavior. J. Air Waste Manag. Assoc. 2020, 70, 1303–1313. [Google Scholar] [CrossRef]
- Xiao, L.; Huang, S.; Ye, Z.; Zhang, O.; Lin, T. Identifying multiple stakeholders’ roles and network in urban waste separation management-a case study in Xiamen, China. J. Clean. Prod. 2021, 278, 123569. [Google Scholar]
- Wang, B.; Farooque, M.; Zhong, R.Y.; Zhang, A.; Liu, Y. Internet of Things (IoT)-Enabled accountability in source separation of household waste for a circular economy in China. J. Clean. Prod. 2021, 300, 126773. [Google Scholar] [CrossRef]
- Du, Y.; Wang, X.; Zhang, L.; Feger, K.-H.; Popp, J.; Sharpley, A. Multi-stakeholders’ preference for best management practices based on environmental awareness. J. Clean. Prod. 2019, 236, 117682. [Google Scholar] [CrossRef]
- Li, X.; Bi, F.; Han, Z.; Qin, Y.; Wang, H.; Wu, W. Garbage source classification performance, impact factor, and management strategy in rural areas of China: A case study in Hangzhou. Waste Manag. 2019, 89, 313–321. [Google Scholar] [CrossRef]
- Wang, C.; Zhang, X.; Sun, Q. The influence of economic incentives on residents’ intention to participate in online recycling: An experimental study from China. Resour. Conserv. Recycl. 2021, 169, 105497. [Google Scholar] [CrossRef]
- Ma, Z.; Li, C.; Xue, Y.; Nduneseokwu, C.K.; Wang, X.; Harder, M.K. From pioneer to promotion: How can residential waste diversion non-profit organizations (NPOs) best co-evolve in modern China? Environ. Chall. 2021, 3, 100055. [Google Scholar] [CrossRef]
- Arantes, V.; Zou, C.; Che, Y. Coping with waste: A government-NGO collaborative governance approach in Shanghai. J. Environ. Manag. 2020, 259, 109653. [Google Scholar] [CrossRef] [PubMed]
- Wang, S.; Wang, J.; Zhao, S.; Yang, S. Information publicity and resident’s waste separation behavior: An empirical study based on the norm activation model. Waste Manag. 2019, 87, 33–42. [Google Scholar] [CrossRef] [PubMed]
- Peng, H.; Shen, N.; Ying, H.; Wang, Q. Factor analysis and policy simulation of domestic waste classification behavior based on a multiagent study—Taking Shanghai’s garbage classification as an example. Environ. Impact Assess. Rev. 2021, 89, 106598. [Google Scholar] [CrossRef]

Publisher’s Note: MDPI stays neutral with regard to jurisdictional claims in published maps and institutional affiliations. |
© 2021 by the authors. Licensee MDPI, Basel, Switzerland. This article is an open access article distributed under the terms and conditions of the Creative Commons Attribution (CC BY) license (https://creativecommons.org/licenses/by/4.0/).