Article

Development of a Software System for Selecting Steam Power Plant to Convert Municipal Solid Waste to Energy

by
Rotimi A. Ibikunle
1,*,
Isaac F. Titiladunayo
2 and
Basil O. Akinnuli
3
1
Department of Mechanical Engineering, College of Engineering, Landmark University, PMB 1001, Ipetu Road, Omu-Aran 251103, Nigeria
2
Department of Mechanical Engineering, School of Engineering, Federal University of Technology, PMB 704, Akure 340106, Nigeria
3
Department of Industrial and Production Engineering, School of Engineering, Federal University of Technology, PMB 704, Akure 340106, Nigeria
*
Author to whom correspondence should be addressed.
Sustainability 2021, 13(21), 11665; https://doi.org/10.3390/su132111665
Submission received: 2 August 2021 / Revised: 25 August 2021 / Accepted: 31 August 2021 / Published: 21 October 2021
(This article belongs to the Special Issue Environmental Sustainability of Current Waste Management Practices)

Abstract

:
A software system that enhances the selection of appropriate power plant capacity that will convert combustible municipal solid waste (MSW) into energy was developed. The aggregate of waste to be converted was determined and the corresponding heating value was established. The capacities of steam power plants’ components required for the conversion were determined, using thermodynamic mathematical models. An algorithm based on models used to determine the energy potential, the power potential of MSW, the capacities of the components of the steam power plant, were translated into computer soft code using Java programming language; saturated steam and superheated steam tables, together with the thermodynamic properties of the power plant required were incorporated into the soft code. About 584 tons of MSW having a heating value of 20 MJ/kg was the quantity of waste experimented for energy generation. This information was input into the software as data and was processed. Then, the software was able to predict 3245.54 MWh energy potential for the quantity of waste, and electrical power potential of 40.54 MW. The capacities of the steam power plant components that were predicted include 100.35 MW of boiler power, 40.54 MW of turbine power, and 59.80 MW of condenser power. The methodology adopted will make it easy for the managers in the waste-to-energy sector to appropriately select the suitable capacity of the required steam power plant that can convert any quantify of MSW at any geographical location, without going through the engineering calculation and stress or rigor involved in the plant capacity design. Moreover, the accuracy obtained for the software is greater than 99%.

1. Introduction

Municipal solid waste (MSW), is a collection of materials resulted from man’s activities with his environment on daily basis, which are considered as not useful and are disposed of as wastes. MSW generation is on the high side over the years, around the globe, due to the increase in population, changes in taste, fashions, advancement in technology, and consumerism growth [1,2]. Islam [3] and Ibikunle [4,5] reported that the growth in MSW generation is due to the global quest for urbanism, social, and industrial development. Johari [6] stated that the sporadic increase in a waste generation will necessitate environmental challenges unless it is adequately and promptly managed. Ibikunle [7] remarked that the waste generated in the Ilorin metropolis of Kwara State is a huge one, and the waste management system available is insufficient; this makes people indulge in indiscriminate disposal of wastes which results in pollution, an unsightly scene, and blockage of waterways.
The global record on MSW production showed a generation rate of 680 million tons/annum in the year 2000 and it increased to 1300 million tons/annum in the year 2010. A projection of 2200 million tons/annum was made for the year 2025 while 4200 million tons/annum was projected for the year 2055 [8]. The rate of waste generation (MSW/capita/day) is a principal environmental pressure indicator required to estimate the intensity of waste generation for effective management planning [7]. Moreover, it is also useful in comparison of the degree of MSW generation between a nation and another. In the United Kingdom, the MSW rate of generation was recorded to be 1.34 kg/capita/day, 2.13 kg/capita/day for the United States, 2.00 kg/capita/day for South Africa, 0.09 kg/capita/day for Ghana, and 0.58 kg/capita/day for Nigeria, according to Parashar [9]. Nevertheless, Ibikunle [7] reported the rate of MSW production in the Ilorin metropolis to be 0.78 kg/capita/day, which is 20% greater than the rate estimated for waste production in Nigeria in 2016. The rate of growth in waste production in the nations is quite alarming, and this poses a threat for the waste management system especially in the Ilorin metropolis [7,10].
Lately, there is a growth in the power generation (technology) sector, utilizing renewable resources as an energy basis. Despite the development and expansion in power technology by utilizing renewable resources, 41% of Nigeria still does not have access to electricity [11]. This means only about 115 million Nigerians have access to electricity, out of about 196 million. Wind, hydro, solar, and biomass are the most utilized renewable energy resources for energy production throughout the globe, since the drive for sustainable and renewable energy [12]. It was reported by Ogunjuyigbe [13] and Ibikunle [4] that recovery of clean energy from MSW will promote a clean and green living environment for the growth of a nation and the standard of living of her citizens.
The governments of many nations are strategizing to have the rate of renewable energy (RE) generation increase by reducing costs while ameliorating the rate of greenhouse gases (GHGs) emission and fossil fuels dependence. This will ensure a clean and green environment, clean energy, and green industry, and the availability of more job opportunities and the like [14]. Fundamentally, energy is required as a strategic resource in the foundation formation for social and economic development. However, the rapid demographic growth and socio-economic development require high demand for energy [15]. It is predicted that the global demand for primary energy in 2050 will increase by 80%, which will pose a threat to energy security [16]. There is quite a large demand for power that is characterized by supply that does not satisfy the domestic and commercial demand. The need to secure new renewable energy and power sources is a principal global concern because of the constant depletion of fossil fuels. Moreover, it is a compulsory task now to ameliorate the emission of carbon dioxide (CO2) the prominent greenhouse gas (GHG) because of its consequential effect on climate change [2,17].
However, in urban cities of both developing and underdeveloped nations, there is always a massive generation of MSW, which is associated with the standard of living in metropolitan cities. Efficient management of MSW in most cities of Nigeria is a big issue [18,19]. In May (2019), the worldometer [20] reported the population of China to be 1418 million people, US—328 million, Japan—126 million, Germany—82 million, UK—66 million, and France—65 million people. The MSW generation in China is 46 million tons/year, in the US it is 262.4 million tons/year, Japan is 44 million tons/year, Germany is 51 million tons/year, the UK is 32 million tons/year, and France is 33 million tons/year [21]. Worldometer in May 2019 reported the population density of Nigeria, Ethiopia, Egypt, Tanzania, and South Africa to be 196 million, 108 million, 99 million, 59 million, and 57 million respectively. According to Kosuke [22], South Africa has a generation rate of 2.0 kg/capita/day, Nigeria has 0.58 kg/capita/day, Ethiopia has 0.3 kg/capita/day and Tanzania has 0.26 kg/capita/day. Therefore, by appropriation based on the generation rate and the population density, the MSW generated in Nigeria was estimated to be 42 million tons/year, Ethiopia was 12 million tons/year, Egypt was 44 million tons/year, Tanzania was 6 million tons/year, and South Africa was 42 million tons/year.
The number of power plants in China, US, Japan, Germany, the UK, and France is 166, 88, 822, 78, 14, and 37 respectively; while power generation in China is 18.7 million MWh, US is 14 million MW, Japan is 1.9 million kWh, Germany is 5768 GWh, the UK is 2782 GWh and 1999 GWh is in France [23]. Despite the enormous waste generated in African nations, and the recent development in WTE technology, Africa is still behind in waste-to-energy (WTE) practices. The first waste-to-energy (WTE) power plant in Africa is 110 MW of Ethiopia, and Ghana is proposing a 60 MW Armech thermal power plant [24]. Oladende [25] reported that the Nigeria Electricity Supply Industry (NESI) has 12 power stations in Nigeria with a total power output of 11,165 MW and yet could not produce power during an off-peak period of the Christmas holiday; moreover, the only 26,000-liter capacity biogas power plant, at Ikosi-Ketu market in Lagos, with about 10 KVA daily capacity, has not commenced operation. In South Africa, the renewable energy project put in place by the renewable independent power producer procurement programme (REIPPPP) is about 6327 MW altogether, in which landfill and biogas take 60 MW altogether [26]. The Ilorin metropolis that is selected for this study produces 302,000 tons of MSW per year, with a generating rate of 0.78 kg/capita/day; 70% of the aggregate waste generated is combustible, yet the city still faces an energy crisis [7]. The power supply by the Power Holding Company of Nigeria (PHCN) to the Ilorin metropolis is insufficient for her social and economic demand. Therefore, if energy recovery from waste components is adopted in Ilorin, it will provide a dual solution viz., efficient waste management and provision of alternative energy to energy from fossil fuels, which can complement the power supply from PHCN.
To practice WTE in any environment, the sufficiency and efficiency of the waste fractions required must be ascertained; the sufficiency of MSW is about the quantity of the waste fractions available for energy production and the regular flow in terms of the generation rate. The efficiency of waste is about the heating value and the correlation between the physicochemical properties of the MSW and its calorific value. When the sufficiency and the efficiency of the waste have been determined, then the choice of the appropriate WTE technology can be made. In this study, software was developed using Java programming language, an algorithm based on equations used to determine energy potential and electrical power potential of the municipal solid waste. The mathematical models used to determine the capacity of each of the equipment in the waste-fired power plant was prepared, which is translated into computer soft code using Java programming language, which is one of the common programming languages used in numerical analysis as well as a unified modeling language (UML) [27].
This study aims to provide software that will serve as a management and technical decision tool, to predict the capacity of steam power equipment that will convert MSW into energy at any geographical location, provided the available quantity of waste for energy and the low heating value (LHV) is also established. This study solves one of the technical challenges that could be encountered while trying to ascertain the capacity of the plant required. Nevertheless, the software developed in this study will predict the available energy and power potential in the waste to be converted, as well as the thermodynamic properties of the stages involved in the process. This software is referred to as a power plant selection support system because it helps in taking decisions on the appropriate capacity of the steam power plant required for a specific quantity of waste when its low heating value has been ascertained. The accuracy of the software is established by comparing the calculated values to the values generated by the software, and it is found to be above 99%.

Decision Support Systems (DSSs)

The computer-based interactive systems adopted to help the users to make the right decision or choice of activities and judgment are called DSSs; this is characterized by data bank and retrieval device. It enhances access to information and restoration of functions that support modeling and reasoning based on models. DSSs also support solving problems and framing. In most situations, the standard or quality of decisions taken can be used to correct the human error involved during decision-making. Disciplines that include operations research, economics, and statistics develop various methods for decision making. The methods can be enhanced by different scientific techniques that are based on artificial intelligence. Computer programs that either operate as tools on their own or as integrated computing environments are adopted for complex decisions. Such computing environments are called decision support systems (DSSs). The broad concept of a DSS is responsible for the variation in its definitions, therefore, every definition now depends on the author’s point of view. To embrace all perspectives, a DSS can be defined as a computer-based system that aids users in judgment and choice of activities [28]. This is the reason the software developed in this study, to select the appropriate capacity of steam power plant that will convert any quantity of combustible MSW to energy in any geographical location, is considered as a decision support system.
The design of a DSS and its analysis is so complex that it involves the usage of specific and adequate instruments and methodologies to model the decision processes. Customized and developed features can be used to implement a DSS for decision activities or by utilizing a generalized DSS that can later be customized. DSSs can either be specifically developed for an establishment, using programming languages or using DSS generators. The strategy involved in the software development either engages general-purpose programming language (GPL), such as C++, PASCAL, BASIC, or COBOL, or engages the use of fourth-generation language (4GL), such as VISUAL BASIC .NET, C# .NET, VISUAL J# .NET, DELPHI, JAVA, or VISUAL C++ [29]. The most appropriate area for the installation of a biomass power plant can best be selected by managers using a spatial decision support system. Fuzzy logic and fuzzy membership functions are used for the creation of criteria layers and suitability maps. Multicriteria Decision Analysis methodology (Analytical Hierarchy Process) combined with fuzzy system elements for the determination of the weight coefficients of the participating criteria are used [30]. Fatima [31] incorporated a decision support system in a power plant simulation tool to provide the qualitative synthesis needed for the plant design process, and to assist the design engineers in performing a better choice-evaluation for technical quantitative and qualitative analysis.
Konstantinos [32] stated that decision support systems (DSS) are an approach designed as a tool to help managers take decisions by accelerating the relevant processes. The DSS developed in this study is designed to accelerate processes required in the design of power plants, and concurrently predict the energy and power potentials available in a quantity of MSW. This DSS can predict the energy and power potentials of the MSW fractions that are available for power generation, predict the thermodynamic properties involved in each stage of the power cycle of the steam power plant, and also predict the capacity of each of the equipment in the power plant that will convert a particular quantity of MSW whose net heating value is known.

2. Materials and Methods

The MSW materials investigated in this article are the 9 combustible MSW fractions of the total 19 waste fractions identified in the Ilorin metropolis. These include paper, packaging boxes, grass/garden trimmings, rags, wood, food residue, nylon, polypropylene sacks, and plastic bottles. The quantity of the MSW available per day for energy production was established, and the net heating value was determined using an e-2k combustion calorimeter. The heat energy and the power potentials of the MSW were determined. Rankine reheat cycle was used to design the capacities of the steam power plant equipment required for energy production. The mathematical models utilized in determining the energy potential and the designing of the power plant capacity are used to form the algorithm used in the development of the software, called the decision support system. The software interfaces were developed using Java swing utilities that comprise JFrames, JTextrafields, JButtons, and JEditorpane for data display. Action listeners and action events were used to control the button functionalities, handle calculations, and panel/Editorpane displays [25].

2.1. Determination of the Aggregate MSW Generated in Ilorin/Year, Using Collection Facts and Figures

The aggregate MSW produced in the Ilorin metropolis of Kwara State between January and June 2021 was estimated by using the mathematical model in Equation (1), without the aid of a weighing bridge, as suggested by Kosuke [22] and Ibikunle [4,5,10].
  M S W g e n . = j = 1 365   i = 1 n C i × V i × d i × t i j × 0.74
The total number of trucks is n , the capacity of a truck is C i (m3/truck), the loading volume ratio of a truck is V i , the density of MSW loaded on the truck is d i (tons/m3), and the number of trips by truck is t i j on day j (frequency of trips/day).

2.2. Characterization of the MSW Fractions

It was reported by NT ENVIR 001 [33], Issam [34], and Ibikunle [4,5,10] that the huge MSW collected from different locations in the city can be effectively characterized through random sampling of some selected heaps of wastes deposited in the dumpsite. NT ENVIR 001 [33] suggested that 240 liters of a bin full of MSW are appropriate as a unit sample. The waste streams were characterized twice a week for six months, thereby making 48 different batches of samples for the characterization investigation at Lasoju dumpsite to avoid any consequences from the effect of insufficient samples. Each component identified was sorted into different receptacles and weighed.

2.3. Physicochemical and Heating Value Analysis of MSW

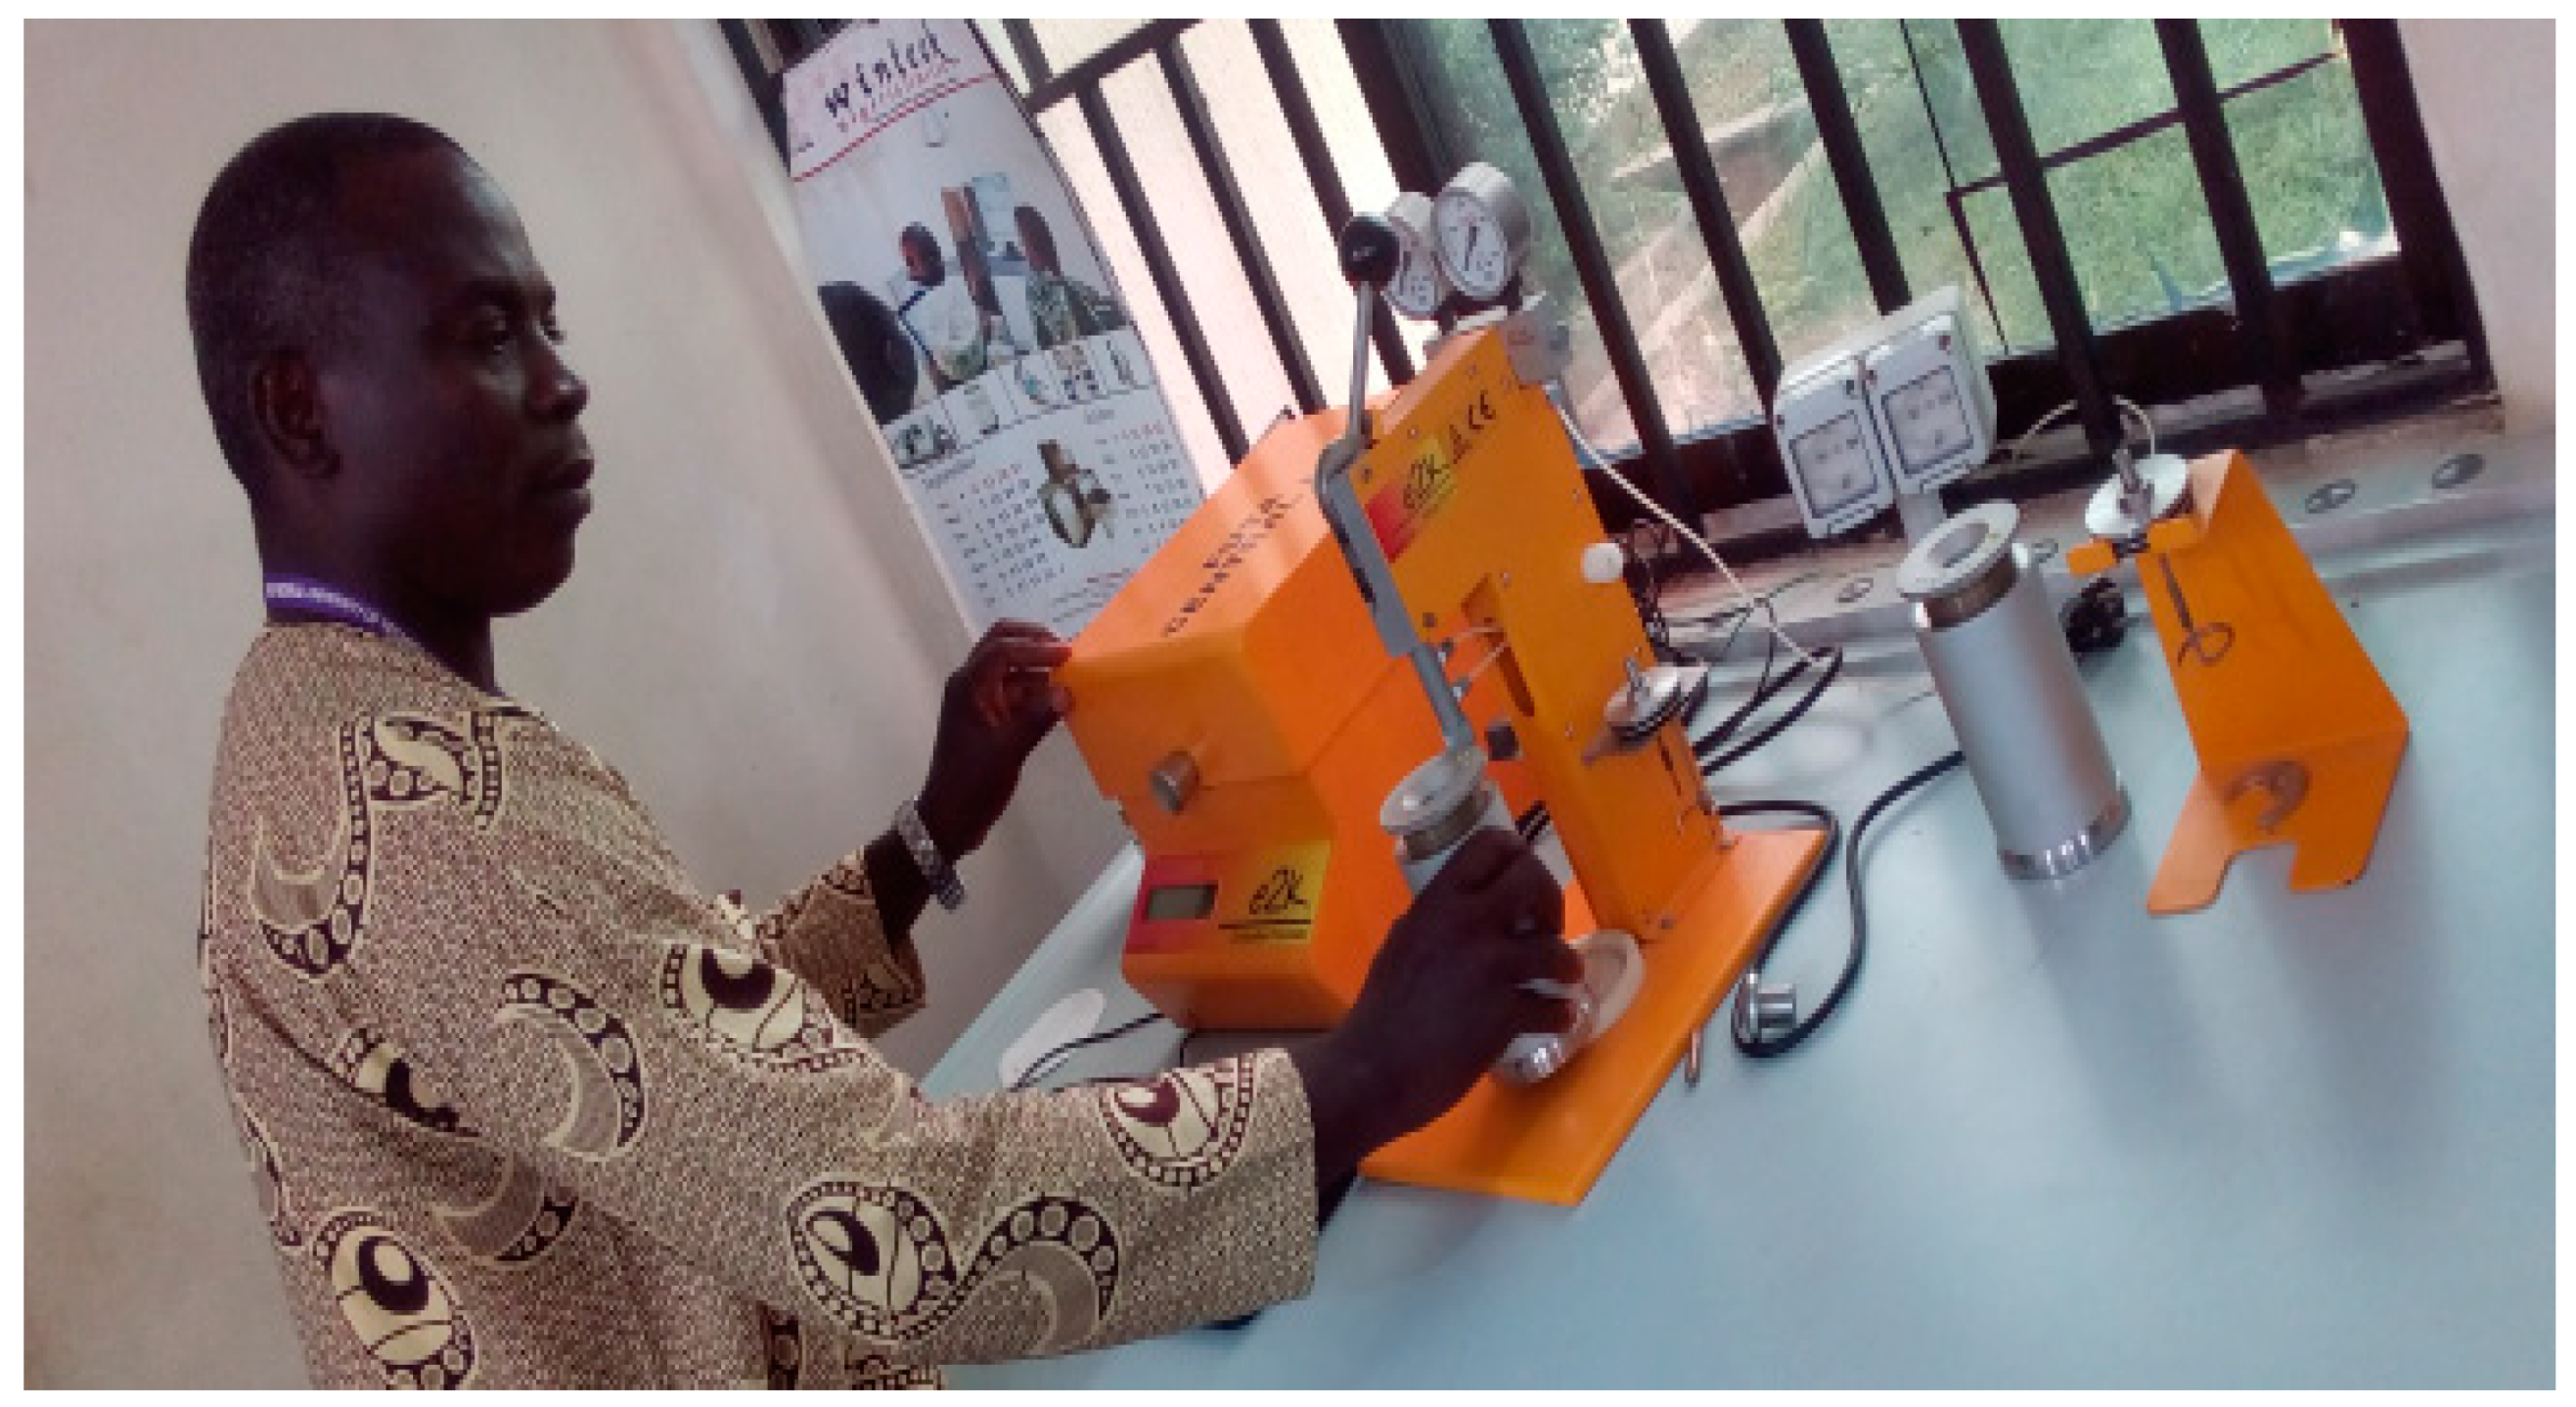
2.3.1. Moisture Content Analysis of MSW Components

The moisture content of the MSW combustible fractions was estimated using an electric oven (model DHG 9053) with a 200 °C capacity. About 1 g of powder of the sample of each component was measured into a crucible and dried in the oven, maintained at a temperature of 110 °C for an hour. The weight loss is considered as the moisture content of the waste component as suggested by Vairam [35], Shi [36], Titiladunayo [7], and Ibikunle [4,7,37] using Equation (2).
M C = W 2 W 3 W 2 W 1 × 100
where M C is the percentage moisture content, W 1 is the mass of empty crucible (g), W 2 is the mass of crucible and sample (g), W 3 is the mass of crucible and sample after heating (g), W 2   W 1   is the mass of sample (g), and W 2 W 3 is the moisture content (g).

2.3.2. Ultimate Analysis of MSW Components

Ultimate analysis was investigated to ascertain the quantitative value of the carbon (C), hydrogen (H), nitrogen (N), sulphur (S), and oxygen (O) percentage content that is available in the MSW components. The investigation was carried out using an elemental analyzer (Flash EA 1112 model), based on ASTM D5291. About 0.5 g of powdered sample of each component was measured into a crucible and combusted. The oxides of carbon, hydrogen, nitrogen, and sulphur produced were analyzed by thermal conductivity detector (TCD), and the electrical signal emerged was processed by ‘Eager 300 software’ to give the percentages of elements contained in the sample. The samples were replicated, and an average of the values obtained is considered as the typical value [2].

2.4. Estimation of the Heating Value of the MSW Combustible Fractions

Islam [3] and Shi [33] suggested that the high heating value (HHV) of solid fuel can be determined by using e-2k combustion calorimeter, shown in Figure 1. The low high heating value (LHV) of the nine combustible waste fractions presented in Table 3 was obtained by applying Equation (3), as adopted by Islam [3], Ibikunle [4], Ibikunle [10], Ibikunle [37], and Kumar [38], as well as adopting Dulong and Steuer models in Equations (4) and (5) respectively. The average of the LHV obtained from the three equations is considered the typical LHV [4,7].
L H V i = 1 9 W msw % × H H V msw
where W msw is the weight fraction (%) of the combustible MSW and H H V msw is the high heating value obtained by using a bomb calorimeter [4,10,37,38,39].
L H V i i = 81 C + 342.5 H O 8 + 22.5 S 6 W + 9 H
  L H V i i i = 81 C 3 8 O + 57 3 8 O + 345 H O 16 + 25 S 6 W + 9 H
In Equations (4) and (5), L H V i i   and   L H V i i i are the heating values estimated by adopting Dulong and Steuer models respectively, and carbon (C), hydrogen (H), sulfur (S), and oxygen (O) are the chemical elements obtained from the ultimate analysis.

2.5. Determination of the Energy Potential and Electrical Power Potential of the MSW

2.5.1. Determination of Energy Potentials ( E P m s w ) of the Municipal Solid Waste

Daura [39] and Ibikunle [10] reported that the energy potential ( E P m s w ) of MSW could be determined by applying Equation (6):
  E P m s w = L H V m s w   × w m s w   × 1000 3.6   kWh  
where E P m s w is the energy potential from MSW,   W m s w   (tons) is the weight of MSW, L H V m s w   is the net low heating value of the MSW (MJ/kg). Conversion ratio (1 kWh = 3.6 MJ).
E P m s w = 20 × 584 × 227.7   =   3,244,444   kWh   or   3.2   GWh

2.5.2. Determination of the Electrical Power Potential ( E P P m s w ) of the Municipal Solid Waste

The Electrical Power Potential ( E P P m s w ) of the MSW Is Determined Using Equation (7) as Suggested by Ibikunle [7,10] and Daura [39]
  E P P m s w = 277.8 × L H V m s w   × w m s w   24 × η   ( kW )
  E P P m s w = 40 , 602   kW
where η is the conversion efficiency in a power plant, which is within a range of 20–40% as reported by Muhammad [40] and Ibikunle [7,10]. However, conversion efficiency of 30% is adopted for this work.
Power   to   grid   G P   =   E P P m s w × η g × η p × 1 1000   ( MW )
G P = 27.3   MW
where η g is the generator efficiency (selected is 90%), η p is the transmission efficiency (selected is 75%) of turbine work ( W T ) . The generator efficiency range is 85–90% and turbine efficiency is within a range of 75–80% [41].

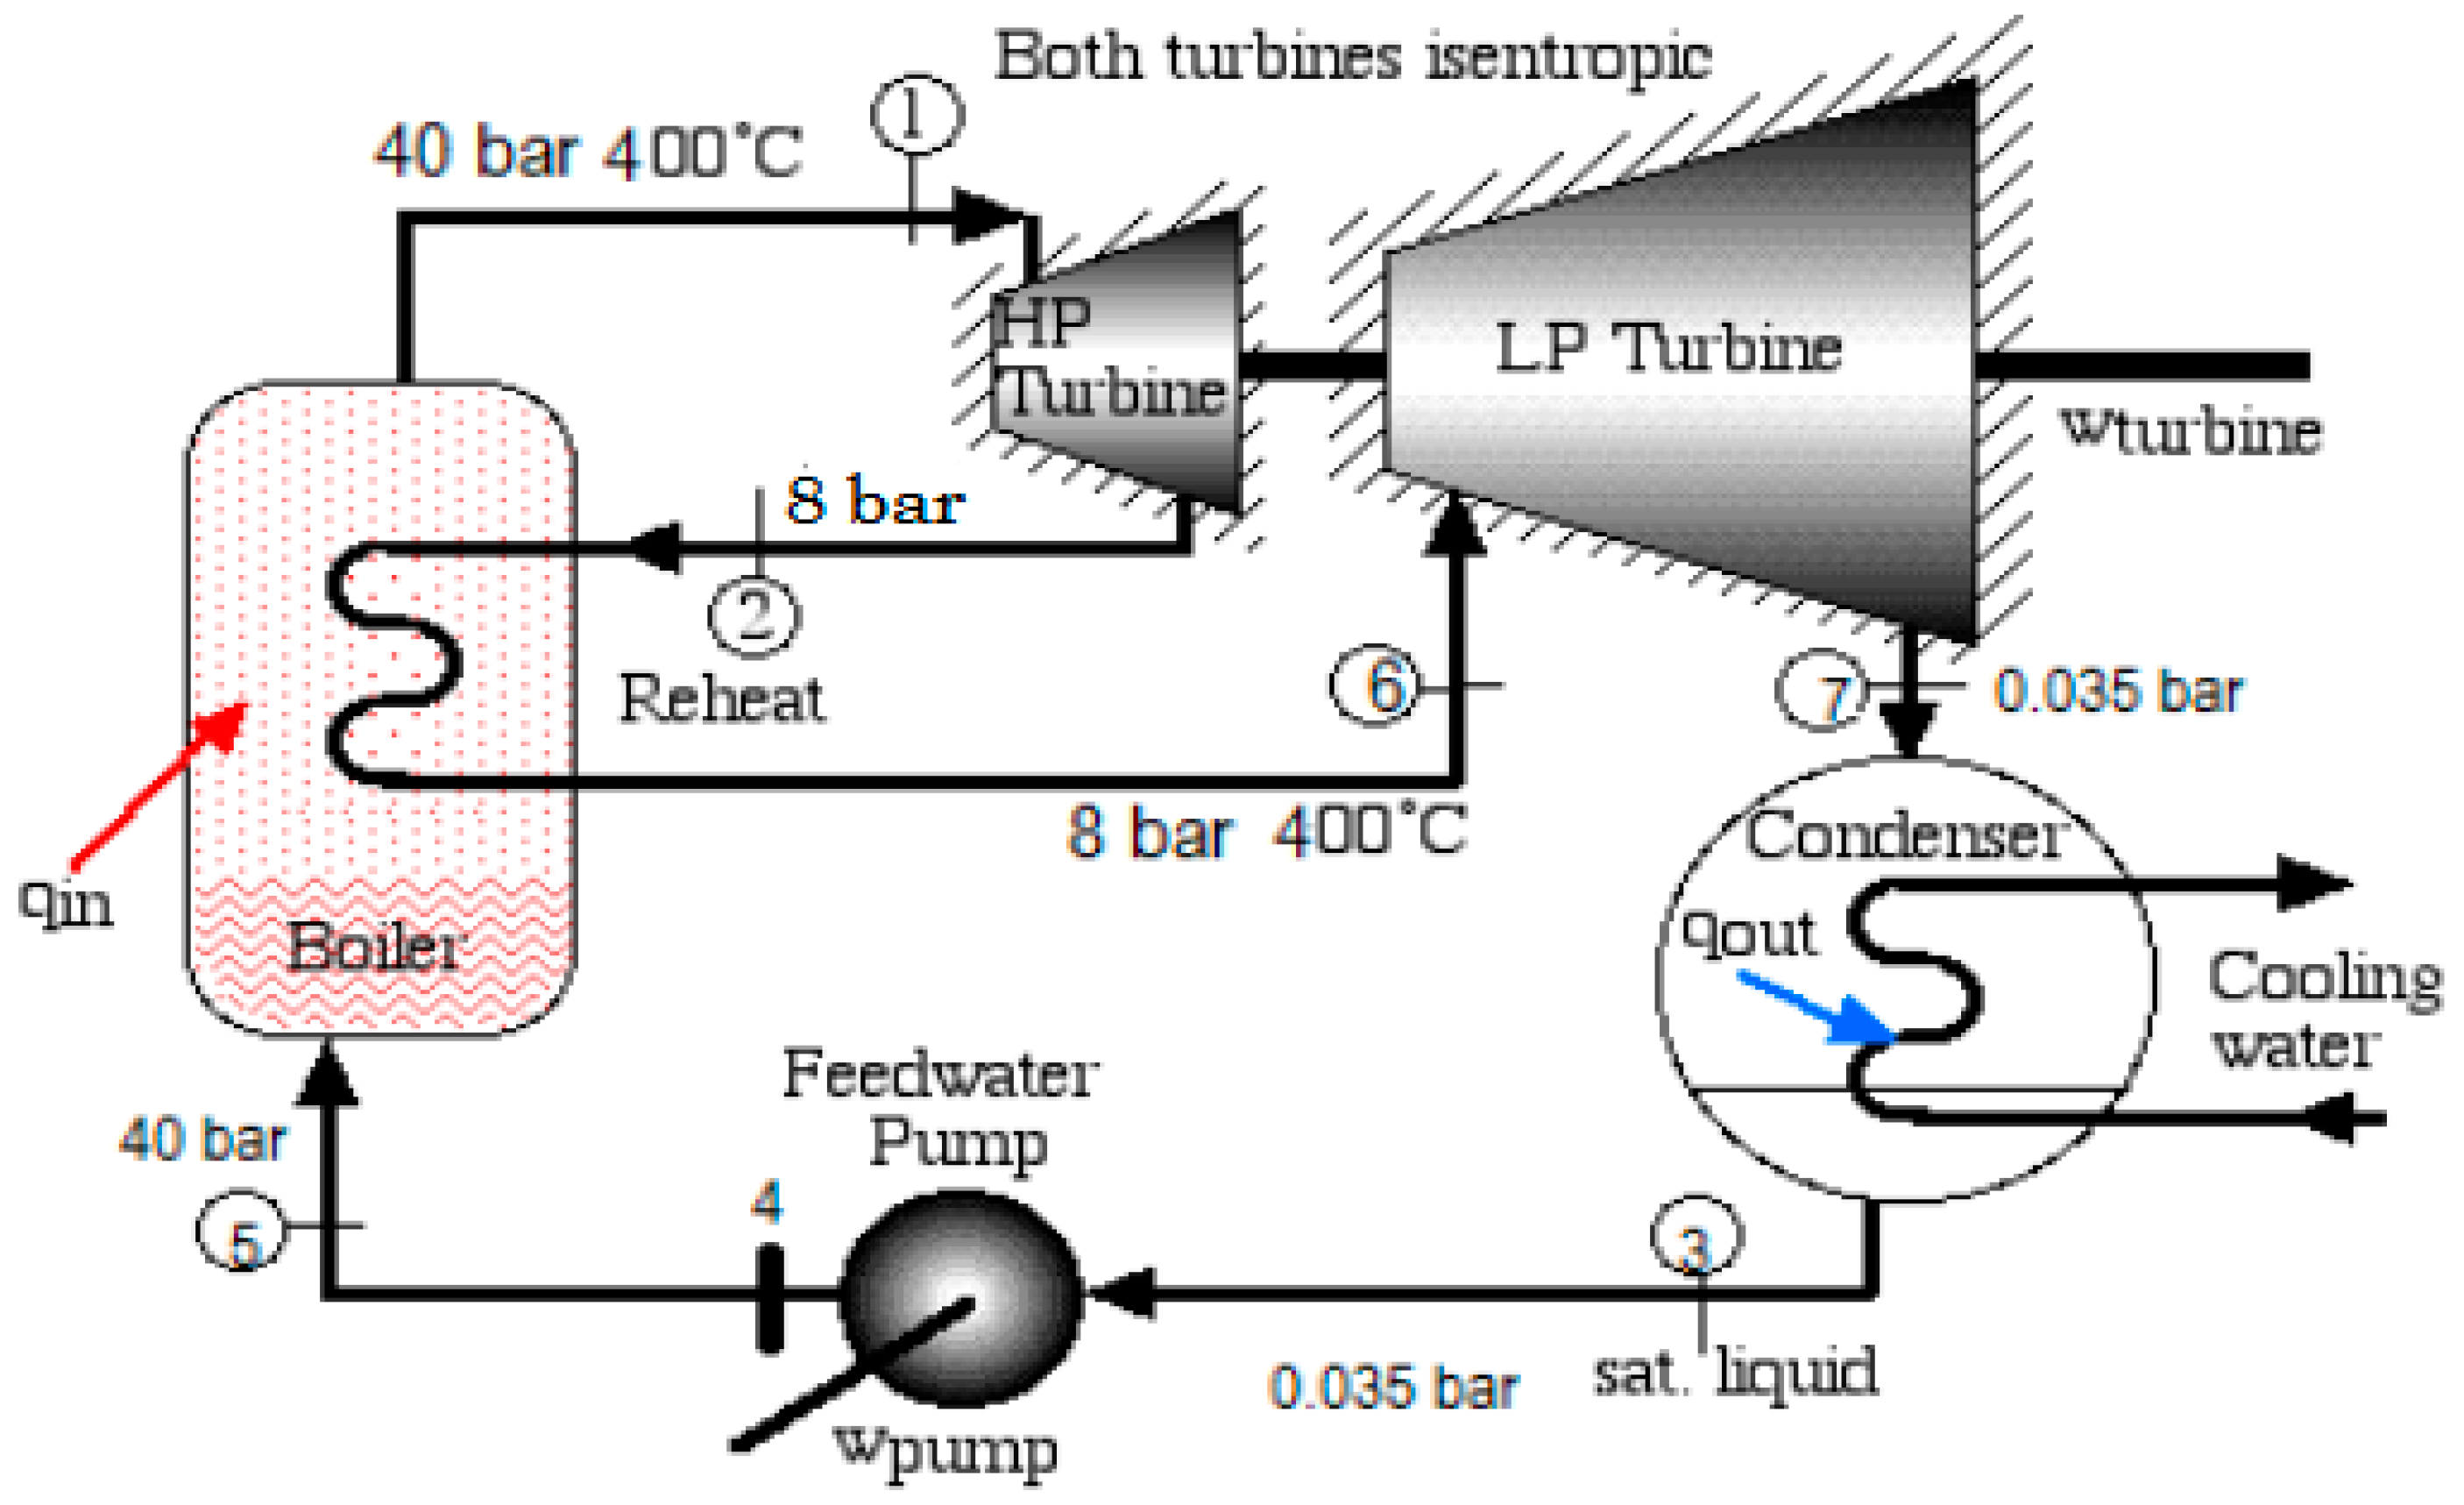
2.6. Determination of the Steam Power Plant Capacity Required for Energy Production

Thermodynamic analysis of Rankine cycle is used to enhance the reliability and efficiency of steam power plants [42]. In this study, the reheat Rankine cycle presented in Figure 2b is used to determine the capacity of the steam power plant that will convert the waste to electrical power. Rankine reheat cycle in Figure 2b was used for the estimation of the steam power plant capacity because it has a higher cycle efficiency compared to the ordinary superheat Rankine cycle shown in Figure 2a. The combination of temperature (400 °C) and pressure (40 bar) is commonly used in the capacity determination/design for steam power plants to minimize investment costs. Temperature higher than 400 °C may result in high-temperature strain and corrosion of the superheater tubes; also, the pressure below 40 bar lowers the requirements for pretreatment of the feed water [7,43,44].
The reheat Rankine cycle in Figure 2b is a modification of simple Rankine cycle in Figure 2a. The schematic representation of a steam power plant using the reheat Rankine cycle is shown in Figure 3.
Work Output ( W T 12 ) of the High-Pressure Turbine (HPT) can Be Determined Using Equation (9), as Suggested by Kaspooria [42], Akhator [12], Arabkooshar [45], and Loni [46]
W ˙ T 12 = m ˙ s t ( h 1 h 2 )
where, W T 12 (kJ/kg) is the HPT work output, m ˙ s t is the mass flow rate of the steam, h 1 and h 2 are the enthalpies at states 1 and 2 during the isentropic expansion process in the HPT.
According to Jordi [47] and Hesham [48], the Heat ( Q 26 ) Supplied to the Steam at the Reheat Tube can be Determined Using Equation (10)
Q ˙ T 26 = m ˙ s t ( h 6 h 2 )
where Q ˙ T 26 is the rate of heat supplied to the steam, during the constant pressure heating process, from state 2 to 6 in the reheat tube.
Work Output ( W T 67 ) of the Low-Pressure Turbine (LPT) can Be Determined as Suggested in Equation (11), by Akhator [12] and Arabkooshar [45]
W ˙ T 67 = m ˙ s t ( h 6 h 7 )
where W T 67 (kJ/kg) is the LPT work output, and h 6 and h 7 are the enthalpies at states 6 and 7 of the reheat Rankine cycle, during the isentropic expansion process in the LPT.
Heat ( Q ˙ 73 ) Rejected at the Condenser According to Akhator [12], Arabkooshar [45], and Loni [46] is Presented in Equation (12)
Q ˙ 73 = m ˙ s t ( h 7   -   h 3 )
where Q ˙ 37 (kJ/kg) is the heat rejected in the condenser during an isothermal heat rejection process, while h 7 and h 3 are the enthalpies at states 7 and 3 of the reheat Rankine cycle respectively.
Heat ( Q ˙ 31 ) Supplied to the Boiler can Be Determined in Equation (13), as Suggested by Eastop [49], Sadhu [50], Ting [51], and Ibikunle [7]
Q ˙ 31 = m ˙ s t ( h 1 h 3 )
where Q ˙ 31   kJ / Kg is the heat supplied to the boiler, while h 1 and h 3 are the enthalpies at states 1 and 3 of the reheat Rankine cycle respectively.
The Total Heat ( Q B   ) Supplied by the Boiler to the Steam
Q B   = Q 31   +   Q 26  
where Q B   is the addition of heat Q 13 and the heat of reheat Q 26 .

2.6.1. The Cycle Efficiency η c

According to Eastop [49], Sadhu [50], and Winterbone [52], the cycle efficiency is calculated using Equation (15):
Cycle   efficiency   η c = Work   output Heat   input =   W T 12 + W T 67   Q B  

2.6.2. The Net Heat Supplied (Qnet)

It is calculated by adopting Equation (16), as suggested by Eastop [49] and Sadhu [50]:
Net   heat   supplied   ( Q n e t ) = ( Q B Q 37 )
Estimation of the Capacity for the Components of the Steam Power Plant in Equations (17)–(22) Is Suggested by Ibrahim [53], Ibikunle [7], and Oyedepo [54]
Steam   mass   flow   rate   ( m ˙ s t ) = C a p a c i t y   o f   S t e a m   p o w e r   p l a n t N e t   h e a t   s u p p l i e d = E P P m s w Q n e t
Specific   steam   consumption   ( SSC ) = 3600 W n e t   ( 1   kW = 3600   kJ / h )  
where net work ( W n e t ) is equal to net heat ( Q n e t ).
MSW   consumption   rate ,   m ˙ f = m ˙ s t ( ( h 1 h 3 + h 6 h 2 ) / η B × L H V ]
where m f is taken as the rate of fuel consumption, the boiler efficiency is η B , and the low heating value of MSW is LHV. Efficiency of 80% is assumed for the boiler (the range of boiler efficiency is 80–90%) [38].
Boiler   power   ( Q B P ) :   The   boiler   power ,   Q BP = m ˙ s t ×   Q B
where Q BP is considered as the power generated/day by the boiler for steam power plant.
The   turbine   power   output   ( P T ) = m ˙ s t × W T
The total work output of the turbine,
W T = W T 12 +   W T 67
The   Condenser   Power   ( Q PC ) = m ˙ s t × Q 73

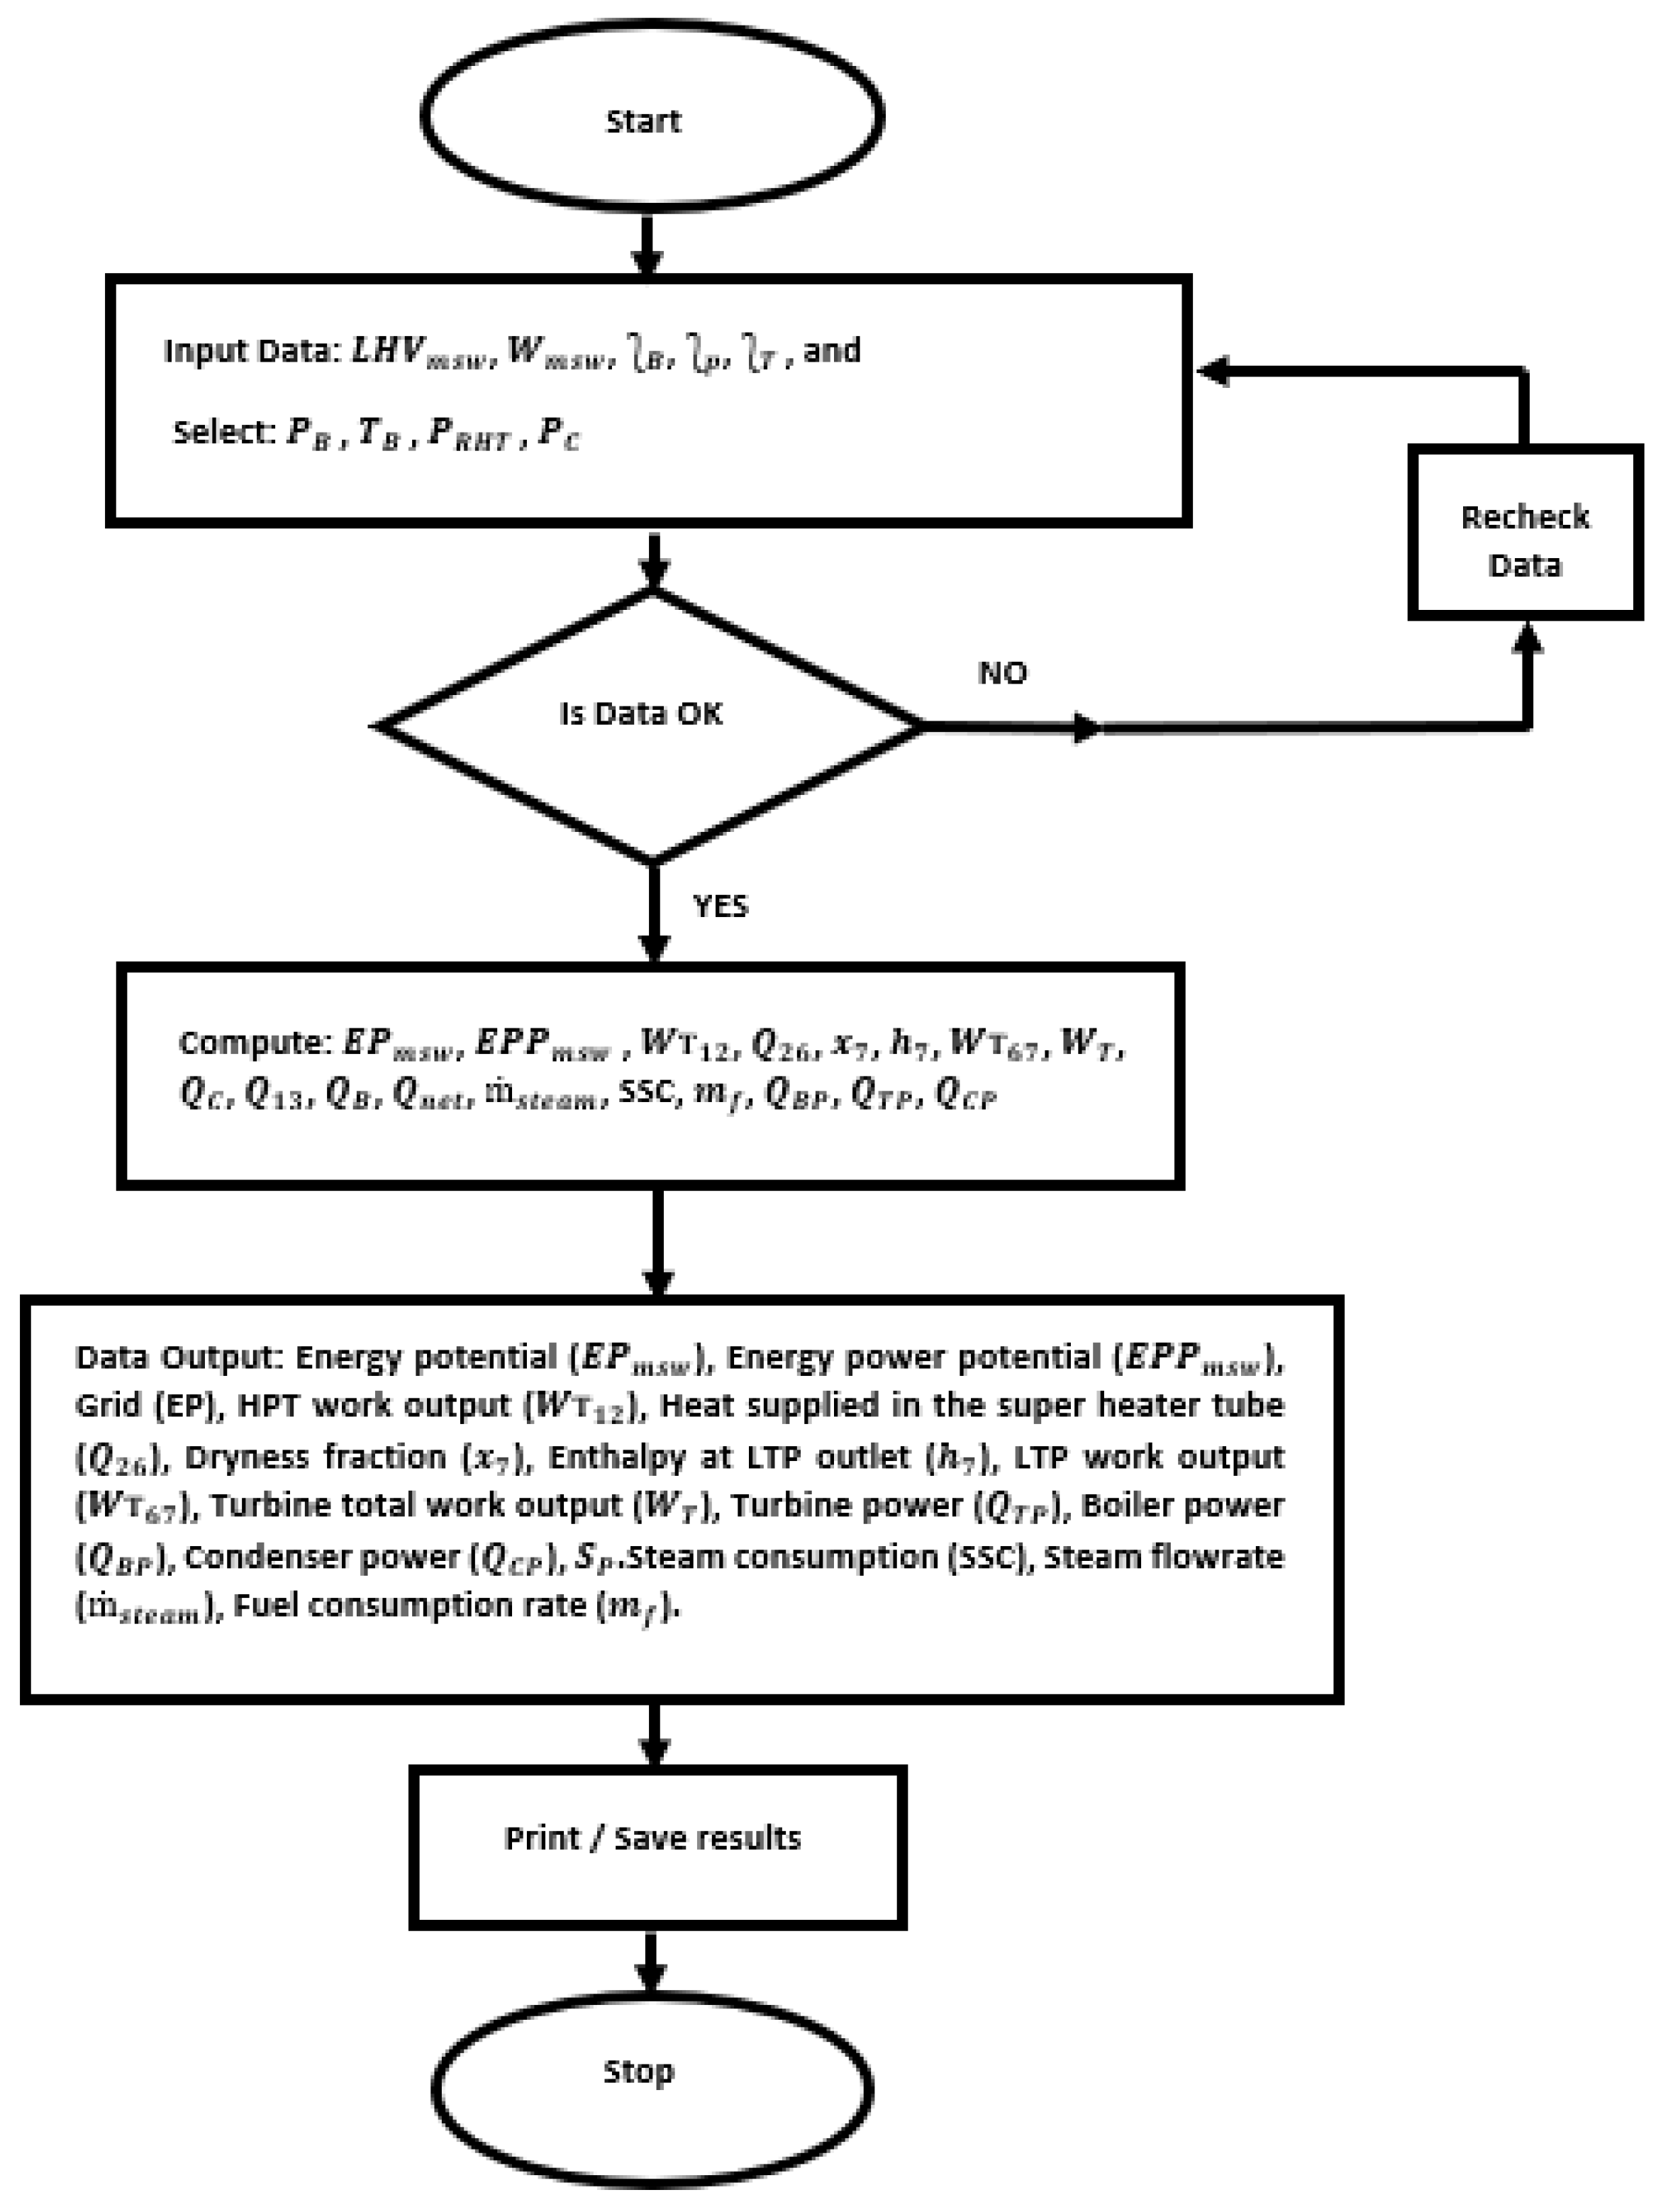
2.7. Development of Software for Selecting Power Plant Capacity

The nomenclature of all the parameters used in modeling the energy and electrical potentials of MSW, and the parameters used in modeling the power plant capacity required were prepared. An algorithm based on Equations (2)–(19) was prepared, which was translated into computer soft code using Java programming language (which is one of the common languages used in numerical analysis and a unified modeling language) [25]. The flow chart upon which the algorithm is based is shown in Figure 4. The software interface was developed using Java swing utilities which comprise mostly of JFrames, JTextrafields, JButtons, and JEditorpane for data display. Action listeners and action events were used to control the button functionalities, handle calculations, and panel/Editorpane displays. Java was used due to its flexibility, object-oriented programming language, and its multi-platform capabilities, which allows it to function on any operating system (OS). The conversion ratios for MSW in tons to kilograms, the heating value in MJ/kg to energy potential in kWh, the saturated and superheated water tables, and steam properties were incorporated into the software’s database [25].
The Flowchart for the Decision Support System
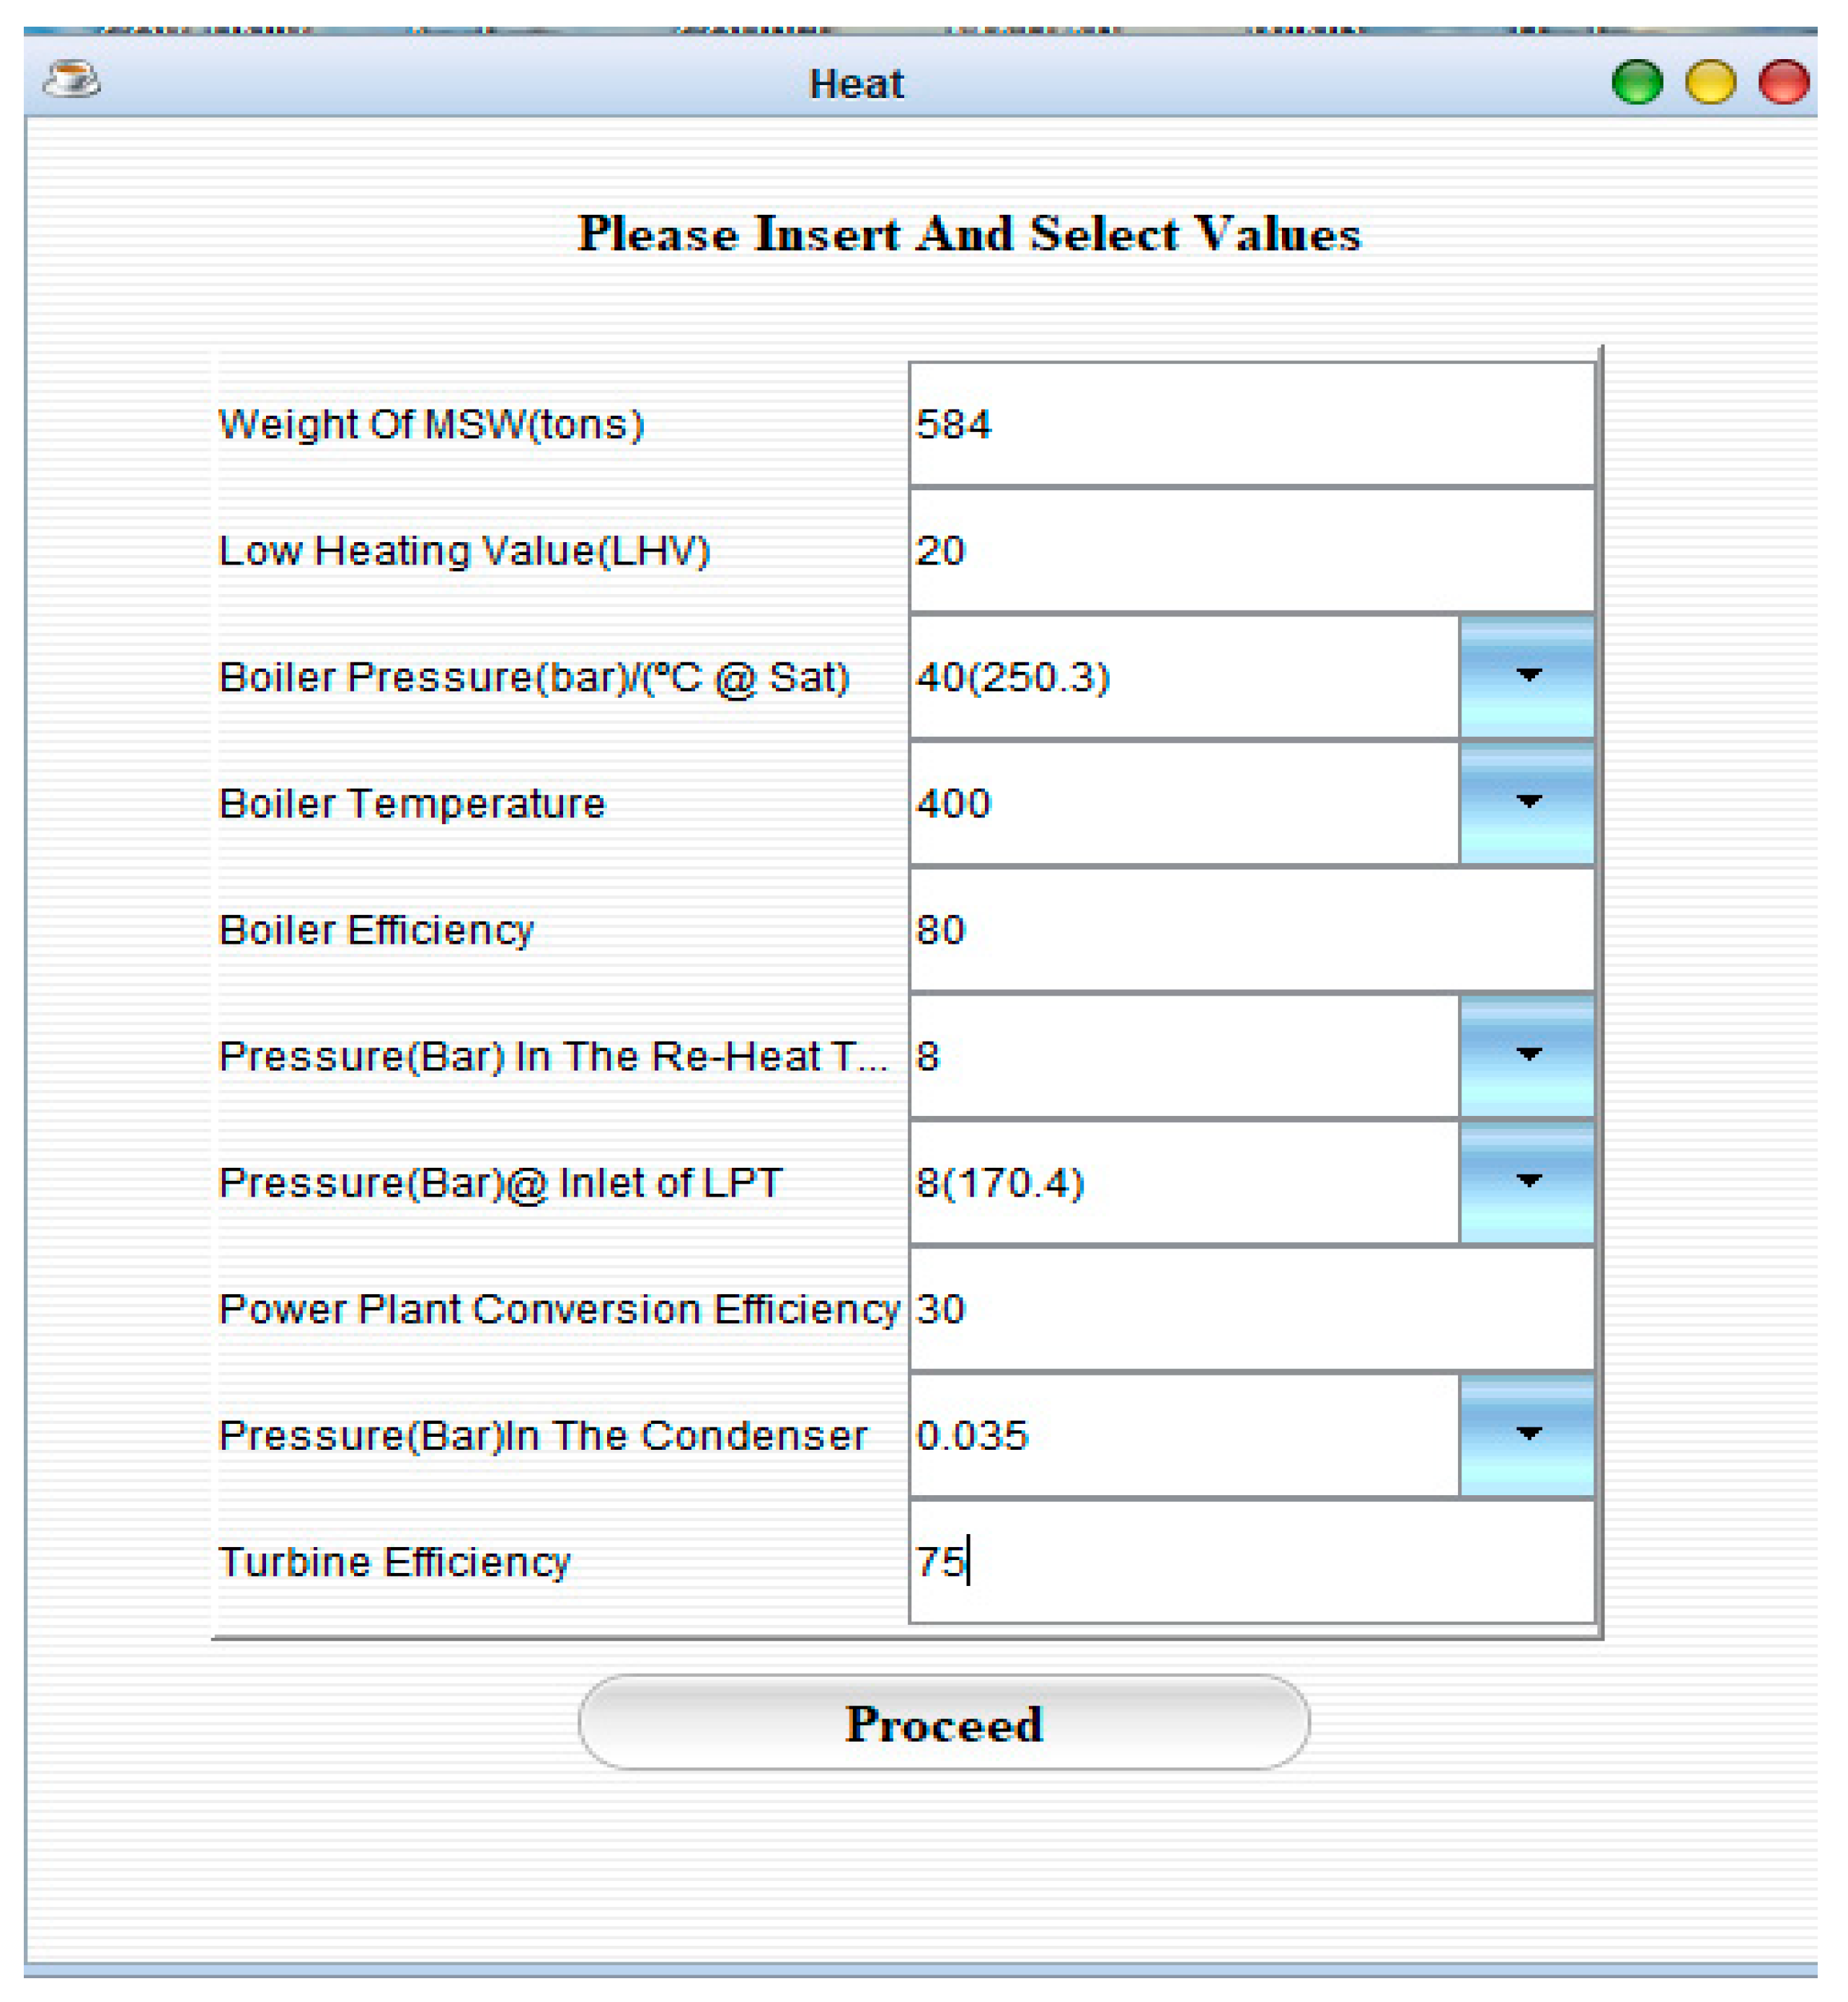
  • The weight of MSW available for energy generation, heating value of the MSW, boiler efficiency, conversion efficiency, and turbine efficiency was supplied into the corresponding designated box in the input interface shown in Figure 5,
  • The boiler pressure, boiler temperature, pressure in the reheat tube, and the pressure required in the condenser are selected from the corresponding draw-down of the icons provided in the input interface,
  • After the required parameters have been supplied/selected; the system requests that you proceed, and the proceed button is clicked,
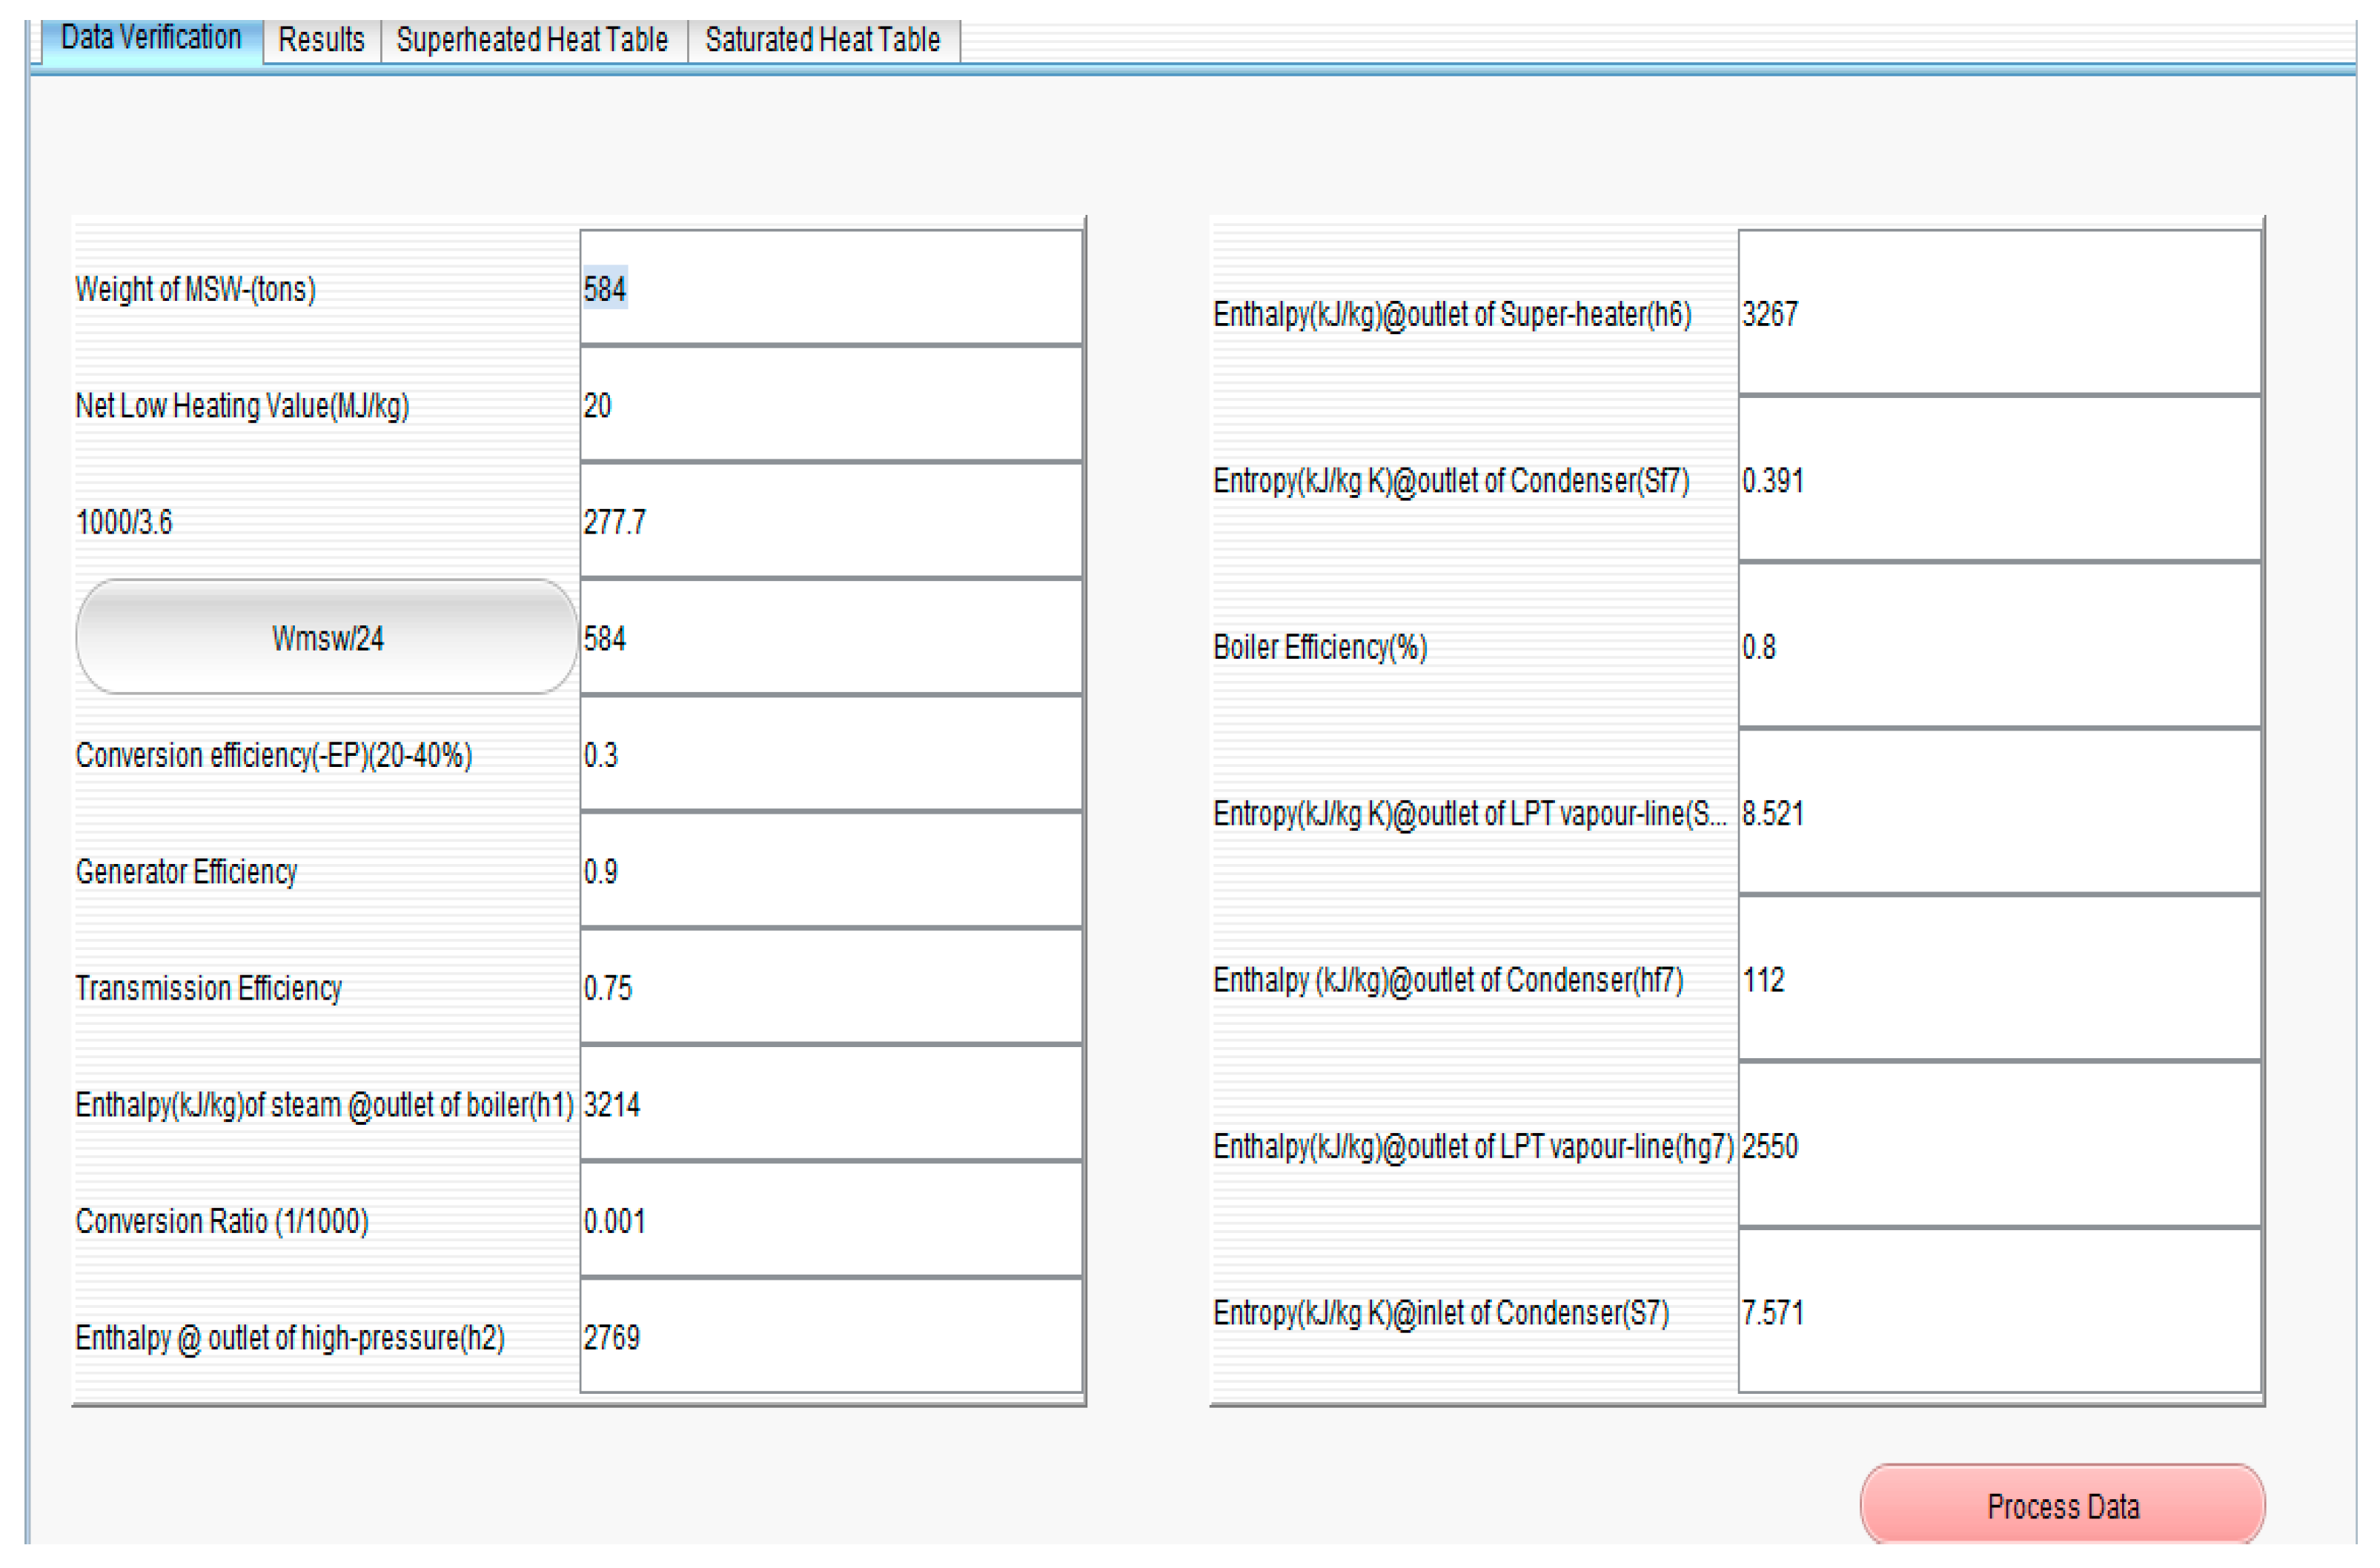
  • Then, a verification interface, shown in Figure 6, will appear to ask if data is OKAY; if OK, click on proceed button otherwise click on the recheck data button and continue,
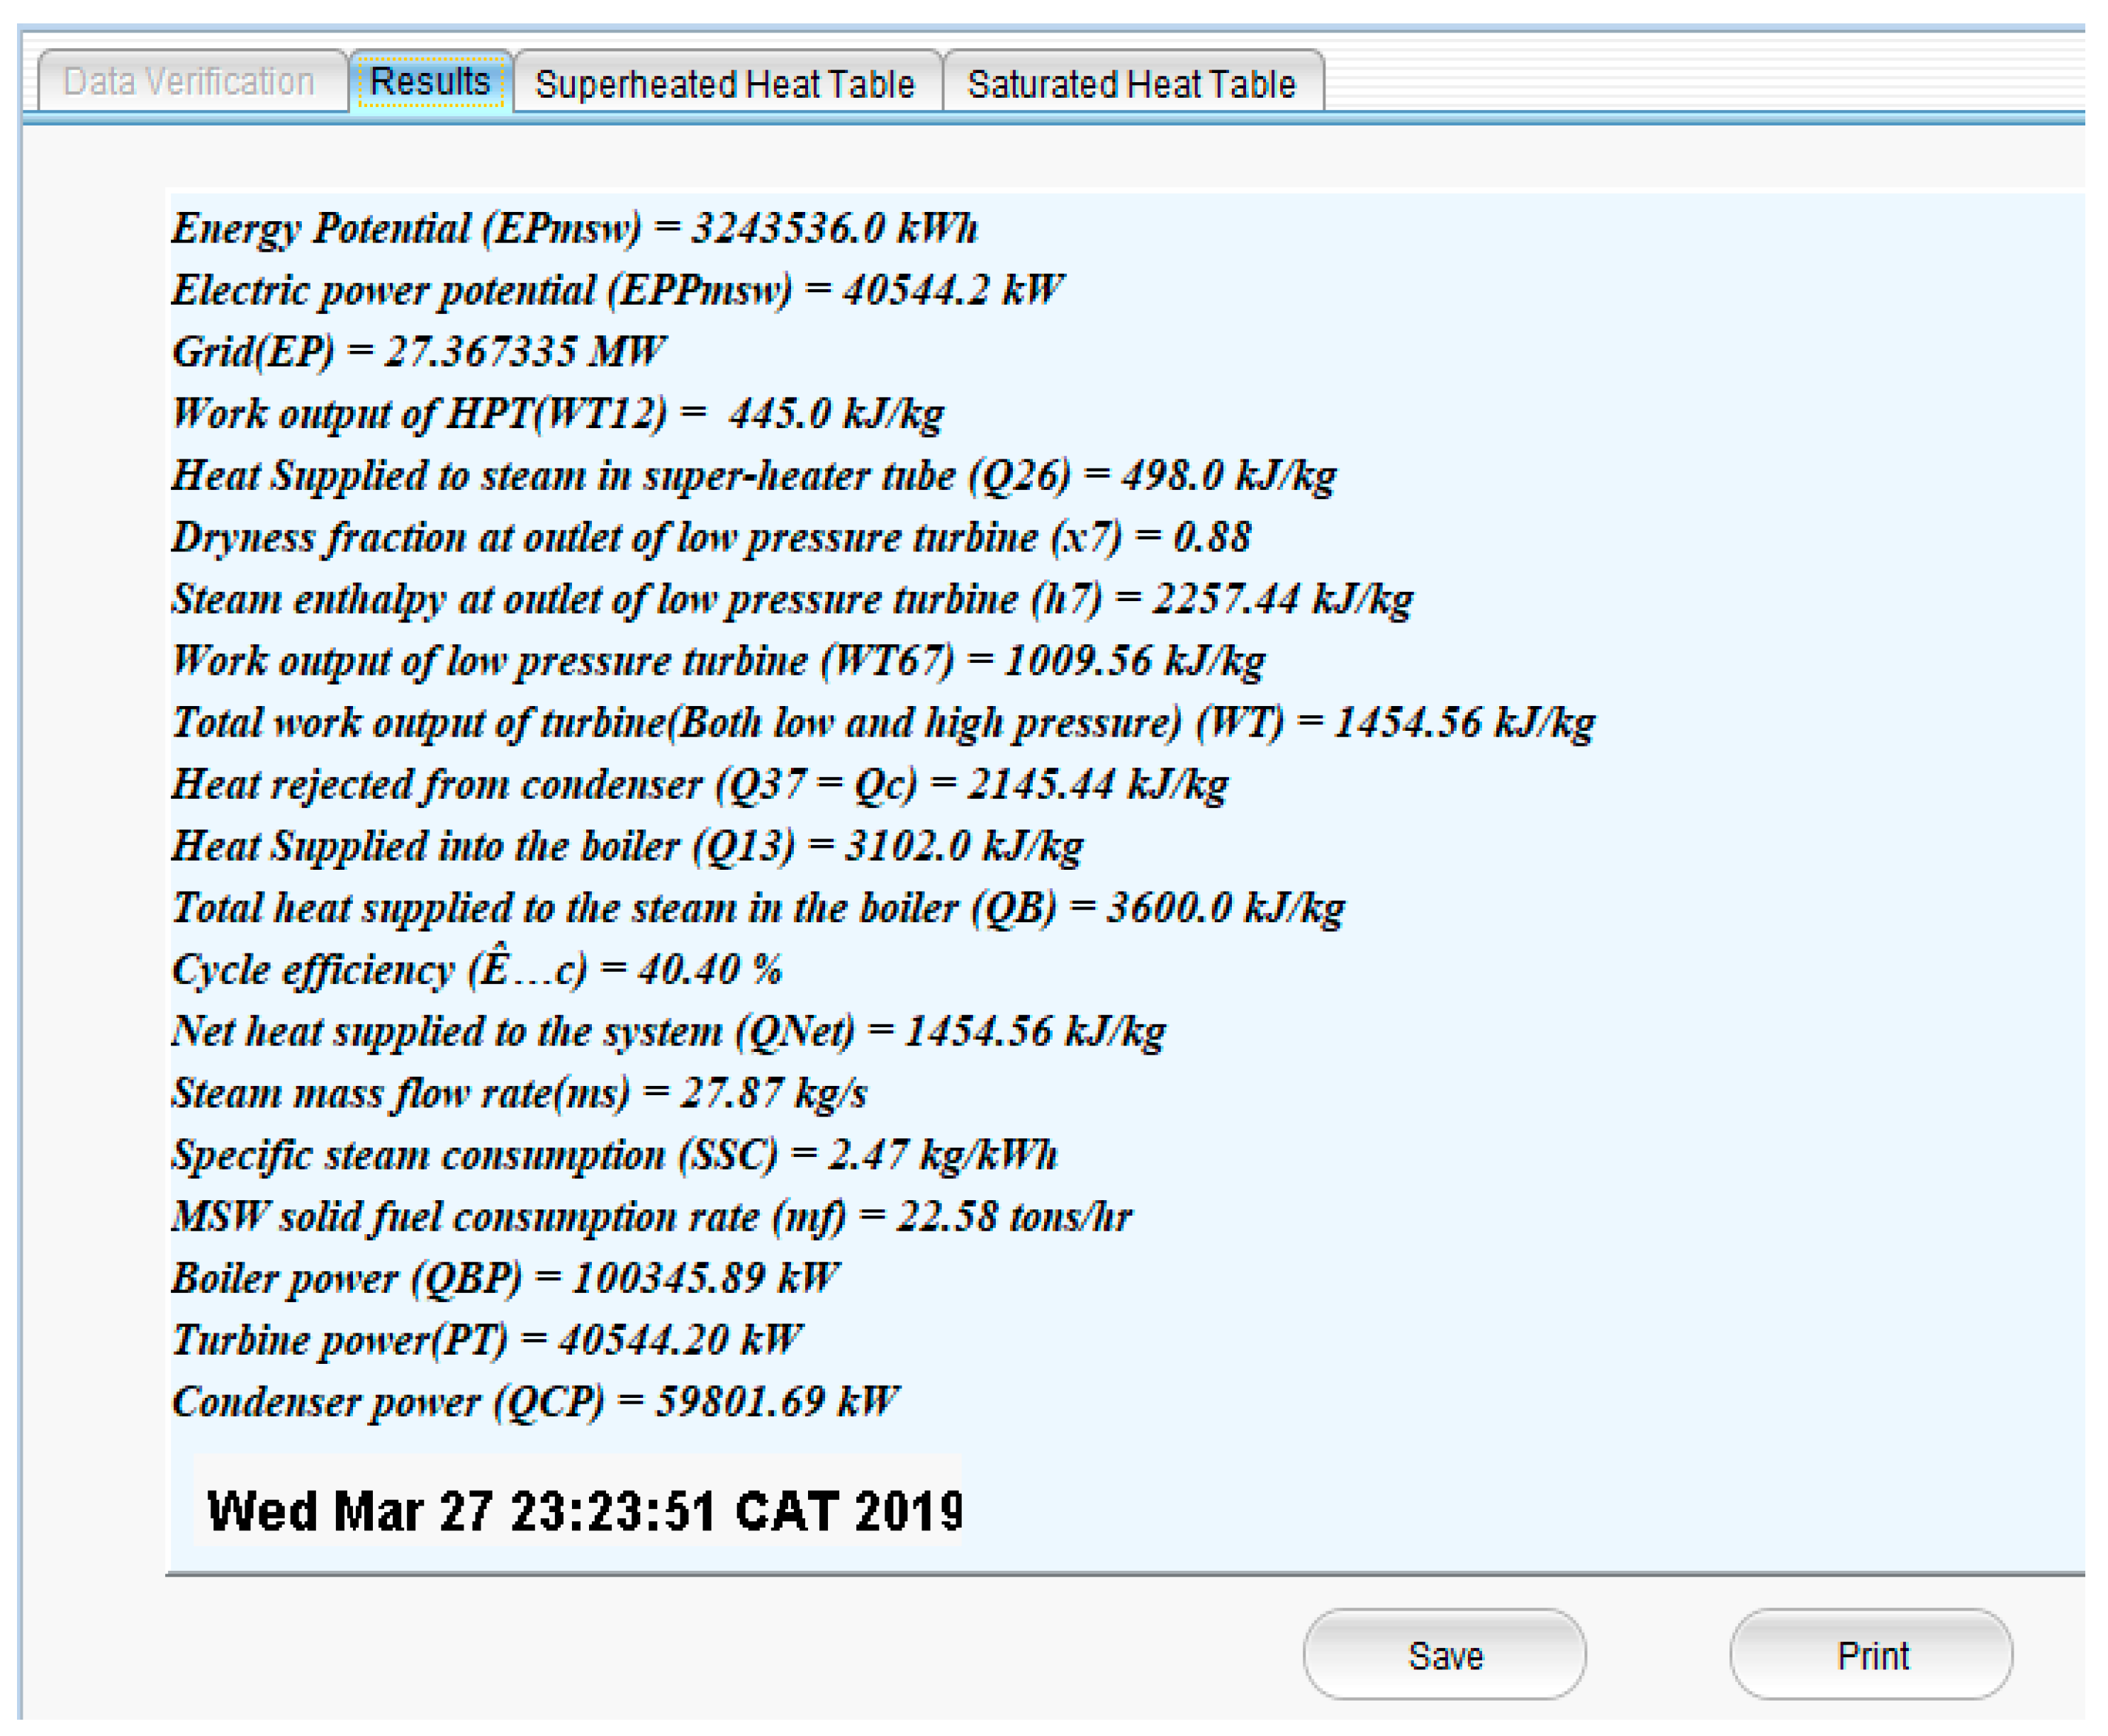
  • Then click on the process button, and it will automatically process the data. After that, click on proceed button and the result will automatically be displayed on an output interface, as well as the date and exact time of processing as presented in Figure 7.
The results displayed include appropriate energy and electrical power potentials of the MSW, the work-output of the high-pressure and the low-pressure turbines, the heat rejected at the condenser, the heat supplied in the boiler, the boiler power, the turbine power, the condenser power required to convert the quantity of MSW to power, and the enthalpies at the different nodes of the reheat Rankine cycle.

3. Results and Discussion

In this section, the aggregate of the MSW produced in the Ilorin metropolis, the components in the MSW streams, their energy content, and the capacity of the waste-fired power plant required for electricity generation is established. Moreover, the manually-calculated values and the values generated by the selection support system are compared. These include the heat energy, electrical power potentials of a quantity of MSW, energy at the thermodynamic states of the Rankine cycle, and the required capacity of the power plant that will convert the MSW; this is to ascertain the accuracy of the decision support system.

3.1. The Estimated Aggregate of MSW Produced

The quantity of MSW generated in a city must be considered to be able to estimate the quantity of the fractions that are suitable for energy production. The MSW generated in Ilorin between January and June 2021, as presented in Table 1, was predicted to be about 101,912 tons, based on the facts and the figures of the waste collection system without the use of a weighing machine, compared to 370,706 tons/year generated in Onitsha (the eastern part of Nigeria) and 10,000 tons of MSW/day in Lagos, the commercial center of Nigeria [55], 250 tons of MSW/year in Ado-Ekiti (Western Nigeria) [56], 30 million tons/year in the US [57], 2.15 million tons/year in Sweden [58], 46 million in China [59], and 169,120 tons of MSW/day in Africa [60]. The aggregate waste produced during this study implies that the MSW generated in Ilorin is sufficient for the renewable energy process. The quantity collected for disposal was estimated, as suggested by Ogunjuyigbe [13], that the aggregate of MSW collected and disposed of in most of the developing nations is about 74% of the quantity generated.

3.2. The Physical Characterization of the MSW Components

Table 2 reveals that the quantity of MSW characterized during the study is about 985 kg. The population responsible for MSW generation during this study is 1,222,294 people as predicted by Ibikunle [5]. The aggregate waste characterized during June is about 229 kg, followed by 182 kg in May, and the least is about 156 kg in February. The reason for June having the highest quantity of MSW of about 23% of the total waste characterized, might be because during this period, newly harvested crops are emerging from farm and food items, and others are cheaper, making it affordable for many people than before. February had the least waste, which might be due to the dry season when there was no plant nor harvesting of food crops and people have just concluded the new year celebration and did not have enough money to purchase items. In this characterization study, plastic bottles have the highest fraction of about 13%, followed by grass/garden trimmings of about 8%, and leather having the least of about 1%. The reason for the high fraction of plastic bottles is because many people consume bottled water and other drinks. Leather has the lowest fraction because it is treasured for ornamental crafts, bags, and shoes in Ilorin, hence it is rare to come by its waste fractions. The generation rate of MSW during this study is 0.145 kg/capita/day.

3.3. The Combustible MSW Fractions That Are Considered for Energy Production

Nine combustible fractions of the 19 MSW components that were characterized are considered for energy production, as presented in Table 3. The table shows that about 612 kg of combustible waste fractions were characterized during this study. This makes about 62% of the waste generated. This implies about 63,185 tons of combustible MSW were available for energy production during the investigation. Ibikunle et al. (2019) estimated the combustible components of MSW in Ilorin for the year 2016 to be about 71%, compared to 84% in Ghana in 1983 and 27% in 2014; 7.7% in South Africa; 74% in Nigeria, and 3.6% of the US [61]. This implies energy recovery from MSW via combustion in 2016 will reduce the quantity of waste deposited into the dumpsite in Ilorin metropolis by about 71%, but this recent study revealed that energy recovery via combustion of waste fractions could reduce the aggregate waste deposited into the dumpsite in Ilorin by about 62% within six months.

3.4. The Thermochemical Analysis of Combustible MSW Components

Table 4 presents the ultimate analysis of the waste fractions and the high heating value (HHV) of the components obtained from the bomb calorimeter. The analyses reveal that the average elemental components of the waste fractions give 29.14% composition of carbon, 0.11% of hydrogen, 3.95% of nitrogen, 0.50% of sulfur, and 0.15% of oxygen. The average HHV of the MSW components is 25 MJ/kg. These values are very important in the estimation of the energy and power potentials of MSW.
The low heating value (LHV) of the waste components that is paramount in the estimation of power potential as determined by adopting Dulong and Steuer models in Equations (3) and (4) is presented in Table 5a. The average HHV from the bomb calorimeter is 25 MJ/kg, the average LHVb from the Dulong model is about 21 MJ/kg, and LHVc from the Steuer model is about 20.8 MJ/kg. Moreover, the LHV obtained from Equation (2) is about 19 MJ/kg. Therefore, considering the results from the three equations, the typical value for the LHV is assumed to be 20 MJ/kg. The MSW with LHV of 20 MJ/kg will produce correspondent energy of about 43% of petrol, 45% of energy in diesel, 48% of that in natural gas, 49% in coal, and about 100% of energy content in woody biomass [62].

3.5. The Energy Potential ( E P M S W ) and Electrical Power Potential of MSW ( E P P M S W )

The methodology established that about 62% of the MSW characterized are combustible, therefore, considering about 584 tons out of about 63,185 tons of (combustible) waste fractions available during the study, with the low heating value (LHV) of 20 MJ/kg, it can produce heat energy potential of 3.2 GWh and electrical power potential of 40.6 MW in a day, as presented in Table 5b. The available energy potential ( E P M S W ) of 3.2 GWh in MSW will produce equivalent energy in 603 tons of wood, 395 tons of coal, 94 tons of hydrogen, 352,591 L of petrol, and 320,000 L of diesel [63]. The electrical power potential ( E P P M S W ) of the MSW is about 41 MW, and this will meet about 15% of the power requirement in Kwara State [64], as well as will help achieve about 9% of the Nigeria Renewable Energy Master Plan (REMP) goal for 2025.

3.6. The Capacity of the Steam Power Plant Components Required to Convert the MSW

The capacities of the steam power plant components that will convert the available combustible MSW in Ilorin to energy were determined. It is established that a steam power plant output of 41 MW, operating on a reheat Rankine cycle of 40% efficiency, based on design specifications which operate in steam pressure and temperature of 40 bar and 400 °C respectively is required. Temperature higher than 400 °C can bring about high-temperature strain and corrosion in the boiler superheater tubes, and pressure below 40 bar can lower the requirements for pretreatment of the feed water [27,44,45]. The plant has an MSW fuel consumption rate of 40 tons/h, boiler capacity of 3600 kJ/kg (heat input), turbine output capacity of 1455 kJ/kg of steam, steam mass flow rate of 28 kg/s (100 tons/h), and specific steam consumption (SSC) of 2.48 kg/kWh.

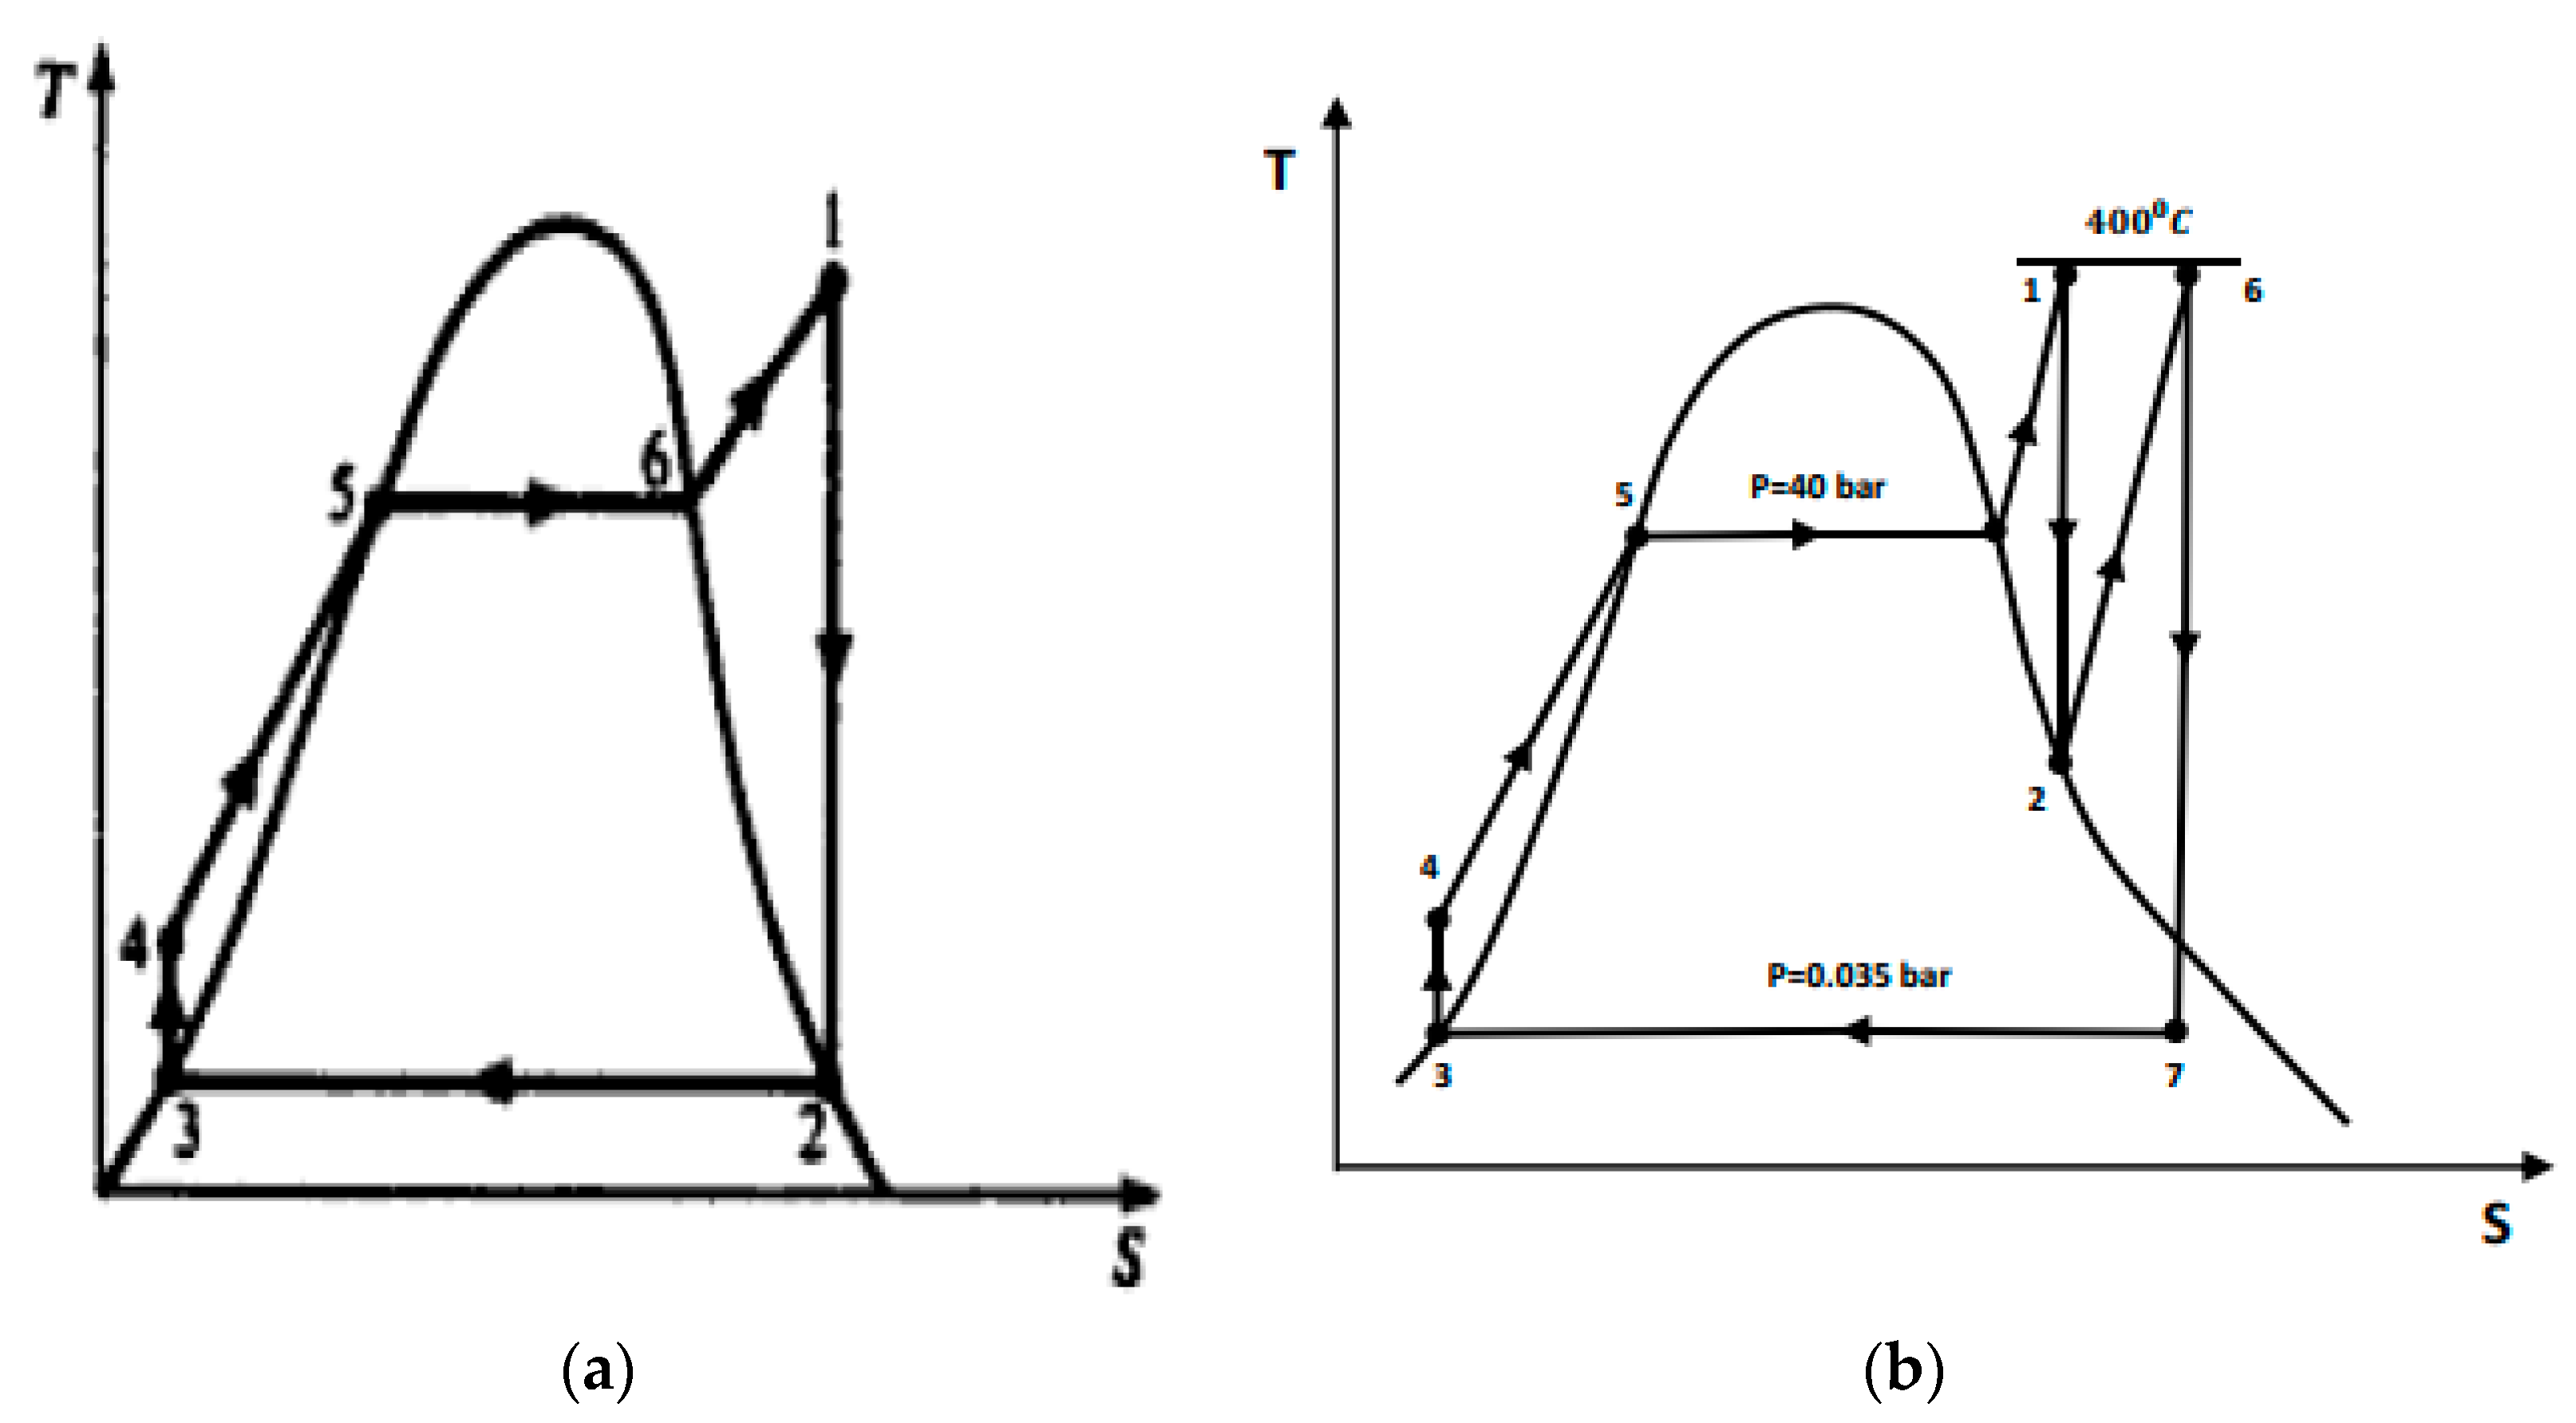
3.7. The Thermodynamic Properties at each State in the Power Plant Cycle and the Capacities of the Power Plant Components

The parameters determined for each node (state) during the thermodynamic processes required in the steam power generating procedures are given in Table 6a. The energy balance of the processes is given in Table 6b and the capacities for each equipment of the power plant required are given in Table 6c. Table 6a,b contain pressures and temperatures selected from the steam table incorporated into the power plant design calculations to determine the enthalpy, entropy, work done, and the heat produced in different nodes of thermodynamic stages.
Table 6c presents the heat, work, and power estimated for boiler, turbine, and condenser discretely, while determining the capacity of the power plant that will convert 584 tons of MSW to energy. This agrees with ’ZGB’ (a manufacturer of boilers in China) with a rating range of 101–150 tons/h steam mass flow rate for boiler with the power of 70–105 MW.

3.8. Software-Generated Values on Power Potential and Power Plant Capacity

The software developed serves as the supporting tool for the selection of waste-to- energy (WTE) power plant capacity that will utilize MSW as fuel. This system determines the energy and power potentials of MSW when the known weight of MSW in tons and its low heating value (MJ/kg) are inputted into the input interface of the software shown in Figure 5. The data inputted are verified in the interface in Figure 6, to ensure error-free processes, before the data is processed. The results obtained using the software are presented in output display Figure 7. This decision support system will predict the capacity of the power plant required for energy recovery of any quantity of MSW at any location, as well as the heat enthalpy at the nodes of the Rankine cycle during the thermodynamic processes, provided the quantity of waste to combust is known, as well as the value of the low heating value.

3.9. Comparison between Manually-Calculated and Software-Generated Values on: Energy Potentials and Power Plant Capacity

The appropriate way to validate the efficiency of the software developed can be validated by comparing the manually-calculated values to the values obtained from the software package [65]. The values presented in Table 7 show that the accuracy of the software is > 99%. This software can be used to predict the energy and power potentials of MSW in any location at any time, provided the weight and the low heating value are known. Nevertheless, it will excellently predict the quantity of work or heat involved in each of the power plant’s equipment, as well as the capacity of the required boiler, turbine, and condenser that will convert the MSW to electrical energy.

4. Conclusions

The software developed can effectively serve as a supporting system for the selection of the appropriate capacity of the steam power plant to convert any quantity of MSW as fuel to energy. The results obtained revealed that a steam power plant of about 100 MW power of boiler, with about 40 MW power of turbine and 60 MW power of condenser with a steam mass flow rate of about 28 kg/s, will convert about 584 tons of municipal solid waste (MSW) with 20 MJ/kg heating value to electrical power potential of about 41 MW, and energy potential of about 3243 MWh. The comparison of the results obtained by manual calculation and that of the software shows an accuracy greater than 99%. It is concluded that the software will successfully predict the energy and electrical power potentials of MSW, and the power to grid potentials in any quantity of combustible waste fractions at any time, irrespective of geographical variations. It will also predict the capacities of individual components in the power plant required to convert the waste to energy, provided the quantity of the municipal solid waste (MSW) to be converted in tons and the net heating value of the MSW (MJ/kg) is supplied. The software will also determine the cycle efficiency of the power plant, the steam mass flow rate, and the MSW (fuel) consumption.

Author Contributions

R.A.I. collected the literature and data, developed the software, inputted data into the software and prepared the manuscript; I.F.T. interpreted the data, analyzed the results, and designed the power plant capacity; B.O.A. prepared the algorithm used to develop the soft code of the software, supervised the experimentation, and edited the manuscript text. All authors have read and agreed to the published version of the manuscript.

Funding

This research was funded by the authors without any financial aid from an external body.

Acknowledgments

The authors appreciate the technologists in the research laboratories of Landmark University and the Federal University of Technology Akure for their support during experimentation.

Conflicts of Interest

The authors declare no conflict of interest of any kind.

References

  1. Omari, A.; Said, M.; Njau, K.; John, G.; Mtul, P. Energy Recovery routes from Municipal Solid Waste, A case study of Arusha-Tanzania. J. Energy Technol. Policy 2014, 4. Available online: https://www.iiste.org/Journals/index.php/JETP/article/view/13157 (accessed on 7 May 2021).
  2. Titiladunayo, I.F.; Akinnuli, B.O.; Ibikunle, R.A.; Agboola, O.O.; Ogunsemi, B.T. Analysis of combustible municipal solid waste fractions as fuel for energy production: Exploring its physicochemical and thermal characteristics. Int. J. Civil. Eng. Technol. 2018, 9, 1557–1575. Available online: http://www.iaeme.com/MasterAdmin/Journal_uploads/IJCIET/VOLUME_9_ISSUE_13/IJCIET_09_13_157.pdf (accessed on 20 December 2018).
  3. Islam, K.M.N. Municipal solid waste to energy generation in Bangladesh: Possible scenarios to generate renewable electricity in Dhaka and Chittagong city. J. Renew. Energy 2016, 1–16. Available online: http://www.hindawi.com/journals (accessed on 25 November 2017).
  4. Ibikunle, R.A.; Titiladunayo, I.F.; Lukman, A.F.; Dahunsi, S.O.; Akeju, E.A. Municipal solid waste sampling, quantification, and seasonal characterization for power evaluation: Energy potential and statistical modelling. Fuel 2020, 277, 118122. [Google Scholar] [CrossRef]
  5. Ibikunle, R.A. Investigating municipal solid waste generation and management in Ilorin for possible integrated waste-management system. J. Mater. Cycles Waste Manag. 2021, 23, 1239–1257. [Google Scholar] [CrossRef]
  6. Johari, A.; Hashim, H.; Mat, R.; Alias, H.; Hasshim, M.H.; Rozainee, M. Generalization, formulation, and heat contents of simulated MSW with moisture content. J. Eng. Sci. Technol. 2012, 7, 701–710. Available online: http://jestec.taylors.edu.my/Vol%207%20Issue%206%20December%2012/Vol7_.2012 (accessed on 5 May 2021).
  7. Ibikunle, R.A.; Titiladunayo, I.F.; Akinnuli, B.O.; Dahunsi, S.O.; Olayanju, T.M.A. Estimation of power generation from municipal solid wastes: A case study of Ilorin metropolis. Nigeria. Energy Rep. 2019, 9, 126–135. [Google Scholar] [CrossRef]
  8. Hoornweg, D.; Bhada-Tata, P. What a Waste: A Global Review of Solid Waste Management; Urban Development Series; Knowledge Papers no. 15; World Bank: Washington, DC, USA, 2012; Available online: https://openknowledge.worldbank.org/handle/10986/17388 (accessed on 5 May 2021).
  9. Parashar, C.K.; Das, P.; Samanta, S.; Ganguly, A.; Chatterjee, P.K. Municipal Solid Wastes—A Promising Sustainable Source of Energy: A Review on Different Waste-to-Energy Conversion Technologies. Energy Recovery Processes from Wastes. 2019, pp. 151–163. Available online: https://link.springer.com/chapter/10.1007/978-981-32-9228-4_13 (accessed on 5 May 2021).
  10. Ibikunle, R.A.; Titiladunayo, I.F.; Dahunsi, S.O.; Akeju, E.A.; Osueke, C.O. Characterization and projection of dry season municipal solid waste for energy production in Ilorin metropolis, Nigeria. J. Waste Manag. Res. 2021, 1–10. [Google Scholar] [CrossRef]
  11. World Bank. Sustainable Energy for All Database from SE4ALL Global Tracking Framework Led Jointly by the World Bank International Energy Agency, and Energy Management Assistance Programme. Available online: https://data.worldbank.org (accessed on 24 April 2018).
  12. Akhator, E.P.; Obonor, A.I.; Ezemonye, L.I. Electricity generation in Nigeria from municipal solid waste using the Swedish Waste-to-Energy Model. J. Appl. Sci. Environ. Manag. 2016, 20, 635–643. [Google Scholar] [CrossRef] [Green Version]
  13. Ogunjuyigbe, A.S.O.; Ayodele, T.R.; Alao, M.A. Electricity generation from municipal solid waste in some selected cities of Nigeria: An assessment of feasibility, potential technologies. J. Renew. Sustain. Energy Rev. 2017, 80, 149–162. [Google Scholar] [CrossRef]
  14. Rasmus, L.; Brian, V.M. Large combined heat and power plants in sustainable energy systems. Appl. Energy 2015, 142, 389–395. Available online: https://ideas.repec.org/a/eee/appene/v142y2015icp389-395.html (accessed on 4 April 2021).
  15. Tsolas, S.D.; Karim, M.N.; Hasan, M.M.F. Optimization of water-energy nexus: A network representation-based graphical approach. Appl. Energy 2018, 224, 230–250. [Google Scholar] [CrossRef]
  16. Xuerui, G.; Yong, Z.; Shibao, L.; Qianyun, C.; Tingli, A.; Xinxueqi, H.; La, Z. Impact of coal power production on sustainable water resources management in the coal-fired power energy bases of Northern China. Appl. Energy 2019, 250, 821–833. [Google Scholar]
  17. Do, W.K.; Tong, S.K.; Kwang, B.H.; Jung, K.P. The effect of firing biogas on the performance and operating characteristics of simple and recuperative cycle gas turbine combined heat and power systems. Appl. Energy 2012, 93, 215–228. [Google Scholar]
  18. Njoku, N.; Lamond, J.; Everett, G.; Manu, P. An overview of municipal solid waste management in developing and developed economies: Analysis of practices andcontributions to urban flooding in Sub-Saharan Africa. In Proceedings of the 12th International Post Graduate Research Conference, Media City, UK, 10–12 June 2015. [Google Scholar] [CrossRef]
  19. Ibikunle, R.A.; Lukman, A.F.; Titiladunayo, I.F.; Akeju, E.A.; Dahunsi, S.O. Modeling and robust prediction of high heating values of municipal solid waste based on ultimate analysis. Energy Sources Part A Recovery Util. Environ. Effects 2020. [Google Scholar] [CrossRef]
  20. Worldometer-Real Time Statistics (Population by Country). Available online: https://www.worldometers.info2019 (accessed on 3 May 2019).
  21. Hongtao, W.; Yongfeng, N. Municipal Solid Waste Characteristics and Management in China. J. Air Waste Manag. Assoc. 2001, 51, 250–263. [Google Scholar] [CrossRef] [Green Version]
  22. Kosuke, K.; Tomohiro, T. Revisiting estimates of municipal solid waste generation per capita and their reliability. J. Mater. Cycles Waste Manag. 2016, 18, 1–3. [Google Scholar]
  23. U.S. Energy Information Administration (U.S. EIA). Electricity in the United States is Produced (Generated) with Diverse Energy Sources and Technologies. 2020. Available online: https://www.eia.gov/energyexplained/electricity/electricity-in-the-us.php (accessed on 4 July 2020).
  24. United Nations Environmental Programme (UNEP). Euthopia Marching towards Africa’s First Waste-to-Energy Plant: Africa News. 2017. Available online: http://www.africanews.com/2017/11/25/ethiopia-marching-towards-africas-first-waste-to-energy-plant-unep (accessed on 20 December 2018).
  25. Oladende, O. 12 Nigerian Power Plants Produced Zero Megawatt Electricity on Christmas Day. Premiums Times (News). 4 January 2017. Available online: https://www.premiumtimesng.com/news/headlines/219590-12-nigerian-power-plants-produced-zero-megawatt-electricity-christmas-day.html (accessed on 25 June 2021).
  26. Larmuth, J.; Cuellar, A. An updated review of South African CSP projects under the renewable energy independent power producer procurement programme (REIPPPP). In AIP Conference Proceedings; AIP Publishing LLC.: Melville, NY, USA, 2019; Volume 2126, p. 040001. [Google Scholar] [CrossRef]
  27. Ibikunle, R.A. Decision Support System for Power Plant Design Using Available Municipal Solid Waste in Ilorin Metropolis as Fuel. Ph.D. Thesis, Federal University of Technology, Akure, Nigeria, 2019. [Google Scholar]
  28. Mareck, J.D.; Roger, R.F. Decision Support Systems. In Encyclopedia of Library and Information Sciences, 2nd ed.; Kent, A., Ed.; Marcel Dekker, Inc.: New York, NY, USA, 2002. [Google Scholar]
  29. Claudio, B. Decision Support Systems Development: A Methodological Approach. J. Appl. Bus. Inf. Syst. 2011, 2, 151–158. Available online: http://www.jabis.ro/2011/4/0204012011.pdf (accessed on 1 May 2021).
  30. Konstantinos, I.; Georgios, T.; Garyfallos, A.; Zacharoula, A.; Eleni, Z. A Spatial Decision Support System Framework for the Evaluation of Biomass Energy Production Locations: Case Study in the Regional Unit of Drama Greece. Sustainability 2018, 10, 531–553. [Google Scholar] [CrossRef] [Green Version]
  31. Fatima, C.C.D.; Erhard, W.P. A decision support system for power plant design. Eur. J. Oper. Res. 1998, 109, 310–320. Available online: http://www.sciencedirect.com/science/article/pii/S0377-2217(98)00059-91998 (accessed on 5 July 2019).
  32. Konstantinos, I.; Paragnotis, L.; Arabatzis, Z. Development of a decision support system for the study of an area after the occurrence of forest fire. Int. J. Sustain. Soc. 2011, 3, 5–53. [Google Scholar] [CrossRef]
  33. NT ENVR-01 (Nordtest Method). Solid Waste Municipal Sampling and Characterization. Published by Nordtest Tekniikantie 12, FIN–02150 ESPOO FINLAND. 1998. Available online: http://www.nordtest.info/wp/1995/05/14/solid-waste-municipal-sampling-and-characterisation-nt-envir-001/ (accessed on 7 July 2019).
  34. Issam, A.K.A.; Maria, M.B.; Salam, A.T.; Saheed, H.Q.; Kassinos, D.B. Solid waste characterization, qualification, and management practices in developing countries, a case study: Nubulus district-palestine. J. Environ. Manag. 2010, 91, 1131–1138. [Google Scholar]
  35. Vairam, S.; Ramesh, S. Engineering Chemistry; John Wiley and Sons Ltd.: Southern Gate, Chichester, UK, 2013. [Google Scholar]
  36. Shi, H.; Maphinpey, N.; Aqsha, A.; Silbermann, R. Characterization, thermochemical conversion studies and heating value modeling of municipal solid waste. J. Waste Manag. 2016, 48, 34–47. [Google Scholar] [CrossRef]
  37. Ibikunle, R.A.; Titiladunayo, I.F.; Akinnuli, B.O.; Lukman, A.F.; Ikubanni, P.P.; Agboola, O.O. Modeling the energy content of municipal solid waste and determination of its physicochemical correlation using multiple regression analysis. Int. J. Mech. Eng Technol. 2018, 9, 220–232. [Google Scholar]
  38. Kumar, J.S.; Subbaiah, K.V.; Rao, P.P. Waste to energy-a case study of eluru city, andhara pradesh. Int. J. Environ. Sci. 2010, 2, 151–162. [Google Scholar]
  39. Daura, L.A. Electricity generation potential of municipal solid waste in kanometropolis. J. Sci. Eng. Res. 2016, 3, 157–161. [Google Scholar]
  40. Muhammad, A.; Farid, N.A.; Ab Saman, K. The energy potential of municipal solid waste for power generation in indonesia. J. Mech. 2014, 2, 42–54. [Google Scholar]
  41. Bright Hub Engineering (BHE). Conversion Efficiencies in the Steam Power Plants. 2016. Available online: www.brighthubengineering.com/power-plants/72369-compare-thefficiency (accessed on 22 February 2017).
  42. Kapooria, R.K.; Kumar, S.; Kasana, K.S. An analysis of a thermal power plant working on a Rankine cycle: A theoretical investigation. J. Energy S. Afr. 2008, 19, 77–83. [Google Scholar] [CrossRef]
  43. Somplak, R.; Ferdan, T.; Palvas, M.; Palvas, M.; Popela, P. Waste-to-energy facility planning under uncertain circumstances. J. Appl. Therm. Eng. 2013, 61, 106–114. [Google Scholar] [CrossRef]
  44. Karlsson, L.; Jonsson, T.L. Pre-Feasibility Study of a Waste-to-Energy Plant in Chisinau, Moldova. Uppsala Universitet. 2012. Available online: https://www.diva-portal.org/smash/get/diva2:510286/FULLTEXT01.pdf (accessed on 25 October 2016).
  45. Arabkoohsar, A. Combined steam based high-temperature heat and power storage with an Organic Rankine Cycle, an efficient mechanical electricity storage technology. J. Clean. Prod. 2020, 247, 119098. [Google Scholar] [CrossRef]
  46. Loni, R.; Najafi, G.; Bellos, E.; Rajaee, F.; Said, F.; Mazlan, M. A review of industrial waste heat recovery system for power generation with Organic Rankine Cycle: Recent challenges and future outlook. J. Clean. Prod. 2020, 125070. [Google Scholar] [CrossRef]
  47. Jordi, B. Development and Implementation of a Nuclear Power Plant Steam Turbine Model in the System Code ATHLET. Master Thesis, Technische Universitat Muchen, Muchen, Germany, 2011. [Google Scholar]
  48. Hesham, G.I. Steam Power Plant Design Upgrading (Case Study: Khoms Steam Power Plant). J. Energy Environ. Res. 2011, 1, 202. [Google Scholar] [CrossRef]
  49. Eastop, T.D.; Mc Conkey, A. Applied Thermodynamics, 5th ed.; Dorling Kindersley Pvt. Ltd.: Delhi, India, 2014. [Google Scholar]
  50. Sadhu, S. Handbook of Mechanical Engineering; S. Chand & Company Ltd.: New Delhi, India, 2011. [Google Scholar]
  51. Ting, Y.; Noam, L. Thermodynamic analysis of hybrid Rankine cycles using multiple heat sources of different temperatures. Appl. Energy 2018, 222, 564–583. [Google Scholar] [CrossRef]
  52. Winterbone, O.E.; Turan, A. Advanced Thermodynamics for Engineers; John Wiley and Sons Inc.: New York, NY, USA; Toronto, ON, Canada, 2015. [Google Scholar]
  53. Ibrahim, D.; Yusuf, B. Fundamentals of Energy System. Integrated Energy Systems for Multigeneration (Elsevier Inc.). 2019. Available online: https://www.elsevier.com/books/integrated-energy-systems-formultigeneration/dincer/978-0-12-809943-8 (accessed on 7 May 2021). [CrossRef]
  54. Oyedepo, S.O.; Fakeye, B.A.; Mabinuori, B.; Babalola, P.O.; Leramo, R.O.; Kilanko, O.; Dirisu, J.O.; Udo, M.; Efemwenkiekie, U.K.; Oyebanji, J.A. Thermodynamics analysis and performance optimization of a reheat–Regenerative steam turbine power plant with feed water heaters. Fuel 2020, 280, 118577. [Google Scholar] [CrossRef]
  55. Maxwell, U.N. Solid waste generation and disposal in a nigerian city: An empirical analysis in onitsha metropolis. J. Environ. Manag. Saf. 2010, 1, 180–191. [Google Scholar]
  56. Rominiyi, O.L.; Fapetu, O.P.; Owolabi, J.O.; Adaramola, B.A. Determination of energycontent of the municipal solid waste of Ado-Ekiti Metropolis, Southwest, Nigeria. Curr. J. Appl. Sci. Technol. 2017, 23, 1–11. [Google Scholar] [CrossRef]
  57. U.S. Energy Information Administration (USEIA). Biomass Explained. Waste-to-Energy (Municipal Solid Waste) Energy Recovery from Municipal Solid Waste. 2018. Available online: https://www.eia.gov/state/seds/sep_fuel/notes/use_glossary.pdf (accessed on 7 July 2019).
  58. Swedish Waste Management (SWM). 2015. Available online: www.arfallaverage.se/fileadmin/uploads/Rapporter/SWM2015.pdf (accessed on 20 June 2016).
  59. Scarlet, W.; Dellemand, J.F.; Monforti-Ferrano, F.; Nita, V. The role of biomass and bioenergy in a future bioeconomy: Policies and facts. Environ. Dev. 2015, 15, 3–34. [Google Scholar] [CrossRef]
  60. Wale, B. Energy. Energy Consult Powering Clean Energy Future, Solid Waste Management in Nigeria. 2018. Available online: https://www.bioenergyconsult.com/solid-waste-nigeria (accessed on 20 December 2018).
  61. U.S. IEA Statistics. Ghana-Combustible Renewables and Waste (% of Total Energy). OECD/IEA. 2014. Available online: http://www.iea.org/stats/index.asp (accessed on 29 June 2021).
  62. Deep Resource World Press (DRW). Energy Conversion Factors. 2012. Available online: https://deepresource.worldpress.com/2012/04/23/energyrelatedconversionfactors (accessed on 14 September 2018).
  63. World Nuclear Association (WNA): Heat Values of Various Fuels. 2018. Available online: www.world-nuclear.org (accessed on 14 October 2018).
  64. Ibadan Electricity Distribution Company (IBEDC). Kwara Needs 270 MW for 24-Hour Electricity. 2016. Available online: https://www.ilorin.info/fullnews.php?id=18082 (accessed on 3 October 2018).
  65. Akinnuli, B.; Ogedengbe, T.I.; Oladosu, K.O. Computer Aided Design and Drafting of Helical gears. J. Eng. Trends Appl. Sci. 2012, 3, 959–968. [Google Scholar]
Figure 1. e-2k Combustion for HHV determination [27].
Sustainability 13 11665 g001
Figure 2. (a) T-S Rankine cycle with superheat; (b) T-S reheat Rankine cycle.
Sustainability 13 11665 g002
Figure 3. Rankine component layout of a steam power plant. Source: Karlsson and Jonsson [44].
Sustainability 13 11665 g003
Figure 4. Flowchart of decision support system for steam power plant capacity.
Sustainability 13 11665 g004
Figure 5. The input interface of the software to predict the capacity of the steam power plant.
Sustainability 13 11665 g005
Figure 6. The verification interface of the software to recheck for the missing data.
Sustainability 13 11665 g006
Figure 7. The values generated from the data processed by the software.
Sustainability 13 11665 g007
Table 1. Estimation of MSW generated in Ilorin during the study based on transportation facts.
Collection
Trucks
Trucks Used
Per Day
Capacity (Tons)Capacity
(m3)
Trips of Truck/DayMSW Collected
(Tons)
MSW Generated
(Tons)
Dinno Tipper Truck52016326,006.2535,143.5
Hippo Tipper Truck32522319,498.526,349
Scannia Compactor23022210,405.514,061
Arm Roller3158519,504.526,358
Total1390681375,414.75101,911.5
Table 2. Physical characterization of MSW components (of 985 kg) for six months (January to February).
MSW ComponentsJan.Feb.MarchAprilMayJuneTotalWt.Kg/Capita
Wt. (kg)Wt. (kg)Wt. (kg)Wt. (kg)Wt. (kg)Wt. (kg)Wt. (kg)%/Day
Food residue12.2510.008.358.0014.2126.3579.168.040.012
Wood4.654.854.253.853.252.4523.302.370.003
Paper8.806.506.204.608.356.5541.004.160.006
Packaging box14.2418.5512.507.8010.5512.2075.847.700.011
Grass/trimmings3.648.2010.6012.4021.1224.2280.188.140.012
Textiles (rags)4.206.228.4610.2010.2514.2453.575.440.008
Toiletries3.404.562.281.120.843.1815.381.560.002
Feces1.644.622.085.108.2410.3232.003.250.005
Cow dung8.456.455.453.354.424.4532.573.310.005
Nylon (water sachet)18.0016.2410.248.466.458.2267.616.870.010
Polypropylene sack12.208.426.208.2010.5520.1465.716.670.010
Plastic bottle30.2522.0020.6814.2418.2420.12125.5312.750.018
Rubber0.821.201.220.145.205.2413.821.400.002
Leather0.640.261.200.224.104.1610.581.070.002
Glass/Ceramics10.409.8010.406.0010.129.8556.575.740.008
Animal bones2.641.120.802.4510.2212.2529.482.990.004
Tins/Metals12.0010.0014.008.206.3514.6665.216.620.010
Sand/Ash10.908.806.304.305.124.6240.044.070.006
Other biogenic6.248.645.406.8024.5425.5277.147.830.011
Grand total165.36156.43136.61115.43182.12228.74984.69100.000.145
Table 3. Physical characterization of MSW (of 612 kg) for energy production between January–February.
MSW ComponentsJan.Feb.MarchAprilMayJuneTotalWt.
Wt. (kg)Wt. (kg)Wt. (kg)Wt. (kg)Wt. (kg)Wt. (kg)Wt. (kg)%
Food residue12.2510.008.358.0014.2126.3579.168.04
Wood4.654.854.253.853.252.4523.302.37
Paper8.806.506.204.608.356.5541.004.16
Packaging box14.2418.5512.507.8010.5512.2075.847.70
Grass/garden trimmings3.648.2010.6012.4021.1224.2280.188.14
Textiles (rags)4.206.228.4610.2010.2514.2453.575.44
Nylon (water sachet)18.0016.2410.248.466.458.2267.616.87
Polypropylene sack12.208.426.208.2010.5520.1465.716.67
Plastic bottle30.2522.0020.6814.2418.2420.12125.5312.75
Total108.23100.9887.4877.75102.97134.49611.9062.14
Table 4. Thermochemical analysis of MSW components.
MSW Fractions C%H%N%S%O%HHV (MJ/kg)
Food residue 37.88   ±   0.44 0.17   ±   0.00 4.68   ±   0.05 3.80   ±   0.02 0.16   ±   0.00 18.56
Wood 36.80   ±   0.62 0.11   ±   0.02 4.46   ±   0.04 0.06   ±   0.02 0.08   ±   0.00 18.38
Paper 34.68   ±   0.08 0.08   ±   0.02 4.58   ±   0.24 0.10   ±   0.00 0.07   ±   0.00 17.28
Packaging box 21.45   ±   0.06 0.11   ±   0.00 3.32   ±   0.10 0.08   ±   0.03 0.12   ±   0.00 16.68
Grass/garden trimmings 31.46   ±   0.11 0.09   ±   0.02 3.81   ±   0.06 0.07   ±   0.00 0.06   ±   0.00 17.78
Textiles (rags) 33.66   ±   0.14 0.10   ±   0.00 4.26   ±   0.00 0.14   ±   0.00 0.15   ±   0.00 16.45
Nylon 21.86   ±   0.08 0.11   ±   0.00 3.56   ±   0.02 0.13   ±   0.00 0.08   ±   0.00 45.26
Polypropylene sack 21.65   ±   0.11 0.11   ±   0.02 3.42   ±   0.01 0.06   ±   0.0 0 0.06   ±   0.00 38.88
Plastic bottle 22.84   ±   0.03 0.10   ±   0.00 3.43   ±   0.00 0.08   ±   0.02 0.11   ±   0.02 36.86
Table 5. (a) The LHV of the MSW components from Dulong and Steuer models; (b) Energy potential ( E P M S W ) and electrical power potential ( E P P M S W )   of MSW.
(a)
MSW Fractions HHV (MJ/kg)HV%LHVb (MJ/kg)LHVc (MJ/kg)Typical LHV (MJ/kg)
Food residue18.568.2127.2026.5026.85
Wood18.388.1324.1224.3124.22
Paper17.287.6426.0326.0026.02
Packaging box16.687.3816.0116.0116.01
Grass/garden trimmings17.787.8621.0321.5121.27
Textiles (rags)16.457.2724.2123.3423.78
Nylon45.2620.0217.0218.1017.56
Polypropylene sack38.8817.1915.2517.0216.14
Plastic bottle36.8616.3015.1617.0016.08
Total226.13100186.03189.79187.91
Average25 20.6721.0920.88
(b)
TypesMSW (tons)/dayLHV (MJ/kg) E P M S W (kWh) E P P M S W   kW
Food residue85.751.93263,0673288.34
Wood6.620.15265,0843313.55
Paper49.951.03244,9153061.44
Packaging box80.141.54229,0672863.34
Grass/garden trimmings36.970.80256,4403205.50
Textiles (rags)73.691.40226,1862827.33
Nylon125.957.03665,5928319.90
Polypropylene sack43.992.09561,8637023.29
Plastic bottle80.963.65535,9316699.14
Total584203,248,14540,601.83
HHV: the high heating value from calorimetry experiment; LHVb: the low heating value from Dulong model; LHVc: the low heating value from Steuer model, and Typical LHV: the average of the values from the models.
Table 6. (a) The parameters determined for the nodes of the steam power plant cycle; (b) The work done and the heat produced during the Rankine processes; (c) The capacities designed for the steam boiler power plant components.
(a)
DescriptionNodePressure (bar)Temperature (°C)Enthalpy(KJ/kg)Entropy(kJ/kg K)
Boiler outlet/H-P turbine inlet14040032146.769
H-P turbine outlet/intermediate superheater inlet 28170.4227696.663
Intermediate superheater outlet/L-P turbine inlet6840032677.571
L-P turbine outlet/condenser inlet70.03526.72257.447.571
Condenser outlet/pump inlet 30.03526.71120.391
Pump outlet/boiler inlet4402058752.382
(b)
Work done kJ/kgHeatkJ/kg
H-P turbine ( W T 12 )445Heat supplied into boiler ( Q 13 )498
L-P turbine ( W T 67 )1010Heat supplied during reheat ( Q 26 )498
Total work output of turbine (WT)1455 Heat rejected from condenser ( Q 37 ) 2145
Net work done ( W n e t ) 1455Net heat supplied ( Q n e t )1455
(c)
EquipmentHeat (kJ/kg)Work (kJ/kg)Power (MW)
Boiler3600101
Turbine145541
Condenser214560
Steam and Fuel Consumption Rate of The Plant
Water/fuel consumptionkg/s(tons/h)(kg/kWh)
Steam mass flow rate ( m ˙ s )27.87100
Fuel consumption rate ( m f )6.2522.58
Specific steam consumption (SSC) 2.48
Table 7. Comparison of manually-calculated and software-generated values.
ParametersManually-Calculated ValuesSoftware-Generated Values
Energy potential ( E P m s w )3,243,536.0 kW3,243,536.0 kW
Electrical power potential ( E P P m s w )40,544.3 kW40,544.3 kW
Power to grid G P 27.36732 MW27.36733 MW
Work output of the high-pressure turbine ( W T 12 )445.0 kJ/kg445.0 KJ/kg
Heat supplied during reheat process ( Q 26 ) 498.0 kJ/kg498.0 kJ/kg
Dryness fraction at outlet of low-pressure turbine ( x 7 )0.880.88
Steam enthalpy at outlet of low-pressure turbine ( h 7 )2257.44 kJ/kg2257.44 kJ/kg
Work output of low-pressure turbine ( W T 67 ) 1009.56 kJ/kg1009.56 kJ/kg
Total work output of turbine ( W T 12   +   W T 67 ) ,   W T 1454.56 kJ/kg1454.56 kJ/kg
Heat rejected from condenser ( Q 37 )   =   Q C 2145.44 kJ/kg2145.44 kJ/kg
Heat supplied into the boiler Q 13 3102.0 kJ/kg3102.0 kJ/kg
Total heat supplied to the steam in the boiler ( Q B ) 3600.0 kJ/kg3600.0 kJ/kg
Cycle efficiency ( ʅ   c )40.40%40.40%
Net heat supplied to the system ( Q Net ) 1454.56 kJ/kg1454.56 kJ/kg
Steam mass flow rate ( m ˙ s )27.87 kg/s27.87 kg/s
Specific steam consumption (SSC)2.48 kg/kWh2.47 kg/kWh
MSW (fuel) consumption rate ( m f )22.58 tons/h22.58 tons/h
Boiler power ( Q B P )100,345.88 kW100,345.89 kW
Turbine power ( Q T P )40,540.20 kW40,544.20 kW
Condenser power ( Q C P )59,801.68 kW59,801.68 kW
Publisher’s Note: MDPI stays neutral with regard to jurisdictional claims in published maps and institutional affiliations.

