Abstract
To achieve comprehensive poverty alleviation and the establishment of a “moderately prosperous society” in China, it is crucial to evaluate the targeted poverty alleviation (TPA) policies. In this study, China’s poverty alleviation statistics and the Foster-Greene-Thorbecke (FGT) indices are used to measure the poverty reduction effects of the TPA policies. A panel regression model is applied to analyze the poverty reduction mechanism while the Shapley index decomposition method is used to analyze poverty reduction effects in terms of income growth and the income gap adjustment. The paper concludes that the poverty breadth index (H index), poverty depth index (PG index), and poverty intensity index (SPG index) from 2013 to 2019 show a significant decline overall. This indicates that the poverty reduction effect of the TPA policies is significant. In addition, the regression analysis shows that the implementation of TPA policies can significantly increase the income level of residents and narrow the income gap among residents in rural areas. Results of the Shapley index decomposition analysis revealed that the income growth effect and income gap adjustment effect accounted for 92.78% and 7.22% of the poverty reduction effects, respectively. So the focus of future poverty alleviation work is to combine the rural revitalization strategy and to continue increasing the income level and the income growth rate of poor groups, which will enhance the ability of impoverished residents to increase their income, further contributing to the alleviation of poverty.
1. Introduction
Since the 18th National Congress of the Communist Party of China held in 2012, the Chinese government has attached critical importance to the alleviation of poverty and accelerated development, prioritizing these aims in governance and proposing a targeted poverty alleviation (TPA) strategy and the goal of “achieving comprehensive poverty alleviation by 2020”. At present, China’s fight against poverty has been highly successful. According to current statistics, 98.99 million of the rural poor are no longer under the poverty threshold, while 832 poor counties and 128,000 poor villages have removed themselves from poverty, and the overall national and regional poverty has been eradicated (Jinping Xi, Speech at the National Poverty Alleviation Summary commendation Conference. https://www.chinanews.com/gn/2021/02-25/9419272.shtml (accessed on 19 October 2021)). The program serves as a model of poverty governance for elsewhere in the world. In 2021, the “No. 1 Central Document” (The “No. 1 Central Document” of 2021 (full text). http://www.china-cer.com.cn/guwen/2021012811132.html (accessed on 19 October 2021)) proposed that the policy program and mechanism for poverty alleviation should be effectively connected with rural revitalization. Having achieved the goal of comprehensive poverty alleviation and with the transition to a rural revitalization strategy, it is both timely and necessary to study the poverty reduction effects of TPA policies. This will help to better meet the needs of work that continues to consolidate and expand the results of poverty alleviation in the rural revitalization.
At the beginning of the reform, China formulated the income distribution policy of “appropriately widening the income gap and stimulating the vitality of production” (Selected Literature since the 13th National Congress (I) [M]. Beijing: Central Literature Publishing House, 2011:28), which led to a continuous widening of the gap between the rich and poor. Since 2000, China’s Gini coefficient has been hovering above the warning line of 0.4. Absolute poverty, deep poverty and structural poverty have become the main poverty types in this stage. For this reason, the Party Central Committee proposed an income distribution adjustment plan to “raise the low, expand the middle, and adjust the high”. In this case, raising the “low” refers to raising the income level of low-income groups. The TPA strategy is, in fact, precisely about targeting low-income groups below the poverty line through a variety of methods, then using the “raising the low” effect to increase their income and narrow the gap with other groups. This is the fundamental starting point of the TPA policies.
This study focusses primarily on the poverty reduction effects brought about by the TPA policies, and the effects of income growth and the income gap adjustment involving the poor. Obviously, it must meet the needs of the performance evaluation of the TPA policies in the new era. This is especially so from the perspective of the income growth and gap adjustment effects, which are of important value to studying the poverty reduction effects of the TPA policies. The reason is that after reaching the poverty alleviation goals, not only is it necessary to comprehensively evaluate the poverty reduction effects of the TPA policies and examine their direct impact, but also to pay attention to the indirect effects caused by the policies. Both research angles are required for a comprehensive, objective and fair evaluation of the poverty alleviation policies.
Therefore, drawing on the poverty alleviation data from 28 provinces and cities in China for the period 2010 to 2018 (i.e., before and following the TPA policy implementation), this paper evaluates the effects of the TPA initiative. The main purpose of the study is to summarize the impact and lessons learned from the implementation of TPA policies, and to offer recommendations for improving the wealth of low-income groups, narrowing the income gap among residents and implementing the rural revitalization strategy. In the broader context, the study will provide a reference point for other countries’ strategies on poverty reduction governance and on research for wealth-related policy development.
2. Literature Review
Poverty is one of the common problems facing the world. “End poverty in all its forms everywhere” is the goal on the list of the Sustainable Development Goals of the United Nations for the period through 2030 (Liu M., 2019 [1]).Every country actively adopts various measures to solve the problem, such as promoting economic development (Sovia D., 2018 [2]), implementing labor transfer (Guo Y.Z., 2021 [3]), improving the viable capacity of the poor (John, 2008 [4]), the provision of fiscal transfer payments (Fan, 2000 [5]), infrastructure construction (Agénor, 2008 [6]), and the improvement of agricultural technologies (Ali, 2010 [7]).
From the perspective of current international studies, foreign studies on poverty governance are very rich, from the concept and causes of poverty (Amartya Sen, 2004 [8]; Albert Park, 2010 [9]), poverty identification and measurement (Drago C, 2020 [10]) to Poverty Governance (Zurovec O., 2019 [11]). Amartya Sen (1999) proposed the feasible competence theory. It indicates that poverty deprives the basic ability or power, not only low incomes [12]. Fowler and Kleit (2014) have added that due to population migration, the population base in the poverty regions will be reduced or increased, which in turn may increase or decrease the incidence of poverty [13]. Pilar et al. (2021) believes that in the case of social poverty, it is necessary to evaluate residents’ housing conditions to ensure sustainable urban development and improve residents’ satisfaction [14].
In the study of poverty reduction, some foreign scholars believe that the transfer of labor from agriculture to non-agricultural industries can effectively reduce the occurrence of poverty (De Janvry, 2005 [15]), and Bertoli (2014) pointed out that the contribution of immigrants’ non-agricultural income to the alleviation of poverty among rural poor households is 17.4~20.8% [16]. Some scholars have studied the poverty reduction effects of fiscal transfer payments, and believe these can effectively alleviate poverty and narrow the gap between the rich and poor (Brady, 2005 [17]; Imai, 2011 [18]; Gertler, 2012 [19]). Others believe that fiscal transfer payments have a “crowding effect” and produce a “lazy people” scenario, and that the practice cannot achieve a poverty reduction effect and may widen the income gap, causing the poor to fall into a “poverty trap” (Darity, 1987; Ravallion, 2015; Hwang, 2016 [20]). Some scholars believe that the availability and use of financial services are negatively related to the development of poverty (Manji, 2010; Ndlovu, 2020 [21]).
Chinese scholars’ research on the effects of poverty reduction mainly proceeds along two lines. On the one hand, research focuses on poverty reduction effects caused by a certain economic phenomenon or economic behavior, such as the development of urbanization (Chun He, 2017; Dongyuan Zhu, 2019; Shuigen Yang, 2020), rural land transfer (Yazhou Zhang, 2020), the development of the logistics industry (Xiaofeng Jian, 2019; Lu Zheng, 2020), internet technology and inclusive entrepreneurship (Gang Zheng, 2020), financial services (Zongyi Hu, 2014; Hongwen Jia, 2019), labor transfer (Changan Qi, 2020), and so on. For example, Biyun Ren (2020) found that all aspects of financial development play an important role in reducing poverty in rural areas [22], while Jingkui Zhou’s (2020) research indicated that the transfer of agricultural land can increase the income of poor households and alleviate poverty [23].
On the other hand, scholars tend to study the effects of poverty reduction in terms of certain economic policies, such as the minimum wage policy (Xiaolan Luo, 2011; Yixin Dong, 2016), the fiscal policy (Aiyan Xu, 2016; Hongyou Lu, 2019; Hanjie Wang, 2020), the social security expenditure policy (Qiong Li, 2017; Jinguang Guo, 2019; Ting Zuo, 2020), the medical security system (Zhijiang Ren, 2020), the ecological compensation policy (Wenjie Zou, 2018; Shaoqun Ding, 2019; Linjing Ren, 2020), and so forth. For example, Weijin Gong (2018) studied the structural differences, spatial correlation and spatial heterogeneity of China’s fiscal expenditure in the area of poverty alleviation, and proposed that the spending structure should be improved according to the conditions of each region to effectively achieve the desired poverty reduction effect [24]. By way of contrast, Xin Zhang (2020) found that for every 1% increase in per capita medical insurance expenditure, the corresponding poverty incidence would decrease by 2.935% [25].
There are various models and methods for research on poverty reduction effects. Among them, the Foster–Greene–Thorbecke (FGT) indices are statistical indicators that use often to measure the effects. In addition, some scholars use models for this purpose. For example, Ming Chen (2016) used the fixed effects model and the threshold regression model in their study and found that investing in agricultural research can help to reduce poverty [26]; Junping Guo (2017) used the ordered logit model and negative binomial regression model to study the poverty reduction effects of participatory comprehensive development [27]; Jianmin Liu (2018) used a modified gravity model to study the impact of China’s various financial education expenditures on local poverty [28]; Bowen Sun (2019) used the dynamic panel system GMM estimation to study the effects of poverty alleviation on the integration of the urban and rural labor markets [29]; Qin Zhang (2019) used the spatial Dubin model to study multi-dimensional poverty in rural China based on provincial data [30]; and Kai Li (2020) used a multiple linear regression model of the least square regression method to study the degree of poverty reduction through rural tourism among 235 villages of southwestern China [31].
In recent years, research on the poverty reduction effects involving various poverty alleviation policies has become a new wave of focus within academic circles. Liyong Wang (2019) found that China’s TPA policies have a significant impact on reducing poverty in rural areas. Yet, the policies also demonstrate significant heterogeneity, causing a inversion of the poverty reduction effect [32]. Ping Lin (2020) used the double-difference method to study the panel data of Fujian Province’s county-level cities and found that the determination of provincial-level poverty alleviation and the development of key policies played an important role in poverty reduction [33]. Feihu Yang (2020) argues that public expenditure and poverty alleviation strategies can significantly increase the per capita net income of the poor. The poverty alleviation strategy enhances the poverty reduction effects on public investment [34]. It can be seen that research on the poverty reduction effects of TPA policies is currently a hot topic in the academic community. But the focus is not broad, and there are few analyses based on the available national macro data.
Generally speaking, the literature on poverty reduction practices at home and abroad is relatively rich. It is believed that a variety of economic phenomena and economic policies play an important role in the process of poverty alleviation. However, there are different policy backgrounds at home and abroad. In addition, the results of the related research mainly focus on data analysis of contiguous poverty-stricken areas, poor counties, or prefecture-level cities in a certain province, and there remains a lack of overall analyses on poverty alleviation based on the national data. Although the existing studies have evaluated the effects of TPA policies, an in-depth study of the impact mechanism lacks. It is necessary to introduce poverty alleviation funds, industrial structure, fiscal decentralization and other factors to analyze the poverty reduction mechanism of TPA policies. Previous studies have also tended to focus on the reduction of poverty in certain regions with insufficient attention paid to the indirect effects of increased income among residents or the adjustments in the income gap. It is necessary, therefore, to consider these areas in studying poverty reduction practices. Therefore, with the conclusion of the poverty alleviation strategy, it is important to concentrate research on elucidating the poverty reduction effects of the TPA policies. This paper uses China’s poverty alleviation data to measure poverty reduction, in terms of the mechanisms that underpin it. A decomposition analysis of the poverty reduction effect is applied and the proportions of income growth effect and income gap adjustment effect are obtained to reflect on their respective contributions to the internal mechanisms of TPA policies.
3. Theoretical Framework and Research Methods
3.1. Theoretical Analysis Framework
In the study of poverty, there are different definitions of poverty, such as absolute poverty, relative poverty, objective poverty and subjective poverty. This study focuses on absolute poverty. Because the implementation of TPA policies has solved the problem of absolute poverty in China by 25 February 2021 (Jinping Xi, Speech at the National Poverty Alleviation Summary commendation Conference. https://www.chinanews.com/gn/2021/02-25/9419272.shtml (accessed on 19 October 2021)). But relative poverty still exists. Therefore, the evaluation of TPA policies is helpful to summarize experience and lay a foundation for solving relative poverty. Absolute poverty refers to the social and economic conditions in which individuals and families cannot meet their basic needs for survival by relying on their labor income or other legitimate income sources, and that their per capita net income is below the national poverty line of 2300 yuan (at 2010 constant prices), that is about 256.339 euros.
When studying the causes of poverty, factors such as income distribution and the rate of economic growth cannot be ignored. Although economic growth helps to alleviate poverty, it cannot be used to explain the full process at work. Income distribution also plays an important role in reducing poverty (Kak-wani & Pernia, 2000; Balisacan, 2003, 2004).
Almost all the existing literature follows the triangular relationship structure of “economic growth–income gap–poverty” (Dhongde, 2004; Pasquale, 2010; Zaman, 2016; Daron, 2016). It is suggested that a certain degree of economic growth leads to a widening in income gaps, causing poverty to worsen. As such, a reverse analysis of the relationship between poverty, economic growth and income distribution was carried out and used to form the economic theory of poverty reduction. This theory posits that poverty reduction can be achieved to its greatest extent only when the actual rate of income growth among the poor within a region is higher than that of the non-poor operating under the same distribution pattern (Pernia, 2003; Luttrell, 2017).
The economic theory of poverty reduction forms the theoretical origins of the TPA policies. It follows the logic of “poverty reduction–income growth–income gap”, which means that whoever is poor will be supported. It can be seen that the poverty reduction effects of the TPA policies are generally reflected by improvements in the income distribution process. As such, the reason why the TPA policies can achieve a poverty reduction effect is that they will inevitably bring about the income growth of the poor and a narrowing of the income gap. We may formulate this effect as follows:
the poverty reduction effect = the income growth effect + the income gap adjustment effect
In fact, the above formula can also be interpreted as a pathway to poverty reduction. By raising the income level of the poor and adjusting the income gap among residents, the goal of poverty reduction can be finally achieved. Li Jiang (2015) proposed that there are two reasons for household poverty at the micro-level that arise from the perspective of income distribution. First, under the impact of the quality and quantity of production factors “owned by them”, households cannot be lifted out of poverty during the initial distribution process; second, it is difficult to get rid of poverty due to the influence of income redistribution behaviors such as social security, fiscal and taxation policies, and regional development strategies [35]. Therefore, it is possible to increase the income level of low-income groups through primary distribution methods such as resource pooling and industrial development. The government can also play the role of social security in poverty alleviation and income redistribution to narrow the income gap, thus enhancing the ability of the poor to escape poverty. Compared with the previous poverty alleviation practice of “flooding”, the TPA can achieve more actual effects in solving the problems of “who to support” and “how to help”. To this end, China’s poverty alleviation strategy can achieve brilliant outcomes. Therefore, based on the above analysis, the following hypotheses are proposed:
Hypothesis 1 (H1).
The implementation of TPA policies can increase the income of low-income people;
Hypothesis 2 (H2).
The implementation of TPA policies can narrow the income gap among residents;
Hypothesis 3 (H3).
The implementation of TPA policies achieves poverty reduction effect by increasing income and narrowing income gap.
3.2. Research Ideas and Methods
The research ideas developed in this article are divided into three steps (as shown in Figure 1). First, we use the FGT poverty index to measure the poverty reduction effects of the TPA policies. Secondly, using the poverty monitoring data of rural China and the official website data of the provincial statistical bureaus, a measurement model based on the factors affecting poverty is constructed to analyze the relationship between poverty reduction, income growth and income gap adjustment. Finally, the Shapley index decomposition method is used to analyze the poverty reduction effects of targeted poverty alleviation in terms of how these operate with income growth and income gap adjustment.
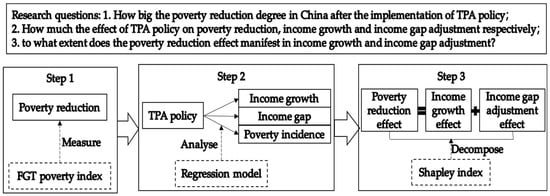
Figure 1.
The research design, questions and methods.
4. Measurement of the Poverty Reduction Effects of Targeted Poverty Alleviation Policies
Based on the poverty alleviation data provided by the Poverty Monitoring Report of China Rural, the China Yearbook of Household Survey, the website of the National Bureau of Statistics, and the official websites of the provincial and municipal statistical bureaus, the study quantitatively calculates the FGT index to reflect the changes of the poverty reduction effects of the TPA policies. The FGT index is an indicator of poverty in terms of its breadth, depth, and intensity. This study draws on the FGT index formula constructed by Foster (1984) [36] and Gaurav Datt (1998) [37]:
where z represents the poverty line, q represents the number of poor residents, n represents the total number of residents in a certain area, yi represents the income of the poor individual i, and α represents the coefficient of poverty aversion. The larger the value of α, the higher the degree of aversion to poverty. When α = 0, it indicates the poverty incidence. That is, the breadth of poverty, which is usually represented by the capital letter H. When α = 1, it indicates the depth of poverty, which is usually expressed by PG. When α = 2, it refers to poverty intensity, which is usually expressed by SPG. Under the current background of China’s poverty alleviation strategy, the FGT poverty index can be broken down into three different indicators: the poverty breadth H index, the poverty depth PG index, and the poverty intensity SPG index. These indexes measure the poverty situation in China from different standpoints. Changes in these indexes can reflect the effectiveness of poverty governance.
This paper uses the values of two important indicators in the Lorenz curve to perform the regression, namely the cumulative income percentage L and the cumulative population percentage P. It then obtains a GQ model (Gaurav Datt, 1998) that is highly fitted to the Lorenz curve. The formula of the GQ model is:
L(1 − L) = a(P2 − L) + bL(P − 1) + c(P − L)
In formula (2), L represents the cumulative income percentage of the rural population, P represents the cumulative rural population percentage, and L(P) is the Lorenz curve function with P as the independent variable. The coefficients of a, b and c can be estimated through the regression model, and then e, m, n, r, s1 and s2 can be calculated according to the following formulas:
e = −(a + b + c + 1)
m = b2 − 4a
n = 2be − 4c
Here, z represents the poverty line, while µ represents the per capita disposable income. The calculation formulas for the three indicators of the FGT index are as follows:
Calculating the FGT index according to the GQ model also requires income grouping data in rural areas of China. According to the 2014–2020 China Statistical Yearbook, income data and the population percentage of rural populations grouped by income are collated and presented in Table 1.

Table 1.
Five-division grouping data of China’s rural households from 2013 to 2019 (unit: yuan (euros)).
It is relatively simple to calculate the FGT index through the general quadratic (GQ) Lorenz model. The value of the cumulative population percentage P and the value of the cumulative income percentage L in the rural area can be obtained according to the data in Table 1. With this, the value of some points on the Lorenz curve can be obtained. And then the function L(P) of the corresponding year can be calculated. The GQ model is closely fitted to the Lorenz curve, so the values of the dependent variable L(1 − L) and the independent variables P2 − L, L(P − 1) in formula (2) can be obtained from the data of P and L, to finally get the GQ model data of every year. The study uses the relevant data in 2019 as an example to calculate the data to be regressed, as shown in Table 2.
Table 2.
Data to be regressed in the GQ model of China’s rural residents in 2019.
The values of the three parameters of the GQ function model, namely a, b and c, are obtained by regressing the above data. The results are shown in Table 3.
Table 3.
Regression results of the GQ model of China’s rural residents’ income in 2019.
The t values of the coefficients a and b are both large in Table 3, meaning that they are significant. And the t value of the coefficient c is small, which is significant at the significance level of 10%. The adjusted R2 value is equal to 0.9999, which indicates that the model fits the sample data well. The regression coefficients and test results show that the model has a certain explanatory power. Calculate e, m, n, r, s1 and s2 according to formula (3) to (8), and combine the known poverty line z and the value of per capita disposable income µ by substituting it in the formula (9) to (11), we can get the FGT poverty index for China’s rural areas in 2019. The data of other years are calculated using the same methods, and the specific calculation process is omitted. Table 4 lists China’s rural FGT poverty index from 2013 to 2019.
Table 4.
2013–2019 China’s rural FGT poverty index (%).
According to Table 4, China’s rural poverty situation improved significantly from 2013 to 2019. The poverty breadth H index dropped from 8.67% in 2013 to 5.74% in 2019, a decrease of 2.93 percentage points, which indicates that the breadth of rural poverty in China has been reduced. The poverty depth PG index was 3.89% in 2013 and 2.17% in 2019, a decrease of 1.72 percentage points, indicating that the distance between the income level of the poor and the poverty line is constantly shrinking in China. The poverty intensity SPG index dropped from 2.48% in 2013 to 0.94% in 2019, a decrease of 1.54 percentage points, indicating that a decreasing proportion of those experiencing absolute poverty among China’s total rural poverty population. The poverty situation in China’s rural areas has, therefore, notably improved, as shown in Figure 2.
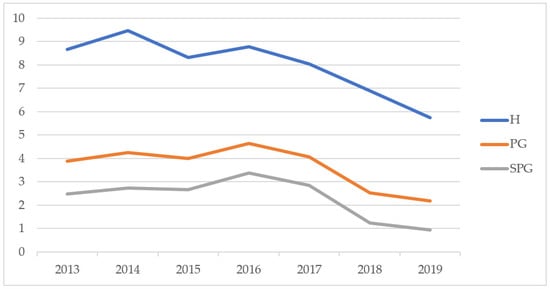
Figure 2.
2013–2019 China’s rural FGT poverty index (%).
It can be seen from Figure 1 that the poverty breadth H index, poverty depth PG index, and the poverty intensity SPG index all showed a significant and lasting decline from 2013 to 2019. The slight rebound during the period is due to the government formulating a new poverty line standard in 2016, and carrying out a series of TPA studies to precisely identify the poor. Despite the rebound, the overall poverty reduction effect across the period is obvious to all. The decline of the FGT poverty indexes shows that the TPA policies proposed and implemented at the end of 2013 have had a significant effect on poverty reduction. It can be said that the TPA strategy has met its original intention, which was to “alleviate the real poverty” and “truly alleviate the poverty”.
5. Analysis of the Poverty Reduction Mechanism of Targeted Poverty Alleviation Policies
It is not enough to measure only the poverty reduction effects of targeted poverty alleviation policies. We need to establish a regression model to clarify the internal influence mechanism and effectiveness of the implementation of targeted poverty alleviation policies.
5.1. Regression Model Construction
5.1.1. Index Selection and Data Sources
Three types of dependent variables are selected: income level (Income), income gap (Gini), and poverty incidence (PI). (1) Income level (Income) is an expression of the per capita disposable income of rural residents in each province. (2) Income gap (Gini) is represented by the rural Gini coefficient of each province. It is difficult to obtain the income gap data in the poverty-stricken areas of each province in China as these are mainly concentrated in the vast rural areas. So the rural Gini coefficient is used to reflect the income gap of poverty-stricken areas of each province, drawing on the method used by Hu Zuguang (2004) [38] to calculate the Gini coefficient in rural areas. The larger the Gini, the larger the income gap in poor areas. (3) Poverty incidence (PI) represents the degree of poverty in different poverty-stricken areas.
Since this article mainly studies the poverty reduction effects of the targeted poverty alleviation policies, the (Policy) concept forms the main independent variable. In November 2013, General Secretary Xi Jinping put forward the idea of “targeted poverty alleviation”. As all regions only began to implement the relevant work of targeted poverty alleviation the following year, the year 2014 is therefore treated as the implementation node of the policies. The TPA policies are introduced as a dummy variable: that is, the value of this variable is 0 before 2014 and 1 during and after 2014 (please see Table 5). Poverty alleviation funds (PAF) also form important independent variables, as the most important aspect of the TPA strategy is to arrange funding through various poverty alleviation projects. Indeed, Weibin Zhang (2013) argues that increasing the investment of poverty alleviation funds can effectively increase the income level of the poor [39]. The two absolute variables of Income and PAF are processed logarithmically.
Table 5.
Variable selection and descriptive statistics.
There are many factors that affect the degree of poverty reduction, and the TPA policies form one of them. Therefore, the following variables are introduced as control variables. (1) The degree of government participation in economic activities (Fpg), which is represented by the ratio of local fiscal expenditure to regional GDP. Since the fiscal expenditures of local governments tend to be invested in cities and towns, the government fiscal behavior and scale will undoubtedly have an important impact on the income level of poor rural areas. This indicator mainly refers to the control variables introduced by Dajian Tong et al. (2020) [40]. (2) Industrial structure (Indus), which is represented by the ratio of the sum of the total output value of the secondary and tertiary industries to the regional GDP. Since poor rural areas are dominated by primary industry, the upgrading of the industrial structure will affect the income levels and income distribution gaps of residents in poor rural areas. The indicator selection refers to the control variables selected by Xiaobo Wei et al. (2020) [41]. (3) The degree of fiscal decentralization (Fide), which uses the ratio of public budget revenue to public budget expenditure in each province. There is considerable debate among Chinese scholars over the relationship between fiscal decentralization and income distribution. Some scholars believe that Chinese-style fiscal decentralization is an important factor in the continuous expansion of income distribution inequality [42]. Other scholars believe that fiscal decentralization can alleviate the imbalance of the income distribution [43]. This article refers to the control variables selected by Ping Lin (2020) [33], shown in Table 5.
The research areas selected for the study include 28 provinces, municipalities and autonomous regions in China after removing the three regions of Beijing, Tianjin and Shanghai. Since the poverty incidence in Beijing, Tianjin, and Shanghai reached 0 in 2013, the implementation of TPA policies has had little impact on these three provinces and cities. Data used for the study comes from the Poverty Monitoring Report of China Rural series, published by the National Bureau of Statistics. The report reflects the national rural poverty status, rural poverty status in poverty-stricken areas, and regional poverty status for the periods 2000–2011 and 2015–2019. Unfortunately, since the 2012–2014 Poverty Monitoring Report of China Rural was not released, relevant data for these three years were collected from the Yearbook of China’s Poverty Alleviation and Development published in 2011–2019, the website of the National Bureau of Statistics, and the websites of the provincial and municipal statistical bureaus as a supplement. The research sample period is 2010–2018.
5.1.2. Model Checking
The main purpose of the TPA policies is to reduce the poverty incidence and improve the living standards of the poor. The poverty reduction effect is mainly reflected in two areas. One is the increase in income among residents and the other is the narrowing of the income gap among residents. Therefore, based on the panel data of 28 provinces and cities in China from 2010 to 2018, the following model is established:
In Equations (12)–(14), i represents the individual in the panel data (i.e., the 28 provinces); t represents the year; εit represents the random error term.
For the three model forms of panel regression—mixed model, fixed-effects model and random-effects model—it is necessary to adopt the method of hypothesis testing to determine which of these should be selected in order to achieve the best fitting effect. First, we control for time, and use the F test method to clarify which model form is more appropriate between the mixed model and the fixed-effects model. The null hypothesis of the F test is “H0: all ui = 0”. If the null hypothesis is rejected, it shows that the fixed-effects model is more suitable than the mixed model. Secondly, through the Hausman test, we are able to determine whether the fixed-effects model or the random-effects model is appropriate.
The F test is posited as F~F(N-1, NT-N-K), where N is 28, T is 9, and K is 5. After calculation by Stata 14.0 software, F = 20.87 in model (12), and its corresponding adjoint probability is 0.0000, rejecting the null hypothesis at the 1% significance level, indicating that the mixed model cannot be used, and the Hausman test needs to be continued. In model (13) F = 1.07 and its corresponding adjoint probability is 0.3755, which means that the null hypothesis is accepted, and the mixed model should be used. In model (14) F = 12.17, its corresponding adjoint probability is 0.0000, and its null hypothesis is rejected at the 1% significance level, indicating that the mixed model cannot be used, and the next is Hausman’s test. The testing results are shown in Table 6.
Table 6.
F test and Hausman test.
There is no correlation between the independent variable and the error term in the random-effects model, while the two are correlated in the fixed-effects model. The null hypothesis of the Hausman test is “H0: ui is not related to xit, zi”. If the null hypothesis is true, the random-effects model should be used. The alternative hypothesis is “H1: ui is related to xit, zi”, and if the alternative hypothesis is true, the fixed-effects model should be used. It can be seen from Table 6 that both models (12) and (14) reject the null hypothesis H0 at the 5% significance level. Therefore, both models (12) and (14) should use fixed-effects models for regression.
5.1.3. Regression Analysis Results
Through the above test, the fixed-effects model and the mixed model are established respectively to analyze the poverty reduction mechanism, the income growth mechanism, and the income gap adjustment mechanism of the TPA policies from a macro perspective. In order to better analyze the impact of TPA policies and ensure the robustness of the regression model, independent variables and control variables will be introduced gradually in three situations. Case (1) is to estimate the core independent variable “Policy” and the important independent variable “Paf”; Case (2) is to introduce the control variable of “Fpg” on the basis of Case (1). Case (3) is to estimate and analyze all variables.
Table 7 presents the results of regression analysis. The three models passed the test at the 1% significance level. In model (12), the core independent variable (Policy) and the important independent variable (Paf) in the three cases are in compliance with the requirements of various measurement tests at a significance level of 1%. In the regression of situation (3), the coefficient of the “Policy” is 0.2644, indicating that the implementation of TPA policies can significantly increase the income of residents in rural areas. If the TPA policies are promoted by 1%, the income of residents will increase by 0.2644%. And the investment in poverty alleviation funds also has a positive impact on the income growth of rural residents. For every 1% of investment increase in poverty alleviation funds, the income of rural residents will increase by 0.1413%. Both the “Indus” and the “Fpg” are significant at the 5% level, indicating that the optimization of the industrial structure and the government’s active participation in economic activities will increase the income of residents. The coefficient of the “Fide” is negative, but the effect is not significant.
Table 7.
Regression results of model (12), model (13) and model (14).
In model (13), the TPA policies have a significant negative effect at the 1% significance level in the three cases. In case (3), the corresponding coefficient value of the “Policy” variable is −0.0254, indicating that if the TPA policies are advanced by 1%, the income gap in rural areas will be reduced by 0.0254%. The coefficient of the “Paf” is also negative, but it is not significant, and other control variables are not significant. In model (14), the TPA policies and poverty alleviation funds have a significant negative effect on the poverty incidence. Specifically, in case (3), for every unit that the TPA policies advanced, the poverty incidence will be reduced by 3.41 units. The increase of poverty alleviation funds by one unit will reduce the poverty incidence by 3.42 units, indicating that the implementation of TPA policies and the increase of the investment in poverty alleviation can significantly reduce the poverty incidence.
It can be seen that the TPA policies have a significant impact on increasing the income of rural residents, narrowing the income gap, and reducing the poverty incidence in rural areas. This indicates that the implementation of the TPA policies has played a critical role in poverty governance. In addition, the investment of poverty alleviation funds has a positive impact on the residents’ income of poverty-stricken areas in China, but the effect of reducing the income gap in rural areas is not obvious. This indicates that the poverty reduction effects of poverty alleviation funds are mainly reflected in the income of residents. It also shows that the use of poverty alleviation funds has a certain “spillover” effect, and its accuracy and effectiveness need to be improved. That is to say, poverty alleviation funds may be more beneficial to the increase of the overall income level of poverty-stricken areas rather than the income of the poor. This is consistent with the research conclusions of Junping Guo (2017), who argues that the investment of poverty alleviation funds has benefited more non-poor households in rural areas, with less effect on narrowing the income gap [27].
6. Decomposition of the Poverty Reduction Effects of Targeted Poverty Alleviation Policies
Through the previous analysis, it can be seen that the TPA policies have a significant poverty reduction effect. The FGT index confirms that there is a significant poverty reduction trend. The regression model confirms the poverty reduction mechanism, the income growth mechanism, and the income gap adjustment mechanism are affected by variables such as the TPA policies. In fact, the most intuitive manifestation of the poverty reduction effect is the decline of the poverty incidence and the reduction in the number of the poor. Through two decomposition effects, this manifests as an increase in income level and a reduction in the income gap. Therefore, the income growth effect and income gap adjustment effect are the specific functioning mechanisms of the poverty reduction mechanism or the indirect manifestations of the poverty reduction effect. This raises the question: to what extent does the poverty reduction effect manifest in the factors of income growth and income gap adjustment? The Shapley value decomposition method is used to implement the decomposition calculation of the poverty reduction effect.
When choosing the decomposition method of the poverty reduction effect, the decomposition method of the Shapley value based on the regression model is adopted. The Shapley value decomposition was developed by Shorrocks [44] and consists of two steps. The first step is to establish a model for determining the poverty incidence and estimate the coefficients of the model. In the second step, the calculated indicators of the dependent variable are used on both sides of the equation, and the contribution of each independent variable to the dependent variable is obtained.
According to the principle of the Shapley value decomposition, the contribution of a factor to the degree of poverty reduction mainly lies in two situations. One is the correlation coefficient between the factor and the degree of poverty reduction, which presents the factor’s partial effect on poverty reduction. Given the distribution of this factor, the greater the value of the coefficient, the greater the contribution of this factor to poverty reduction. The second is the distribution of the factor. Given that the correlation coefficient of the factor to the poverty reduction remains unchanged, the more uneven its distribution, the greater the contribution of this factor to poverty reduction. At the extreme, when the partial effect of a factor on the degree of poverty reduction is close to 0 or its distribution is completely equal, the contribution of the factor to the degree of poverty reduction is 0 [45].
Based on the above analysis, the following regression model is established:
As shown in Table 8, the adjusted R2 in model (15) is 0.75673, which shows that the model has a good fit. The adjoint probability of the F statistic is 0, indicating that the model as a whole is very significant. In addition, model (15) has been tested for multicollinearity, and its maximum VIF value is 1.13, which is much smaller than 10. Therefore, the model has no collinearity problem. According to Table 8, it can be seen that the increase of income level has a significant impact on the poverty incidence, while the impact of the rural Gini coefficient is not significant. Therefore, the increase in the income of the poor can significantly reduce the poverty incidence, while the narrowing of the income gap has little effect on reducing the poverty incidence.
Table 8.
Regression results of model (15) and Shapley value decomposition results.
On the basis of the regression analysis of model (15), the Shapley value decomposition operation is performed, with the results presented in Table 8. It can be seen that the increase in the income of the poor provides the greatest contribution to the poverty reduction effect. The income growth effect accounts for 92.78% of the poverty reduction effect. In contrast, the narrowing of the income gap has a minimal contribution to the poverty reduction effect, accounting for only 7.22%. This shows that the implementation of the TPA policies are more successful in achieving poverty reduction effects by increasing the income level of the poor, while the effect of reducing the income gap to achieve poverty reduction effects is relatively insignificant. Therefore, in the implementation stage of China’s poverty alleviation strategy, the main goal is to raise the income level and improve the living conditions of the poor, and their income can rise above the poverty line to achieve poverty alleviation. At this stage, the income growth rate of the poor may not be higher than that of the non-poor, so the poverty reduction effect of income gap adjustment is not prominent.
7. Conclusions and Policy Recommendations
The results of the study show that the changes in the FGT index show a downward trend, which reflects that the poverty reduction effects of the TPA policies are clear. In addition, the implementation of the TPA policies can significantly increase the income level of rural residents, reduce the income gap among rural residents, and reduce the poverty incidence in rural areas. And the Shapley value decomposition result shows that the poverty reduction effect of income growth is outstanding at 92.78% and accounts for the largest proportion of the poverty reduction effect. By contrast, the change of income gap has no significant effect on poverty reduction and the proportion is relatively small, only 7.22%. In addition, the investment of poverty alleviation funds can only significantly increase the income level of the poor and reduce the poverty incidence in rural areas, and has no significant effect on reducing the income gap.
Of course, due to some limitations in sample data collection, it is difficult to obtain the data of the rural inflation rate of various provinces and cities in China. Therefore, income growth can be associated with an increase in inflation in China, which may affect the research conclusion of this paper. Subsequent studies can be further refined from this aspect.
Although TPA policies have played an important role in poverty reduction, after the poverty alleviation work is completed, in addition to evaluating the effectiveness of the policies it is also necessary to explore how to effectively link poverty alleviation and rural revitalization and prevent the phenomenon of collective return to poverty. Therefore, based on the research conclusions, the following policy recommendations are put forward.
First of all, improving the income level of the poor in the rural revitalization phase should still remain the focus of work. Targeted poverty alleviation policies have played an important role in the process of poverty governance in China. And the income growth effect accounts for a large proportion of the poverty reduction effect. This indicates that measures are taken to continuously increase the income level of residents, which is the most effective way to reduce poverty. During the 14th Five-Year Plan period (2021–2025), how to perform the strategic role of rural revitalization and adopt various measures to comprehensively increase the income level of residents will also form an important breakthrough in solving the problem of relative poverty. An example might be to provide more employment opportunities for the poor through the development of rural industries, and to improve their professional skills through training so they can acquire more opportunities to increase their own income. Or guiding farmers to participate in non-agricultural employment given that the poverty reduction effect of the rural labor’s non-agricultural employment is obvious [46].
Secondly, promoting the function of income distribution regulation and increasing the income growth rate of the poor are important considerations. Although the income gap adjustment effect accounts for only a small part of the poverty reduction effects, it may play a role in the relative poverty governance stage. In the stage of rural revitalization, the government can appropriately intervene in poverty reduction by adjusting income distribution gaps to control the relative poverty, such as taking measures to ensure that the income of the poor is growing faster than that of the non-poor, or through types of subsidized poverty alleviation to provide basic livelihood and social security to the poor, especially in areas of assistance to the elderly, the weak, the sick and the disabled.
Finally, building an early warning mechanism to signal a collective return to poverty will help to prevent the phenomenon from reoccurring and to consolidate the poverty alleviation effects. The government should invest more poverty alleviation funds to prevent falling back into poverty. Through the establishment of an early warning mechanism for returning to poverty, we can continue to track people out of poverty and prevent poor households from returning to poverty.
An evaluation of China’s TPA policies shows that it is an effective tool for poverty governance. Poverty is not only a difficult problem for China, but also for the world. China’s TPA policies have broken through this global development problem and provided valuable experience for the global anti-poverty campaign. Research on the policy enriches the theoretical foundations of poverty related research and helps to promote the development of global social sciences. In practice, it can provide other developing countries with new ideas and specific methods for approaching poverty reduction. For example, through the establishment of a precise concept of “one household, one policy”, we can hope to raise the income levels of the poor, narrow the income gap and achieve poverty reduction through the development of poverty alleviation industries, fiscal transfer payments and skills training.
Author Contributions
Conceptualization, X.L.; methodology, L.L.; software, L.L.; validation, X.L. and L.L.; formal analysis, X.L.; investigation, X.L. and L.L.; resources, X.L.; data curation, X.L. and L.L.; writing—original draft preparation, L.L.; writing—review and editing, X.L. and L.L.; visualization, X.L. and L.L.; supervision, X.L.; project administration, X.L.; funding acquisition, X.L. All authors have read and agreed to the published version of the manuscript.
Funding
This research was funded by the Shaanxi Social Science Fund Project, grant number 2020D036, “Research on poverty reduction effect estimation and long-term optimization mechanism of targeted poverty alleviation”; Shaanxi Provincial Department of Science and Technology Soft Science Project, grant number 2021KRM081, “Research on income distribution effect and long-term optimization mechanism of targeted poverty alleviation”.
Institutional Review Board Statement
Not applicable.
Informed Consent Statement
Not applicable.
Data Availability Statement
If necessary, we would be pleased to share the research data in this work with interested academics. We also intend to have a more in-depth discussion with academics. Please contact the second author by email (lingling4888@163.com) if you have any data requests. I’m excited to meet additional specialists and academics in the same field.
Acknowledgments
We are grateful for the support of 2020 Shaanxi Social Science Fund Project (project title: Research on poverty reduction effect estimation and long-term optimization mechanism of targeted poverty alleviation) and 2021 Shaanxi Provincial Department of science and technology Soft Science Project (project title: Research on income distribution effect and long-term optimization mechanism of targeted poverty alleviation).
Conflicts of Interest
The authors declare no conflict of interest.
References
- Liu, M.; Feng, X.; Wang, S.; Qiu, H. China’s poverty alleviation over the last 40 years: Successes and challenges. Aust. J. Agric. Resour. Econ. 2020, 64, 209–228. [Google Scholar] [CrossRef]
- Dewi, S.; Majid, M.S.A.; Aliasuddin, A.; Kassim, S.H. Dynamics of financial development, economic growth, and poverty alleviation: The indonesian experience. South East Eur. J. Econ. Bus. 2018, 13, 17–30. [Google Scholar] [CrossRef]
- Guo, Y.Z.; Wang, J.Y. Poverty alleviation through labor transfer in rural China: Evidence from Hualong County. Habitat Int. 2021, 116, 102402. [Google Scholar] [CrossRef]
- John, S.; Paul, D.; Caroline, S. Applying sen’s capability approach to poverty alleviation programs: Two case studies. J. Hum. Dev. Capab. 2008, 9, 229–246. [Google Scholar]
- Fan, S.; Hazell, P.; Thorat, S. Government spending, growth and poverty in rural India. Am. J. Agric. Econ. 2000, 82, 1038–1051. [Google Scholar] [CrossRef]
- Agénor, P.R.; Bayraktar, N.; El Aynaoui, K. Roads out of poverty? Assessing the links between aid, public investment, growth, and poverty reduction. J. Dev. Econ. 2008, 86, 277–295. [Google Scholar] [CrossRef]
- Ali, A.; Abdulai, A. The adoption of genetically modified cotton and poverty reduction in Pakistan. J. Agric. Econ. 2010, 61, 175–192. [Google Scholar] [CrossRef]
- Sen, A. Poverty and Famines; The Commercial Press: Beijing, China, 2004; pp. 1–21. [Google Scholar]
- Park, A. Community-based development and poverty alleviation: An evaluation of China’s poor village investment program. J. Public Econ. 2010, 94, 790–799. [Google Scholar] [CrossRef]
- Drago, C. The analysis and the measurement of poverty: An interval based composite indicator approach. Economies 2021, 9, 145. [Google Scholar] [CrossRef]
- Zurovec, O.; Vedeld, P.O. Rural livelihoods and climate change adaptation in laggard transitional economies: A case from bosnia and herzegovina. Sustainability 2019, 11, 6079. [Google Scholar] [CrossRef]
- Sen, A. Development as Freedom; OUP Oxford: Oxford, UK, 1999. [Google Scholar]
- Fowler, C.S.; Kleit, R.G. The effects of industrial clusters on the poverty rate. Econ. Geogr. 2014, 90, 129–154. [Google Scholar] [CrossRef]
- Mercader-Moyano, P.; Morat-Pérez, O.; Muñoz-González, C. Housing evaluation methodology in a situation of social poverty to guarantee sustainable cities: The satisfaction dimension for the case of mexico. Sustainability 2021, 13, 11199. [Google Scholar] [CrossRef]
- De Janvry, A.; Graff, G.; Sadoulet, E.; Zilberman, D. Technological change in agriculture and poverty reduction: The potential role of biotechnology. Nat. Resour. Manag. Policy 2005, 27, 361–386. [Google Scholar]
- Bertoli, S.; Marchetta, F. Migration, remittances and poverty in Ecuador. J. Dev. Stud. 2014, 50, 1067–1089. [Google Scholar] [CrossRef]
- Brady, D. The welfare state and relative poverty in rich western democracies 1967–1997. Soc. Forces 2005, 83, 1329–1364. [Google Scholar] [CrossRef]
- Imai, K.S.; Gaiha, R.; Kang, W. Vulnerability and poverty dynamics in Vietnam. Appl. Econ. 2011, 43, 3603–3618. [Google Scholar] [CrossRef]
- Gertler, P.J.; Martinez, S.W.; Rubio-Codina, M. Investing cash transfers to raise long-term living standards. Am. Econ. J. Appl. Econ. 2012, 4, 164–192. [Google Scholar] [CrossRef]
- Hwang, S.-M.; Yoon, S.-J.; Jung, Y.-M.; Kwon, G.-Y.; Jo, S.-N.; Jang, E.-J.; Kwon, M.-O. Assessing the impact of meteorological factors on malaria patients in demilitarized zones in Republic of Korea. Infect. Dis. Poverty 2016, 5, 20. [Google Scholar] [CrossRef] [PubMed]
- Ndlovu, G.; Toerien, F.; Segot, T.L. The distributional impact of access to finance on poverty: Evidence from selected countries in Sub-Saharan Africa. Res. Int. Bus. Financ. 2020, 52, 101190. [Google Scholar] [CrossRef]
- Ren, B.Y.; Meng, W.F. Inclusive financial development, rural labor transfer and poverty reduction effects. Res. Financ. Issues 2020, 6, 49–56. [Google Scholar]
- Zhou, J.K.; Wang, W.B.; Gong, M.Y.; Huang, Z.X. Agricultural land transfer, occupational stratification and the effect of poverty reduction. Econ. Res. 2020, 55, 155–171. [Google Scholar]
- Gong, W.J.; Qin, C.L.; Li, C. The poverty reduction effect of China’s fiscal expenditure—Based on the structural and spatial perspective. Econ. Manag. Res. 2018, 39, 24–37. [Google Scholar]
- Zhang, X.; Zhao, Y.D. The heterogeneity test of the poverty reduction effect of social medical insurance—Based on the panel data of 31 provinces from 2010 to 2017. Nankai J. 2020, 2, 80–91. [Google Scholar]
- Chen, M.; Zhou, F.M. Research on the poverty reduction effect of agricultural scientific research based on threshold panel model. Econ. Syst. Reform 2016, 6, 93–98. [Google Scholar]
- Guo, J.P.; Ning, A.Z.; Qu, S. Is the comprehensive development of participatory communities “promoting the poor” or “overflowing the rich”?—Based on the perspective of targeted poverty alleviation and income distribution effects. Agric. Econ. Issues 2017, 38, 52–62. [Google Scholar]
- Liu, J.M.; Ouyang, L.; Mao, J. Research on the rural poverty reduction effect of financial education expenditure—Based on the analysis of cyberspace structure. Financ. Econ. Theory Pract. 2018, 39, 64–68. [Google Scholar]
- Sun, B.W.; Xie, X.J.; Cheng, Z.Q. The sustainable poverty reduction effect of the integration of urban and rural labor market—Based on the green poverty reduction efficiency under the OECD green growth framework. Ecol. Econ. 2019, 35, 197–204. [Google Scholar]
- Zhang, Q.; Sun, H. Analysis of my country’s rural financial poverty reduction effect under multidimensional poverty agglomeration. J. Hum. Agric. Univ 2019, 20, 18–24. [Google Scholar]
- Li, K.; Wang, Z.Z.; Liu, T. Analysis of the poverty reduction effect of rural tourism in southwest contiguous destitute areas—Based on the survey of 235 villages in Guangxi. Hum. Geogr. 2020, 35, 115–121. [Google Scholar]
- Wang, L.Y.; Xu, M. Research on the poverty reduction effect of China’s precision poverty alleviation policies: Empirical evidence from Quasi-natural experiments. Stat. Res. 2019, 36, 15–26. [Google Scholar]
- Lin, P. Research on the poverty reduction effect of Fujian’s precision poverty alleviation policy—Determining the key counties of provincial poverty alleviation and development as an example. Fujian Forum 2020, 5, 177–185. [Google Scholar]
- Yang, F.H.; Peng, X.W.; Meng, X.H. Research on the poverty reduction effect of public investment in my country’s targeted poverty alleviation. New Financ. 2020, 5, 49–54. [Google Scholar]
- Jiang, L. Analysis of the causes of social family poverty in our country from the perspective of income distribution. J. Shaanxi Norm. Univ. 2015, 44, 5–12. [Google Scholar]
- Foster, J.; Greer, J.; Thorbecke, E. A class of decomposable poverty measures. Econometrica 1984, 52, 761–766. [Google Scholar] [CrossRef]
- Datt, G. Computational Tools for Poverty Measurement and Analysis; FCND Discussion Paper No. 50; International Food Policy Research Institute: Washington, DC, USA, 1998. [Google Scholar]
- Hu, Z.G. Research on the theoretical optimal value of Gini coefficient and its simple calculation formula. Econ. Res. 2004, 9, 60–69. [Google Scholar]
- Zhang, W.B.; Wang, S.G. Poverty alleviation policies, income distribution and poverty reduction in China’s rural areas. Agric. Econ. Issues 2013, 34, 66–75. [Google Scholar]
- Tong, D.J.; Fang, X.Z.; Zhang, S.Y.; Ying, R.Y. Evaluation of the poverty reduction effect in the poverty alleviation reform pilot area—Based on the research of synthetic control method. Agric. Technol. Econ. 2020, 10, 131–144. [Google Scholar]
- Wei, X.B.; Cao, W.; Liu, X.F.; Wang, J.; Shi, N.F. Research on the multidimensional poverty reduction effect of fiscal decentralization. Econ. Geogr. 2021, 1–21. Available online: http://kns.cnki.net/kcms/detail/43.1126.K.20200922.0950.002.html (accessed on 19 October 2021).
- Ma, W.L.; Li, Q.Y.; Zhang, X.W. Fiscal decentralization factors of income distribution gap: An analysis framework. Economist 2013, 4, 13–23. [Google Scholar]
- Li, X.S.; Ran, G.H. Fiscal decentralization, agricultural economic growth and urban-rural income gap. Agric. Technol. Econ. 2013, 1, 86–94. [Google Scholar]
- Shorrocks, A.F. Decomposition Procedures for Distributional Analysis: A Unified Framework based on the Shapley Value. J. Econ. Inequal. 2013, 11, 99. [Google Scholar] [CrossRef]
- Zhao, J.Z. Contribution of Relationship to Rural Income Gap and Its Regional Differences. Ph.D. Thesis, Fudan University, Shanghai, China, 2009; pp. 363–390. [Google Scholar]
- Liu, J.P.; Wang, X.Y.; Liu, M.M. Analysis of the poverty and alleviation effects and influencing factors of non-agricultural employment of labor force—Based on the survey data of 14 poor villages in Gansu. J. Xi’an Univ. Financ. Econ. 2019, 32, 100–108. [Google Scholar]


Publisher’s Note: MDPI stays neutral with regard to jurisdictional claims in published maps and institutional affiliations. |
© 2021 by the authors. Licensee MDPI, Basel, Switzerland. This article is an open access article distributed under the terms and conditions of the Creative Commons Attribution (CC BY) license (https://creativecommons.org/licenses/by/4.0/).