Abstract
Resource efficiency is a primary policy goal in many developing countries that are resources suppliers. This study performed a first try to explore the resource productivity and efficiency of an emerging world factory, Vietnam, by applying an improved economy-wide material flow analysis (MFA) integrated with a data envelopment analysis (DEA)-based Malmquist productivity index approach (MDEA). Resource flows from 1978 to 2017, and the corresponding utilization efficiency considering the unexpected environmental outputs, as well as productivity were explored in depth. The results highlighted a positive correlation between rapid growth among domestic material consumption (DMC), GDP per capita, and material intensity (DMC/capita) in Vietnam during the last four decades. Meanwhile, the resource productivity (USD/DMC) increased from 82.4 USD/ton to 125 USD/ton (2017), presenting a much slower pace than that of Japan and China. The IPAT-based decomposition analysis highlighted the contribution of rising affluence (94%) and population (21%) to the rapid growing DMC, while the technology factor (DMC/GDP) needed to be further enhanced. Finally, the total factor productivity, when comparing between Vietnam, China, South Korea, and Japan, showed that, on the one hand, the Vietnamese economy has strongly been changed in a positive direction with EFFCH 1.061 and TECHCH 1.046 during the last four decades. One the other hand, Vietnam is still material intensive and has low material productivity. Our analytical results recommend Vietnam to strengthen technology innovation and aim for efficiency enhancement through closely coordinated policies on sustainable resource consumption, carbon reduction, and economic growth, in line with the United Nations Sustainable Development Goals for 2030 (SDGs 2030).
1. Introduction
Sustainable resource management and resource efficiency is critical to realize the United Nations Sustainable Development Goals for 2030 (SDGs 2030). The increased consumption of resources and materialization for economic growth would lead to raw material price increases and resource deficits in the near future [1]; thus, many countries have material efficiency measures in their economic systems [2]. Material efficiency is easily defined as “reduced resource consumption and their associated environmental impacts with sustained economic benefits” [3,4], to achieve balanced development. In the meanwhile, serious waste problems from resource overconsumption have surpassed the limited absorptive capacity of the ecosystem, as well as the regenerative capacity of the environment. In particular, the extreme consequence of overconsumption is ecological imbalance [5,6], such as global warming and natural resource degradation. For emerging economies in particular, which play the role as primary resource suppliers or intensive natural resource consumers, for industrial products supply, resource efficiency and productivity is critical for realizing the SGDs at the national level.
To explore resource metabolism in depth is fundamental to decision-making to support sustainable resource management. Material flow analysis (MFA), which is a typical analytical tool of industrial ecology, balances resource flows of the system and provides crucial insights into the sustainable resource management of the system. The MFA guidelines were published by Eurostat [7,8,9]. Many MFA studies have been conducted at various scales, such as national, regional, local, urban, and even industrial [10]. Among them, the national scale MFA (EW-MFA) has been the most widely applied and already became the mature approach for national accounting on socio-economic metabolism [10]. EW-MFA has been conducted to diagnose resource utilization and efficiency, supporting the planning for improvement and contributing to the design of sustainable resource management of countries. For example, EW-MFA studies have been conducted by EU members [11], Hungary [12], Asia-Pacific countries, such as Japan [13,14], China [15,16], Australia [3], and Pakistan [4], as well as countries grouped by region [17,18,19]. In addition, recently, MFA has been extended to analyze the efficiency of economic ecosystems by data envelopment analysis (DEA), which measures the efficiency of a system by the ratio of the weighted outputs to inputs [20]. These resource flow and productivity efficiency research studies confirm that an in-depth investigation of the material flow and efficiency trends and socio-economic drivers could provide critical insights into resource management strategies and policies for sustainable development in a country, or at the regional level [4,10].
Vietnam has been recognized as one of the rapid-developing countries, with remarkable achievement in economic reformation. The country performed well with the outstanding GDP growth of 6.4 percent in 2017. Meanwhile, global GDP growth at that time was only expected at 3 percent [21]. However, Vietnam has been facing emerging challenges, such as huge resource requirements and carbon emissions, which can be confirmed by the fact that total Domestic Material Consumption (DMC) increased from 16.06 Mt in 1990 to 61.41 Mt in 2016, and emission intensity rose from 4.75 to 5.12 Mt CO2 per ktoe of fossil fuels [22]. Furthermore, according to Ministry of Natural Resources and Environment of Vietnam, the nation is going to sharply increase greenhouse gases emissions by around five times, with a 20% carbon intensity per GDP, which could result in adverse consequences, such as material-resource depletion by 2030 [23,24,25,26].
These numbers confirm that Vietnam’s pro-growth policy, which sacrifices environmental assets such as resources and clean environment [27], have resulted in rapid resource depletion and environmental degradation, with weak resource and environmental management institutions. However, to our knowledge, there has been few studies on material flow and productivity in Vietnam until now. Therefore, research on material flows and resource efficiency to understand Vietnam’s transition characteristics regarding economic growth, resource consumption, efficiency, and pollution emissions are very needed to derive sustainable development policy insights integrating environmental and development objectives together.
Given this background, this study investigates the sustainability of resource flow and productivity transition in Vietnam from 1978 to 2017 using an economy-wide material flows analysis and DEA-based Malmquist productivity index approach (DEAM). As per our knowledge and the literature review, no published studies exist on this topic using similar methods. Through this work, this paper aims to answer the following research questions: (1) How has material consumption evolved in fast-growing Vietnam during the last four decades? (2) Which factors are driving material consumption in the economy? (3) How do material and carbon efficiencies vary temporally at the national level, in comparison with Japan, Korea, and China? Through this study, we intend to address these research questions and derive key policy suggestions for Vietnam’s material consumption, productivity, and sustainable development from a historical and macro-policy perspective.
The organization of this paper is as follows: after this introductory section, Section 2 reviews the general condition of Vietnam as the case study; Section 3 presents the methodology and data; Section 4 presents the analytical results and discussion; and, finally, Section 5 draws the conclusions and discusses the policy perspectives and future recommendations.
2. Overview of Vietnam
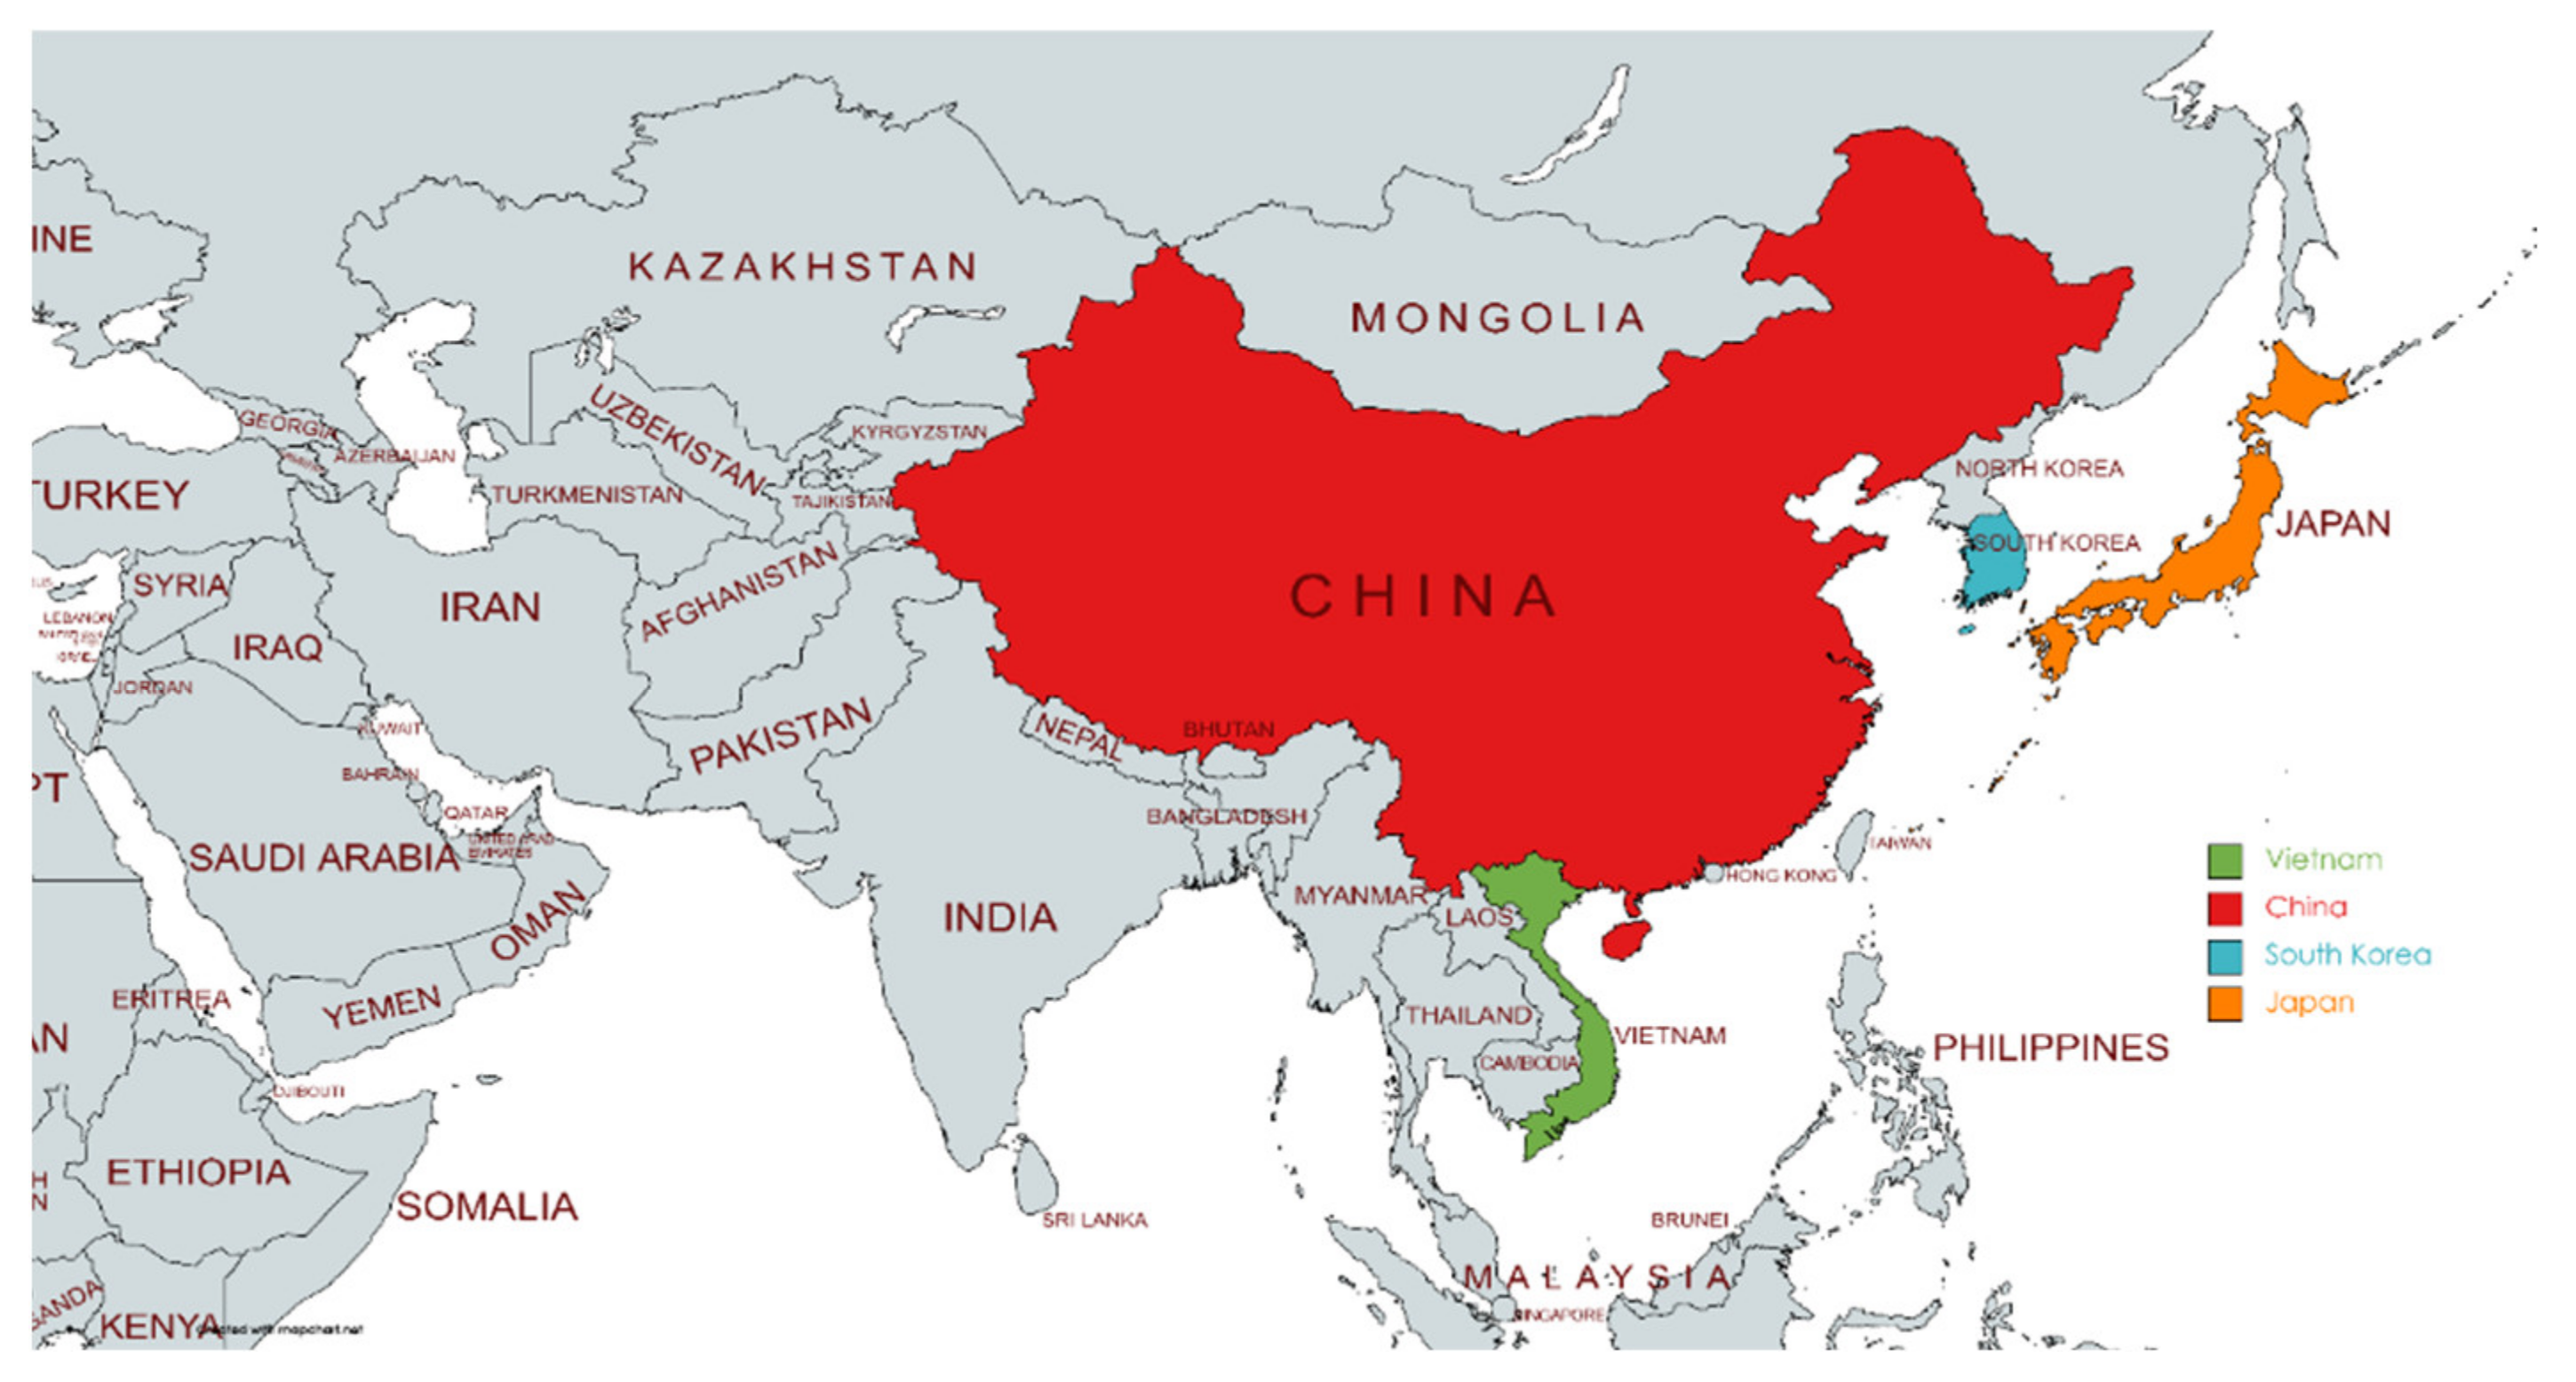
Vietnam is located on the eastern coast of mainland Southeast Asia, covering 331,699 square kilometers, and shares borders with China to the north, two vicinity countries to the west, Laos and Cambodia, the Gulf of Tokin and the South China Sea to the east, and the Gulf of Thailand to the south (Figure 1). Vietnam has been experiencing rapid demographic and social change. Its population reached 96.5 million in 2019 (up from about 60 million in 1986), making it the world’s sixteenth most populous country, and is expected to expand to 120 million by 2050. However, the population is rapidly aging, and Vietnam’s emerging middle class, currently accounting for 13 percent of the population, is expected to reach 26 percent by 2026 [27]. An overview of the economic development, resource consumption, and sustainable development challenges are described below.
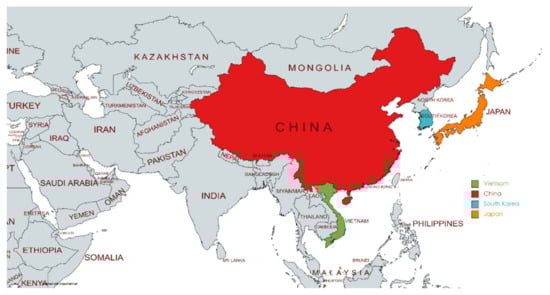
Figure 1.
Map showing Vietnam and neighboring countries. (Note: map made by the authors.)
2.1. Economic Development Status
Due to a long period of suffering from catastrophic wars, Vietnam had to face many difficulties, such as poverty, epidemics, a backwards economy, and high illiteracy. The country’s per capita income was among the poorest in the world (<200 USD) before 1980. Only after 1986, the country’s reform, “Đổi Mới (renovation or new changes)”, gradually revived Vietnam’s economy, culture, politics, and society [28]. Vietnam had achieved annual GDP growth rate of 7.9% during 1990–2000, making it one of the emerging economies in the world [29]. The country grew even more rapidly in subsequent periods; the Socio-Economic Development Plan for 2006–2010 continues the growth strategy, with expected exports to increase 16% annually [30]. Vietnam also had witnessed many regional and world economic fluctuations during this period. In recent years, the country has well performed with a real gross domestic product (GDP) in 2017 equaling 223.78 billion USD (constant 2010-dollar prices) and an annual GDP growth of 6.8%, surpassing the target of 6.7% set by the National Assembly [31], which put Vietnam as one of the fastest growing economies in the world at that time. Looking into the industrial structure in 2017, the service sector was the highest contributor, with over 42.7% of the GDP, followed by industry and construction (32.5%); in turn, the manufacturing and processing and agriculture, forestry and fishery sectors accounted for 15.3% and 14.7%, respectively [32]. From an export perspective, recently, Vietnam has driven its industrial growth, with a large share of phones and component commodities being its top exports (45.1 billion USD in 2017); in parallel, textiles, electronics, computers, and component ingredients were also substantially exported. However, these industrial advancements have brought Vietnam new challenges to deal with the large amount of materials required for the manufacturing and processing industry (91.4% of the import turnover in 2017) [26,27,28,29,30,31].
2.2. Resource Consumption Patterns
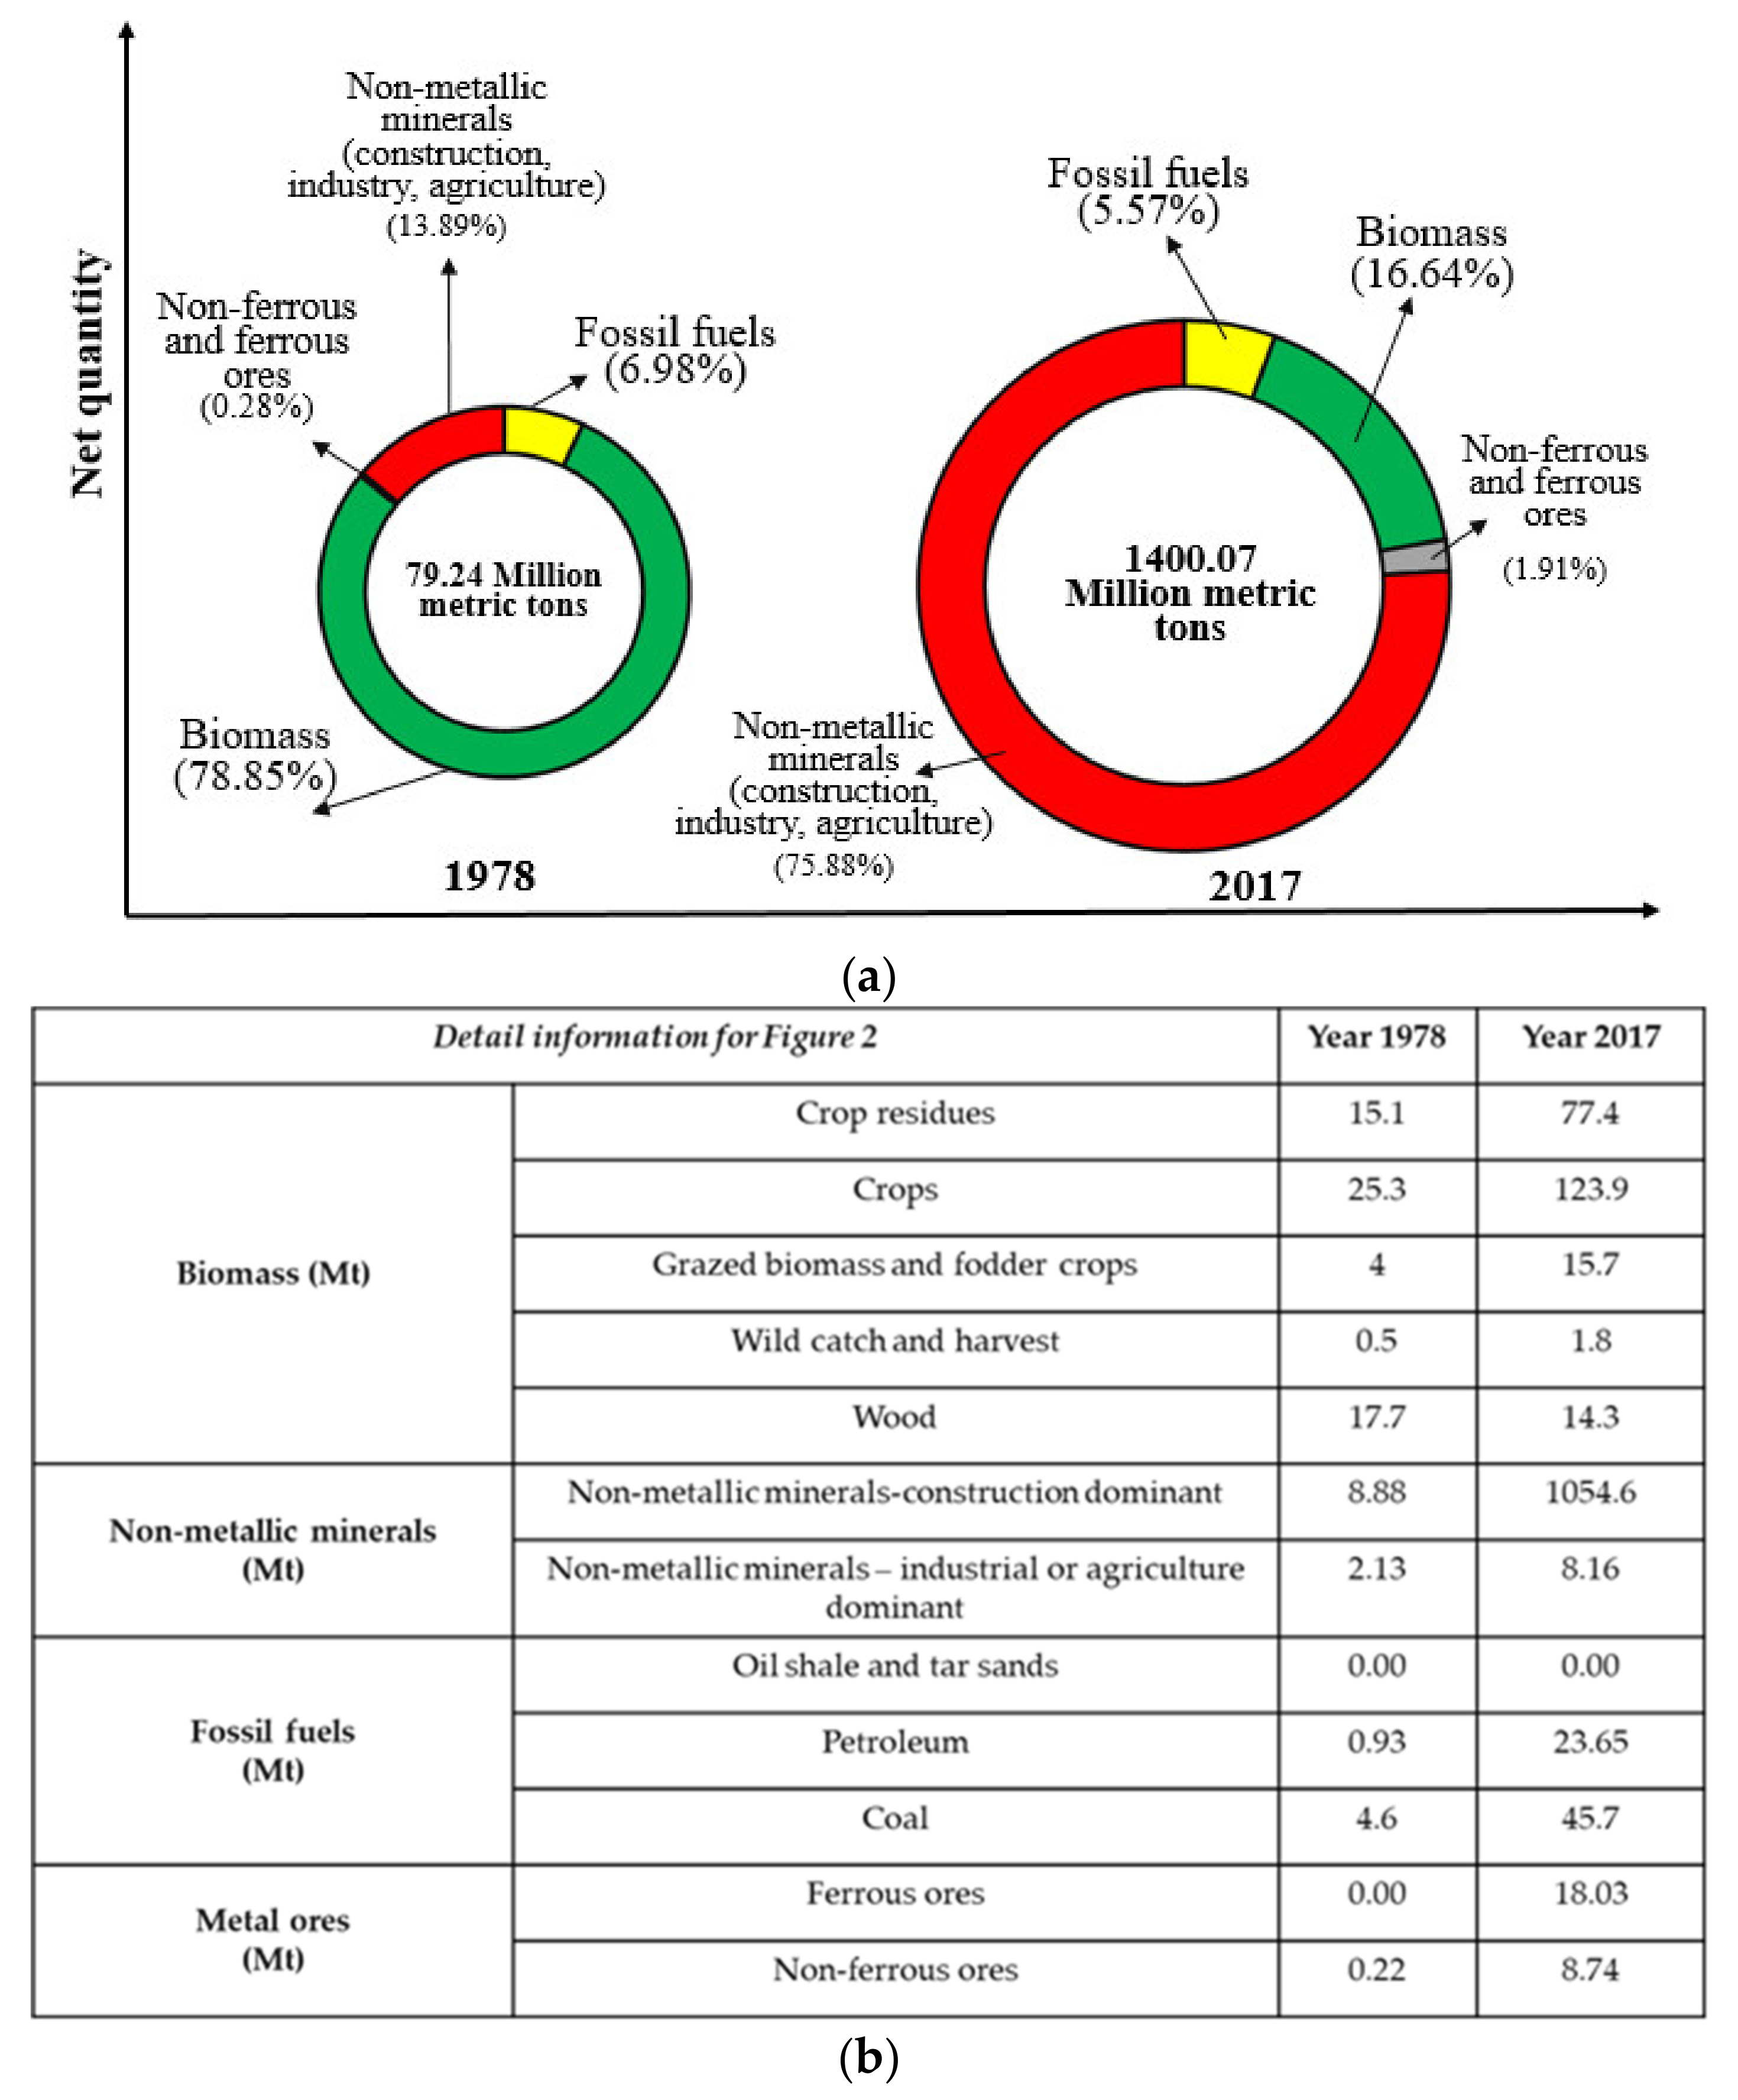
The domestic material consumption (DMC) by material type from 1978 and 2017 in Vietnam (Figure 2) clearly confirms the fact that resource consumption increases steadily with the level of economic development [1]. As shown in the figure, the total DMC was increased over 17.6 times from 79.24 Mt in 1978 to 1400.07 Mt in 2017, while the composition was totally changed, which represent rapid economic development, shifting from a centrally planned economy to a new, more open market economy with industrial advancement, urbanization, and enhanced living standard during last four decades [33].

Figure 2.
(a) Resource consumption (DMC) by material type during 1978–2017 (proportional donut size to the value of DMC; DMC values are in million metric tons), (b) detail information for each material type in 1978 and 2017.
In detail, non-metallic mineral (construction, industry, and agriculture) consumption was sharply increased from 13.9% to 75.9% in the total DMC during 1978–2017. In the non-metallic mineral category, construction material was dominant and increased 119 times from 8.88 Mt (1978) to 1054.6 Mt (2017), which is translated to be due to the infrastructure construction for industrialization and urbanization. In contrast, biomass consumption in total DMC increased ~4 times from 62.6 Mt (1978) to 233.1 Mt (2017), while the share sharply plummeted from 78.9% to 16.6%, which was due to the overwhelming increase of other materials. These material consumption transition trends are in line with this country’s policy of transforming the agricultural economy into an industrialized and modernized economy [34].
Coming to fossil fuels, although the share in DMC decreased from 7.0% in 1978 to 5.6% in 2017, the total amount of fossil fuel consumption increased 12.5 times from 5.53 Mt in 1978 to 69.36 Mt. For metal ores, the share in DMC increased from 0.3% (1978) to 1.9% (2017), while the mass increased 121.7 times from 0.22 Mt (1978) to 26.77 Mt (2017).
Considering the material consumption trends shown in Figure 2, consumption of construction material, fossil fuels, biomass, and metal ore in Vietnam are expected to surge continuously, in line with economic growth, industrialization, urbanization, and improved living standards. However, if the domestic extraction of certain material resources is insufficient to meet DMC demand, resources must be imported from other countries, which can seriously impact the national exchequer and quality of economic growth [4]. Thus, informed resource management strategies and policies based on resource flow and productivity efficiency transition in Vietnam seem to be highly required.
2.3. Sustainable Development Polices and Challenges
Before the “Đổi Mới” period, Vietnam had not mentioned and paid no attention to policies related to sustainable development, because in that period, the task of reviving the economy after the wars was the most urgent task, in line with poverty reduction. It was not until the 2000s that the concepts of cleaner, eco-friendly, and efficient production and environmental conservation were rekindled through the first law on Environmental Protection issued in 2005. This is considered the first step to mark regulations and provisions from an environmental point of view; it also was the initial effort in the country’s legal framework to protect ecosystems and precious resources [35]. However, pollutants such as solid waste and wastewater continuously increased. CO2 emissions also sharply increased, approximately four times from 2000 to 2017. Hence, the relevant policies and strategies were formulated, such as the green industry in 2008, striving for green growth and encouraging environmentally responsible investment [25], and cleaner production and resource efficiency in 2009. The main purposes of these policies and strategies were to promote production efficiency and to reduce emissions in production processes. In addition, the sustainable development strategies during 2011–2020 not only focused on resources and the environment, but also protect national sovereignty through political, cultural, and social stability [36]. Among the sustainable development strategies, the eco-industrial park initiative for sustainable industrial zones from 2015 to 2019 [37] marks a major turning point in the awareness of resource efficiency, cleaner production, and industrial symbiosis in industrial activities, together with the community, to create sustainable industrial parks that are an integral part of a modern, environmentally friendly city.
However, economic development and environmental management have for long been treated separately in Vietnam, as in most developing countries [27]. Separate institutions, policies, budgets, and programs have been established to work with each objective alone. Thus, the challenge of sustainable development in Vietnam is integrating environmental management and economic development, which is based on knowledge of the economy-wide material flow and efficiency of the economic system.
2.4. Critical Discussion on Sustainability of Resource Use in Vietnam and Contribution of This Paper
According to the economic condition, resource utilization pattern, and sustainable policies released so far, there are several critical issues related to the sustainable use of resources in Vietnam; how an understanding of these challenges could be strengthened by this paper, we highlight the following:
- Regarded as a high-potential “world factory” after China, Vietnam presents similar resource consumption patterns as a typical fast-growing economy, such as an increase in primary resource use, particularly metals and non-metal minerals. It is a dilemma that many emerging economies has faced—how to better balance economic growth and more sustainable resource consumption. Therefore, an investigation from a transitional perspective and the identification of the key driving forces are critical.
- Sustainability pursues an equilibrium among the triple bottom line variables—social equity, economic efficiency, and environmental responsibility. Therefore, it is important to investigate both the technological and socioeconomic issues behind resource consumption.
- To some extent, sustainability is a way to balance the inputs (natural resources consumption), desired outputs (e.g., GDP, products, and services), and undesired outputs (wastes and pollutants, damage to ecosystems, etc.). Therefore, an indicator or approach could aid achieving such an equilibrium, being useful to identify the sustainability of resource utilization.
This paper expects to contribute to a better understanding on the above critical issues of the sustainable use of resources in Vietnam, as follows:
Firstly, in response to Points 1 and 2 above, by adopting a modified IPAT approach towards long time-series material flow data, we can investigate the various types of driving forces behind the resource consumption, from a transitional perspective. Particularly, with comparison to a typical economy in Asia, more insights are expected to be uncovered.
Secondly, in response to Point 3, a DEA approach offers an indicator and model to calculate and analyze the productivity and efficiency under resources inputs, expected outputs, and unexpected outputs. Therefore, the efficiency indicator derived from the DEA approach could be an important reference for further sustainable resource use in Vietnam.
To support the research, the methods, data applied, and critical findings are presented in the following sections.
3. Methods and Data
3.1. Methodological Framework
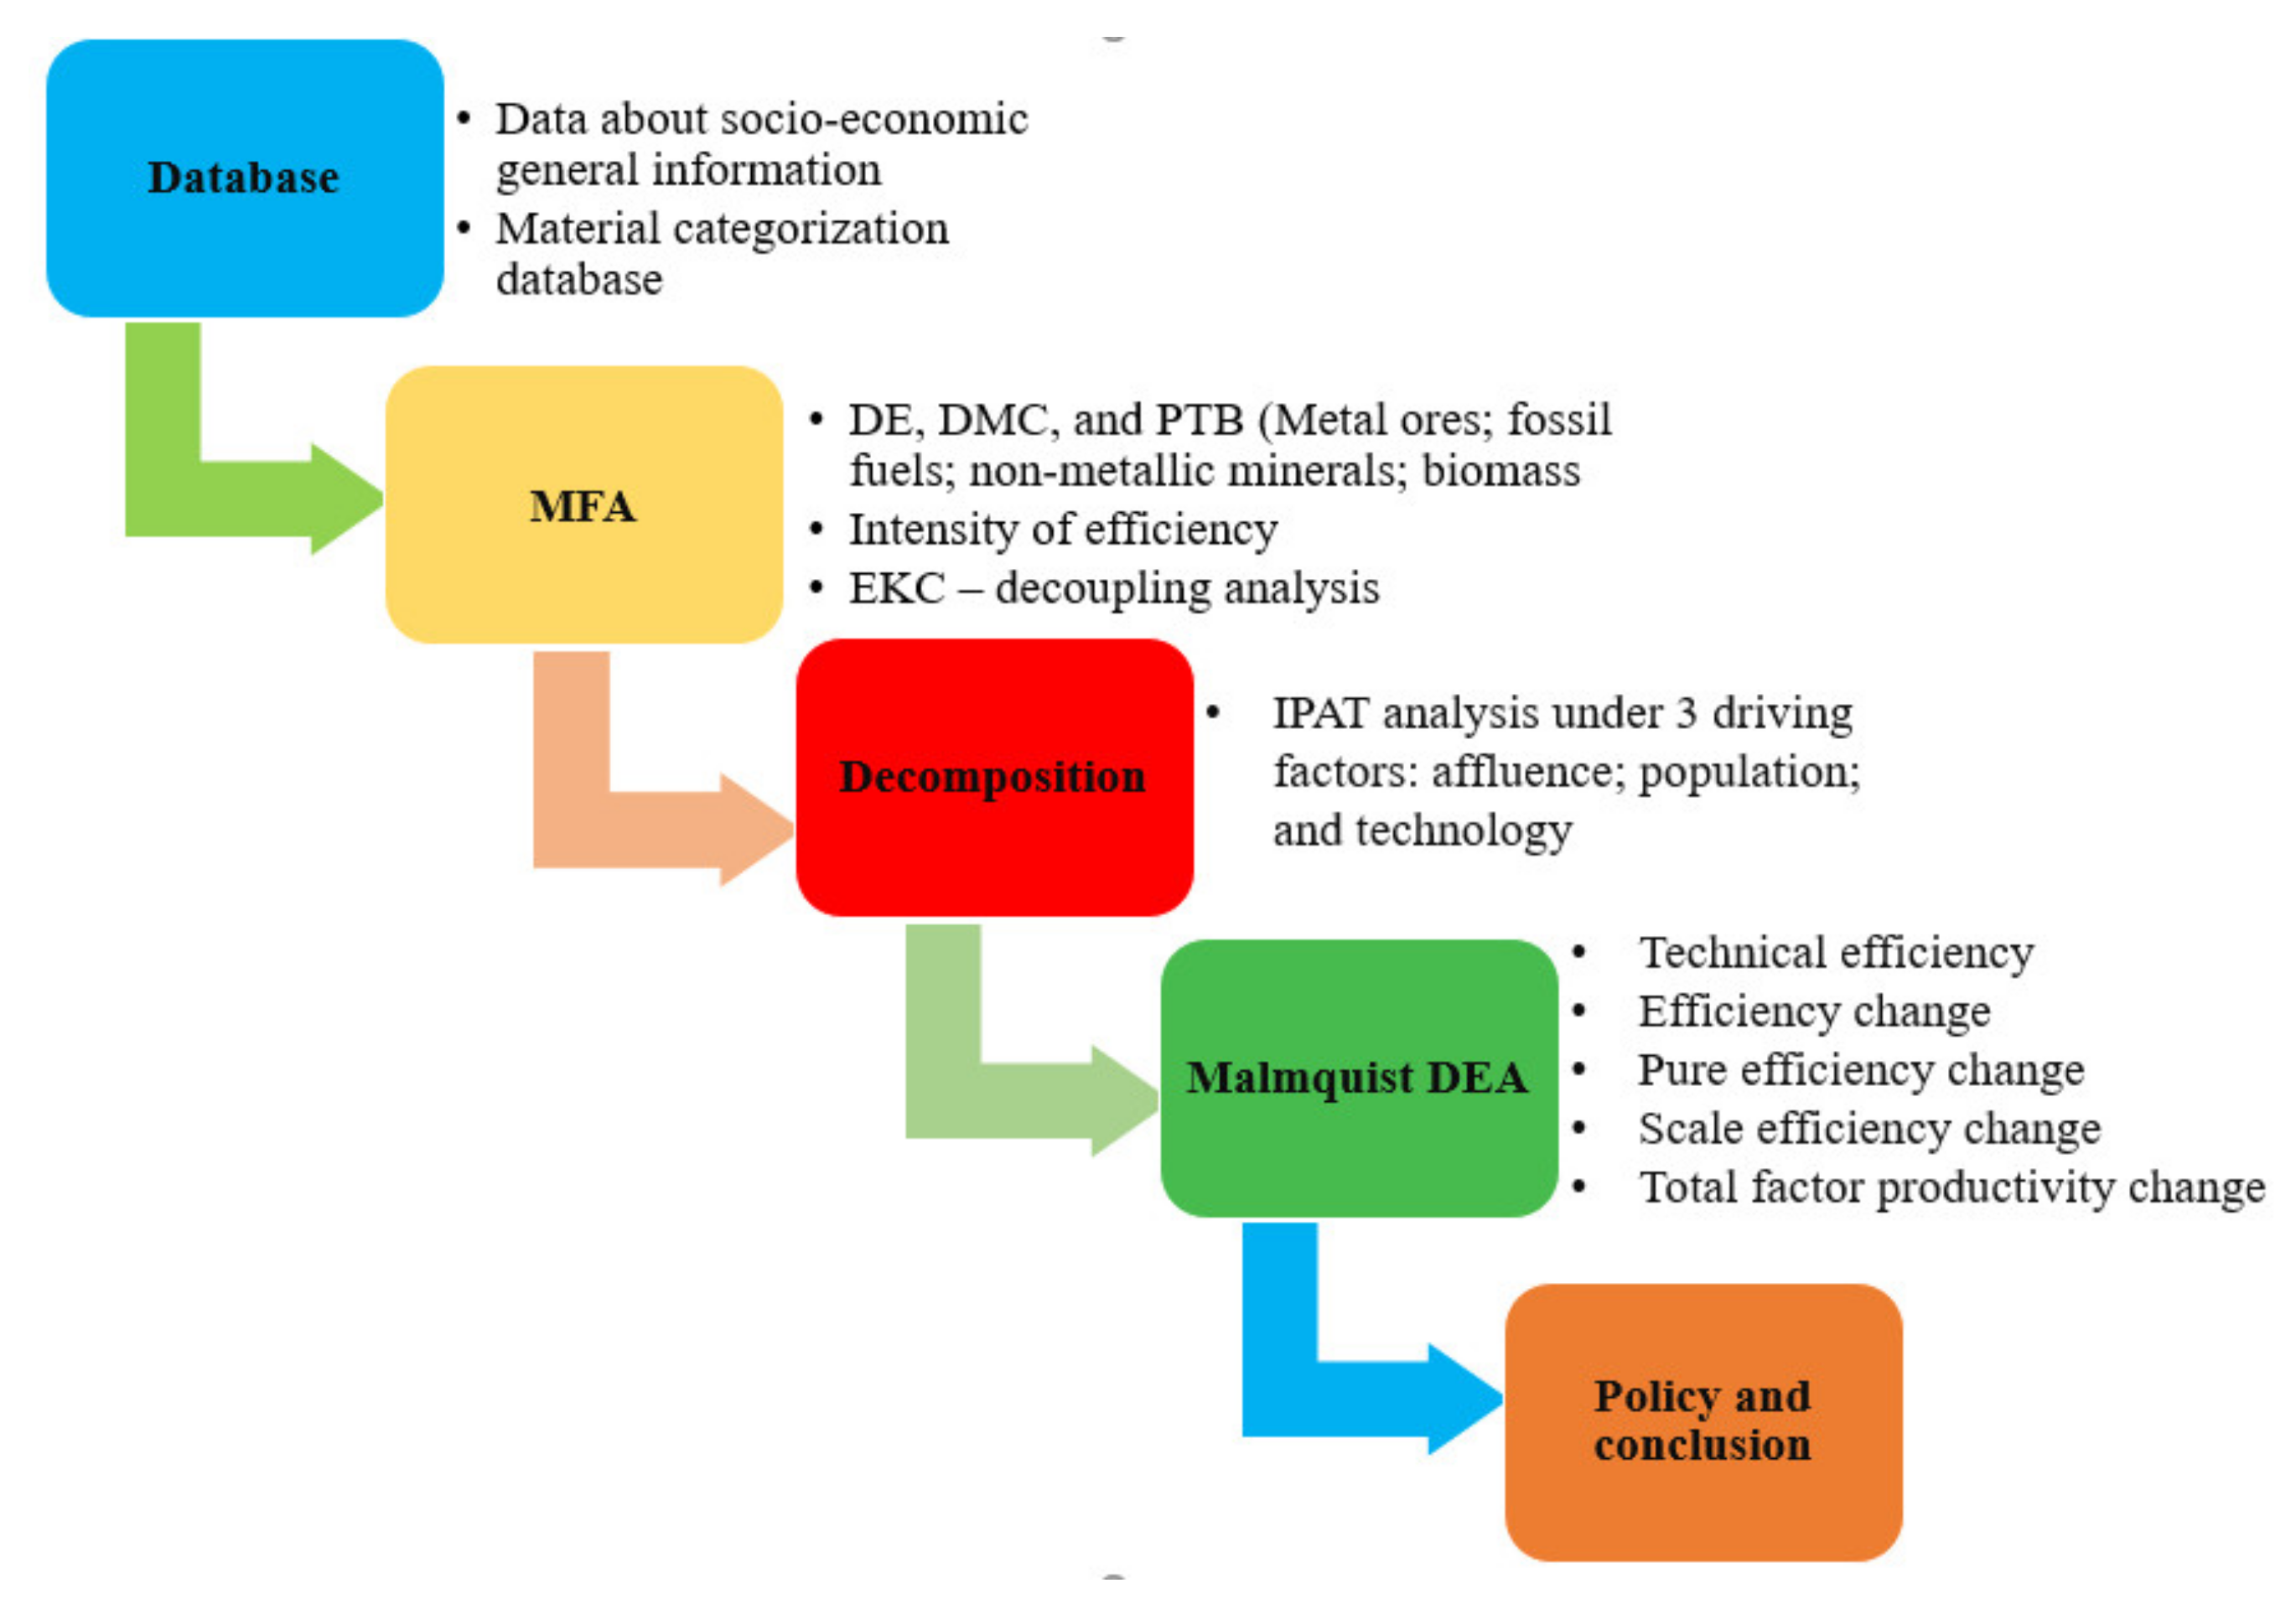
Figure 3 presents the research framework and detailed data used in this study. Thirteen material types were classified into four resource categories: metal ores, fossil fuels, non-metallic minerals, and biomass. The first step was to conduct Vietnam’s MFA based on the EW-MFA guidelines using the most recent long time-series data, covering four decades, from 1978 to 2017. The second step was to identify the drivers of resource consumption by a decomposition analysis and apply the EKC hypothesis. Finally, economic performance was analyzed by a DEA-based Malmquist productivity index approach (DEAM). As material metabolism depends on economic development stages, Vietnam was investigated in comparison with its top trade partners: China (middle-developing country), South Korea (primary developed country), and Japan (mature, industrialized, and developed country). The starting and ending point are based on the longest term and data availability.

Figure 3.
The research framework and data for the MFA and DEAM.
3.2. Material Flow Analysis
This paper mainly adhered to the EW-MFA framework and methodological guidelines in EUROSTAT [7,8,9]. The MFA indicators used in this study are summarized in Table 1. As shown, the indicators, such as DE, DMC, and PTB, are expressed in physical units (Mt), while the intensity and efficiency indicators, such as MI, EI, and RP, are in mixed units: DMC/capita and/or DMC/GDP, CO2/capita and/or CO2/GDP, and GDP/DMC, respectively. These MFA indicators are used to explore the dematerialization/decoupling trends and resource productivity [38,39]. In this study, GDP is used as an economic performance indicator and reported in United States dollar (USD) based on 2010 constant prices (or otherwise stated).

Table 1.
Material flow and efficiency indicators applied in this study.
3.3. IPAT Decomposition Analysis
IPAT decomposition analysis was done to further investigate the drivers of the resource consumption with the results of the MFA. IPAT is a basic equation postulating that environmental impacts are the multiplicative product of three socio-economic drivers of population (P), affluence (A), and technology (T) [40,41]. In this study, DMC was taken as the environmental impact (I) driven by the three major factors under the IPAT assumption, as given in Equation (1):
where population ‘P’ is the number of persons, affluence ‘A’ is GDP per capita, and technology ‘T’ is DMC per GDP. To quantitatively measure the contributions of the three drivers, the Log-Mean Divisia Index (LMDI) method [42] was used to decompose the change in DMC from ‘time = 0’ (the starting year) to ‘time = t’ (the ending year).
Based on the LMDI method, the change in DMC from ‘time = t0’ to ‘time = t’ can be expressed as the following equation:
where ΔP, ΔA, and ΔT describe the contribution of population, affluence, and material intensity, respectively.
ΔDMC = DMCt − DMCt0 = ΔP + ΔA + ΔT
3.4. Data Envelopment Analysis-Based Malmquist (DEAM) Approach
In this study, we first try to evaluate the productivity of the economic system applying an MFA indicator to a data envelopment analysis (DEA). DEA is a non-parametric mathematical approach to measure the efficiency of systems at a specific time. A data envelopment analysis-based Malmquist productivity index approach (MDEA) can measure the productivity efficiency index for organizational units over time [43]. The organizational units are commonly referred to as decision-making units (DMUs), which transform inputs into outputs [44,45,46]. DEA has been applied to many performance (efficiency) issues [43,47,48,49,50,51].
However, research on resource productivity efficiency changes considering economic growth and environmental impact on the national level, which can provide valuable insights on sustainable resource management policy, is very insufficient, especially in emerging and developing economies. Given this circumstance, this study was first to apply MFA indicators to the DEA-based Malmquist productivity index approach to assess the productivity and efficiency changes of Vietnam in comparison to its top trade partners in the different economic development stages.
The Malmquist productivity index (MPI) is calculated by Equations (6) and (7), to determine the efficiency change in DMU between periods t and t + 1 through a distance function produced by DEA [52].
At time t:
At time t + 1:
where I indicates the orientation(input or output orientation); C denotes the technology under constant return to scale; and denotes productivity change at the t and t+1 period; and and present the distance function of the input and output of the DMU by the period t benchmark technology at t and t + 1, respectively.
The Malmquist productivity index (, the geometric mean of the two MPI indices at time t and t + 1, measures the Total Factor Productivity (TFP) as follows:
If ) > 1, it denotes that TFP grows from the t to t + 1 period, and conversely, if ) < 1, then it declines. Equation (8) is further decomposed into Equation (9):
Under the assumption of CRS, technology change (TECHCH) and efficiency change (EFFCH) can be defined as follows:
Therefore,
TFPCH = TECHCH × EFFCH
Under the assumption of a variable returns scale (VRS), efficiency changes (EFFCH) are further separated into Equation (13). The first part of Equation (13) is the pure efficiency change (PECH, Equation (14)) and the second part is the scale efficiency change (SECH, Equation (15)).
Therefore, the TFP change can be written as follows:
In a traditional DEA, the inputs (such as energy, material, and capital) and outputs (such as GDP, value-added, and waste emissions) are generally used to find the efficiency frontier and efficiency score (distance function). In this study, we used material intensity (DMC per Mil $) and carbon intensity (CO2 per Mil $) (undesired output) as the inputs to be minimized and economic growth (GDP Mil $) as the output to calculate the productivity efficiency scores [4].
3.5. Data Collection
The general information for socio-economic and environmental issues was gathered from the World Bank [33,53] and the International Energy Agency’s database [54]. For material categorization, consumption statistics were taken from the International Resource Panel’s database—based on the EUROSTAT framework [7,8,9]. Furthermore, the official national reports and Statistical Yearbooks of Vietnam [23,55,56] were used to complement the missing data and ensure the reliability of the data. For the policy analysis, publicly available policy documents were accessed and analyzed.
4. Results and Discussion
4.1. Transition of Basic Material Indicators
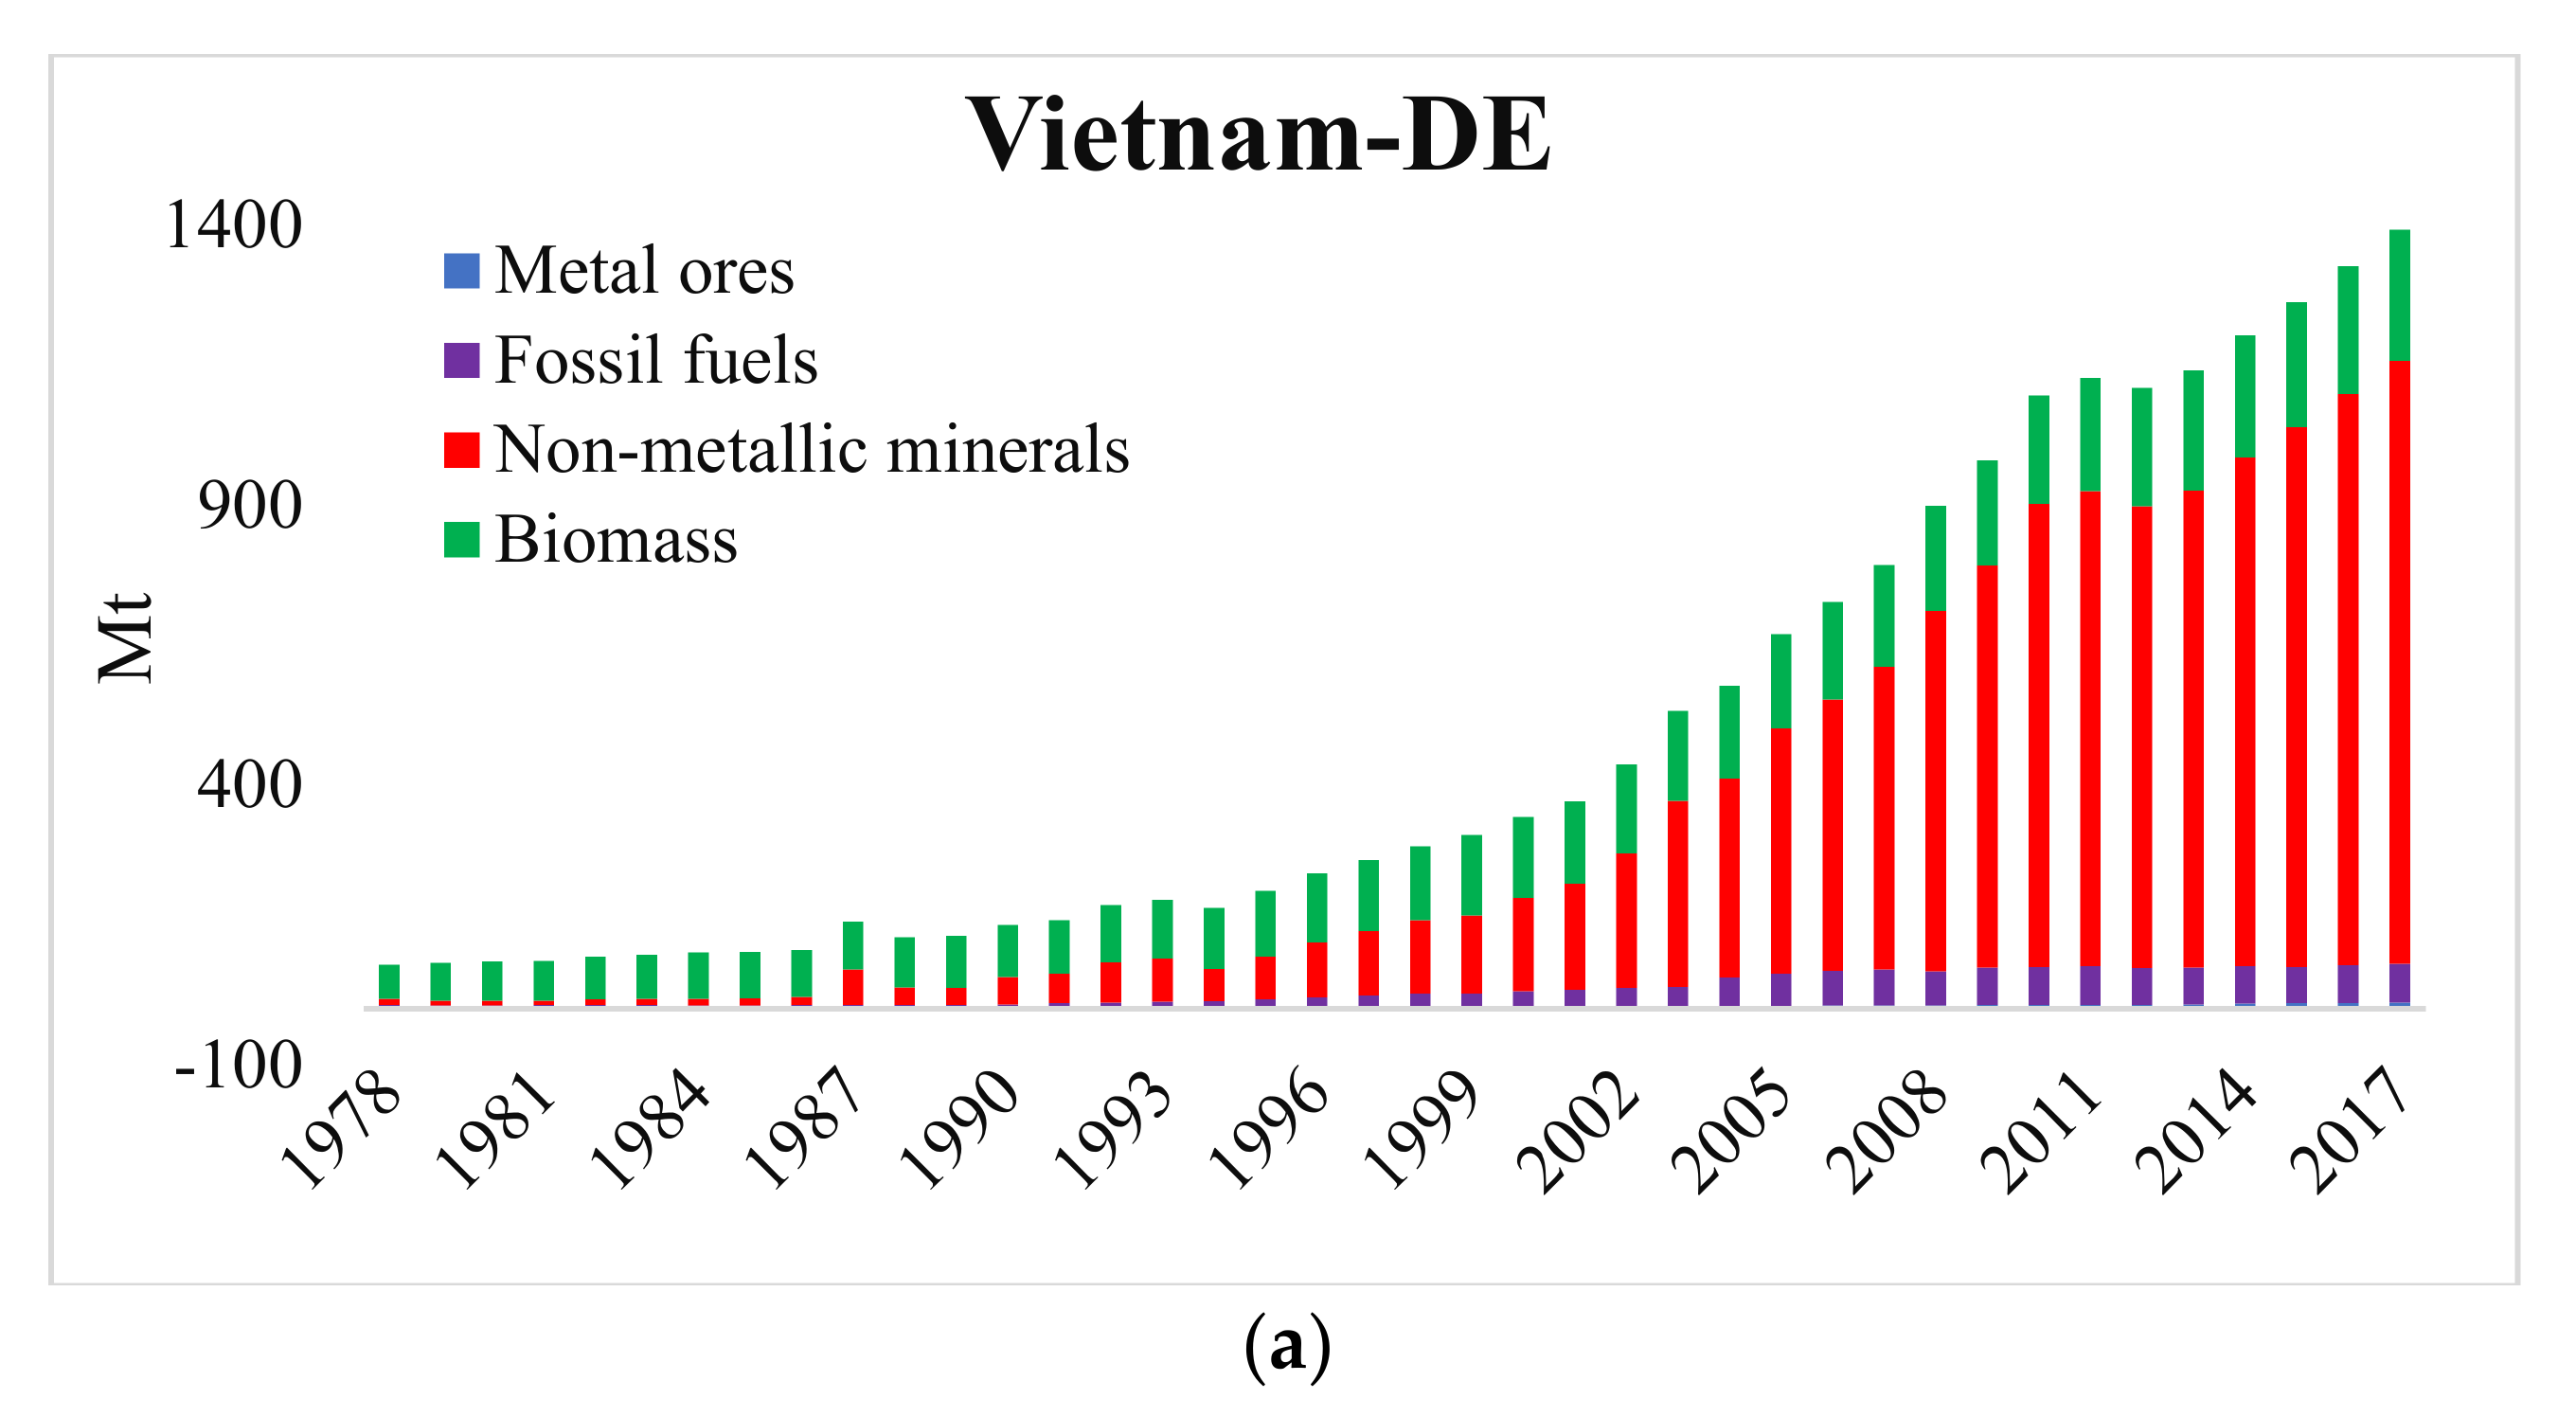
Basic materials are composed of “metal ores and industrial minerals”, “fossil fuels, “construction materials”, and “Biomass”. Figure 4a presents the per capita domestic basic materials extraction for Vietnam, while the domestic material consumption and physical trade balance results are exhibited in Figure 4b,c, respectively, for the period 1978–2017.


Figure 4.
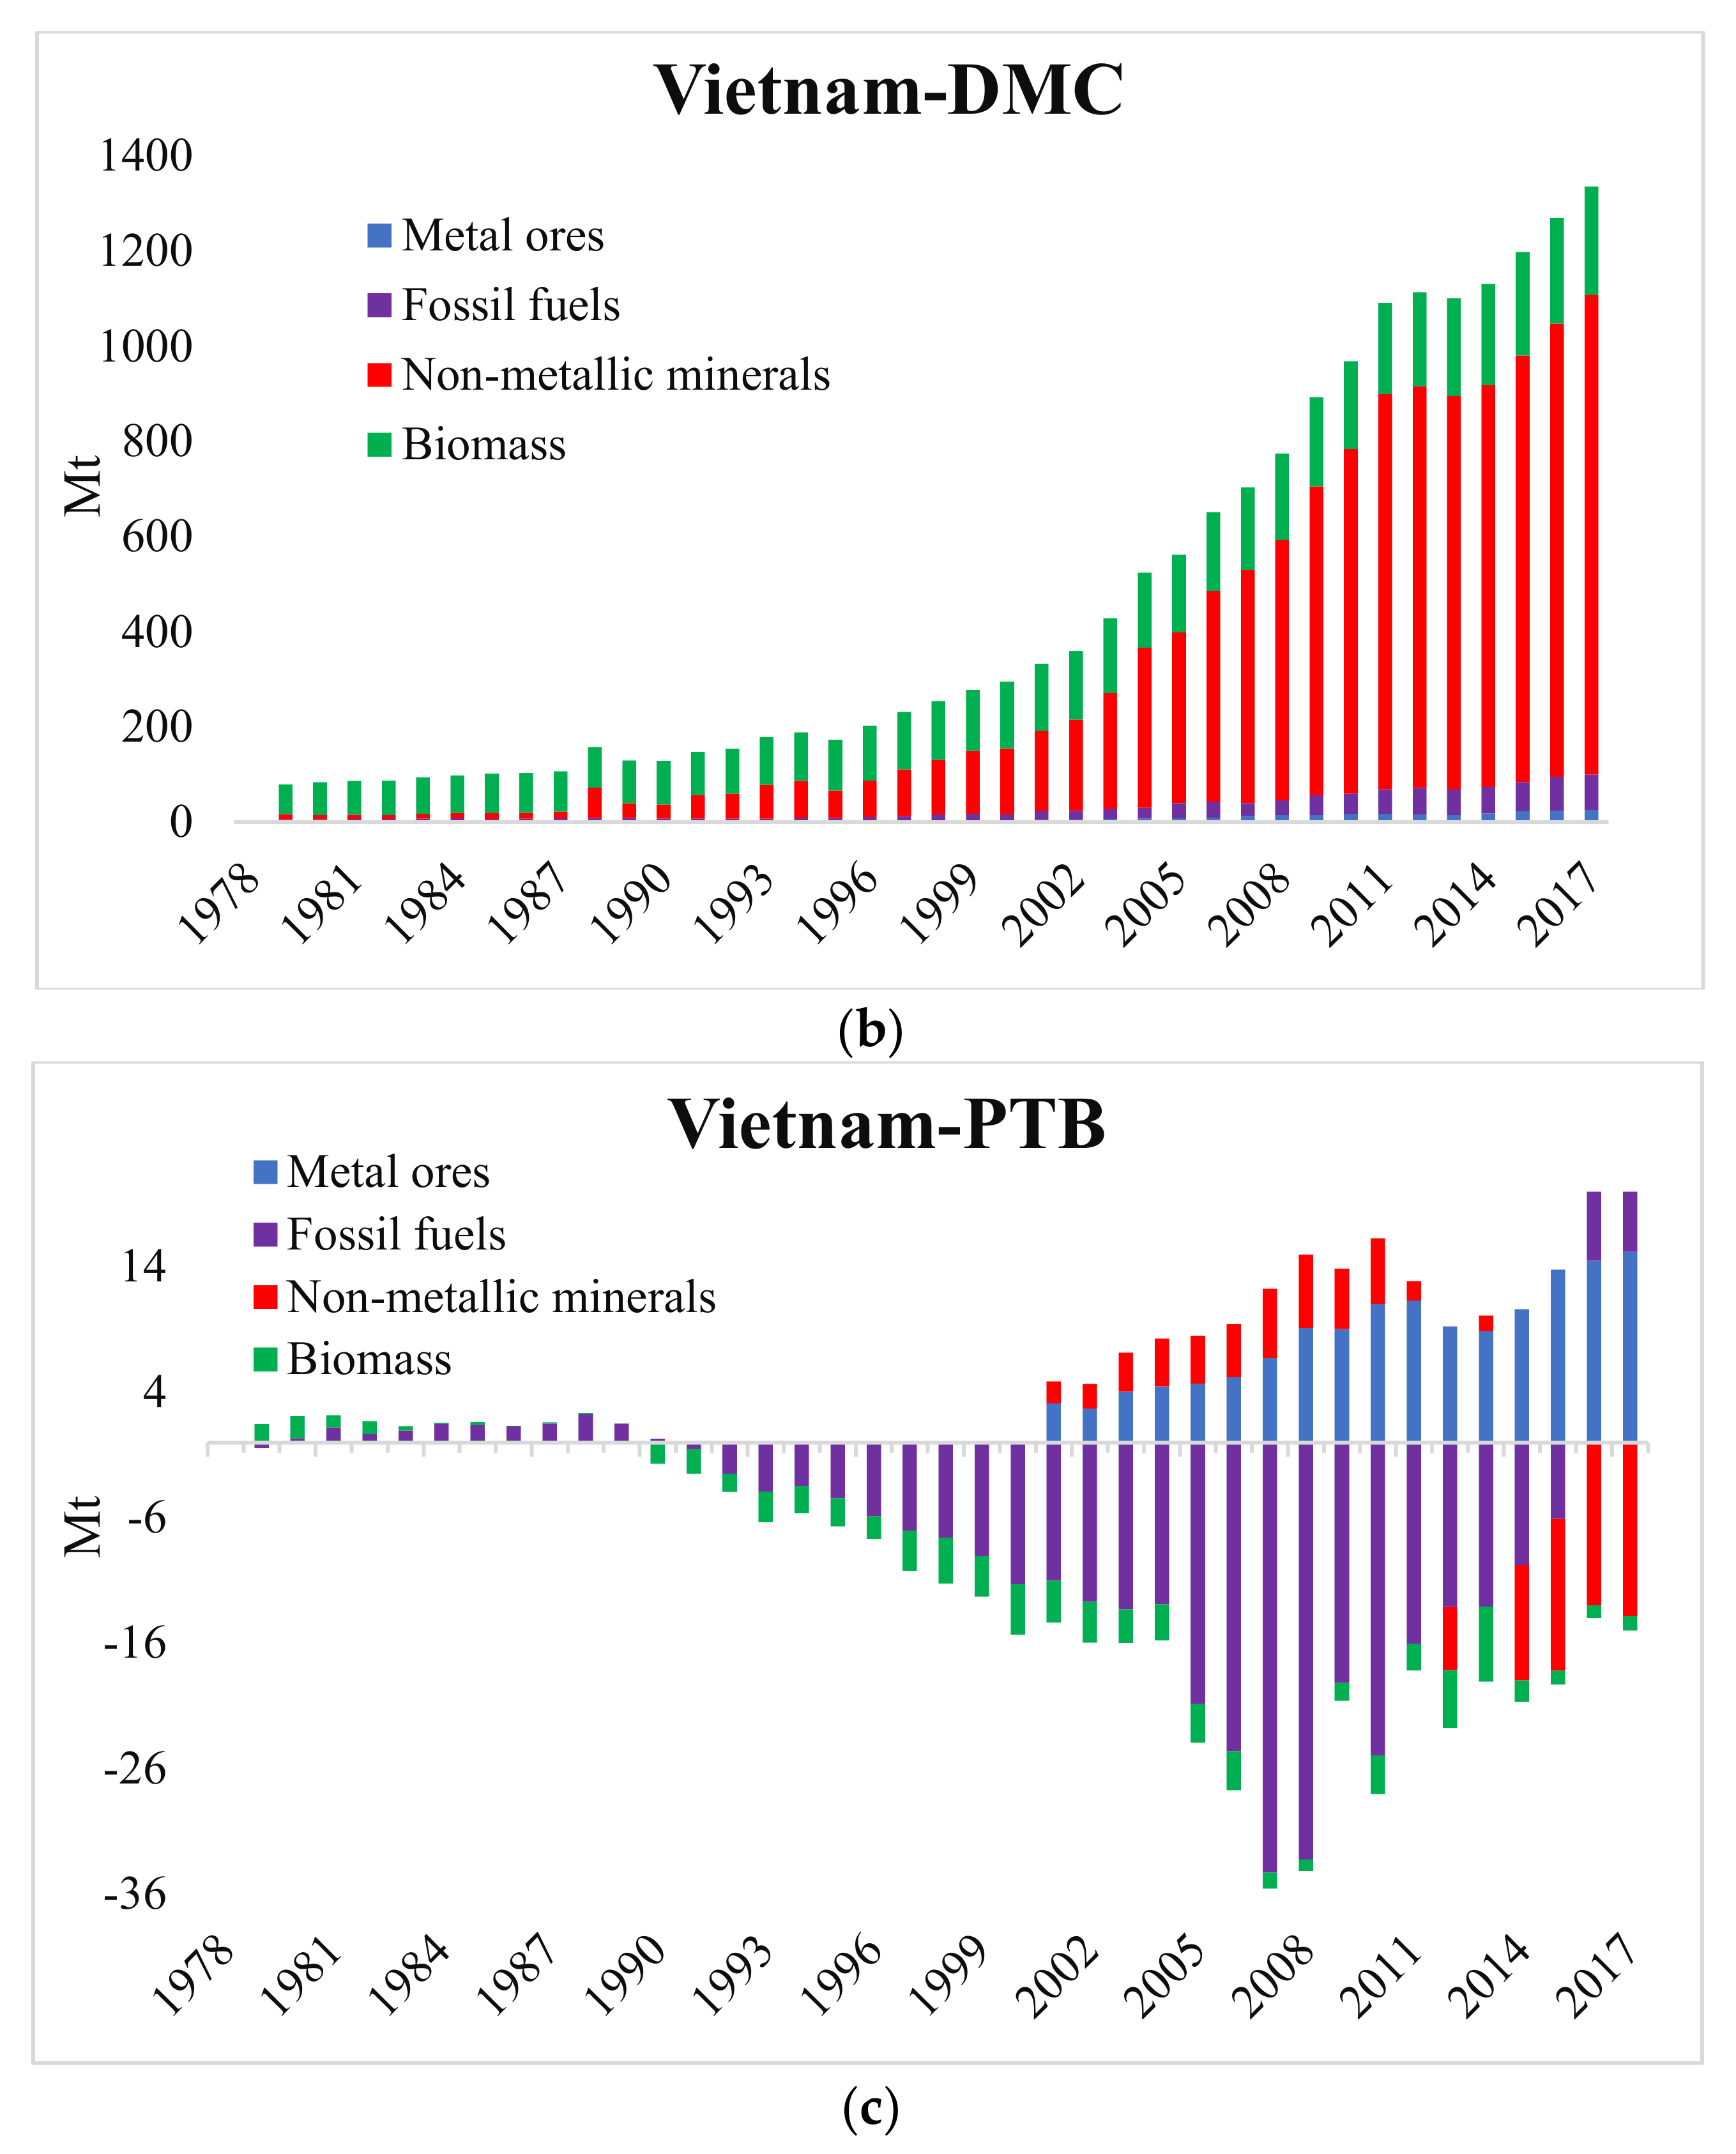
(a) Domestic extraction (DE), (b) domestic material consumption (DMC), and (c) physical trade balance (PTB) in Vietnam during 1978–2017.
As shown in Figure 4a, the DE trend and share of each material type have shifted dramatically over the time. During the 40 years, the total DE in Vietnam has increased from 78.23 Mt to 1392.4 Mt, with a compound annual growth rate (CAGR) of 7.66%. In 1978, the non-metallic share was 11.01 Mt, accounting for 57% of the total DE, which increased dramatically and maintained the top position in total DE in 2017 with 91% (1077.47 Mt) of the total DE of 1181.44 Mt, in which the share of construction minerals in total DE increased significantly from 11.4% (8.87 Mt in 1978) to 76.9% (1071.1 Mt in 2017), indicating dominant extraction of construction-based materials. Thus, as of 2017, construction minerals were the most extracted resource domestically and had the highest growth during 1978–2017.
However, the share of biomass slightly but continuously increased (61 Mt in 1978 to 234.4 Mt in 2017). Similar to the trend in total share of biomass, the total fossil fuel share moderately increased in DE over the study period (6 Mt in 1978 to 69.7 Mt in 2017). This is mainly due to the overwhelming increase in the proportion of construction materials. Construction materials had been used as key resources to construct process plants (for industrialization) and large-scale urban infrastructure (for urbanization) during the last 40 years of economic growth. Meanwhile, as fossil fuels are essential energy resources, especially for the process of industrialization, urbanization, and improving living standard, fossil fuel extraction increased from 6.0 Mt in 1978 to 69.7 Mt in 2017, representing a nearly 10 times increase (Figure 4a).
Figure 4b presents the per capita domestic material consumption (DMC) in Vietnam from 1978 to 2017. Like the DE results, total DMC increased from 79.24 Mt in 1978 to 1400.7 Mt in 2017, with a CAGR of 10.6%, which is mainly due to rapid economic growth, industrialization, and urbanization progress. The DMC-to-DE ratio denotes resource consumption relative to locally mined or imported resources. Back in 1978, the DMC/DE ratio was around 1.0 and the ratio was maintained until 2017, indicating a relative independence on imported resources in Vietnam. As of 2017, this ratio of metal ores and fossil fuels were higher than 1, 2.5 and 1.1, respectively, indicating that the total amount of imports of those materials was substantial due to DE shortage. The growing reliance on imported resources is emerging as a new challenge to economic development in Vietnam in consideration of the dynamics of future global resource supply chains, resource price fluctuations, and potential competition among importing–trading countries.
Figure 4c shows the PTB trend in Vietnam during 1978–2017, which provide critical insights into the net resource flows to and from an economy with a positive PTB, indicating a net resource import and vice versa [4]. As shown in this figure, there are three interesting phases: 1978–1988, 1989–1999, and 2000–2017. During 1978–1988, social reconstruction and development were the primary national agenda, overcoming the consequences of war. Therefore, at this time, the required raw materials and resources were prioritized to be imported to meet the essential needs of the country. However, Vietnam’s net resource import remained relatively low and only increased from 1.0 Mt to 1.5 Mt, with mostly fossil fuel imports (1.5 Mt). From 1989 to 1999, Vietnam’s exports of natural resources were larger than its imports and economic development was based on the low price the raw material exports. Fossil fuel exports sharply increased, 25.6 times, from 0.52 Mt to 13.32 Mt, while biomass was exported at around 2 to 3 Mt each year during this phase.
In the period 2000–2017, the dynamics of the import and export of raw materials were clearly observed. Vietnam’s fossil fuel exports grown significantly, reaching a peak (34.3 million tons) in 2006, then falling sharply until 2014, when Vietnam started importing fossil fuels, due to continuously increased domestic demand. As for metal ores, during this period, imports of this resource have increased continuously over 9 times from 1.74 Mt in 2000 to 15.94 Mt in 2017, to meet the demands from industrial activities. Biomass was imported during 2000–2009 and exported from 2011. As for metallic ores, imports were larger than exports to support infrastructure development of the industrial sector and urban area during 2000–2017. Non-metallic minerals have gradually been extracted and have become sone of the main resources exported in this country, increasing approximately 3 times during 2010–2017.
Overall, Vietnam’s net resource trade in 1989 equaled −1.4 Mt, with exported biomass at 1.8 Mt and imported fossil fuels at 0.29 Mt. As of 2014, its net resource export was 5.5 Mt, with exports of non-metallic minerals (12.1 Mt), fossil fuels (6.1 Mt), biomass (1.1 Mt), and imports of metal ores (13.8 Mt). The situation has changed since 2014, and by 2017, Vietnam’s net resource trade equaled 8.3 Mt, comprising exports of non-metallic minerals (14.7 Mt) and biomass (1.1 Mt), while importing metal ores (15.9 Mt) and fossil fuels (8.4 Mt), indicating a shift in the industrial structure and economic development toward increased demand for imported energy resources and metallic ores. These dynamics of the PTB of resources are expected to continue for living standards enhancement, improved urban infrastructure, and rapid industrial development, indicating the rising vulnerability to global resource supply perturbations and price fluctuations [20].
4.2. Intensity and Efficiency Trends
Based on the basic material flow indicators, the intensity and efficiency trends of Vietnam and its top three trade partners, China, South Korea, and Japan, were investigated from 1978 to 2017 (Figure 5). In the figure, economic growth is represented by GDP per capita; resource productivity in DMC tons per capita; resource productivity in GDP per DMC; and environmental impact in CO2 per capita. As Vietnam is a fast-growing developing country, China an upper-middle-developing country, South Korea a primary developed country, and Japan a mature developed economy, they were selected as the top Vietnam trading partners at different stages of economic development to compare the material and efficiency indicators trends [10].
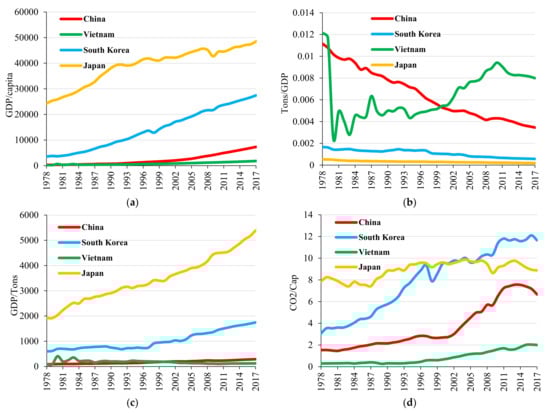
Figure 5.
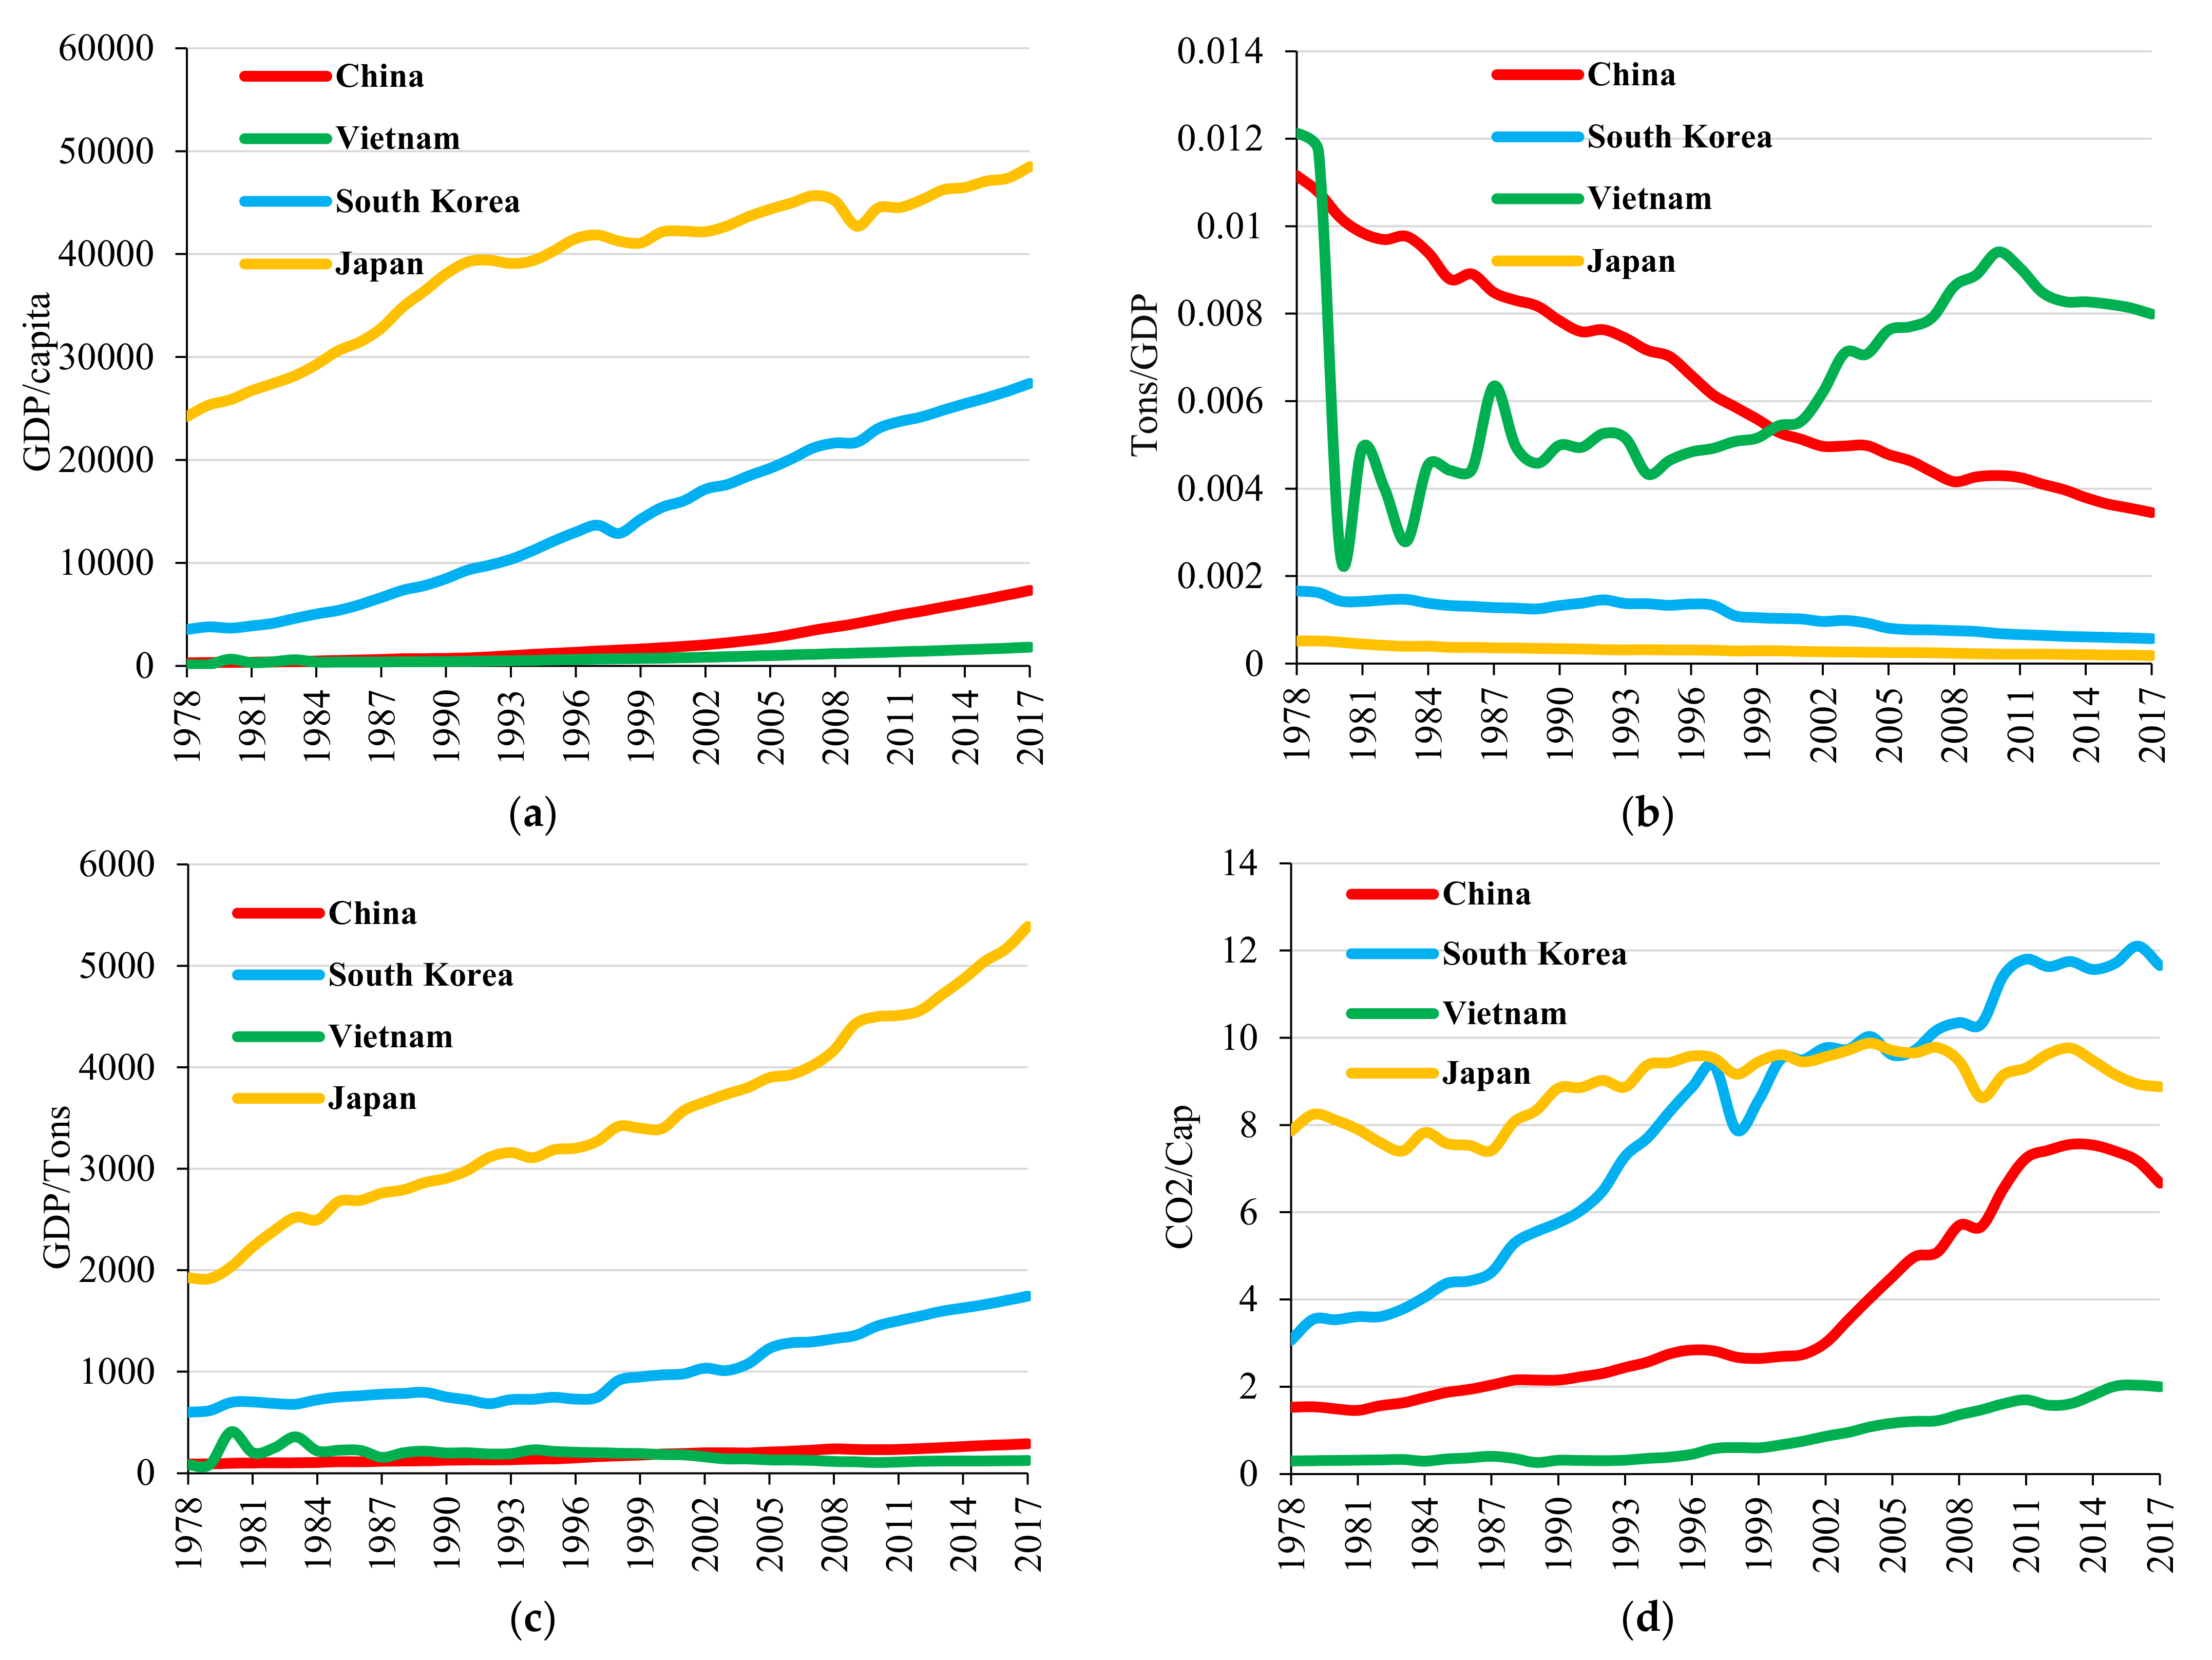
Characteristics of economic growth, resource consumption, and emissions in Vietnam, China, South Korea, and Japan during 1978–2017 (GDP is in constant dollar prices of 2010): (a) economic growth (GDP/capita); (b) resource intensity (DMC/GDP); (c) resource productivity (GDP/DMC); and (d) environmental impacts (CO2 emissions/capita).
As for economic growth, GDP per capita continuously increased—2.0, 4.9, 7.7, and 23.9 times—in Japan, Vietnam, Korea, and China, respectively, during 4 decades (Figure 5a), However, material intensity (DMC per GDP) was reduced by 69, 65.5, and 64% in Japan, Korea, and China, respectively (Figure 5b), while in Vietnam, this trend has fluctuated; decreased 64.25% from 0.012 tons/USD in 1978 to 0.0043 tons/USD in 1994, then increased 84% to 0.07991 tons/USD in 2017. This shows that, despite some improvement, Vietnam remains highly material intensive as a whole and results in the lowest productivity.
Resource and material productivity is expressed as the economic output per unit of total DMC, which is an important indicator to compute the economic contribution per unit of material consumed. The material productivity presented in Figure 5c shows that material productivity has increased 2.8, 3.2, and 2.9 times in Japan, China, and South Korea, respectively, while increasing 1.5 times from 82.4 USD/ton to 125 USD/ton in Vietnam during that time. As of 2017, the material productivity of Japan, Korea, and China are 40, 14, and 2.3 times higher than that of Vietnam.
As for carbon intensity, ton CO2 per capita has continuously increased, 6.75 times, in Vietnam during 1978–2017, as illustrated in Figure 5d, while Japan, South Korea, and China rose by 1.12, 3.8, and 4.36 times, respectively, during that time. Though the increasing rates of carbon intensity of Japan, South Korea, and China are lower than Vietnam, those of South Korea, Japan, and China were 11.66, 8,88, and 6.69 tons CO2 per capita, respectively, in 2017. Thus, they must strengthen their climate countermeasures, through a circular economy, green growth, and a sustainable development policy drive, and its implementation. However, in Vietnam, though the carbon intensity is very low, it is continuously increasing. Therefore, for Vietnam it is highly recommended to make a transition towards low-carbon economic growth by significant improvements in energy efficiency and emission intensity, such as through a national energy-mix restructuring [22].
In summary, the intensity and efficiency trends confirm that the resource consumption and economic development patterns are different based on each country’s situation, such as its resource condition, economic development stage, industrial structure, and position in the global supply chain [57,58]. Thus, a country-specific MFA is essential to achieve critical policy insights into sustainable resource management for the target country [3,15].
4.3. Coupling Trends in and Drivers of Resource Consumption
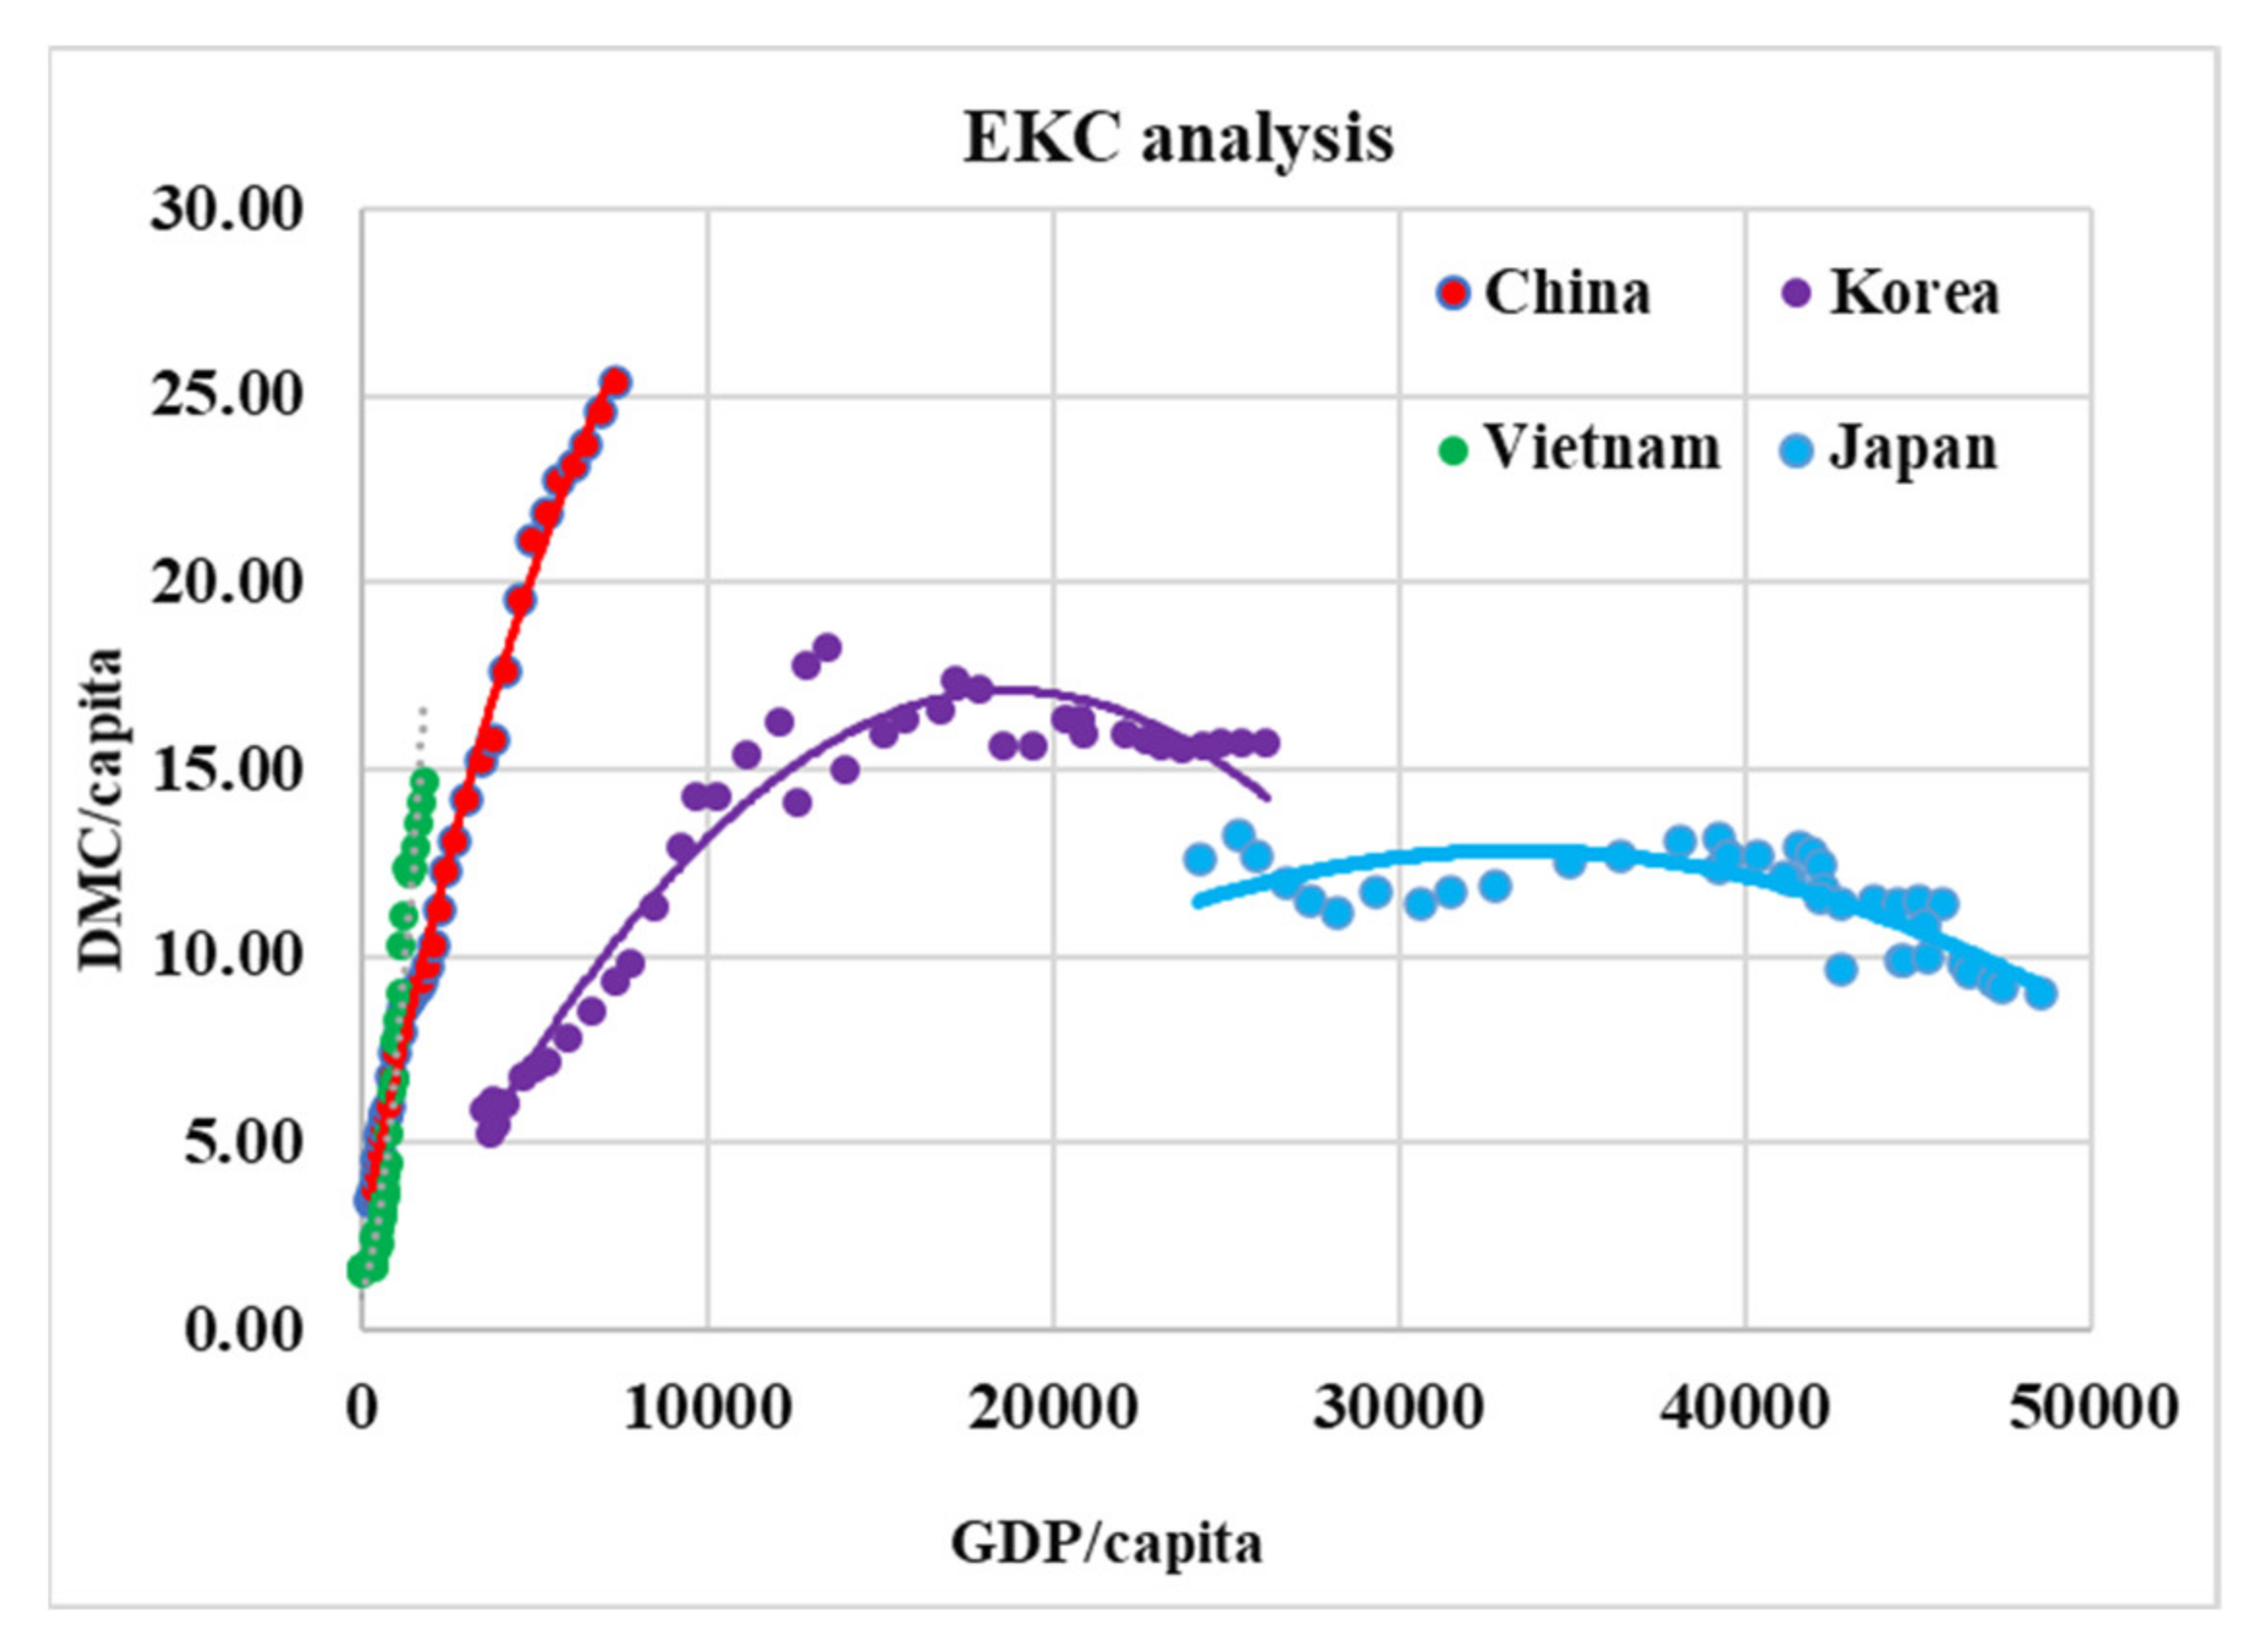
With the material intensity and economic indicators calculated from the MFA, decoupling trends were analyzed by the Environmental Kuznets Curve approach. As shown in Figure 6, Vietnam and China had been in the surging upswing stage, in both GDP per capita and resource consumption, being in the first half of the inverse “U” curve and presenting a strong coupling trend between DMC per capita and economic growth during the last four decades. However, Japan had shown a transitional trend and reached the inversion point in 1987 with a per capita GDP of ~32,000 USD/capita, which was followed by South Korea, which reached the EKC inversion point with a per capita GDP of ~20,000 USD/capita in 2007. These two OECD countries clearly show the decoupling of material intensity from economic growth. This results clearly shows that China and Vietnam need to strengthen resource efficiency, green growth, and circular economy policy and implement strong actions to enhance material intensity and material productivity. Although Vietnam is still far behind reaching the EKC inversion point, considering the contribution of the technical factor on material consumption, they are strongly recommended to strengthen technical innovation (negative driver) customized to local conditions to decouple resource consumption from economic growth.

Figure 6.
EKC curve of Vietnam in comparison with Japan, South Korea, and China during 1978–2017.
To dive deep into investigating the drivers of resource consumption, ΔDMC were decomposed into their driving forces every 10 and 5 years using the IPAT framework, and the results are presented in Table 2 for Vietnam and comparative countries. In the whole studied period, population and economic growth factors negatively contribute to a decline material use, while technological advancement positively reduces resource use and environmental issues. Inevitably, a blooming population and industrial activities always entail essential needs for living and production, since contributions of both factors predominantly affect material and environmental issues: a 3%, 112%, and 113% share of the population indicator on pushing material consumption and emissions in Japan, South Korea, and China over the four studied decades, respectively (Table 2). As for the affluence perspective, during 1978–2017, its contribution accounted for 24%, 691%, and 134% in Japan, South Korea, and China, respectively. In contrast, innovative solutions are known as a strong driver in down turning the resource and environmental problems in South Korea (−703% contribution of the technological factor during 1978–2018), followed by China, where a −146% share of technical improvement was reported during the whole period, and at the same time, a −36% contribution of this driver in Japan.
Table 2.
Driving factors of material consumption in Vietnam under various intervals.
As shown, rising affluence (94%) and population (21%) are strong drivers of ΔDMC; only the technological factor helps reducing material consumption in Vietnam (−15%) during 1978–2017 (Table 2). In detail, the technology factor was the negative driver of ΔDMC and considerably slowed down the rise in material consumption (−196.85%) during 1978–1988, the first stage of economic institutional transition, while the affluence factor dramatically contributed to enhance resource consumption by 250.45%, followed by the population driver with 46.4%, respectively (Table 2). This phenomenon occurred during the hard time of war with Cambodia and China, when huge support from outside helped increase the affluence and technological drive during this period [59].
After this phase, Vietnam returned to a stable economic, social, and political status. It is easily observed through the three factors’ contributions in Table 2. Particularly, the next stage (1988–1998) shows that a significant setback in technology (6.48 %) has resulted in a loss of control over resource-use reduction. At the same time, the economy decreased significantly (69.53%) in a period of global hardship due to the economic crisis of 1998 [60]. The economic recovery in the following periods shows that the influence of economic development always has a direct impact on material consumption (Table 2). Since Vietnam’s GDP has grown at a relatively stable growth rate from 2008 to 2017, ΔDMC was 238.79 and 269.3 during 2008–2013 and 2013–2017, respectively. Affluence and population also contributed to the increased DMC in these periods. This DMC increase was essential for expansion of transport infrastructure, industries, business, and household buildings, resulting from the rapid urbanization and industrialization.
4.4. Productivity Efficiency Transition in Vietnam
In this study, DEAP2.1 software was used to assess the productivity efficiency transition by the DEA-based Malmquist productivity index (DEAM) model. The two inputs were material intensity (DMC per mil. US$) and CO2 intensity (CO2 per mil. US$), and the output was economic growth (GDP). This study selected the input-oriented constant return scale (CRS) as a parameter and measured the comprehensive technical efficiency of Vietnam, China, South Korea, and Japan from 1978 to 2017.
Table 3 shows the annual changes in the total factor productivity change (TFPCH) and its components for the four different countries that are at different stages of economic development: Vietnam, China, South Korea, and Japan. As shown, the average annual TFPCH was 1.097 and the TECHCH was 1.053; the EFFCH, PECH, and SECH were 1.042, 1.001, and 1.04, respectively (Table 3), which means that resource productivity has been continuously increased annually during the last four decades. In addition, the TECHCH and EFFCH indicators both contributed to improve the total efficiency in resource productivity and rising eco-efficiency in these countries. Paying attention to the slightly increasing scale efficiency growth rate during 1978–2017 of 0.1%, we note that material consumption has basically obtained the optimal consumption scale. The two decomposed components of EFFCH are PECH and SECH, in which both indexes have concurrently brought chronological contribution to renovate the EFFCH value.
Table 3.
Malmquist index summary of four countries from 1978 to 2017.
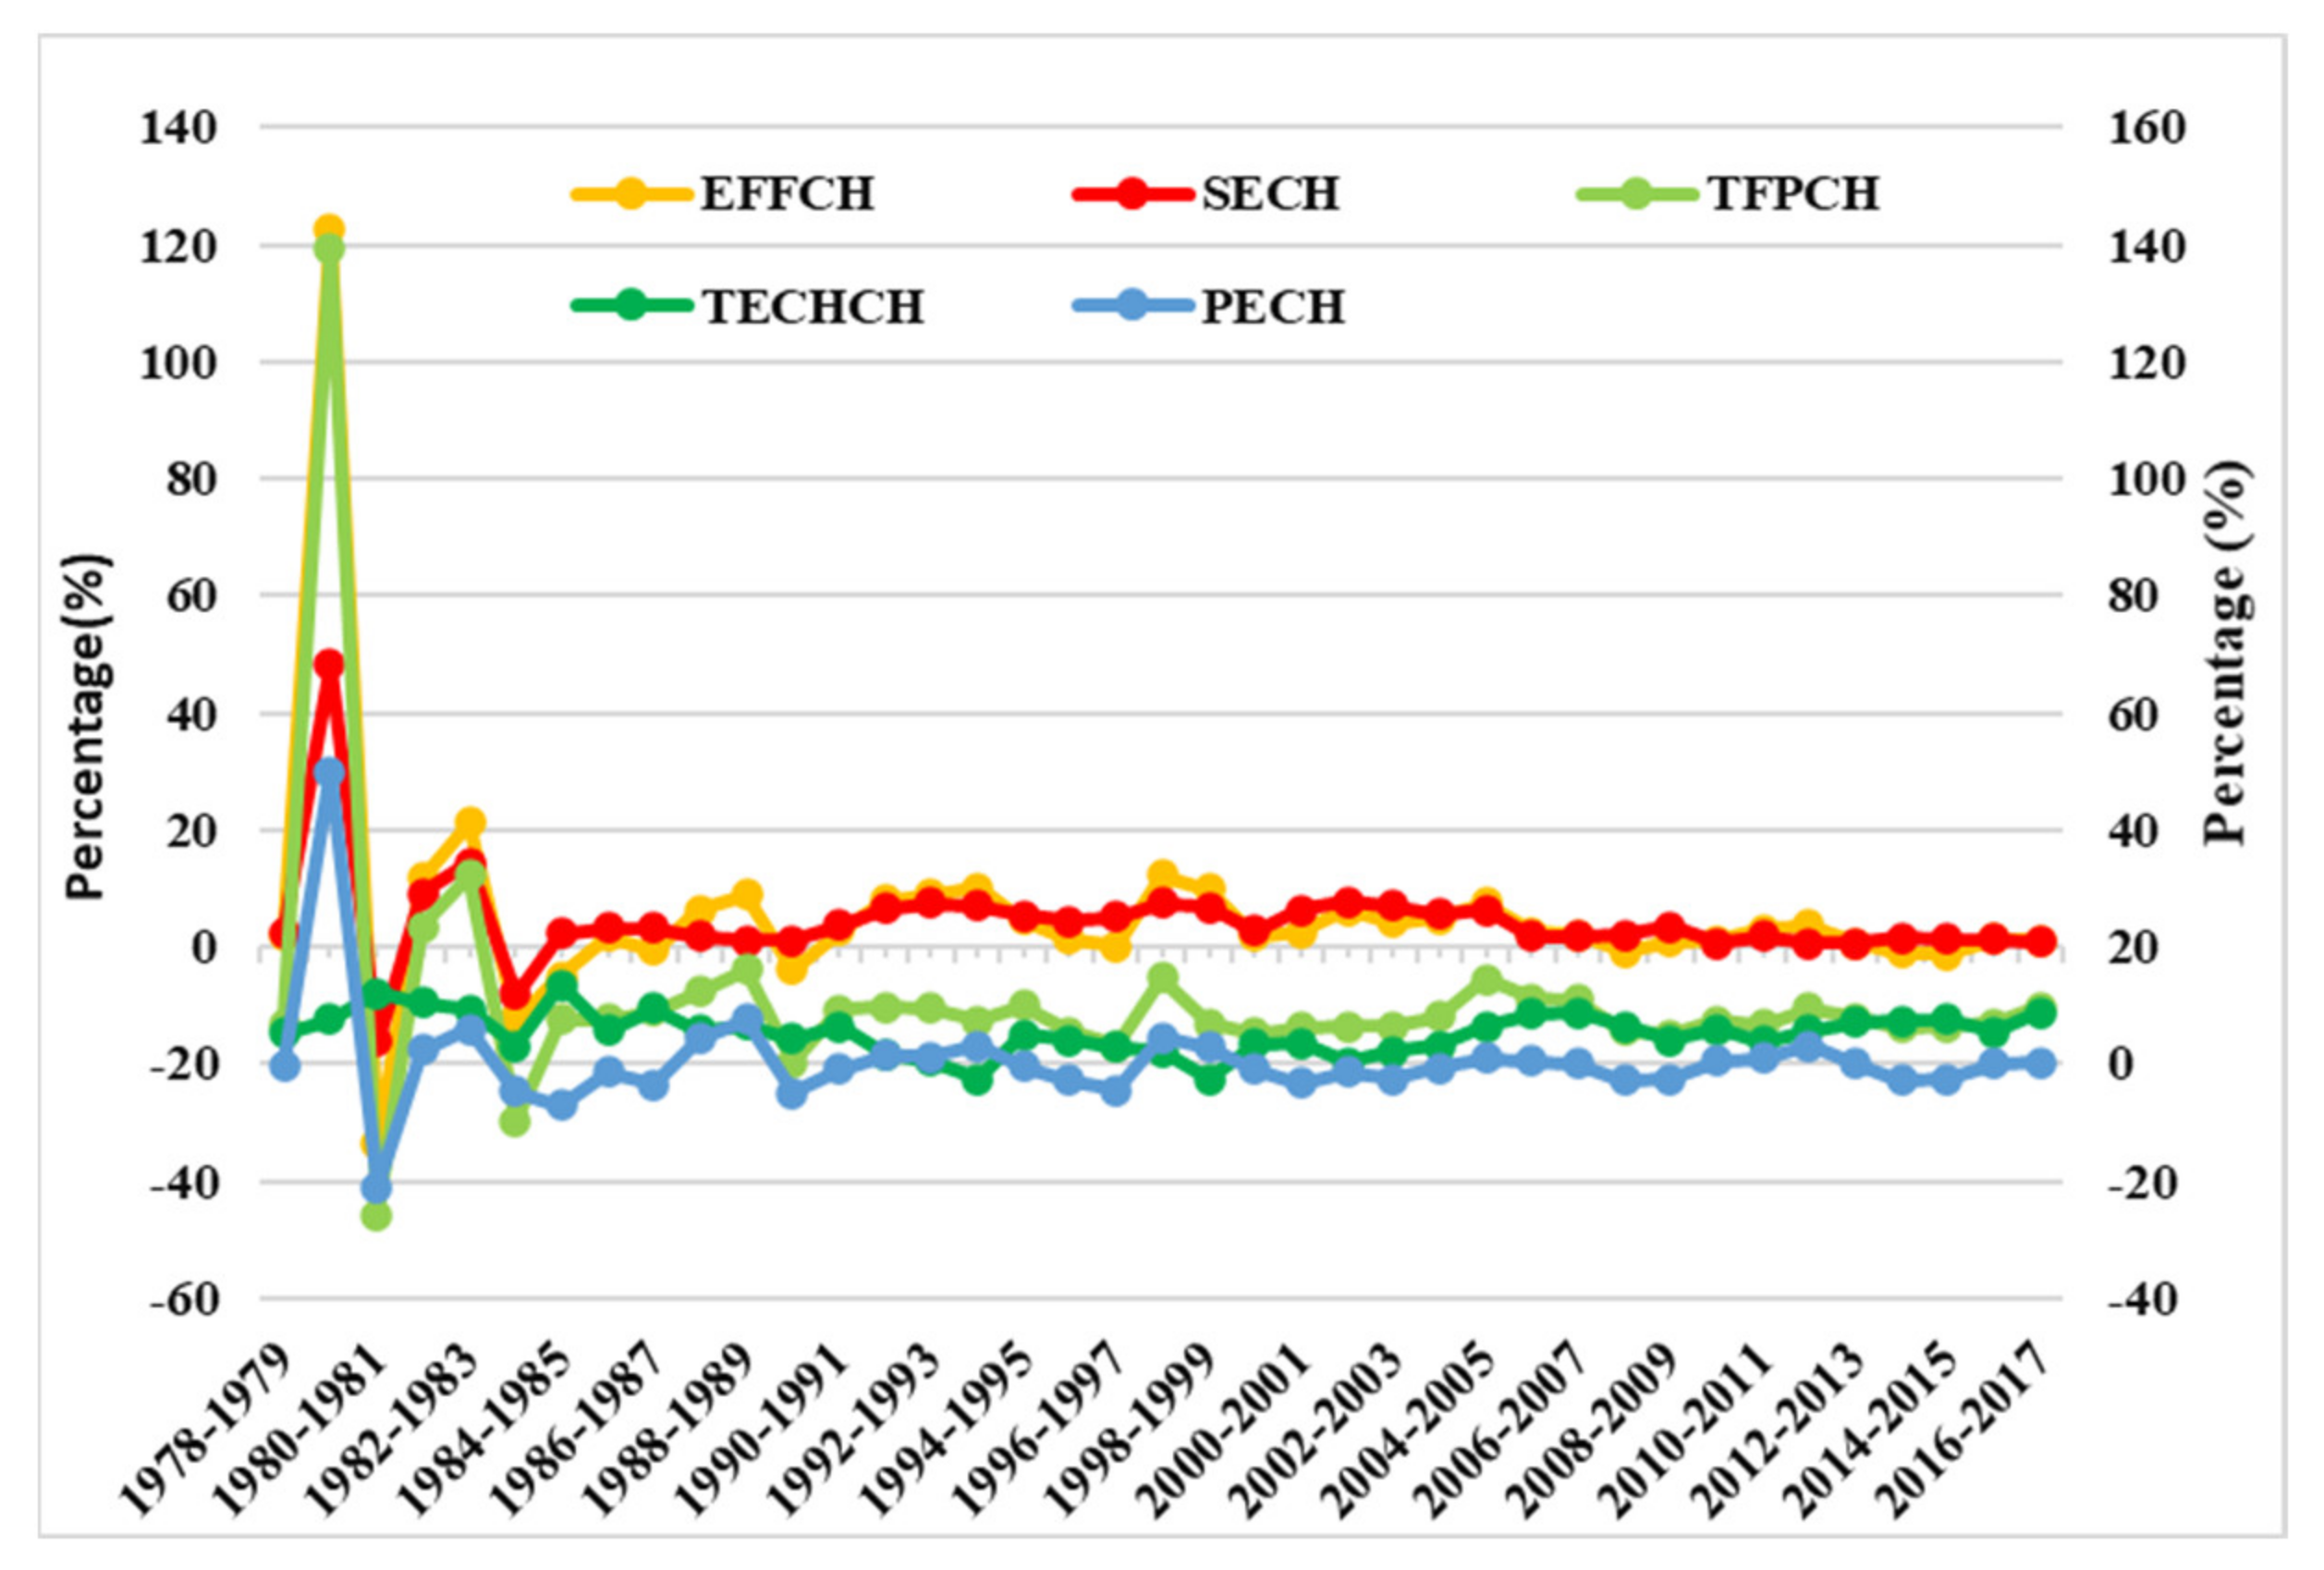
Under the annual change in these indexes, seen in Figure 7 some overarching trends have emerged. During 1978–1985, all indicators positively accelerated, with a maximum growth rate in the average TFPCH of 139.2% (1979–1980); 122.4% for EFFCH; and 48.3% and 50% for ECH and PECH, respectively. The dramatic improvement in these indexes may be the result of the 3rd industrial revolution globally [61]. However, this stage was also unstable because of the influence of the global economic crisis along with the collapse of socialism in many countries (notably the former Soviet Union) in the period 1998–1990. This can be seen as the main cause of the gradual decline of the indexes during that period [22,60]. This situation did not last long; it has been gradually improved since the 1990s due to the positive impact of the 4th industrial revolution. Therefore, the development of the indicators almost kept the status stable, or only slightly fluctuating [61]. The roles of technology, the political, and policy situation plays a key role in changing the situation of each country, even the world.
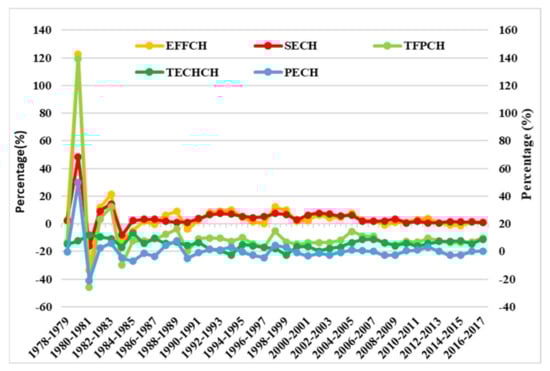
Figure 7.
The cumulative change rate of TFPECH, TECHCH, EFFCH, PECH, and SECH for the four countries from 1978 to 2017. (Note: second axis presents TFPCH and EFFCH values.)
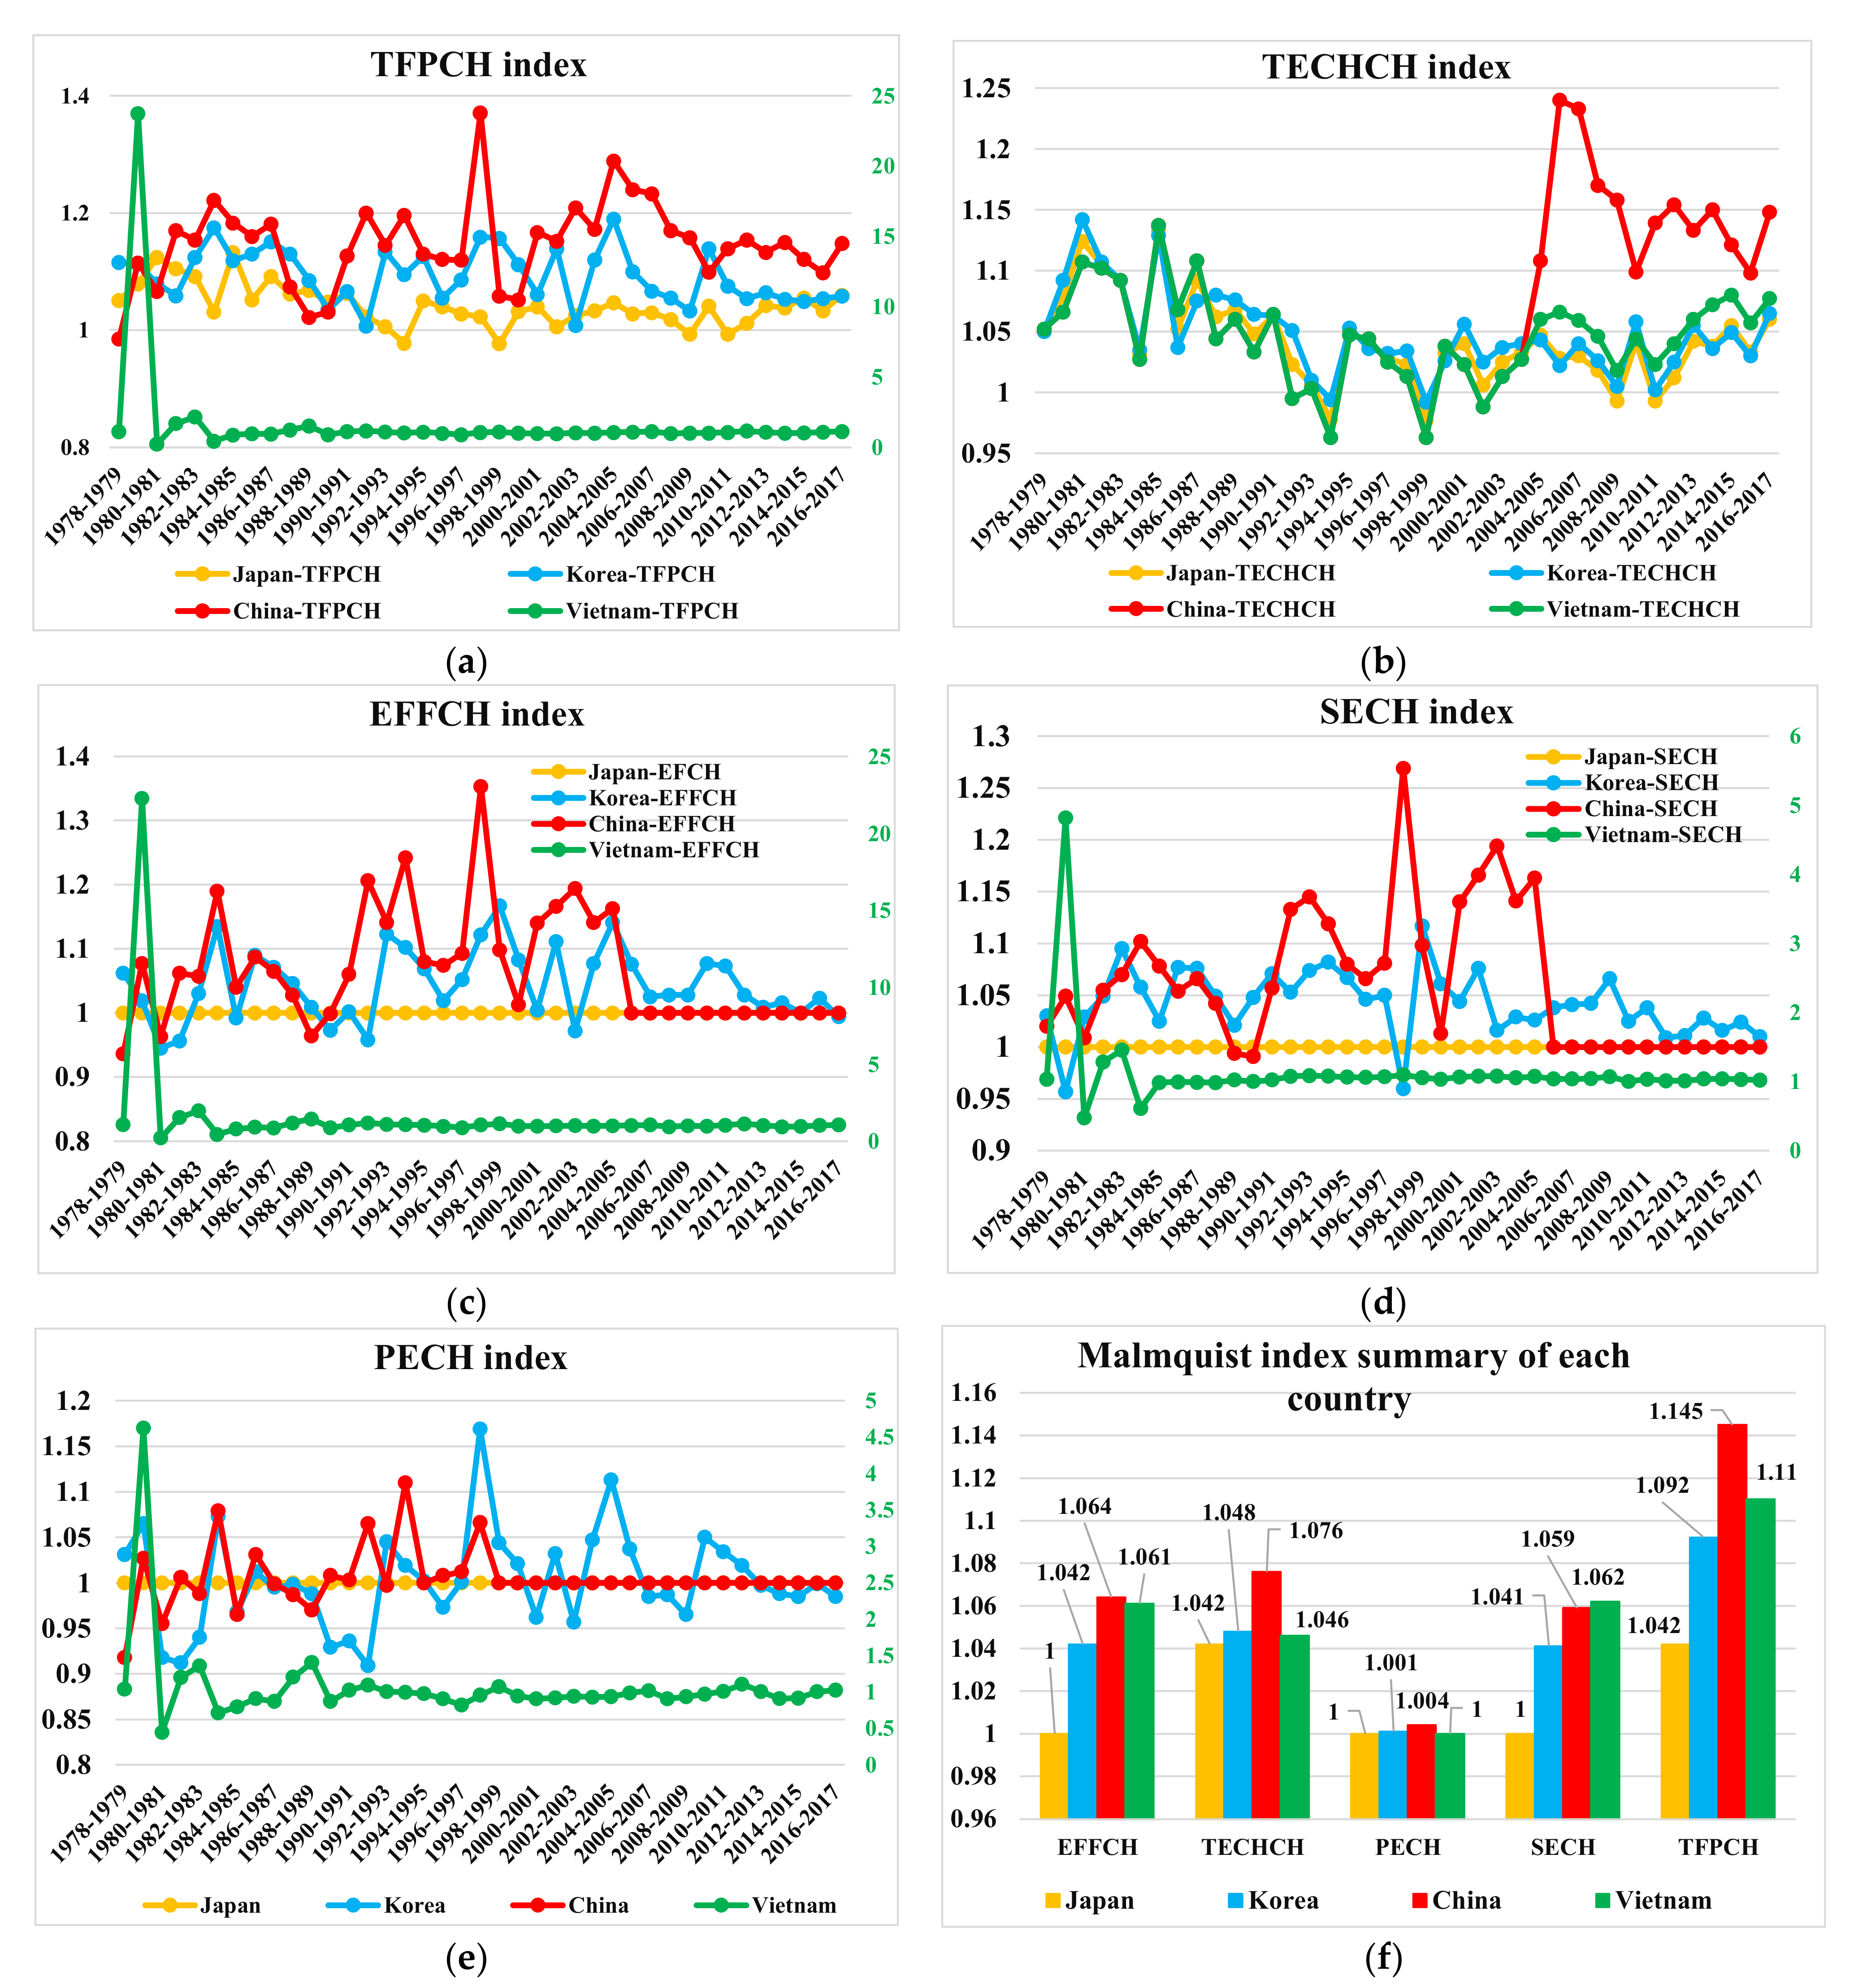
From a national level viewpoint, the TFPCH and its components of material consumption and eco-efficiency are exhibited in Figure 8.
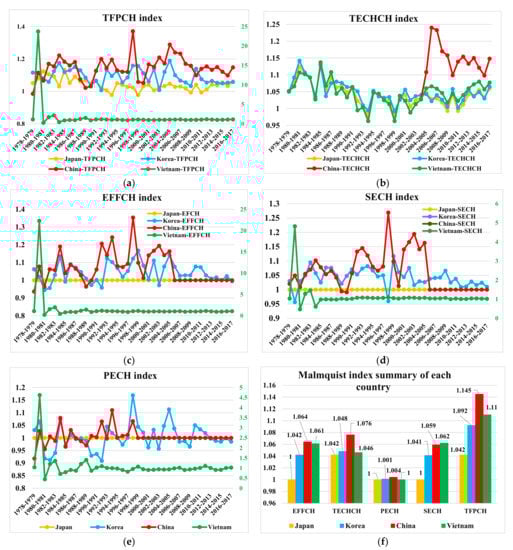
Figure 8.
Malmquist productivity index for Vietnam, China, Korea, and Japan during 1978–2017: (a) total factor productivity change (TFPCH); (b) technology change (TECHCH); (c) efficiency change (EFCH); (d) scale efficiency change (SECH); (e) pure efficiency change (PECH); and (f) average Malmquist index summary for each country. (Note: second axis presents Vietnam’s indicator, since the detailed results can be viewed in Appendix A).
TFPCH is shown in Figure 8a. Generally, the TFPCH trends fluctuated from 0.98–1.4 in Japan, South Korea, and China. Vietnam was an exception to this trend during 1978–1984, as the TFPCH growth rate was incoherently managed because, at that time, Vietnam was trapped in a stagnant economy with intervention from Western economies. On the other hand, the severe consequence of economic growth came from wars with Cambodia and China [62,63]. These predominant reasons brought the country into complicated situations. Only after 1985, Vietnam overcame the difficult period and gradually made breakthroughs in all fields, with a stable growth rate. It was demonstrated through the relative high improvement in all the Malmquist indexes.
From a TECHCH viewpoint, all the studied countries had similar trends during 1978–2003. However, in the next stage, China emerged as the leading country in lifting their technological innovation, with a 24% growth rate (during 2005–2006). While for the mature developed country Japan, it has early on performed in the high-tech arena compared with other countries, since its TECHCH has slowly increased in stability (Figure 8b).
EFFCH and its decomposed components including PECH, and SECH are shown in Figure 8c–e. Basically, from 1978 to 1984, these indexes in Vietnam were consistent with its TFPCH. It denotes that the EFFCH indicator plays a key role in altering TFPCH. Overall, all economies achieved the optimal scale in almost all years, in which the strongest volatility occurred in China, showing that the country was taken into advancement by its scale and traditional, pure change. In contrast, these indicators were maintained in Japan; it seems that this country is satisfied with what has been built in the past under its inherent science and synchronization. This country has almost no change in size and pure efficiency change, instead focusing on embracing advanced science in the world.
In summary, the geometric mean for each indicator at each nation is presented in Figure 8f. The average TFPCH value is highest in China, 14.5%; staying in the second position is Vietnam, with 11%, followed by South Korea ay 9.2%, and lowest in Japan, with a 4.2% growth rate (Figure 8f). However, technical efficiency changes commensurate with TFPCH in these countries. China remains as the leader, with a 7.6% growth rate in TECCH, while the other countries only rose around 4%. Once again, it confirms that the TECH index plays a major role in TFPCH growth in China, noting that the distance to the frontier decreased over the whole period.
For the EFFCH and PECH indexes in China, a slight increase compared with the other studied countries was seen. The reason may come from the policies in China, which have been positively influenced to improve their indicator performances. Only scale efficiency change in Vietnam presents higher than China’s SECH; however, both the fast-developing countries (China and Vietnam) performed better in almost all indicators from the developed countries (South Korea and Japan) (Figure 8f). Developing countries are showing their superiority and catching up quickly with developed countries. Basically, the Malmquist DEA results show that all these countries have great effort in lifting the value of materials and eco-efficiency. Furthermore, high-tech becomes a key role in rising the productivity index in all nations. Furthermore, China seems to continuously catch technological trends in developed countries. For Vietnam, a nation representing a fast-developing country, the economy is also remarkably reformed, keeping its status year by year. In parallel, the nation has followed with a relative trend compared with developed countries such as Japan and South Korea. The forecast is that Vietnam can step out of its remaining issues soon through justifiable strategies, thus bringing long-term benefits.
5. Discussion and Conclusion, Policy Perspectives, and Future Recommendations
The material flows in Vietnam along with its indicators over a span of four decades were displayed, reflecting the reciprocal relationship between material consumption and environmental impact. Through the input and output indicators of the MFA analysis, the consumption of raw materials has increased rapidly. It has led to an imbalance in import and export in Vietnam, and a resource deficit is predicted to occur alarmingly soon. Furthermore, affluence and technological factors have significantly promoted the dynamic resource transformation in the country. In recent years, technological progress has greatly contributed to improving the problem of material consumption and bringing higher benefits to the product. On the other hand, through the Malmquist DEA efficiency index, Vietnam has made strides in improving the value of its natural resources, along with controlling environmental issues at a stable level. Although the trend has not been able to catch up with the rest of the countries, it has recorded the efforts of this economy over the past time. Therefore, Vietnam needs to continuously follow the trends of countries that have been on the right track in sustainable development, such as Japan and South Korea. In addition, policymaking and programs towards sustainable natural resource consumption based on reducing the material intensity and increasing resource productivity should be considered, evaluating and forecasting their performance before their application. Vietnam should adjust early and tighten its development policies while reducing the burden on reserve resources.
Based on the analytical results, this paper highlights the following policy perspectives and recommendations:
In the period before 1980, Vietnam paid little attention to the provisions, programs, and policies of environmentally friendly and resource-saving development; this because the country’s situation was not completely stable after long and brutal wars. Back in 1986, Vietnam began to have a historic turning point in economic development and socio-political improvement, through a policy called “Doi Moi” (standard translation: Đổi mới) [34], encouraging investors to invest and produce to serve the most immediate needs, and then contribute to improvement at the national level. In particular, the mechanism to open the economy to the world was one of the main factors promoting the economy and at the same time restructure the state economy. It has brought about many great changes, such as leading to an annual GDP per capita growth rate of 5.6% in the period 1986–2014, while achieving an average annual GDP growth rate around 8% in 1990–1997. It has made this country one of the most developed countries, attracting foreign investment during that time [34,64].
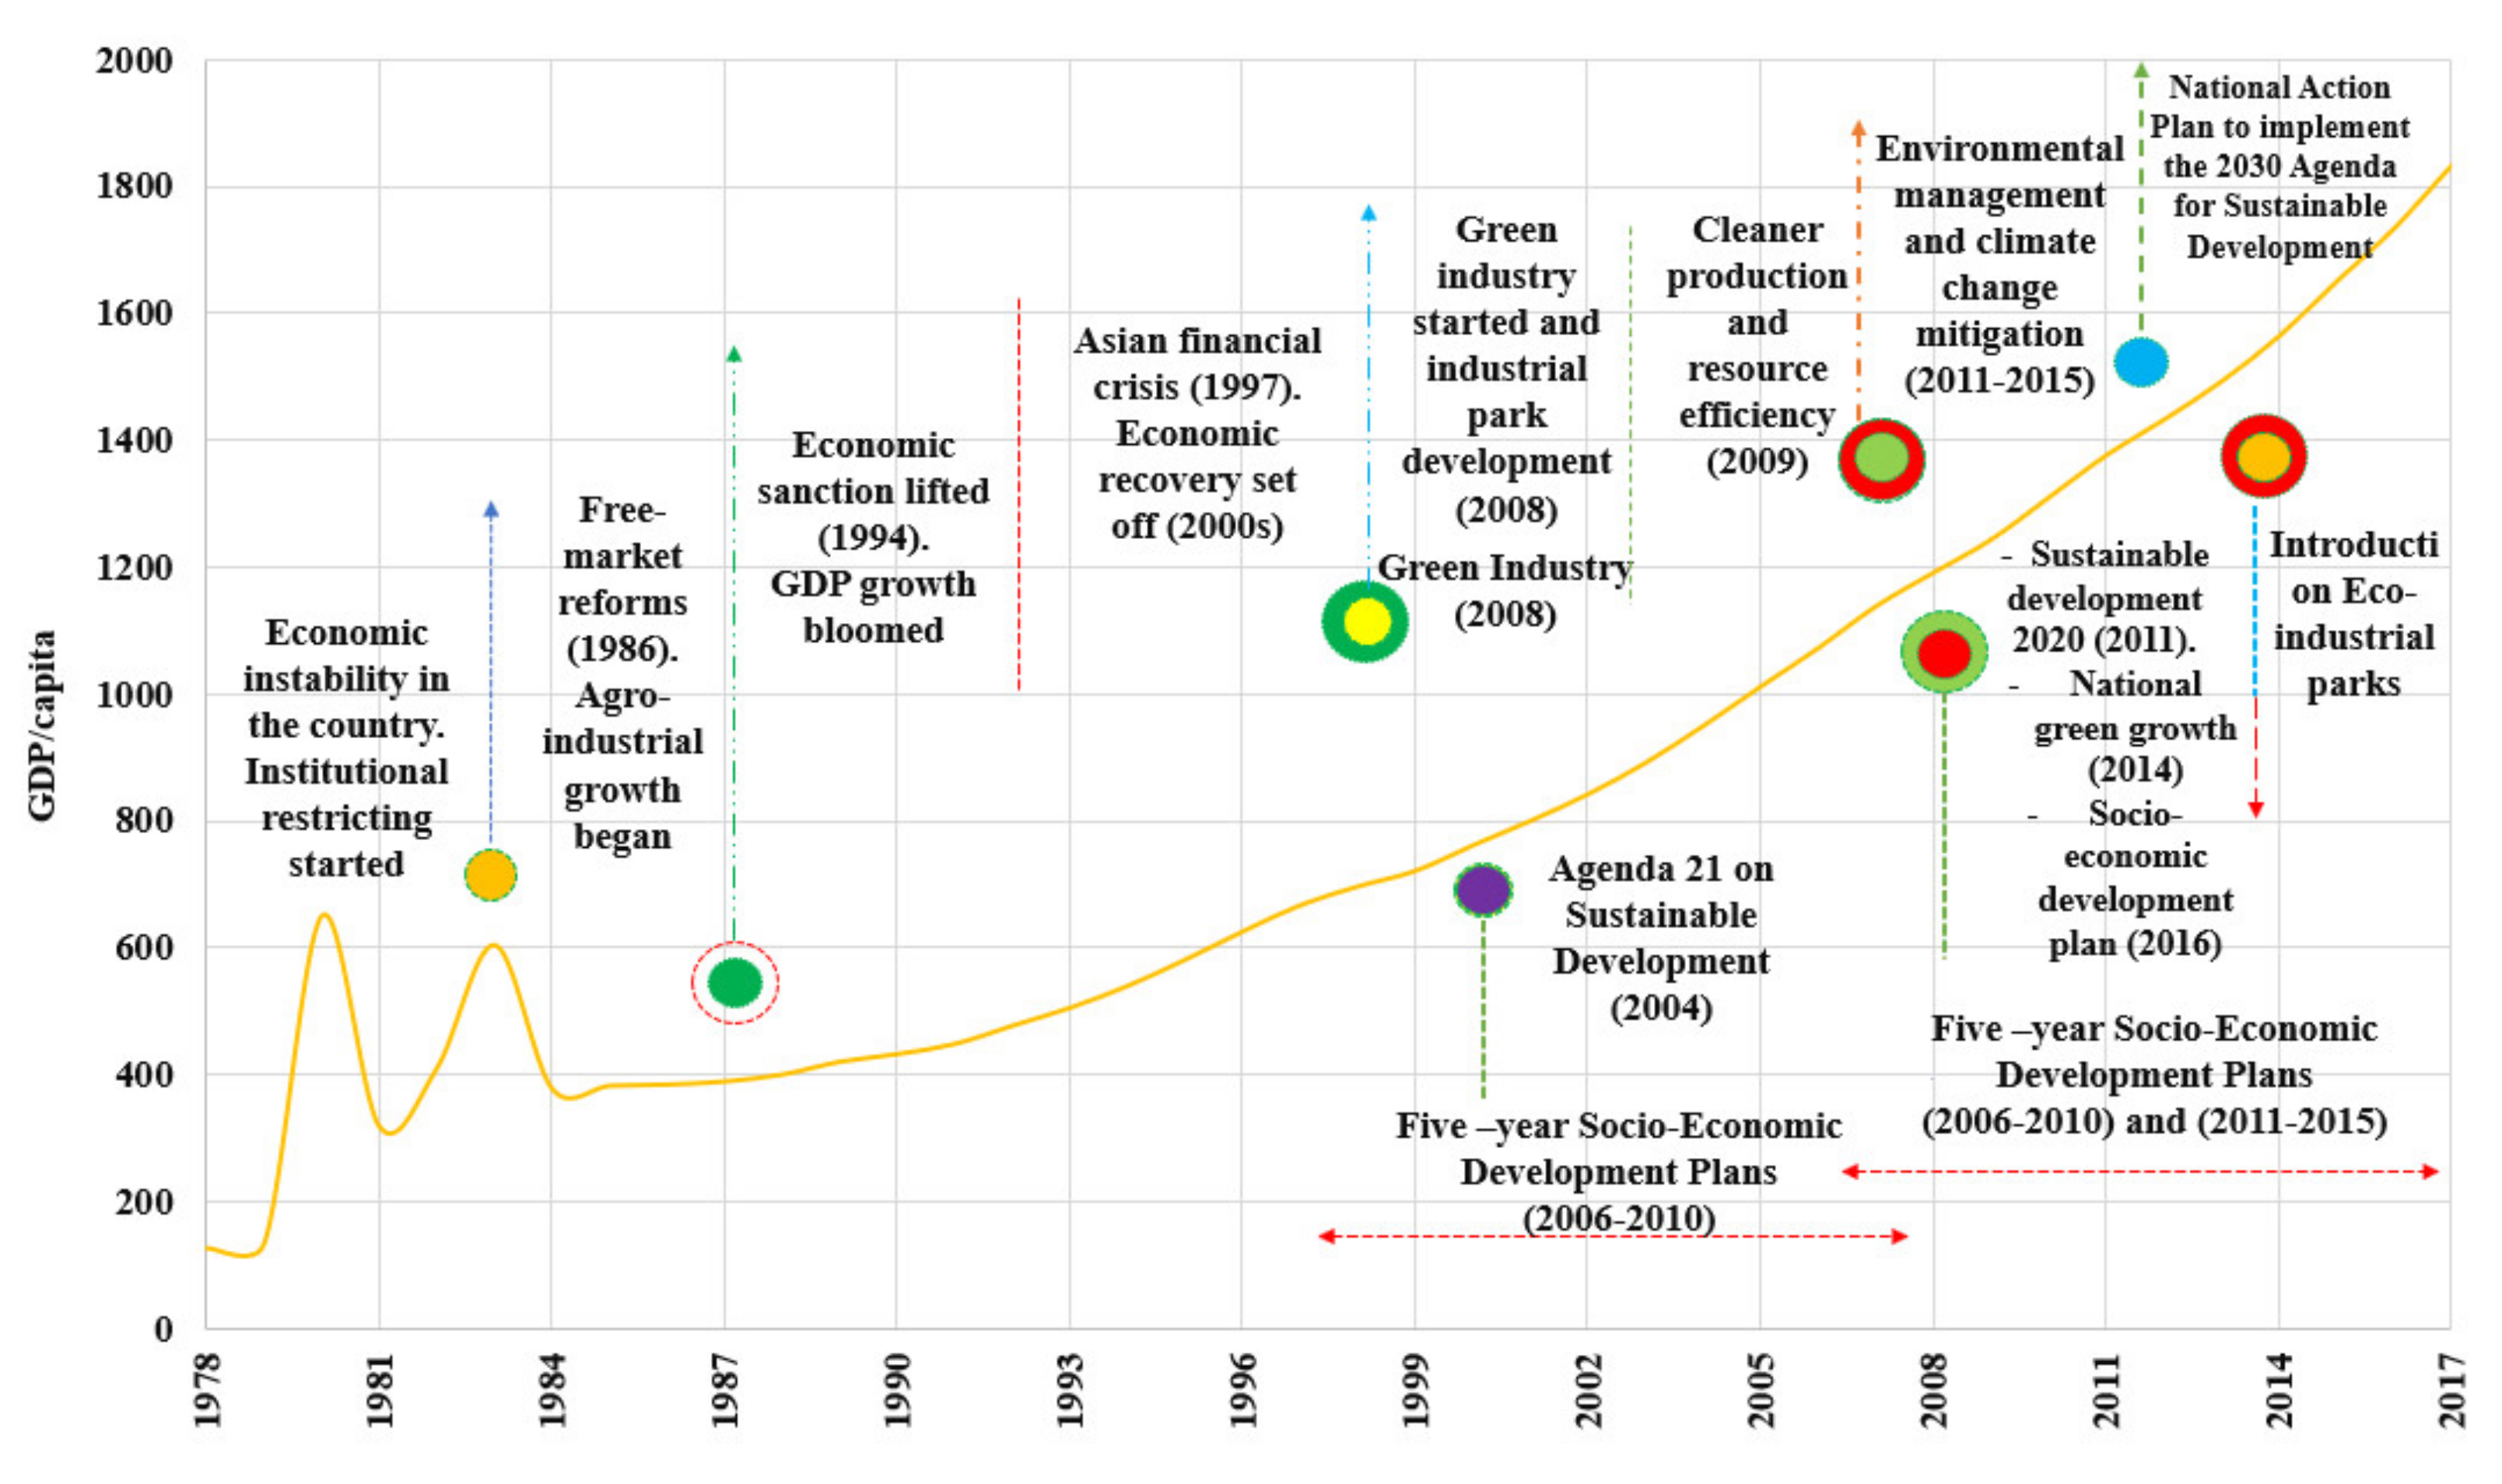
Moreover, the United States’ economic sanctions were officially lifted in 1994, opening the way for Vietnam to develop in the following years with a constant growth rate (Figure 9). Furthermore, the impact from the Asian financial crisis in 1997 was significantly less in Vietnam than in other countries. Meanwhile, most of the countries with great economic potential have slowed down or partially declined during this difficult period. The country remained resilient even during the global economic downturn from 2000 to 2010, with a high GDP growth rate of 7% per year (Figure 5).

Figure 9.
Economic and environmental policy development in Vietnam during 1978–2017.
By this time, Vietnam’s industrial sectors mainly comprised manufacturing plants, technology-based products, and petroleum fuels industries. From 2008 onwards, several green industry developments and cleaner production programs have been initiated by Vietnam’s government, including the industrial park development plan and cleaner production and resource efficiency program. Although resource conservation programs and sustainable development policies launched during 2011–2017 have helped improve the national economy, the apparent cost seems to amplify resource intensity. By 2030, Vietnam plans making a concrete foundation for sustainable and efficient growth. The strategic approaches consist of protecting and preserving natural resources, improving the status of the environment, making energy and material use efficiently, as well as adapting with the global climate change. The scenario follows international trends and meets the commitments signed by Vietnam and many countries [65]. Firstly, cutting down emissions to the air, while meeting the growing demand for energy in the context of the higher urbanization rate. In addition, solving land degradation while modernizing agriculture, forestry, and fisheries, which also play an important task. However, a big concern is the chronological programs that, for a while now, have not yet bent over backwards to increase the status of resources and the environmental in this country; indeed, overlapping and vicious strategies are maintained, which are proportionately with the technological factor keeping it behind the times. It is also a weakness for development, as these overlapping and vicious programs have not yielded effective results. Furthermore, future strategies have not yet been built on a scientifical basis, such as evaluation and heuristic models (ecological assessment tools: material flow analysis; analytical hierarchy analysis; optimization model; life cycle assessment; etc.), to provide realistic and feasible plans.
5.1. Discussion, Management, and Academic Implications
This study aims to conduct an extensive sustainable assessment of resource flow in Vietnam over four decades (1978–2017). The key driving factors from the IPAT and Malmquist data envelopment analysis are crucial indicators of material consumption, stating that while chasing low material intensity, one improves resource productivity. It is an important issue for resource security and sustainability in Vietnam and most nations. Under this analysis, the comprehensive description of material flow and material intensity transition economy-wide in Vietnam was drawn.
An acceleration in material consumption was highlighted through the total domestic material consumption from 1978 to 2017, which was sharply enhanced from 79.24 Mt to 1400.07 Mt, respectively, in which over 75.8% of the material consumption was non-metallic materials in 2017 (constructions, industry, and agriculture). Meanwhile, in 1978, it only accounted for over 13%. Furthermore, metal ores and fossil fuels in the physical trade balance (this index measures physical imports minus physical exports) dramatically shared 191.98% and 100.63% of the total value of the physical trade balance in 2017, respectively. At the same time, the large amount of material import, starting from the 2000s until the ending point of studied period, indicates that the resource deficit issue has been happening. Moreover, inefficient resource productivity has been steadily presented with the rise in emission intensity. In addition, the environmental pressure still stays at the pre-industrial economy stage in the EKC decoupling analysis (economic development and environmental decay stage). Obviously, through key indicators and analysis, it shows the instability in resource-material consumption in this nation. In parallel, this study applied an econometric method derived from a DEA (Malmquist data envelopment analysis) to investigate the resource-material usage and trace efficiencies among the studied years. It denotes that technological advancement plays a key role in the decline in material use and environmental problems during this period; it seems to be incapable of significant improvement. Therefore, except for efforts from itself, Vietnam needs to utilize its convenient conditions and scales, and learn lessons from developed countries such as South Korea, Japan, etc., in sustainable development and ambitious green growth targets. In essence, the major purpose of this study is to inform government, policymakers, and practitioners about material-resource perspectives.
5.2. Research Limitations and Future Recommendations
The limitations and recommendations of this study can be listed as follows: Considering DMC and CO2 emissions as the main contributors and impacts of economic growth while ignoring the impact of political changes, other consequential factors such as macroeconomic policies and micro can produce a biased result. On the other hand, comparisons of countries belonging to very different income groups often referred to as “developed” and “developing” can be misleading because of the large differences in socioeconomic and development orientation between countries; this makes any comparisons lame, and it is for reference only for the planners of these countries.
A study focusing on amplifying the resource intensity of Vietnam’s greener industrial development and cleaner production programs carried out since 2008 is a potential research topic because these programs, because Although this contributes to the improvement of the national economy, it has an increasing cost. Furthermore, future strategies have not been developed on a scientific basis, such as evaluation models and heuristics (ecological assessment tools: material flow analysis; hierarchical analysis, optimization model, life cycle assessment, etc.), to come up with realistic and feasible plans. Studies involving such techniques may be a recommendation for further research. At the same time, the country should review and eliminate outdated technologies, instead synchronizing production lines across industries. The emphasis should not be on the number of policies and programs but need to evaluate to find the effective methods. Avoiding the situation of overlapping and vicious strategies in making policies should be promoted.
5.3. Conclusions
From the early 2000s onwards, the efficiency in resource consumption and emission control in Vietnam has only improved slightly through the improvement of the TPFCH index in the Malmquist DEA analysis. In terms of cross-country comparisons, Vietnam’s resource-use efficiency is still poor, despite progress in science and technology and scale of access. However, the country also shows a promising future in controlling and reducing resource consumption and emissions. From a transitional perspective, a correlation between affluence, regional–global trade, industrialization, modernization, and emissions was found among nations. Moreover, historical strategies over the last few decades appear to be changing in a reasonable direction.
Author Contributions
Conceptualization, T.-T.H.; methodology, T.-T.H.; software, T.-T.H.; validation, L.D.; formal analysis, L.D.; investigation, T.-T.H.; resources, L.D.; data curation, T.-T.H.; writing—original draft preparation, T.-T.H.; writing—review and editing, T.-T.H., L.D., I.H.S. and H.-S.P.; supervision, H.-S.P.; project administration, H.-S.P.; funding acquisition, H.-S.P. All authors have read and agreed to the published version of the manuscript.
Funding
This work was supported by the Basic Science Research Program through the National Research Foundation (NRF) funded by the Ministry of Education (NRF-2020R1I1A2072313). L. Dong al-so thanks to the support from Natural Science Foundation of China (NSFC, No. 72061137071).
Data Availability Statement
Data will be provided under reasonable requests.
Conflicts of Interest
The authors declare no conflict of interest.
Nomenclature
| MFA | Material flow analysis |
| DEA | Data envelopment analysis |
| DEAM | Malmquist data envelopment analysis |
| DMC | Domestic material consumption |
| CRS | Constant returns to scale |
| PTB | Physical trade balance |
| DE | Domestic extraction |
| MP | Material productivity |
| MI | Material intensity |
| IPAT | Impact of human activity on the environment |
| P | Population |
| A | Affluence |
| T | Technology |
| LMDI | Log-Mean Divisia Index |
| EKC | Environmental Kuznets Curve |
Appendix A
| Japan | Korea | ||||||||||
| EFFCH | TECHCH | PECH | SECH | TFPCH | EFFCH | TECHCH | PECH | SECH | TFPCH | ||
| 1978–1979 | 1 | 1.051 | 1 | 1 | 1.051 | 1.062 | 1.05 | 1.031 | 1.03 | 1.116 | |
| 1979–1980 | 1 | 1.079 | 1 | 1 | 1.079 | 1.019 | 1.092 | 1.065 | 0.957 | 1.113 | |
| 1980–1981 | 1 | 1.124 | 1 | 1 | 1.124 | 0.945 | 1.142 | 0.918 | 1.029 | 1.079 | |
| 1981–1982 | 1 | 1.105 | 1 | 1 | 1.105 | 0.956 | 1.107 | 0.912 | 1.049 | 1.059 | |
| 1982–1983 | 1 | 1.092 | 1 | 1 | 1.092 | 1.03 | 1.092 | 0.94 | 1.095 | 1.124 | |
| 1983–1984 | 1 | 1.031 | 1 | 1 | 1.031 | 1.135 | 1.035 | 1.073 | 1.058 | 1.175 | |
| 1984–1985 | 1 | 1.133 | 1 | 1 | 1.133 | 0.992 | 1.129 | 0.968 | 1.025 | 1.119 | |
| 1985–1986 | 1 | 1.052 | 1 | 1 | 1.052 | 1.09 | 1.037 | 1.012 | 1.077 | 1.13 | |
| 1986–1987 | 1 | 1.092 | 1 | 1 | 1.092 | 1.071 | 1.075 | 0.995 | 1.076 | 1.151 | |
| 1987–1988 | 1 | 1.062 | 1 | 1 | 1.062 | 1.046 | 1.08 | 0.998 | 1.049 | 1.13 | |
| 1988–1989 | 1 | 1.068 | 1 | 1 | 1.068 | 1.009 | 1.076 | 0.988 | 1.021 | 1.085 | |
| 1989–1990 | 1 | 1.048 | 1 | 1 | 1.048 | 0.973 | 1.064 | 0.929 | 1.048 | 1.035 | |
| 1990–1991 | 1 | 1.063 | 1 | 1 | 1.063 | 1.002 | 1.063 | 0.936 | 1.071 | 1.066 | |
| 1991–1992 | 1 | 1.023 | 1 | 1 | 1.023 | 0.958 | 1.051 | 0.909 | 1.053 | 1.007 | |
| 1992–1993 | 1 | 1.006 | 1 | 1 | 1.006 | 1.123 | 1.01 | 1.045 | 1.074 | 1.134 | |
| 1993–1994 | 1 | 0.978 | 1 | 1 | 0.978 | 1.102 | 0.994 | 1.019 | 1.082 | 1.095 | |
| 1994–1995 | 1 | 1.05 | 1 | 1 | 1.05 | 1.069 | 1.053 | 1.002 | 1.067 | 1.126 | |
| 1995–1996 | 1 | 1.04 | 1 | 1 | 1.04 | 1.019 | 1.036 | 0.973 | 1.046 | 1.055 | |
| 1996–1997 | 1 | 1.028 | 1 | 1 | 1.028 | 1.052 | 1.032 | 1.001 | 1.05 | 1.086 | |
| 1997–1998 | 1 | 1.023 | 1 | 1 | 1.023 | 1.122 | 1.034 | 1.169 | 0.96 | 1.159 | |
| 1998–1999 | 1 | 0.977 | 1 | 1 | 0.977 | 1.167 | 0.992 | 1.044 | 1.117 | 1.157 | |
| 1999–2000 | 1 | 1.032 | 1 | 1 | 1.032 | 1.083 | 1.026 | 1.021 | 1.061 | 1.112 | |
| 2000–2001 | 1 | 1.04 | 1 | 1 | 1.04 | 1.004 | 1.056 | 0.962 | 1.044 | 1.061 | |
| 2001–2002 | 1 | 1.006 | 1 | 1 | 1.006 | 1.111 | 1.025 | 1.032 | 1.076 | 1.139 | |
| 2002–2003 | 1 | 1.025 | 1 | 1 | 1.025 | 0.972 | 1.037 | 0.957 | 1.016 | 1.008 | |
| 2003–2004 | 1 | 1.033 | 1 | 1 | 1.033 | 1.077 | 1.04 | 1.047 | 1.029 | 1.12 | |
| 2004–2005 | 1 | 1.047 | 1 | 1 | 1.047 | 1.141 | 1.043 | 1.113 | 1.026 | 1.19 | |
| 2005–2006 | 1 | 1.028 | 1 | 1 | 1.028 | 1.076 | 1.022 | 1.037 | 1.038 | 1.1 | |
| 2006–2007 | 1 | 1.03 | 1 | 1 | 1.03 | 1.025 | 1.04 | 0.985 | 1.041 | 1.067 | |
| 2007–2008 | 1 | 1.018 | 1 | 1 | 1.018 | 1.028 | 1.026 | 0.987 | 1.042 | 1.055 | |
| 2008–2009 | 1 | 0.993 | 1 | 1 | 0.993 | 1.028 | 1.005 | 0.965 | 1.066 | 1.033 | |
| 2009–2010 | 1 | 1.041 | 1 | 1 | 1.041 | 1.077 | 1.058 | 1.05 | 1.025 | 1.139 | |
| 2010–2011 | 1 | 0.993 | 1 | 1 | 0.993 | 1.073 | 1.002 | 1.034 | 1.038 | 1.075 | |
| 2011–2012 | 1 | 1.012 | 1 | 1 | 1.012 | 1.028 | 1.025 | 1.019 | 1.009 | 1.054 | |
| 2012–2013 | 1 | 1.042 | 1 | 1 | 1.042 | 1.009 | 1.055 | 0.997 | 1.011 | 1.064 | |
| 2013–2014 | 1 | 1.038 | 1 | 1 | 1.038 | 1.016 | 1.036 | 0.988 | 1.028 | 1.053 | |
| 2014–2015 | 1 | 1.055 | 1 | 1 | 1.055 | 1 | 1.049 | 0.985 | 1.016 | 1.049 | |
| 2015–2016 | 1 | 1.033 | 1 | 1 | 1.033 | 1.023 | 1.03 | 0.999 | 1.024 | 1.054 | |
| 2016–2017 | 1 | 1.06 | 1 | 1 | 1.06 | 0.994 | 1.065 | 0.985 | 1.01 | 1.058 | |
| China | Vietnam | ||||||||||
| EFFCH | TECHCH | PECH | SECH | TFPCH | EFFCH | TECHCH | PECH | SECH | TFPCH | ||
| 1978–1979 | 0.936 | 1.052 | 0.918 | 1.02 | 0.985 | 1.075 | 1.052 | 1.038 | 1.036 | 1.132 | |
| 1979–1980 | 1.077 | 1.066 | 1.027 | 1.049 | 1.1149 | 22.264 | 1.066 | 4.623 | 4.816 | 23.74 | |
| 1980–1981 | 0.963 | 1.107 | 0.955 | 1.009 | 1.066 | 0.213 | 1.107 | 0.445 | 0.478 | 0.236 | |
| 1981–1982 | 1.062 | 1.102 | 1.006 | 1.055 | 1.17 | 1.539 | 1.102 | 1.199 | 1.284 | 1.697 | |
| 1982–1983 | 1.057 | 1.092 | 0.988 | 1.07 | 1.154 | 1.978 | 1.092 | 1.36 | 1.455 | 2.16 | |
| 1983–1984 | 1.19 | 1.027 | 1.079 | 1.102 | 1.222 | 0.437 | 1.027 | 0.715 | 0.611 | 0.448 | |
| 1984–1985 | 1.04 | 1.137 | 0.965 | 1.078 | 1.183 | 0.786 | 1.137 | 0.796 | 0.986 | 0.893 | |
| 1985–1986 | 1.087 | 1.068 | 1.031 | 1.054 | 1.16 | 0.907 | 1.068 | 0.912 | 0.995 | 0.968 | |
| 1986–1987 | 1.065 | 1.108 | 0.999 | 1.066 | 1.181 | 0.861 | 1.108 | 0.87 | 0.989 | 0.954 | |
| 1987–1988 | 1.028 | 1.044 | 0.987 | 1.042 | 1.074 | 1.186 | 1.044 | 1.204 | 0.985 | 1.238 | |
| 1988–1989 | 0.964 | 1.06 | 0.97 | 0.994 | 1.022 | 1.439 | 1.06 | 1.406 | 1.024 | 1.526 | |
| 1989–1990 | 0.999 | 1.033 | 1.008 | 0.991 | 1.031 | 0.873 | 1.033 | 0.871 | 1.002 | 0.902 | |
| 1990–1991 | 1.06 | 1.064 | 1.003 | 1.057 | 1.127 | 1.05 | 1.064 | 1.025 | 1.025 | 1.117 | |
| 1991–1992 | 1.206 | 0.995 | 1.065 | 1.133 | 1.2 | 1.178 | 0.995 | 1.094 | 1.077 | 1.172 | |
| 1992–1993 | 1.141 | 1.003 | 0.997 | 1.145 | 1.145 | 1.093 | 1.003 | 1.006 | 1.086 | 1.097 | |
| 1993–1994 | 1.242 | 0.963 | 1.11 | 1.119 | 1.196 | 1.075 | 0.963 | 0.997 | 1.078 | 1.034 | |
| 1994–1995 | 1.08 | 1.047 | 1 | 1.08 | 1.13 | 1.043 | 1.047 | 0.978 | 1.066 | 1.092 | |
| 1995–1996 | 1.074 | 1.044 | 1.008 | 1.066 | 1.121 | 0.961 | 1.044 | 0.906 | 1.061 | 1.003 | |
| 1996–1997 | 1.093 | 1.025 | 1.012 | 1.081 | 1.12 | 0.877 | 1.025 | 0.82 | 1.07 | 0.899 | |
| 1997–1998 | 1.353 | 1.013 | 1.066 | 1.269 | 1.371 | 1.048 | 1.013 | 0.955 | 1.097 | 1.062 | |
| 1998–1999 | 1.098 | 0.963 | 1 | 1.098 | 1.058 | 1.136 | 0.963 | 1.073 | 1.058 | 1.094 | |
| 1999–2000 | 1.013 | 1.038 | 1 | 1.013 | 1.052 | 0.977 | 1.038 | 0.946 | 1.033 | 1.014 | |
| 2000–2001 | 1.14 | 1.023 | 1 | 1.14 | 1.167 | 0.967 | 1.023 | 0.907 | 1.067 | 0.989 | |
| 2001–2002 | 1.166 | 0.988 | 1 | 1.166 | 1.152 | 0.988 | 0.988 | 0.917 | 1.078 | 0.976 | |
| 2002–2003 | 1.194 | 1.013 | 1 | 1.194 | 1.209 | 1.015 | 1.013 | 0.941 | 1.078 | 1.027 | |
| 2003–2004 | 1.141 | 1.027 | 1 | 1.141 | 1.172 | 0.98 | 1.027 | 0.929 | 1.055 | 1.006 | |
| 2004–2005 | 1.163 | 1.108 | 1 | 1.163 | 1.289 | 1.006 | 1.06 | 0.937 | 1.074 | 1.067 | |
| 2005–2006 | 1 | 1.24 | 1 | 1 | 1.24 | 1.025 | 1.066 | 0.987 | 1.039 | 1.092 | |
| 2006–2007 | 1 | 1.233 | 1 | 1 | 1.233 | 1.056 | 1.059 | 1.017 | 1.038 | 1.118 | |
| 2007–2008 | 1 | 1.17 | 1 | 1 | 1.17 | 0.946 | 1.046 | 0.906 | 1.045 | 0.99 | |
| 2008–2009 | 1 | 1.158 | 1 | 1 | 1.158 | 1.002 | 1.018 | 0.935 | 1.071 | 1.02 | |
| 2009–2010 | 1 | 1.099 | 1 | 1 | 1.099 | 0.975 | 1.044 | 0.97 | 1.004 | 1.018 | |
| 2010–2011 | 1 | 1.139 | 1 | 1 | 1.139 | 1.044 | 1.023 | 1.008 | 1.036 | 1.068 | |
| 2011–2012 | 1 | 1.154 | 1 | 1 | 1.154 | 1.122 | 1.04 | 1.108 | 1.012 | 1.166 | |
| 2012–2013 | 1 | 1.133 | 1 | 1 | 1.133 | 1.017 | 1.06 | 1.004 | 1.013 | 1.078 | |
| 2013–2014 | 1 | 1.15 | 1 | 1 | 1.15 | 0.942 | 1.072 | 0.908 | 1.037 | 1.009 | |
| 2014–2015 | 1 | 1.121 | 1 | 1 | 1.121 | 0.954 | 1.08 | 0.916 | 1.041 | 1.03 | |
| 2015–2016 | 1 | 1.098 | 1 | 1 | 1.098 | 1.035 | 1.057 | 1.003 | 1.031 | 1.093 | |
| 2016–2017 | 1 | 1.148 | 1 | 1 | 1.148 | 1.047 | 1.077 | 1.026 | 1.021 | 1.128 | |
References
- Schandl, H.; Turner, G.M. The Dematerialization Potential of the Australian Economy. J. Ind. Ecol. 2009, 13, 863–880. [Google Scholar] [CrossRef]
- Giljum, S.; Dittrich, M.; Lieber, M.; Lutter, S. Sustainable apparel materials. Resources 2014, 3, 319–339. [Google Scholar] [CrossRef]
- Schandl, H.; West, J. Material Flows and Material Productivity in China, Australia, and Japan. J. Ind. Ecol. 2012, 16, 352–364. [Google Scholar] [CrossRef]
- Shah, I.H.; Park, H.S. Chronological change of resource metabolism and decarbonization patterns in Pakistan: Perspectives from a typical developing country. J. Ind. Ecol. 2020, 25, 144–161. [Google Scholar] [CrossRef]
- Aoki-Suzuki, C.; Bengtsson, M.; Hotta, Y. International comparison and suggestions for capacity development in in-dustrializing countries: Policy application of economy-wide material flow accounting. J. Ind. Ecol. 2012, 16, 467–480. [Google Scholar] [CrossRef]
- Wiedenhofer, D.; Fishman, T.; Lauk, C.; Haas, W.; Krausmann, F. Integrating Material Stock Dynamics Into Economy-Wide Material Flow Accounting: Concepts, Modelling, and Global Application for 1900–2050. Ecol. Econ. 2019, 156, 121–133. [Google Scholar] [CrossRef]
- Eurostat. Economy-Wide Material Flow Accounts; Statistical Office of the European Communities: Luxembourg, 2001. [Google Scholar]
- EUROSTAT. Economy-Wide Material Flow Accounting (EW-MFA): Compilation Guide 2017; Statistical Office of the European Communities: Luxembourg, 2007. [Google Scholar]
- EUROSTAT. Economy-Wide Material Flow Accounting (EW-MFA): Compilation Guide 2013; Statistical Office of the European Communities: Luxembourg, 2013. [Google Scholar]
- Dong, L.; Dai, M.; Liang, H.; Zhang, N.; Mancheri, N.; Ren, J.; Dou, Y.; Hu, M. Material flows and resource productivity in China, South Korea, and Japan from 1970 to 2008: A transitional perspective. J. Clean. Prod. 2017, 141, 1164–1177. [Google Scholar] [CrossRef]
- Balat, M. Material Flow Analysis and its Status in Europe Countries. Energy Explor. Exploit. 2004, 22, 441–455. [Google Scholar] [CrossRef]
- Hammer, M.; Hubacek, K. Material Flows and Economic Development Material Flow Analysis of the Hungarian Economy; International Institute for Applied Systems Analysis: Laxenburg, Austria, 2003. [Google Scholar]
- Krausmann, F.; Gingrich, S.; Nourbakhch-Sabet, R. The metabolic transition in Japan: A material flow account for the period from 1878 to 2005. J. Ind. Ecol. 2011, 15, 877–892. [Google Scholar] [CrossRef]
- Moriguchi, Y. Rapid Socio-Economic Transition and Material Flows in Japan. Popul. Environ. 2001, 23, 105–115. [Google Scholar] [CrossRef]
- Wang, H.; Hashimoto, S.; Moriguchi, Y.; Yue, Q.; Lu, Z. Resource use in growing China: Past trends, influence factors, and future demand. J. Ind. Ecol. 2012, 16, 481–492. [Google Scholar] [CrossRef]
- Dai, T.; Liu, R. Dematerialization in Beijing from the perspective of material metabolism. J. Clean. Prod. 2018, 201, 792–801. [Google Scholar] [CrossRef]
- Calvo, G.; Valero, A.; Valero, A. Material flow analysis for Europe: An exergy-ecological approach. Ecol. Indic. 2016, 60, 603–610. [Google Scholar] [CrossRef]
- Giljum, S.; Dittrich, M.; Lieber, M.; Lutter, S. Global Patterns of Material Flows and their Socio-Economic and Environmental Implications: A MFA Study on All Countries World-Wide from 1980 to 2009. Resource 2014, 3, 319–339. [Google Scholar] [CrossRef]
- De Castro Camioto, F.; Do Nascimento Rebelatto, D.A.; Rocha, R.T. Energy efficiency analysis of BRICS countries: A study using Data Envelopment Analysis. Gestao e Producao 2016, 23, 192–203. [Google Scholar]
- Shah, I.H.; Dong, L.; Park, H.-S. Characterization of resource consumption and efficiency trends in Bangladesh, India and Pakistan: Economy-wide biotic and abiotic material flow accounting from 1978 to 2017. J. Clean. Prod. 2020, 250, 119554. [Google Scholar] [CrossRef]
- World Bank. Taking Stock an Update on Vietnam’ S Recent Economic Development- an Update on Vietnam’ S Recent Economic; World Bank: Hanoi, Vietnam, 2012; Available online: https://openknowledge.worldbank.org/handle/10986/29959 (accessed on 20 October 2021).
- Huong, T.T.; Shah, I.H.; Park, H.-S. Decarbonization of Vietnam’s economy: Decomposing the drivers for a low-carbon growth. Environ. Sci. Pollut. Res. 2021, 28, 518–529. [Google Scholar] [CrossRef] [PubMed]
- Dinh, D.N. VIETNAM: A COUNTRY REPORT. In The Status, Reputation and Image of the Library and Information Profession; Walter de Gruyter GmbH, The International Federation of Library Associations and Institutions (IFLA): Hanoi, Vietnam, 1994; pp. 222–224. [Google Scholar]
- UNDP. Fossil Fuel Fiscal Policies and Greenhouse Gas Emissions in Viet Nam. Available online: file:///C:/Users/MDPI/AppData/Local/Temp/VN%20CGE%20analysis%20fossil%20fuel%20subsidy%20tax%20-%20paper2%20-%20final.pdf (accessed on 11 June 2013).
- Massard, G.; Leuenberger, H.; Dong, T.D. Standards requirements and a roadmap for developing eco-industrial parks in Vietnam. J. Clean. Prod. 2018, 188, 80–91. [Google Scholar] [CrossRef]
- Country-Report. “Vietnam Report 2018”; World Bank: Hanoi, Vietnam, 2018; pp. 1–19. [Google Scholar]
- Bass, S.; Annandale, D.; Binh, P.V.; Dong, T.P.; Anh, H.N.; Oanh, L.T.K.; Parsons, M.; Phuc, N.V.; Trieu, V.V. Integrating Environment and Development in Viet Nam: Achievements, Challenges, and Next Steps; UNDP: New York, NY, USA, 2009; p. 51. [Google Scholar]
- Diez, J.R. Vietnam 30 years after Doi Moi: Achievements and challenges. Zeitschrift für Wirtschaftsgeographie 2016, 60, 121–133. [Google Scholar] [CrossRef]
- Perkins, D.H.; Anh., V.T.T. Vietnam’s Industrial Policy Designing Policies for Sustainable Development. In Harvard Policy Dialogue Papers: Series on Vietnam’s WTO Accession and International Competitiveness Research; Harvard University former Principal Investigator of the Vietnam Program at Harvard University: Cambridge, MA, USA, 2009; pp. 1–57. [Google Scholar]
- Socialist Republic of Vietam. The Five-Year Socio-Economic Development Plan From 2016–2020; World Bank: Hanoi, Vietnam, 2016. [Google Scholar]
- Konrad Adenauer Stiftung. Viet Nam Quarterly Macroeconomic Report; Konrad Adenauer Stiftung: Bonn, Germany, 2017; pp. 1–40. [Google Scholar]
- Harker, A. Website of PMI Commentary, Vietnam, 2018. pp. 15–16. Available online: http:www.ihsmarkit.com (accessed on 20 October 2021).
- The World Bank. World Development Indicators. National Accounts Data, and OECD National Accounts Data Files; The World Bank: Hanoi, Vietnam, 2017. [Google Scholar]
- Barker, T.; Üngör, M. Vietnam: The next asian Tiger? N. Am. J. Econ. Financ. 2019, 47, 96–118. [Google Scholar] [CrossRef]
- Nickerson, R.S. Protection of the Environment. Handbook of Applied Cognition, 2nd ed.; Wiley: Hoboken, NJ, USA, 2008; pp. 713–738. [Google Scholar]
- Republic, S.; Viet, O.F.; Minister, T.H.E.P. CSDLVBQPPL Bộ Tư pháp—Approving Vietnam’s National Energy Development Strategy up to 2020, with 2050 Vision; Ministry of Justice: Hanoi, Vietnam, 2020; pp. 2018–2020. [Google Scholar]
- Shem, C.; Simsek, Y.; Hutfilter, U.F.; Urmee, T. Potentials and opportunities for low carbon energy transition in Vietnam: A policy analysis. Energy Policy 2019, 134, 110818. [Google Scholar] [CrossRef]
- Pivnenko, K.; Laner, D.; Astrup, T.F. Material Cycles and Chemicals: Dynamic Material Flow Analysis of Contaminants in Paper Recycling. Environ. Sci. Technol. 2016, 50, 12302–12311. [Google Scholar] [CrossRef] [Green Version]
- Kósi, K.; Torma, A. Tracing material flows on industrial sites. Period. Polytech. Soc. Manag. Sci. 2005, 13, 133–150. [Google Scholar]
- Nakicenovic, N.; Swart, R. Intergovernmental Panel on Climate Change: Emissions Scenarios; IPCC: Geneva, Switzerland, 2000. [Google Scholar]
- York, R.; Rosa, E.A.; Dietz, T. STIRPAT, IPAT and ImPACT: Analytic tools for unpacking the driving forces of environ-mental impacts. Ecol. Econ. 2003, 46, 351–365. [Google Scholar] [CrossRef]
- Ang, B.; Liu, F. A new energy decomposition method: Perfect in decomposition and consistent in aggregation. Energy 2001, 26, 537–548. [Google Scholar] [CrossRef]
- Zhang, Y.; Yu, Z. Analysis of carbon emission performance and regional differences in China’s eight economic regions: Based on the super-efficiency SBM model and the Theil index. PLoS ONE 2021, 16, e0250994. [Google Scholar] [CrossRef]
- Charnes, A.; Cooper, W.W. Preface to topics in data envelopment analysis. Ann. Oper. Res. 1984, 2, 59–94. [Google Scholar] [CrossRef]
- Wang, S.; Zhu, X.; Song, D.; Wen, Z.; Chen, B.; Feng, K. Drivers of CO2 emissions from power generation in China based on modified structural decomposition analysis. J. Clean. Prod. 2019, 220, 1143–1155. [Google Scholar] [CrossRef]
- Liu, W.; Tian, J.; Chen, L.; Lu, W.; Gao, Y. Environmental Performance Analysis of Eco-Industrial Parks in China: A Data Envelopment Analysis Approach. J. Ind. Ecol. 2015, 19, 1070–1081. [Google Scholar] [CrossRef]
- Łozowicka, A. Evaluation of the Efficiency of Sustainable Development Policy Implementation in Selected EU Member States Using DEA. The Ecological Dimension. Sustainability 2020, 12, 435. [Google Scholar] [CrossRef] [Green Version]
- Li, J.; Ma, J.; Wei, W. Analysis and Evaluation of the Regional Characteristics of Carbon Emission Efficiency for China. Sustainability 2020, 12, 3138. [Google Scholar] [CrossRef] [Green Version]
- Chang, C.-W.; Wu, K.-S.; Chang, B.-G. Productivity Change and Decomposition in Taiwan Bakery Enterprise―Evidence from 85 °C Company. Sustainability 2019, 11, 7077. [Google Scholar] [CrossRef] [Green Version]
- Afsharian, M.; Ahn, H. The overall Malmquist index: A new approach for measuring productivity changes over time. Ann. Oper. Res. 2015, 226, 1–27. [Google Scholar] [CrossRef]
- Long, R.; Ouyang, H.; Guo, H. Super-slack-based measuring data envelopment analysis on the spatial–temporal patterns of logistics ecological efficiency using global Malmquist Index model. Environ. Technol. Innov. 2020, 18, 100770. [Google Scholar] [CrossRef]
- Roh, C.-Y.; Park, C.; Moon, M.J. Economic performances of U.S. non-profit hospitals using the Malmquist productivity change index. J. Manag. Mark. Res. 2011, 8, 1–16. [Google Scholar]
- World Bank. World Development Indicators. National Accounts Data, and OECD National Accounts Data Files; World Bank: Hanoi, Vietnam, 2019. [Google Scholar]
- IEA. CO2 Emissions from Fuel Combustion 2017—Highlights; International Energy Agency: Paris, France, 2017. [Google Scholar]
- Eun, O.J.; Alegre, X.E.; Pant, R. Vietnam Development Report 2019: Connecting Vietnam for Growth and Shared Prosperity; World Bank Group: Hanoi, Vietnam, 2019; pp. 1–172. [Google Scholar]
- Department of Environmental Affairs. Department of Environmental Affairs Annual Report 2017/18, DEA Annual Report 2018/19; Department of Environmental Affairs: Pretoria, South Africa, 2019; p. 207. [Google Scholar]
- Inclusion, E.; Irish, T.; November, A. Vietnam Climate Action Report for 2016; Resilience and Economic Inclusion Team: Hanoi, Vietnam, 2017; p. 19. [Google Scholar]
- Daniels, P.L.; Moore, S. Approaches for Quantifying the Metabolism of Physical Economies: Part I: Methodological Overview. J. Ind. Ecol. 2001, 5, 69–93. [Google Scholar] [CrossRef]
- Thang, B.T. After the War: 25 Years of Economic Development in Vietnam; NIRA Review: Hanoi, Vietnam, 2000; pp. 21–25. [Google Scholar]
- Borghi, R.A.Z. The Brazilian productive structure and policy responses in the face of the international economic crisis: An assessment based on input-output analysis. Struct. Chang. Econ. Dyn. 2017, 43, 62–75. [Google Scholar] [CrossRef]
- Klingenberg, C.O. Industry 4.0: What Makes it a Revolution? Polytechnic School: Cristina, Brazil, 2017; pp. 1–10. [Google Scholar]
- Porter, G. Vietnam’s Ethnic Chinese and the Sino-Vietnamese conflict. Bull. Concerned Asian Sch. 1980, 12, 55–60. [Google Scholar] [CrossRef]
- World Bank. Vietnam-World Bank: Long-Term Companions in Development (English); The World Bank (WB) Group: Hanoi, Vietnam, 2012. [Google Scholar]
- Largo, V. Vietnam: Current Issues and Historical Background; Nova Science Publishers: New York, NY, USA, 2002. [Google Scholar]
- Cashell, B.W. The Economic Effects of Raising National Saving; CRS report: Washington, DC, USA, 2007. [Google Scholar]
Publisher’s Note: MDPI stays neutral with regard to jurisdictional claims in published maps and institutional affiliations. |
© 2021 by the authors. Licensee MDPI, Basel, Switzerland. This article is an open access article distributed under the terms and conditions of the Creative Commons Attribution (CC BY) license (https://creativecommons.org/licenses/by/4.0/).