Article

Acid Soils Nitrogen Leaching and Buffering Capacity Mitigation Using Charcoal and Sago Bark Ash

by
Nur Hidayah Hamidi
1,
Osumanu Haruna Ahmed
2,3,4,
Latifah Omar
1,3,
Huck Ywih Ch’ng
5,
Prisca Divra Johan
1,
Puvan Paramisparam
1 and
Mohamadu Boyie Jalloh
6,*
1
Department of Crop Science, Faculty of Agricultural Science and Forestry, Bintulu Campus, Universiti Putra Malaysia, Bintulu 97008, Malaysia
2
Department of Forestry Science, Faculty of Agricultural Science and Forestry, Bintulu Campus, Universiti Putra Malaysia, Bintulu 97008, Malaysia
3
Institut Ekosains Borneo (IEB), Sarawak Campus, Universiti Putra Malaysia, Bintulu 97008, Malaysia
4
Institute of Tropical Agriculture and Food Security (ITAFoS), Universiti Putra Malaysia, Serdang 43400, Malaysia
5
Faculty of Agro-Based Industry, Jeli Campus, Universiti Malaysia Kelantan, Kelantan 17600, Malaysia
6
Crop Production Programme, Faculty of Sustainable Agriculture, Universiti Malaysia Sabah, Sandakan Branch, Locked Bag No.3, Sandakan 90509, Malaysia
*
Author to whom correspondence should be addressed.
Sustainability 2021, 13(21), 11808; https://doi.org/10.3390/su132111808
Submission received: 5 September 2021 / Revised: 15 October 2021 / Accepted: 18 October 2021 / Published: 26 October 2021

Abstract

:
Soil acidity compromises agricultural output in tropical acid soils. Highly weathered tropical acidic soils are characterized by low pH, organic matter, nutrient availability, but high aluminium and iron concentration. Hence, N availability becomes a limiting factor in such soils. To this end, these leaching and pH buffering capacity studies were conducted to determine the effects of co-application of charcoal and sago bark ash on the N leaching or retention and pH buffering capacity of acid soils. The soil leaching experiment was conducted for 30 days by spraying distilled water to each container with soil such that the leachates were collected for analysis. The rate of urea used was fixed at 100% of the recommended rate. The rates of charcoal and sago bark ash were varied by 25%, 50%, 75%, and 100%, respectively, of the recommended rates. The pH buffering capacity was calculated as the negative reciprocal of the slope of the linear regression. The leaching study revealed that the combined use of charcoal, sago bark ash, and urea does not only reduce leaching of NH4+ and NO3 but the approach also improves soil pH, total C, and soil exchangeable NH4+. This effect is related to the fact that the sago bark ash deprotonates the functional groups of charcoal because of its neutralizing components such as Ca, Mg, Na, and K ions. As a result, the combined use of charcoal and sago bark ash was able to retain NH4+ in the soil. The carbonates in the sago bark ash and functional groups of charcoal improve pH buffering capacity. Thus, the combined use of charcoal and sago bark ash improved soil exchangeable NH4+, soil pH, and soil total C, but reduced exchangeable acidity and amount of NH4+ leached out from soil. This study will be further evaluated in a pot trial to confirm the results of the present findings.

1. Introduction

One-third of the world’s soils are acidic. Approximately, half of them are located in the tropics. Soil acidity is one of the world’s top five limitations to increasing agricultural productivity [1]. Highly weathered tropical acid soils are characterized by low pH, low organic matter, low in cation exchange capacity (CEC), aluminium (Al), manganese (Mn), and iron (Fe) toxicities, and their macro and micro nutrients deficiencies [2]. The application of nitrogen (N) fertilizers plays an essential part in achieving significant reductions in soil acidity [3]. Furthermore, N is a critical nutrient in the enhancement of crop yield. Thus, modern agriculture relies on inorganic fertilizers, particularly synthetic fertilizers such as urea, ammonium sulphate, ammonium nitrate, and anhydrous ammonia [4].
Excessive N fertilizer inputs could increase soil inorganic N and induce more leaching of nitrate (NO3) and base cations such as potassium (K+), calcium (Ca2+), and magnesium (Mg2+). Additionally, excessive N fertilizer application has resulted in N translocation from agricultural fields into ground water systems. The use of N fertilizer, such as urea, could cause an increase in soil acidity through nitrification and plant uptake of ammonium (NH4+) [5]. These two processes gradually increase soil exchangeable acidity resulting in soil acidification which is detrimental to plant and microorganisms existence [6]. Nitrogen, particularly NO3, is soluble in soil water solution and readily infiltrates beneath the rhizosphere. Yoo et al. [7] reported that this excessive N application reduces nitrogen use efficiency (NUE) and pollutes nearby water and atmospheric systems. These N losses are the result of intrinsic inefficiencies in current nutrient management systems, which not only result in environmental pollution but they also increase economic costs for farmers. Furthermore, N leaching is regarded as a major cause of eutrophication in both surface and groundwater.
Soil can exhibit acidity and alkalinity, which can be characterized by its pH. However, soil can also mitigate the effects of added acidic materials to some extent in order to maintain constant soil acidity through several soil processes such as dissolution of carbonate and cation exchange processes [8]. Estimating soil pH buffering capacity is beneficial for estimating the rate of soil acidification in response to estimated acid deposition rates [9,10,11]. In agricultural systems, acidification mainly occurs by imbalances in the carbon (C) and N cycles, through unequal cation or anion uptake by plants, alkalinity removal in agricultural product, and NO3 leaching [12]. According to Lieb et al. [13], acid buffering capacity in soils with pH ranging from 4.5 to 7.5 is mostly influenced by CEC. Soils with higher CEC have more cation exchange sites to buffer protons in the soil solution. Nonetheless, as atmospheric N deposition increases, NO3- and base cation leaching increases, resulting in dissolution of Al compounds. This process increases soil acidity. Tropical and subtropical soils account for a considerable portion of soils worldwide, and they play an important role in preserving the stability of the global climate system [14,15]. They are, however, extremely vulnerable to environmental changes, particularly acidic depositions from the atmosphere, and often have a relatively low acid buffering capacity [16,17] because of excessive weathering and leaching.
Several agricultural management practices have been introduced to solve the challenging problem of acidic tropical soils. Liming is the most recommended method. For example, calcium carbonates and ground magnesium limestone are applied to soils to increase their pH through altering the soils’ chemical, physical, and biological properties. However, the high cost of lime limits its usage by many farmers, particularly in the tropics. Additionally, the addition of organic and inorganic chemical compounds to urea as urease inhibitor has been developed as a technology to boost N efficacy. However, this technology increases the cost of production by 30% [18]. As a result, efforts had been made to assess the feasibility and efficacy of organic residues, not only to improve soil productivity but to also enhance the efficiency of inorganic fertilizer use [19].
Charcoal is one of the potential wood-derived products that can be used as soil conditioner or amendment. Charcoal is a carbonaceous solid residue produced under oxygen- deficient conditions through slow and rapid pyrolysis, gasification, and hydrothermal carbonization [20]. Because of its porous structure, large specific surface area, electrostatic properties, and mineral content on its surface, it is one of many potential adsorbents [21]. Additionally, the addition of charcoal to soils increases their pH, CEC, water holding capacity, promotes microbial activity, and decreases bulk density of soils [22,23,24]. Sago bark ash or wood ash is produced through combustion and it is high in soluble macronutrients such as Ca, K, P, and Mg. Ash can neutralize the acidity of the soils because of its neutralizing compounds such as calcite, lime, magnesium oxide, and fairchildite [25,26]. This study attempted to answer the question of whether amending urea with charcoal and sago bark ash could improve N retention and buffering capacity of tropical mineral acid soils. Therefore, it was hypothesized that the combined use of charcoal and sago bark ash with urea will reduce N leaching, increase soil pH, and enhance buffering capacity. Therefore, the objective of this study was to determine the effects of charcoal and sago bark ash on N retention and the pH buffering capacity of a tropical acid soil.

2. Materials and Methods

2.1. Soil Sampling, Preparation, and Characterization

The soil (Bekenu series, Typic Paleudults) used in this study was taken from an uncultivated secondary forest at Universiti Putra Malaysia, Bintulu Sarawak Campus (3°12′20″ N, 113°04′20″ E). The area has an elevation of 27.3 m, an annual rainfall of 2993 mm, a mean temperature of 27 °C, and relative humidity of approximately 80%. The soil was sampled at a depth of 0–20 cm after which it was air-dried, crushed, and sieved to pass a 2 mm sieve. The soil bulk density was determined using core ring method [27]. Soil texture was determined using the hydrometer method [28]. The soil pH in 1 M KCl was determined using a digital pH meter at a ratio of 1:2.5 (sample: KCl) [29]. Soil total titratable acidity, exchangeable hydrogen, and exchangeable aluminium were determined using the titration method [30]. Soil total C was determined using loss on ignition [31] and calculated as 58% of the organic matter. Soil cation exchange capacity was determined using the leaching method [32]. Total N was determined using the Kjeldahl method [33]. Available N was determined using Keeney and Nelson [34]. Except for soil texture, the selected physicochemical properties of the soil (Table 1) were within the range reported by Paramananthan [35].

2.2. Characterization of Charcoal and Sago Bark Ash

The charcoal used in this study was obtained from Pertama Ferroalloys Sdn Bhd, Bintulu, Sarawak, Malaysia, whereas the sago bark ash was from Song Ngeng Sago Industries, Dalat, Sarawak, Malaysia. The amendments were analyzed for pH in water and KCl, EC, total N, available N, and exchangeable cations (K+, Ca2+, Mg2+, Na+, and Fe2+) (Table 2).

2.3. Leaching Study Set Up

A leaching study was carried out for 30 days in the Soil Science Laboratory at Universiti Putra Malaysia Bintulu Sarawak Campus, Malaysia. Each treatment had three replicates. A total of 1 kg of soil was weighed using a digital balance into a polypropylene container based on the bulk density of the soil. Only urea with different rates of charcoal and sago bark ash were used in this laboratory leaching study without applying P and K fertilizers to determine the effects of the two amendments on N availability in the soil. The recommended rate of urea used was 60 kg N ha−1 (130 kg ha−1 urea) [36]. The amount of charcoal used was based on 10 t ha−1 which is equivalent to 51.4 g per 1 kg soil for this leaching study. The sago bark ash used was based on 5 t ha−1 which is equivalent to 25.7 g per 1 kg soil for this leaching study. These amounts were scaled down from the standard fertilizer recommendation for maize (test crop) cultivation per plant basis (based on plant density of 27,777 plants ha−1). The amount of urea used was fixed at 100% of the recommended rate because exceeding this rate is not economically beneficial. The charcoal and sago bark ash were varied by 25%, 50%, 75%, and 100%. The soil, urea, charcoal, and sago bark ash used in this present study were manually mixed thoroughly before commencing the leaching experiment. The bottom of the polypropylene containers were perforated. Thereafter, the mixture inside the polypropylene was moistened to 60% field capacity before commencing the leaching experiment. A total of 250 mL of water was sprayed into each container of soil every five days and the leachates were collected to determine the N lost from the soil. The volume of water applied was based on rainy days over 30 days based on 10 year rainfall data (2009–2019) obtained from the Department of Drainage and Irrigation, Bintulu, Sarawak, Malaysia from which the average amount of rainfall per month was calculated. The formulae used in the calculation are as follows:
Volume of monthly rainfall = Area of the rain gauge in cm2 × Height of
rainfall in cm per month
Volume of water required for container with area in cm2 = (Area of
container in cm2 × Volume of monthly rainfall)/area of rain gauge in cm2
Leachates were collected and analyzed every five days. After 30 days of the leaching experiment, soil samples were collected, air-dried, crushed, and sieved to pass a 2 mm sieve. The treatments were arranged in a completely randomized design. The treatments evaluated are listed as follows:
S0
: soil only
S0
U1: 4.7 g urea only
S0
C1: soil + urea + 51.4 g charcoal
S0
A1: soil + urea + 25.7 g sago bark ash
S0
C1A1: soil + urea + 51.4 g charcoal + 25.7 g sago bark ash
S0
C2A2: soil + urea + 38.6 g charcoal + 19.3 g sago bark ash
S0
C3A2: soil + urea + 25.7 g charcoal + 19.3 g sago bark ash
S0
C4A2: soil + urea + 12.9 g charcoal + 19.3 g sago bark ash
S0
C2A3: soil + urea + 38.6 g charcoal + 12.9 g sago bark ash
S0
C3A3: soil + urea + 25.7 g charcoal + 12.9 g sago bark ash
S0
C4A3: soil + urea + 12.9 g charcoal + 12.9 g sago bark ash
S0
C2A4: soil + urea + 38.6 g charcoal + 6.4 g sago bark ash
S0
C3A4: soil + urea + 25.7 g charcoal + 6.4 g sago bark ash
S0
C4A4: soil + urea + 12.9 g charcoal + 6.4 g sago bark ash

2.4. Buffering Capacity Experiment Set Up

The pH buffering capacity study was carried out in the Soil Science Laboratory at Universiti Putra Malaysia Bintulu Sarawak Campus Malaysia. In total, 300 g of soil was sieved to pass a 2 mm sieve before commencing the pH buffering capacity experiment. The soil was mixed thoroughly with charcoal and sago bark ash based on the treatment evaluated. The amount of charcoal used was based on 10 t ha−1 which is equivalent to 15.42 g per 300 g of soil for this buffering capacity study. The amount of sago bark ash used was based on 5 t ha−1 which is equivalent to 7.71 g per 300 g of soil for this buffering capacity study.
The pH buffering capacity was determined using titration method [37]. For each titration, a 5 g of soil was weighed into a 100 mL plastic vial using digital balance. For all samples, different rates of 0.25 M H2SO4 (0, 1, 2, 3, 4, 5, 6, 7, 8, 9, and 10 mL) were added with water to make 50 mL of the total liquid ratio (1:10 soil or soil with amendments mixture: water). After each addition of 0.25 M H2SO4, the suspensions were stirred thoroughly with a glass rod for 10 s, after which they were stirred for another 10 s. Thereafter, the suspension was equilibrated for 3 days, the pH suspensions were determined using a digital pH meter (SevenEasy pH, Mettler-Toledo GmbH, Greifensee, Switzerland). In this present study, a base solution such as NaOH was not used because of the alkalinity of the sago bark ash. The amount of acidity needed to reduce pH by one unit (1 mL = 0.1 mol H+ kg−1 dry sample) was calculated as the negative reciprocal of the slope of the linear regression, soil or soil-mixture pH (Y-axis) versus acid addition rate (X-axis):
Soil pH buffering capacity (mol H+ kg−1 soil) = − (1/slope)
where: slope = fitted slope of linear regression line for each sample
The treatments evaluated are listed as follows:
T1
: 300 g soil only
T1
T2: 300 g charcoal only
T1
T3: 300 g sago bark ash only
T1
T4: 300 g soil + 15.42 g charcoal
T1
T5: 300 g soil + 7.71 g sago bark ash
T1
T6: 300 g soil + 15.42 g charcoal + 7.71 g sago bark ash

2.5. Experimental Design and Statistical Analysis

The experimental design used in leaching and buffering capacity studies were Completely Randomized Designed (CRD) in triplicates. Analysis of Variance (ANOVA) was used to test treatment effects whereas means of treatments were compared using Tukey’s Studentized Range (HSD) test at p ≤ 0.05. The Statistical Analysis System (SAS) version 9.4 was used for the statistical tests.

3. Results and Discussion

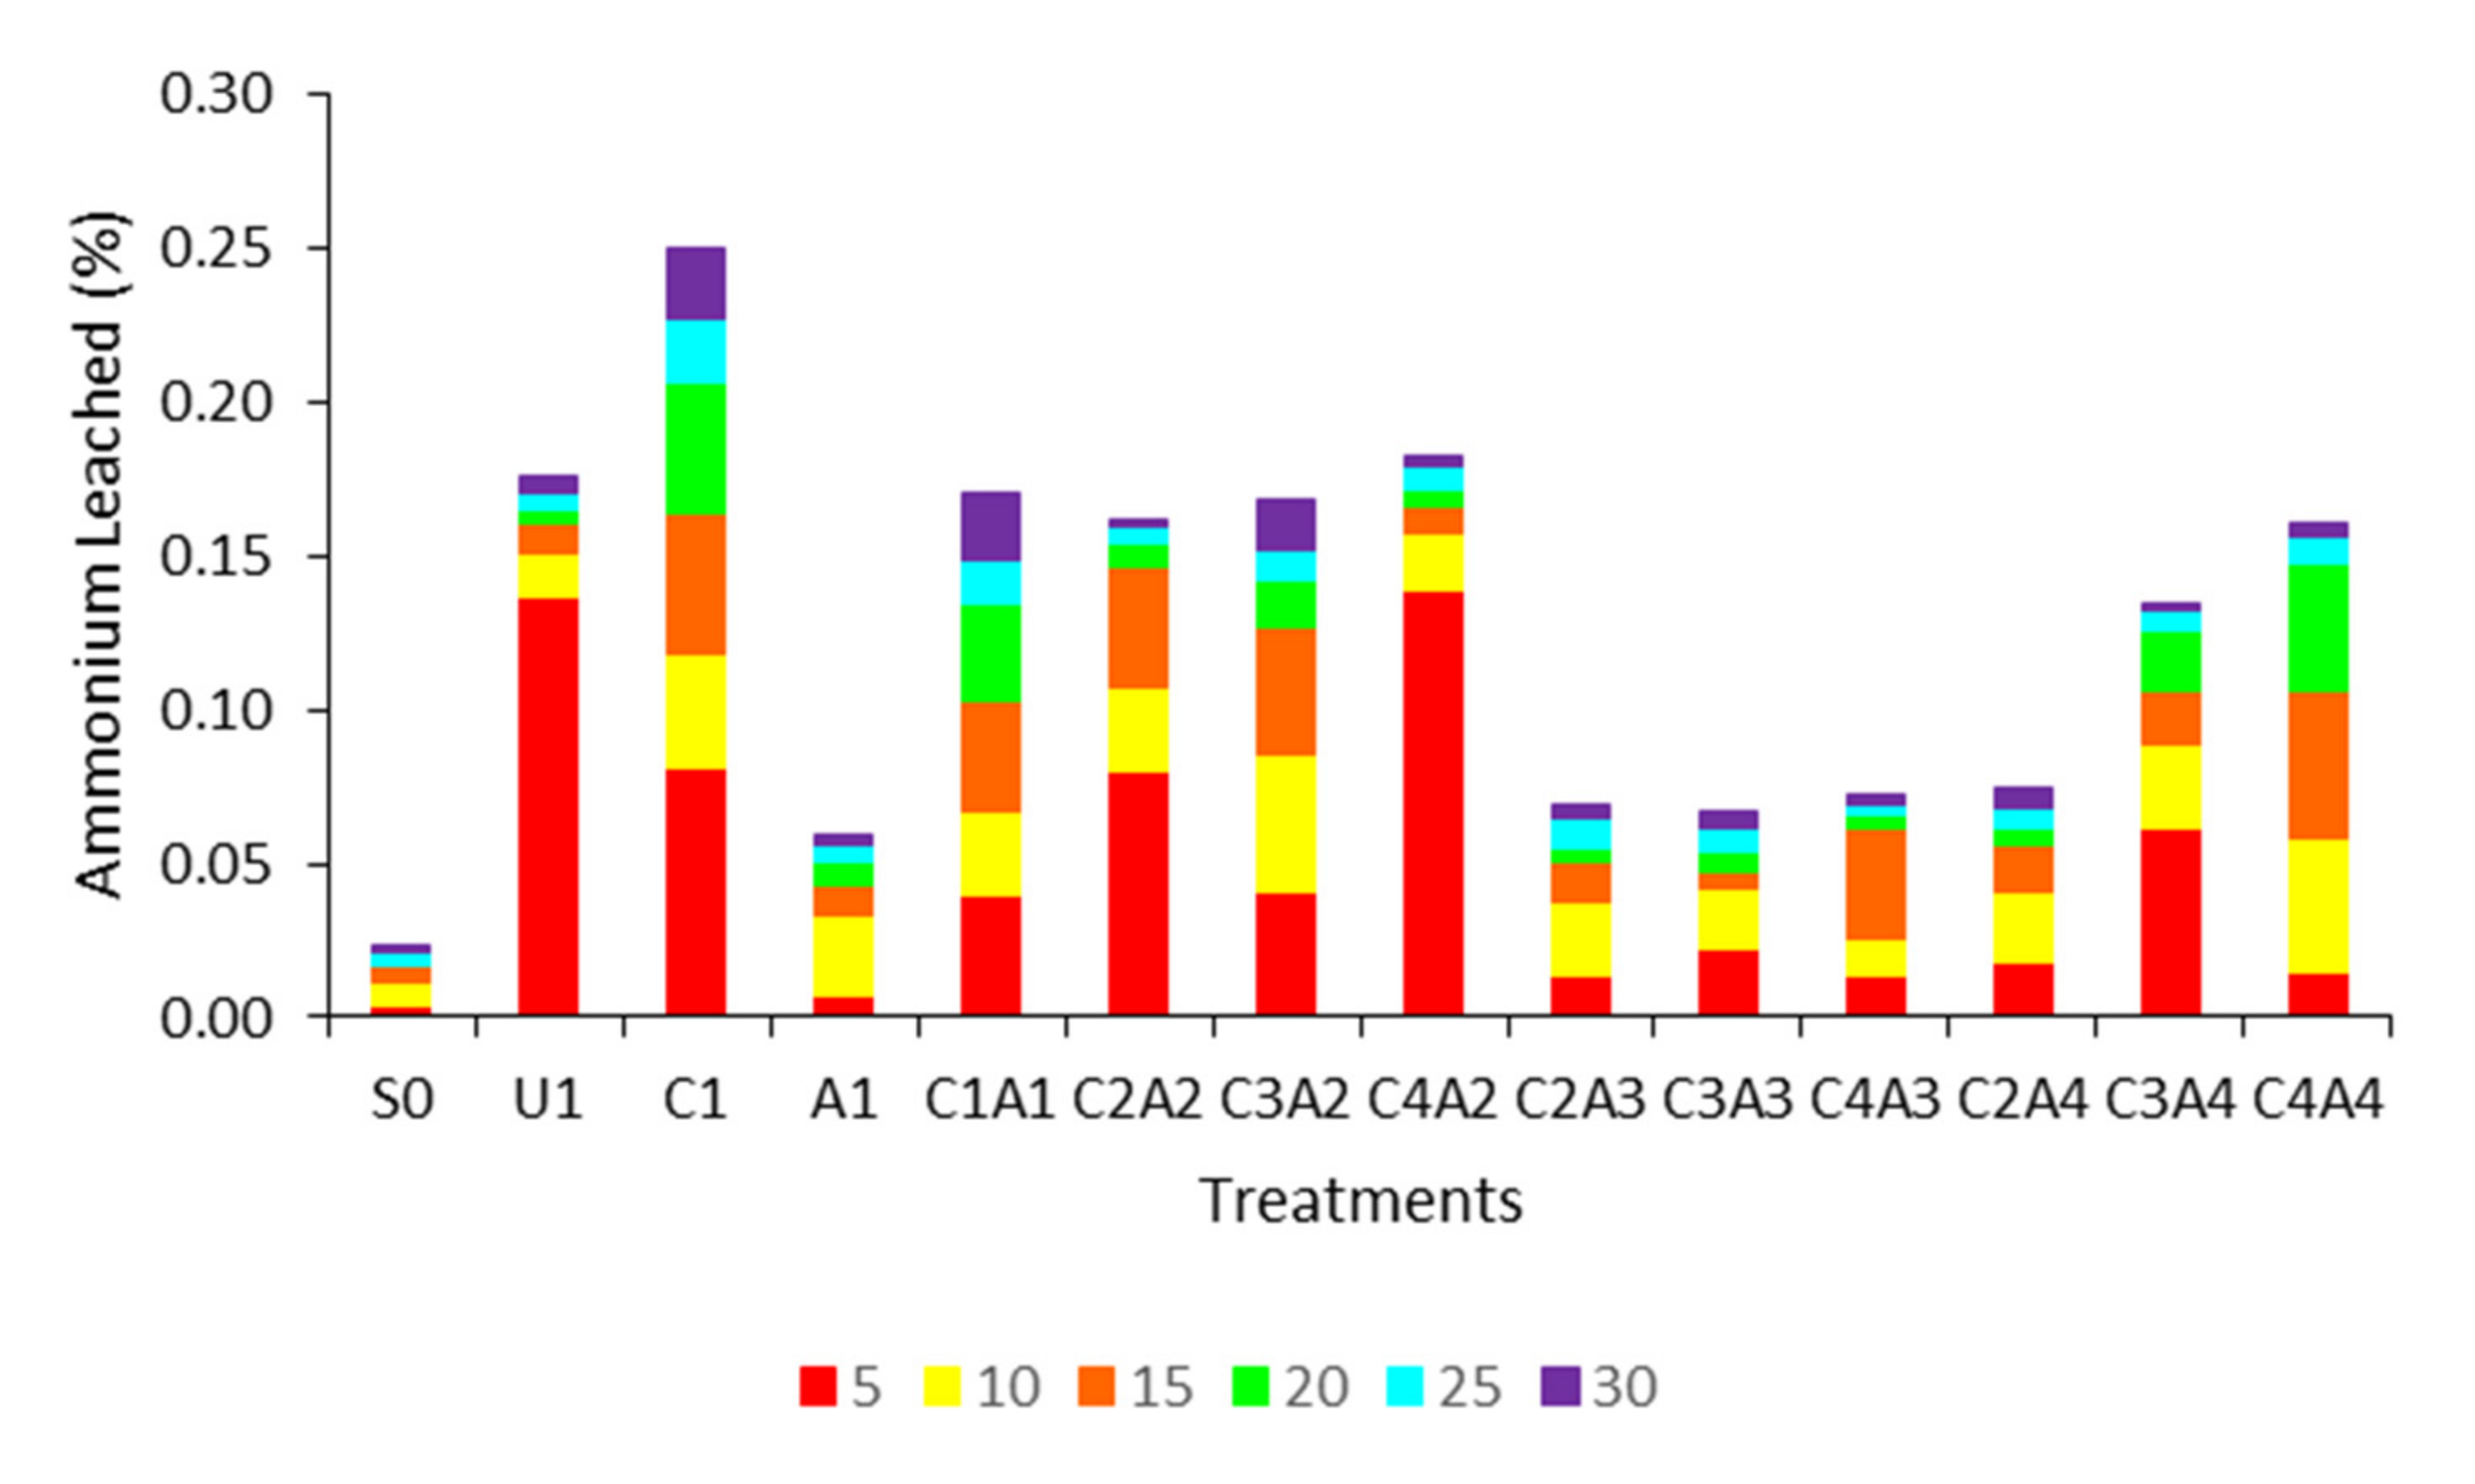
3.1. Treatments Effects on pH, Ammonium, and Nitrate on Leachate Solution at Five Days Interval

Figure 1 demonstrates the effect of combination of charcoal and sago bark ash with urea on pH of the leachates at 5 days interval. Soil without any treatment had the lowest pH of the leachates compared with other treatments with urea because no urea hydrolysis occurred in the soil without treatment but the soils amended with urea underwent urea hydrolysis to release OH [38]. This explain why pH increases as urea hydrolysis increases, because the OH produced during hydrolysis is able to neutralize H+. Besides, the treatments with charcoal and sago bark ash increased the pH of the leachates because the base cations (Ca2+, Mg2+, K+, and Na+) and functional groups, such as carboxylic group, contributed to the increase in pH, and the production of OH also neutralized H+. Furthermore, because of its neutralizing property and soluble base such as K, Ca, and Mg, sago bark ash contributed to the increase in soil pH [39].
At day 5 of leaching, NH4+ loss from urea only (U1) and 25% charcoal with 75% sago bark ash (C4A2) were higher than other treatments evaluated (Figure 2). Throughout the 30 days leaching study, soil only (S0) resulted in the lowest NH4+ leached. Subsequently, there was a general decrease in NH4+ with increasing duration of the leaching study. The cumulative loss of NH4+ over 30 days of leaching is demonstrated in Figure 3. Cumulative loss of NH4+ was the highest for the 100% charcoal (C1) treatment. The combinations of charcoal and sago bark ash such as C2A3, C3A3, C4A3, and C2A4 resulted in lower leached NH4+ compared with U1. The high amount of NH4+ suggests that charcoal only was unable to retain NH4+. This indicates that sago bark ash is required to deprotonate the functional groups of charcoal. Because charcoal is a stable carbonaceous solid residue, the use of charcoal increased the soil’s C content and water holding capacity to alter the physical, chemical, and biological properties of the soil. Increasing soil water availability indirectly affects soil acidification by regulating N cycling ecosystem. This is because high water availability or precipitation increases the rate of N mineralization of soil organic matter [40], which further increases N mineralization and nitrification. When urea is applied to soils, it is transformed to ammonium bicarbonate, which is a natural process caused by urease enzyme. Then NH4+ is converted to NO3 through nitrification [41]. The combination of charcoal and sago bark ash was able to retain NH4+ because the addition of sago bark ash could break the functional groups through the effect of Ca and Mg [42]. The use of charcoal as an amendment resulted in nascent feedbacks because it provides a negatively charged surface to enhance nutrient retention. When charcoal is applied to soils, it decomposes to produce organic compounds such as humic substances and organic acids. These compounds have high affinity for Al and Fe ions. As the soil pH increases, NH4+ is adsorbed to the negative exchange sites because of the deprotonation of the functional groups (carboxyl, phenolic, and hydroxyl).
At day 5 of leaching, NO3 loss from urea only treatment was the highest (Figure 4). The cumulative loss of NO3 over 30 days of leaching is demonstrated in Figure 5. The amount of NO3 leached for the 30 days was highest with urea only (U1) followed by charcoal only (C1). The combinations of charcoal and sago bark ash resulted lower NO3 leached compared with U1. Nitrate ions are more mobile than NH4+ because they are soluble in soil water thus they move with soil water solution. Additionally, they are repelled by the negatively charged soil colloids, which is why they are not easily adsorbed [42]. With the aid of charcoal and sago bark ash pore structure, soil water is trapped inside the pores of these amendments after which the water remains in available form. This finding is also consistent with a report by Kuo et al. [43] who stated that improved soil water holding capacity reduces N leaching. Kasozi et al. [44] observed that organic matter sorption into charcoal surfaces is kinetically limited by slow diffusion into the subnanometer-sized pores that dominate the surfaces. The different organo-mineral interactions result in soil and organic material aggregations which stabilize both soil structure and the C compounds within aggregates. Furthermore, Yoo et al. [7] reported that enhancing aggregate formation by the inclusion of an amendment such as charcoal improved NO3 retention via water holding capacity, thus contributing to the reduction in N leaching.

3.2. Treatments Effects on Selected Soil Chemical Properties after Thirty Days of Leaching

Throughout the 30 days of leaching study, the treatments with urea only (U1), charcoal only (C1), sago bark ash only (A1), and combination of charcoal and sago bark ash (C1A1, C2A2, C3A2, C4A2, C2A3, C3A3, C4A3, C2A4, C3A4, and C4A4) increased the soil pH (KCl) compared with soil only. The treatment with 100% sago bark ash (A1) resulted in the highest pH in KCl (Figure 6). Soil only resulted in the lowest soil pH (KCl) because of its inherent acidic nature (Table 1). Sago bark ash improved soil pH because of its neutralizing properties, abundant soluble base macronutrients, and OH. The functional groups of charcoal (carboxyl, phenolic, and hydroxyl) and sago bark ash also significantly contributed to the increase in the soil pH. Decarboxylation of organic anions such as ash alkalinity of the added amendments consume protons, thus increasing the leachate and soil pH [45]. The high pH buffering capacity of the charcoal and sago bark ash (Table 3) explains the higher soil pH of the treatments with the aforementioned soil amendments. Furthermore, the urea in the treatments partly contributed to the increase in the soil pH. This is because water triggers urea hydrolysis to produce OH ions.
The reduction in soil exchangeable acidity, Al3+, and H+ was related to the increase in the soil pH (Figure 7, Figure 8 and Figure 9). The treatment without urea (S0) resulted in significantly higher soil exchangeable acidity compared with amended treatments (Figure 7). Although co-application of urea with charcoal and sago bark ash resulted in a negligible amount of soil exchangeable Al3+ and did not significantly affect all the treatments, soil only (S0) exchangeable Al3+ was higher (Figure 8). Soil exchangeable H+ demonstrated a similar trend as that for soil exchangeable acidity (Figure 9). The combination of 100% charcoal with 100% sago bark ash (C1A1) significantly decreased soil exchangeable H+ compared with soil only. The increase in soil pH suppressed Al and Fe hydrolysis from producing H+ [46,47] resulting in low recovery of exchangeable Al because the soil amendments were able to chelate exchangeable and soluble Al as insoluble Al on the surfaces of the amendments. This finding is comparable to that of Cai et al. [48] who reported that the addition of amendments with high base cations to acid soils increases soil base saturation. This is because the addition of organic anions in conjunction with urea fertilizer increased soil pH while reducing soil exchangeable acidity. In acidic soils with higher organic matter concentration, exchangeable Al dominates soil exchangeable acidity. Decarboxylation of organic anion resulted in net proton consumption resulting in an increase in soil pH.
The effects of treatments soil total C are presented in Figure 10. There was no significant difference in soil C for S0, U1, and A1 at p ≤ 0.05. The absence of C source in these treatments explains the low soil total C content. The effect of C1 on soil C was similar to those of C2A2, C2A3, and C2A4 despite the latter treatments having a lower amount of charcoal added. This indicates that the addition of ash can compensate the effect of a reduced amount of charcoal on soil total C. The treatments with charcoal demonstrated higher C content because of the recalcitrant C property of the charcoal. Charcoal is made up mainly of C, H, N, S, O, and ash [49]. Kleber et al. [50] reported that the interactions among charcoal, soil, and microorganisms contribute to the C accumulation in soils.

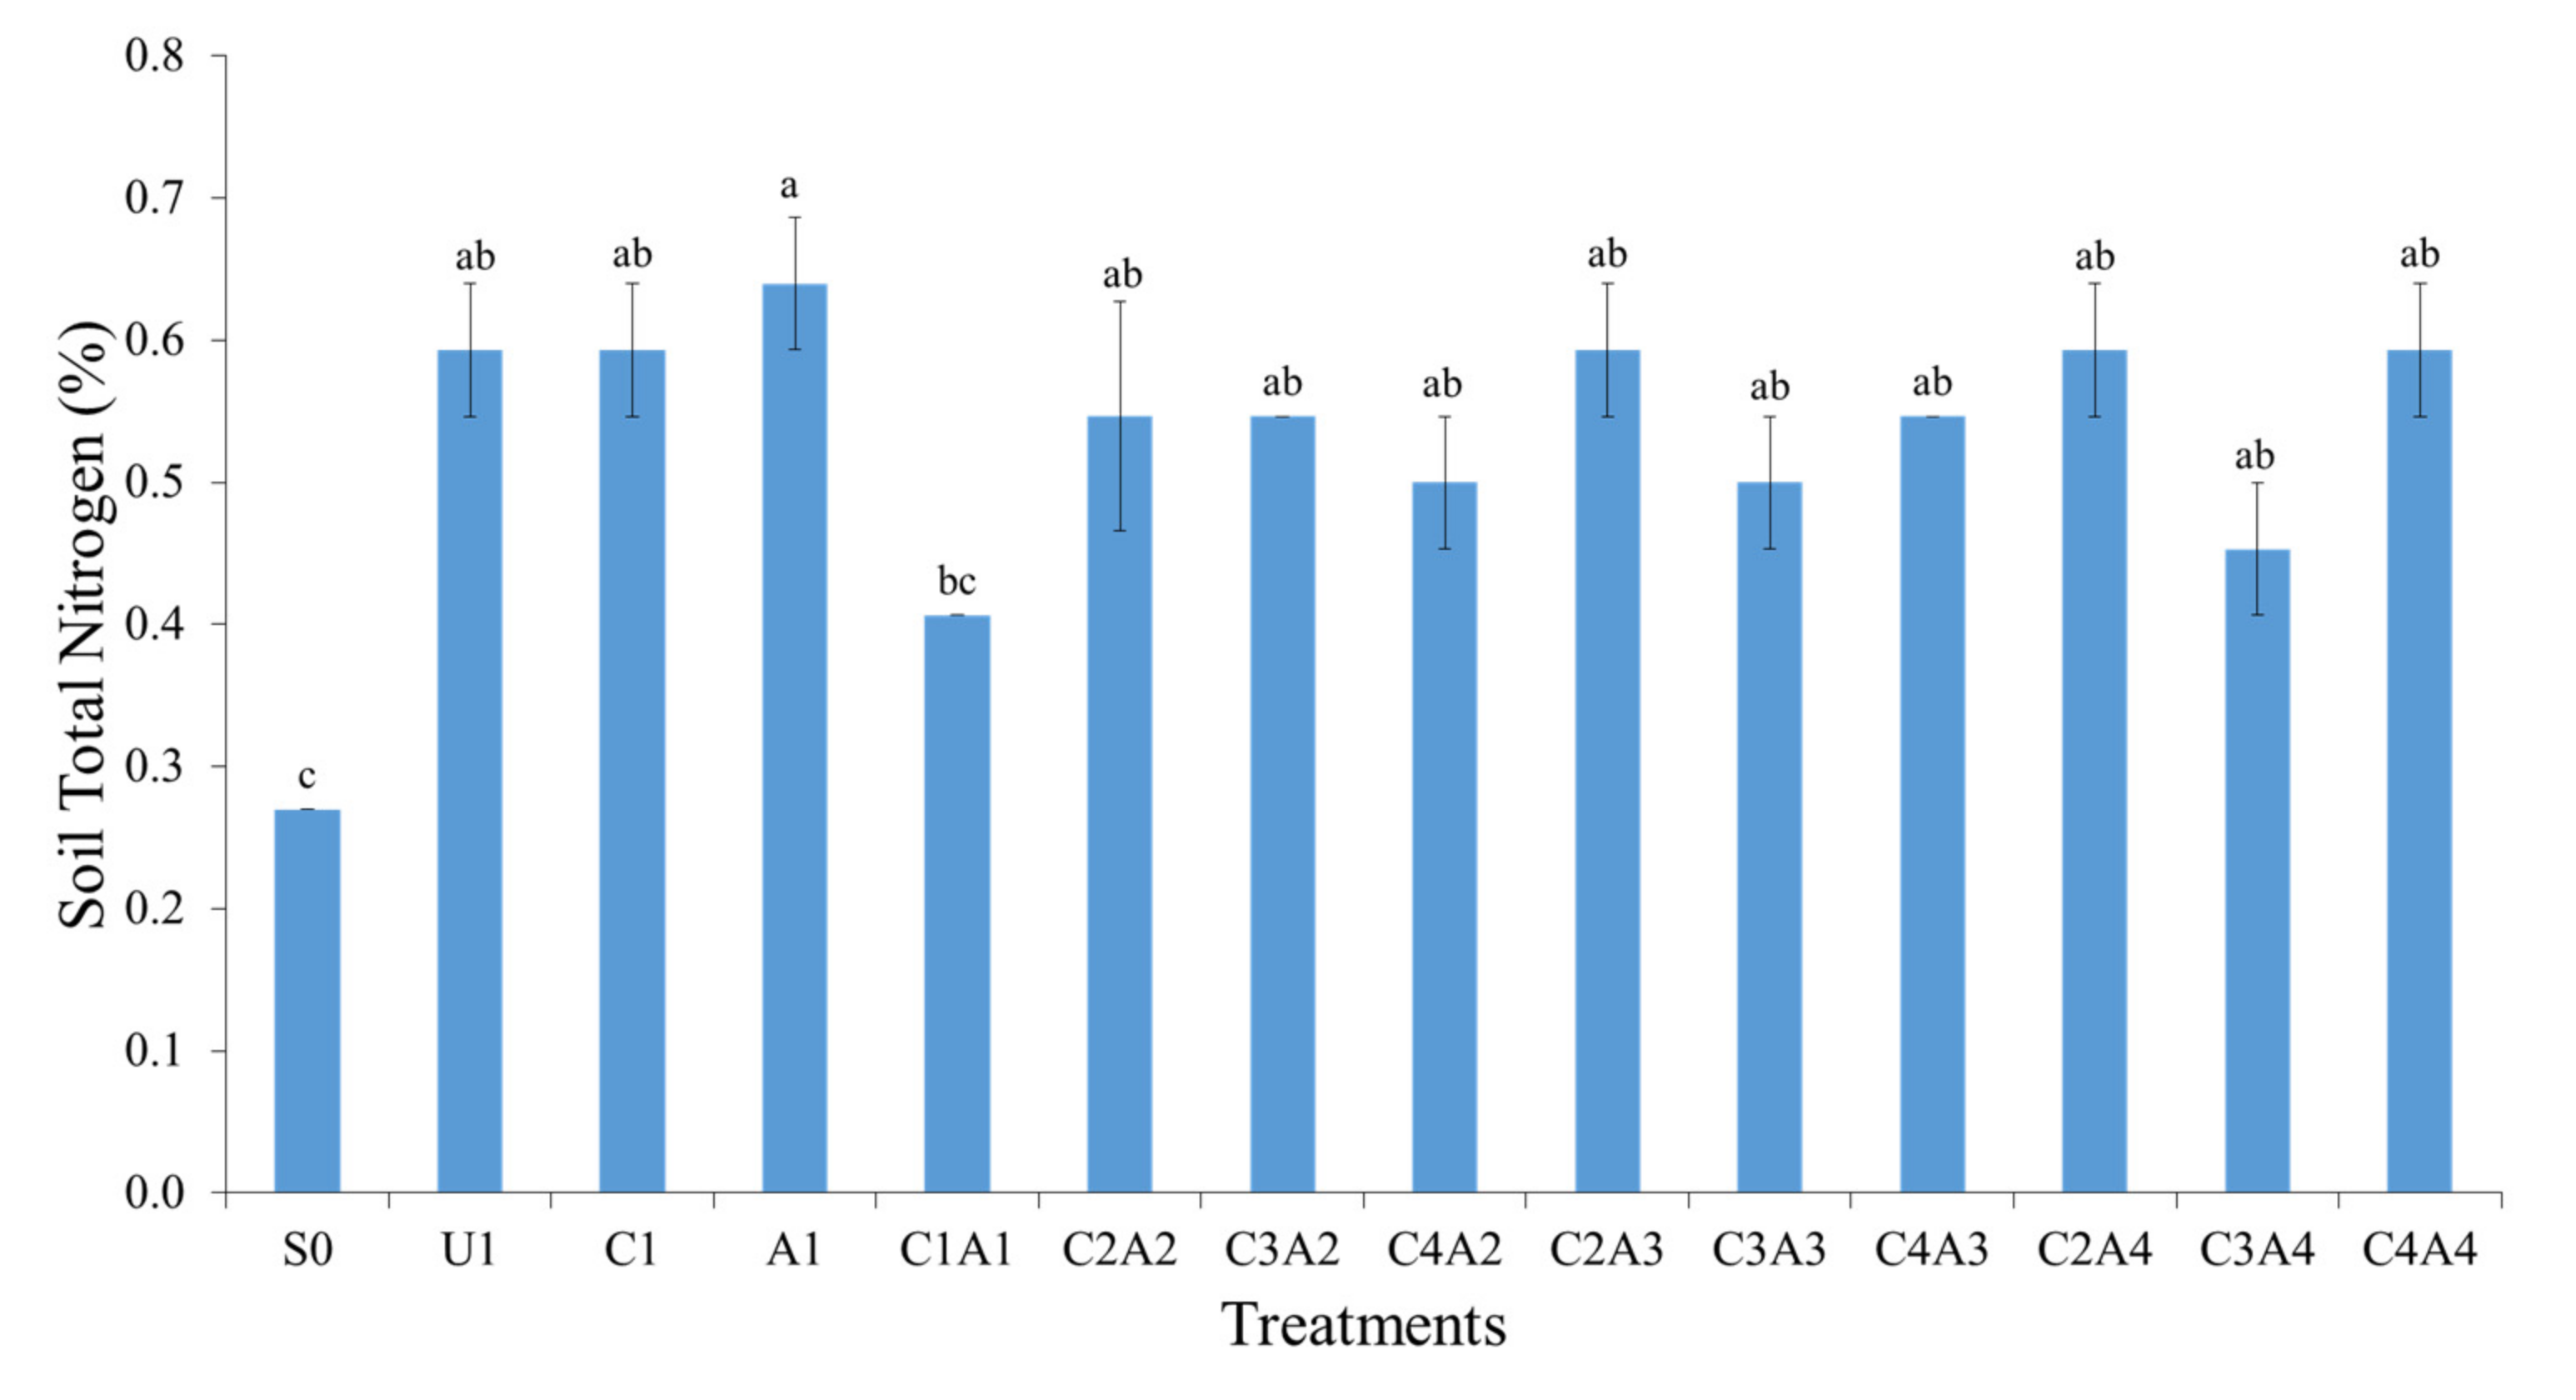
3.3. Treatments Effects on Soil Total Nitrogen, Exchangeable Ammonium, and Available Nitrate after Thirty Days of Leaching

The soil total N after thirty days of leaching is summarized in Figure 11. Soil only had the lowest soil total N, but the effect was similar to C1A1. The retention of soil total N was similar among the treatments with the different combinations of charcoal and sago bark ash, U1, C1, and A1. Although the addition of urea improves total N in soil, total N is composed of organic and inorganic forms of N. Ammonium and NO3 are available forms of N for plant uptake.
The retention of NH4+ in the soil was higher for C4A3 and C3A4 compared with conventional practice (U1) (Figure 12). This finding is comparable to that Bikley et al. [51] who reported that increases in soil pH facilitates organic N transformation into inorganic N such as exchangeable NH4+ in soil solution because of mineralization. The temporary retention of the soil NO3 is demonstrated in Figure 13. The retention of NO3 with conventional practice (U1) was significantly higher compared with S0, C1A1, C4A2, C2A3, C3A3, and C4A3. The inconsistent results of NH4+ and NO3 was because the adsorption of NH4+ and NO3 by the charcoal is not only related to its CEC but it might also be associated with other properties such as pore size and distribution, surface area, and functional groups [52]. Moreover, charcoal varies depending on the raw material [49] from which it is produced. Carbon decomposition and N mineralization are strongly correlated because organic C in soils impacts the mineralization and recycling of C and N. However, this reaction is influenced by several factors including temperature of the soil [53]. The inconsistent results suggest that the effect of charcoal and sago bark ash on leaching of NH4+ and NO3 in soils is not uniform, and it varies by soil and nutrient [54,55], and also soil and amendments interaction. The potential of amendments in NH4+ and NO3 sorption and its transformation such as mineralization or immobilization effect on soil N could be influenced by abiotic and microbiological processes. Therefore, controlling N losses using economical, ecologically friendly, and reliable alternatives such as charcoal and sago bark ash are essential in addressing the problem of soil acidity and constitutes a feasible alternative to the use of lime.

3.4. Charcoal and Sago Bark Ash Effects on Soil pH Buffering Capacity

The effects of soil only (T1), charcoal only (T2), sago bark ash only (T3), soil with charcoal (T4), soil with sago bark ash (T5), and soil with combination of charcoal and sago bark ash (T6) on soil buffering capacity are demonstrated in Table 3. Regardless of the treatment there was a negative linear relationship between buffering capacity and the initial soil pH, with regression coefficient R2 ≥ 0.90 (Figure 14). The pH buffering capacity study of T4, T5, and T6 were higher compared with soil only. Soil only demonstrated the lowest soil pH and buffering capacity. Tropical acid soils often have a relatively low acid buffering capacity because of severe leaching and rapid weathering. Moreover, the pH buffering capacity of the soil was impacted by its low organic matter and CEC. Sago bark ash only (T3) demonstrated the highest initial pH and buffering capacity because of the inherent contents of Ca, Mg, and K of the sago bark ash. However, the pH buffering capacity decreased when it was mixed with soil (T5), but it remained higher than T1. The buffering capacity of charcoal only (T2) was comparable (0.29 mol H+ kg−1 soil) to the combination of charcoal and sago bark ash (T6) because of the high CEC of the charcoal, enabling it to buffer protons in the solution. Additionally, charcoal is a pH buffer because of its acid functional groups such as carboxyl and phenols [56], despite the fact that T2 and T6 had similar pH buffering capacities with higher R2 (0.92) for T6. This finding is consistent with that of Luo et al. [57] who reported that changes in buffering capacity are closely related to properties of the soil such as CEC, carbonates content, and base saturation. Previous studies revealed that at pH > 4.5, soil buffering capacity is governed by acid functional groups, dissolutions of carbonates, and CEC [58,59]. Similar to charcoal, sago bark ash can also buffer pH because of its carbonates and non-acidic exchangeable cations such as K+, Mg2+, and Na+. The addition of sago bark ash to soil causes carbonates to consume added H+ and exchangeable non-acid cations exchange with H+, thus removing it from the solution [57].

4. Conclusions

This study revealed that the combined use of charcoal, sago bark ash, and urea does not only reduce leaching of NH4+ and NO3 but the approach also improves soil pH, total C, and soil exchangeable NH4+ after thirty days of leaching. However, this intervention has minimal effect on soil total N and available NO3. The sago bark ash deprotonates the functional groups of charcoal because of its neutralizing compounds. As a result, the combined use of charcoal and sago bark ash was able to retain NH4+. The utilization of charcoal as an amendment resulted in nascent feedbacks because of its negatively charged surface, which aids in nutrient retention. Decomposition of charcoal in the soil formed organic compounds which have high affinity for Al and Fe ions. This mechanism also enables the amendments to negate pH reduction in soils. In addition, the carbonates in the sago bark ash and charcoal’s functional groups further improved the acid soil’s pH buffering capacity. Therefore, the finding of this study suggest that the optimum rates of charcoal and sago bark ash to retain N in soils are 25% charcoal with 50% sago bark ash (C4A3) and 50% charcoal with 25% sago bark ash (C3A4) because these rates improved soil exchangeable NH4+, soil pH, and soil total C, but reduced exchangeable acidity and amount of NH4+ leached out from the soil. This study will be further evaluated in a pot trial to confirm the findings.

Author Contributions

Conceptualization, N.H.H. and P.P.; methodology, L.O.; validation, O.H.A., L.O. and H.Y.C.; formal analysis, P.D.J.; investigation, N.H.H.; resources, O.H.A.; data curation, N.H.H.; writing—original draft preparation, N.H.H. and P.P.; writing—review and editing, O.H.A., L.O., M.B.J. and H.Y.C.; visualization, N.H.H.; supervision, O.H.A. and M.B.J.; project administration, O.H.A.; funding acquisition, M.B.J. All authors have read and agreed to the published version of the manuscript.

Funding

This research was funded by Ministry of Higher Education, Malaysia with grant number [GP/2018/9622000].

Institutional Review Board Statement

Not applicable.

Informed Consent Statement

Not applicable.

Data Availability Statement

The data presented in this study are available within the article.

Acknowledgments

The authors acknowledge the support of Ministry of Higher Education, Malaysia and Universiti Putra Malaysia for this paper.

Conflicts of Interest

The authors declare no conflict of interest.

References

  1. FAO. Managing Living Soils; Global Soil Partnership International Technical Workshop: Rome, Italy, 2012; pp. 20–25. Available online: http://www.fao.org/documents/card/en/c/d018fe5b-59af-454e-8a27-8c75b671ba37/ (accessed on 15 October 2021).
  2. Hamidi, N.H.; Ahmed, O.H.; Omar, L.; Ch’Ng, H.Y. Soil Nitrogen Sorption Using Charcoal and Wood Ash. J. Agron. 2021, 11, 1801. [Google Scholar] [CrossRef]
  3. Guo, J.H.; Liu, X.J.; Zhang, Y.; Shen, J.L.; Han, W.X.; Zhang, W.F.; Christie, P.; Goulding, K.W.T.; Vitousek, P.M.; Zhang, F.S. Significant Acidification in Major Chinese Croplands. Science 2010, 327, 1008–1010. [Google Scholar] [CrossRef] [Green Version]
  4. Tsiknia, M.; Tzanakakis, V.A.; Oikonomidis, D.; Paranychianakis, N.V.; Nikolaidis, N. Effects of olive mill wastewater on soil carbon and nitrogen cycling. Appl. Microbiol. Biotechnol. 2014, 98, 2739–2749. [Google Scholar] [CrossRef]
  5. Lu, X.K.; Mao, Q.G.; Gilliam, F.S.; Luo, Y.Q.; Mo, J.M. Nitrogen deposition contributes to soil acidification in tropical ecosystems. Glob. Chang. Biol. 2014, 20, 3790–3801. [Google Scholar] [CrossRef] [PubMed]
  6. Yang, Y.; Ji, C.; Ma, W.; Wang, S.; Wang, S.; Han, W.; Mohammat, A.; Robinson, D.; Smith, P. Significant soil acidification across northern China’s grasslands during 1980s–2000s. Glob. Chang. Biol. 2012, 18, 2292–2300. [Google Scholar] [CrossRef]
  7. Yoo, G.; Kim, H.; Chen, J.; Kim, Y. Effects of biochar addition on nitrogen leaching and soil structure following fertilizer ap-plication to rice paddy soil. Soil Sci. Soc. Am. J. 2014, 78, 852–860. [Google Scholar] [CrossRef]
  8. Ulrich, B. Soil acidity and its relations to acid deposition. In Effects of Accumulation of Air Pollutants in Forest Ecosystems; Ulrich, B., Pankrath, J., Eds.; D. Reidel Publishing Company: Dordrecht, The Netherlands, 1983; pp. 127–146. [Google Scholar]
  9. Vet, R.; Artz, R.S.; Carou, S.; Shaw, M.; Ro, C.-U.; Aas, W.; Baker, A.; Bowersox, V.C.; Dentener, F.; Galy-Lacaux, C.; et al. A global assessment of precipitation chemistry and deposition of sulfur, nitrogen, sea salt, base cations, organic acids, acidity and pH, and phosphorus. Atmos. Environ. 2014, 93, 3–100. [Google Scholar] [CrossRef]
  10. Wong, M.T.F.; Webb, M.J.; Wittwer, K. Development of buffer methods and evaluation of pedotransfer functions to estimate pH buffer capacity of highly weathered soils. Soil Use Manag. 2013, 29, 30–38. [Google Scholar] [CrossRef]
  11. Lu, X.; Mao, Q.; Mo, J.; Gilliam, F.S.; Zhou, G.; Luo, Y.; Zhang, W.; Huang, J. Divergent Responses of Soil Buffering Capacity to Long-Term N Deposition in Three Typical Tropical Forests with Different Land-Use History. Environ. Sci. Technol. 2015, 49, 4072–4080. [Google Scholar] [CrossRef]
  12. Tang, C.; Weligama, C.; Sale, P.W.G. Subsurface Soil Acidification in Farming Systems: Its Possible Causes and Management Options. In Molecular Environmental Soil Science; Springer: Amsterdam, The Netherlands, 2013; pp. 389–412. [Google Scholar]
  13. Lieb, A.M.; Darrouzet-Nardi, A.; Bowman, W.D. Nitrogen deposition decreases acid buffering capacity of alpine soils in the southern Rocky Mountains. Geoderma 2011, 164, 220–224. [Google Scholar] [CrossRef]
  14. Jian, J.; Steele, M.K.; Thomas, R.Q.; Day, S.; Hodges, S.C. Constraining estimates of global soil respiration by quantifying sources of variability. Glob. Chang. Biol. 2018, 24, 4143–4159. [Google Scholar] [CrossRef] [PubMed]
  15. Bond-Lamberty, B.; Bailey, V.L.; Chen, M.; Gough, C.M.; Vargas, R. Globally rising soil heterotrophic respiration over recent decades. Nature 2018, 560, 80–83. [Google Scholar] [CrossRef] [PubMed]
  16. Nguyen, T.; Tran, T.T.H. The Contribution of Various Components to pH Buffering Capacity of Acrisols in Southeastern Vietnam. Commun. Soil Sci. Plant Anal. 2019, 50, 1170–1177. [Google Scholar] [CrossRef]
  17. Jiang, J.; Wang, Y.; Yu, M.; Li, K.; Shao, Y.; Yan, J. Responses of soil buffering capacity to acid treatment in three typical subtropical forests. Sci. Total. Environ. 2016, 563, 1068–1077. [Google Scholar] [CrossRef]
  18. Guelfi, D. Stabilized nitrogen fertilizers, slow or controlled release. Inf. Agronômicas 2017, 157, 1–14. [Google Scholar]
  19. Ariyaratne, R.M. Integrated Plant Nutrition Systems (IPNS) training manual (Sri Lanka). Fertil. Advis. Dev. Inf. Netw. Asia Pac. (FADINAP) 2000, 2000, 140. [Google Scholar]
  20. Gul, S.; Whalen, J.K. Biochemical cycling of nitrogen and phosphorus in biochar-amended soils. Soil Biol. Biochem. 2016, 103, 1–15. [Google Scholar] [CrossRef]
  21. Marichelvam, M.; Azhagurajan, A. Removal of mercury from effluent solution by using banana corm and neem leaves activated charcoal. Environ. Nanotechnol. Monit. Manag. 2018, 10, 360–365. [Google Scholar] [CrossRef]
  22. Wang, Y.; Wang, X.; Wang, X.; Liu, M.; Yang, L.; Wu, Z.; Xia, S.; Zhao, J. Adsorption of Pb(II) in aqueous solutions by bamboo charcoal modified with KMnO4 via microwave irradiation. Colloids Surf. 2012, 414, 1–8. [Google Scholar] [CrossRef]
  23. Zhang, Z.; Wang, X.; Wang, Y.; Xia, S.; Chen, L.; Zhang, Y.; Zhao, J. Pb(II) removal from water using Fe-coated charcoal with the assistance of microwaves. Res. J. Environ. Sci. 2013, 25, 1044–1053. [Google Scholar] [CrossRef]
  24. Lv, D.; Liu, Y.; Zhou, J.; Yang, K.; Lou, Z.; Baig, S.A.; Xu, X. Application of EDTA-functionalized bamboo activated carbon (BAC) for Pb(II) and Cu(II) removal from aqueous solutions. Appl. Surf. Sci. 2018, 428, 648–658. [Google Scholar] [CrossRef]
  25. Etiégni, L.; Campbell, A. Physical and chemical characteristics of wood ash. Bioresour. Technol. 1991, 37, 173–178. [Google Scholar] [CrossRef]
  26. Ohno, T. Neutralization of Soil Acidity and Release of Phosphorus and Potassium by Wood Ash. J. Environ. Qual. 1992, 21, 433–438. [Google Scholar] [CrossRef]
  27. Soil Survey Staff. Soil Survey Field and Laboratory Methods Manual. Soil Survey Investigations Report no. 51, Version 2.0.; Burt, R., Staff, S.S., Eds.; U.S. Department of Agriculture, Natural Resources Conservation Service: Lincoln, NE, USA, 2014.
  28. Bouyoucos, G.J. Hydrometer Method Improved for Making Particle Size Analyses of Soils 1. J. Agron. 1962, 54, 464–465. [Google Scholar] [CrossRef]
  29. Peech, M. Hydrogen-Ion Activity. In Agronomy Monographs; John Wiley & Sons: Hoboken, NJ, USA, 2016; Volume 9, pp. 914–926. [Google Scholar]
  30. Rimmer, D.L.; Rodwell, D.L. Soil Science: Methods and Application. J. Ecol. 1995, 83, 352. [Google Scholar] [CrossRef]
  31. Chefetz, B.; Hatcher, P.G.; Hadar, Y.; Chen, Y. Chemical and Biological Characterization of Organic Matter during Composting of Municipal Solid Waste. J. Environ. Qual. 1996, 25, 776–785. [Google Scholar] [CrossRef]
  32. Cotennie, A. Soil and plant testing as a basis of fertilizer recommendation. FAO Soil Bull. 1980. (No. 38/2). [Google Scholar]
  33. Bremner, J.M. Total nitrogen. In Methods of Soil Analysis: Part 2 Chemical and Microbiological Properties; Norman, A.G., Ed.; Inc. Publisher: Madison, WI, USA, 1965; Volume 9, pp. 1149–1178. [Google Scholar]
  34. Keeney, D.R.; Nelson, D.W. Nitrogen—Inorganic forms. In Methods of Soil Analysis: Part 2 Chemical and Microbiological Properties 9.2.2, 2nd ed.; John Wiley & Sons: Hoboken, NJ, USA, 1983; Volume 9, pp. 643–698. [Google Scholar] [CrossRef]
  35. Paramananthan, S. Soils of Malaysia: Their Characteristics and Identification; Academy of Sciences Malaysia: Lumpur, Malaysia, 2000; Volume 1. [Google Scholar]
  36. Malaysian Agricultural Research and Development Institute (MARDI). Jagung Manis Baru, Masmadu (New Sweet Corn, Masmadu); Malaysian Agricultural Research and Development: Serdang, Malaysia, 1993; pp. 3–5.
  37. Costello, R.C.; Sullivan, D.M. Determining the pH Buffering Capacity of Compost Via Titration with Dilute Sulfuric Acid. Waste Biomass Valorization 2014, 5, 505–513. [Google Scholar] [CrossRef]
  38. Xu, J.M.; Tang, C.; Chen, Z.L. The role of plant residues in pH change of acid soils differing in initial pH. Soil Biol. Biochem. 2006, 38, 709–719. [Google Scholar] [CrossRef]
  39. Demeyer, A.; Nkana, J.V.; Verloo, M. Characteristics of wood ash and influence on soil properties and nutrient uptake: An overview. Bioresour. Technol. 2001, 77, 287–295. [Google Scholar] [CrossRef]
  40. Nielsen, U.N.; Ball, B. Impacts of altered precipitation regimes on soil communities and biogeochemistry in arid and semi-arid ecosystems. Glob. Chang. Biol. 2014, 21, 1407–1421. [Google Scholar] [CrossRef] [PubMed]
  41. De Datta, S.K. Nitrogen transformation processes in relation to improved cultural practices for lowland rice. Plant Soil 1987, 100, 47–69. [Google Scholar] [CrossRef]
  42. Pitman, R.M. Wood ash use in forestry—A review of the environmental impacts. For. Int. J. For. Res. 2006, 79, 563–588. [Google Scholar] [CrossRef] [Green Version]
  43. Kuo, Y.-L.; Lee, C.-H.; Jien, S.-H. Reduction of Nutrient Leaching Potential in Coarse-Textured Soil by Using Biochar. Water 2020, 12, 2012. [Google Scholar] [CrossRef]
  44. Kasozi, G.N.; Zimmerman, A.; Nkedi-Kizza, P.; Gao, B. Catechol and Humic Acid Sorption onto a Range of Laboratory-Produced Black Carbons (Biochars). Environ. Sci. Technol. 2010, 44, 6189–6195. [Google Scholar] [CrossRef]
  45. Omar, L.; Ahmed, O.H.; Majid, N.M.A. Improving Ammonium and Nitrate Release from Urea Using Clinoptilolite Zeolite and Compost Produced from Agricultural Wastes. Sci. World J. 2015, 2015. [Google Scholar] [CrossRef] [PubMed]
  46. Thomas, G.W.; Hargrove, W.L. The Chemistry of Soil Acidity. Agron. Monogr. 2015, 12, 3–56. [Google Scholar] [CrossRef]
  47. Ritchie, G.S.P. Role of dissolution and precipitation of minerals in controlling soluble aluminium in acidic soils. Adv. Agron. 642 1994, 53, 47–83. [Google Scholar] [CrossRef] [Green Version]
  48. Cai, Z.; Xu, M.; Zhang, L.; Yang, Y.; Wang, B.; Wen, S.; Misselbrook, T.H.; Carswell, A.M.; Duan, Y.; Gao, S. Decarboxylation of organic anions to alleviate acidification of red soils from urea application. J. Soils Sediments 2020, 20, 3124–3135. [Google Scholar] [CrossRef]
  49. Demirbas, A.; Ahmad, W.; AlAmoudi, R.; Sheikh, M. Sustainable charcoal production from biomass. Energy Sources Part A Recover. Util. Environ. Eff. 2016, 38, 1882–1889. [Google Scholar] [CrossRef]
  50. Kleber, M.; Sollins, P.; Sutton, R. A conceptual model of organo-mineral interactions in soils: Self-assembly of organic molecular fragments into zonal structures on mineral surfaces. Biogeochemistry 2007, 85, 9–24. [Google Scholar] [CrossRef]
  51. Binkley, D.; Bell, R.; Sollins, P. Comparison of methods for estimating soil nitrogen transformations in adjacent conifer and alder-conifer forests. Can. J. For. Res. 1992, 22, 858–863. [Google Scholar] [CrossRef]
  52. Yang, J.; Li, H.; Zhang, D.; Wu, M.; Pan, B. Limited role of biochars in nitrogen fixation through nitrate adsorption. Sci. Total. Environ. 2017, 592, 758–765. [Google Scholar] [CrossRef]
  53. Jin, Z.; Chen, X.; Chen, C.; Tao, P.; Han, Z.; Zhang, X. Biochar impact on nitrate leaching in upland red soil, China. Environ. Earth Sci. 2016, 75, 1–10. [Google Scholar] [CrossRef]
  54. Tang, S.; Cheng, W.; Hu, R.; Nakajima, M.; Guigue, J.; Kimani, S.M.; Sato, S.; Tawaraya, K.; Xu, X. Decomposition of soil organic carbon influenced by soil temperature and moisture in Andisol and Inceptisol paddy soils in a cold temperate region of Japan. J. Soils Sediments 2017, 17, 1843–1851. [Google Scholar] [CrossRef]
  55. Clough, T.J.; Condron, L.M.; Kammann, C.; Muller, C.W. A Review of Biochar and Soil Nitrogen Dynamics. Agronomy 2013, 3, 275–293. [Google Scholar] [CrossRef] [Green Version]
  56. Yao, Y.; Gao, B.; Zhang, M.; Inyang, M.; Zimmerman, A. Effect of biochar amendment on sorption and leaching of nitrate, ammonium, and phosphate in a sandy soil. Chemosphere 2012, 89, 1467–1471. [Google Scholar] [CrossRef] [PubMed]
  57. Luo, W.T.; Nelson, P.N.; Li, M.-H.; Cai, J.P.; Zhang, Y.Y.; Yang, S.; Wang, R.Z.; Wang, Z.W.; Wu, Y.N.; Han, X.G.; et al. Contrasting pH buffering patterns in neutral-alkaline soils along a 3600 km transect in northern China. Biogeosciences 2015, 12, 7047–7056. [Google Scholar] [CrossRef] [Green Version]
  58. Bloom, P.R. Soil pH and pH buffering. In Handbook of Soil Science; Sumner, M.E., Huang, P.M., Li, Y., Eds.; CRC Press: Boca Raton, FL, USA, 2000; pp. 333–352. [Google Scholar]
  59. Nelson, P.N.; Su, N. Soil pH buffering capacity: A descriptive function and its application to some acidic tropical soils. Soil Res. 2010, 48, 201–207. [Google Scholar] [CrossRef]
Figure 1. Treatments effects on pH of leachate over thirty days of leaching.
Sustainability 13 11808 g001
Figure 2. Treatments effects on ammonium availability in leachate over thirty days of leaching.
Sustainability 13 11808 g002
Figure 3. Cumulative amounts of ammonium leached over thirty days of leaching.
Sustainability 13 11808 g003
Figure 4. Treatments effects on nitrate availability in leachate over thirty days of leaching.
Sustainability 13 11808 g004
Figure 5. Cumulative amounts of nitrate leached over thirty days of leaching.
Sustainability 13 11808 g005
Figure 6. Treatments effects on soil pH in potassium chloride after thirty days of leaching. Means with different letter(s) indicate significant differences between treatments according to Tukey’s HSD test at p ≤ 0.05, that is a > b > c. Bars represent the mean values ±SE of triplicates.
Sustainability 13 11808 g006
Figure 7. Treatments effects on soil exchangeable acidity after thirty days of leaching. Means with different letter(s) indicate significant differences between treatments according to Tukey’s HSD test at p ≤ 0.05, that is a > b > c > d. Bars represent the mean values ±SE of triplicates.
Sustainability 13 11808 g007
Figure 8. Treatments effects on soil exchangeable aluminium after thirty days of leaching. Bars represent the mean values ±SE of triplicates. Note: (nd = not determined).
Sustainability 13 11808 g008
Figure 9. Treatments effects on soil exchangeable hydrogen after thirty days of leaching. Means with different letter(s) indicate significant differences between treatments according to Tukey’s HSD test at p ≤ 0.05, that is a > b > c > d. Bars represent the mean values ±SE of triplicates.
Sustainability 13 11808 g009
Figure 10. Treatments effects on soil total carbon after thirty days of leaching. Means with different letter(s) indicate significant differences between treatments according to Tukey’s HSD test at p ≤ 0.05, that is a > b > c > d > e > f > g. Bars represent the mean values ±SE of triplicates.
Sustainability 13 11808 g010
Figure 11. Treatments effects on soil nitrogen after thirty days of leaching. Means with different letter(s) indicate significant differences between treatments according to Tukey’s HSD test at p ≤ 0.05, that is a > b > c. Bars represent the mean values ±SE of triplicates.
Sustainability 13 11808 g011
Figure 12. Treatments effects on soil exchangeable ammonium after thirty days of leaching. Means with different letter(s) indicate significant differences between treatments according to Tukey’s HSD test at p ≤ 0.05, that is a > b > c > d > e. Bars represent the mean values ±SE of triplicates.
Sustainability 13 11808 g012
Figure 13. Treatments effects on soil available nitrate after thirty days of leaching. Means with different letter(s) indicate significant differences between treatments according to Tukey’s HSD test at p ≤ 0.05, that is a > b > c > d. Bars represent the mean values ±SE of triplicates.
Sustainability 13 11808 g013
Figure 14. Relationships between acid addition and pH change.
Sustainability 13 11808 g014
Table 1. Selected physico-chemical properties of the soil used in the leaching and buffering capacity studies.
PropertyCurrent Study
pH (H2O)4.61
pH (KCl)3.95
EC (µS cm−1)35.10
Bulk density (g cm−3)1.25
Total C (%)2.16
Total N (%)0.08
Exchangeable NH4+ (%)0.00049
Available NO3 (%)0.00049
CEC (cmol kg−1)4.67
Exchangeable K+ (cmol kg−1)0.06
Exchangeable Ca2+ (cmol kg1−)0.02
Exchangeable Mg2+ (cmol kg−1)0.22
Exchangeable Na+ (cmol kg−1)0.03
Exchangeable Fe2+ (cmol kg−1)1.09
Exchangeable Mn2+ (cmol kg−1)0.01
Total titratable acidity (cmol kg−1)1.15
Exchangeable H+ (cmol kg−1)0.13
Exchangeable Al3+ (cmol kg−1)1.02
Soil textureSand (%): 71.9
Silt (%): 13.5
Clay (%): 14.6
Sandy loam
Note: The values given are on dry-weight basis.
Table 2. Initial characterization for selected chemical properties of charcoal and sago bark ash used in the leaching and buffering capacity studies.
PropertyCharcoalSago Bark Ash
pH (H2O)7.749.99
pH (KCl)7.319.66
EC (dS m−1)0.275.75
Total N (%)1.541.37
Exchangeable NH4+ (%)0.000230.00026
Available NO3 (%)0.000230.00026
Exchangeable K+ (cmol kg−1)3.6723.33
Exchangeable Ca2+ (cmol kg−1)11.7116.77
Exchangeable Mg2+ (cmol kg−1)3.373.57
Exchangeable Na+ (cmol kg−1)0.431.51
Exchangeable Fe2+ (cmol kg−1)0.150.03
Table 3. Effects of treatments on initial pH and pH buffering capacity.
TreatmentsInitial pHpH Buffering Capacity (mol H+ kg−1 Soil)Regression Coefficient (R2)
T15.310.250.92 *
T27.760.290.90 *
T39.780.340.92 *
T46.510.260.97 *
T56.410.280.93 *
T66.650.290.92 *
Note: Asterisk (*) represent significant difference at p ≤ 0.05.
Publisher’s Note: MDPI stays neutral with regard to jurisdictional claims in published maps and institutional affiliations.

