Review

Development of Ecosystem Health Assessment (EHA) and Application Method: A Review

1
School of Environmental Science and Engineering, Tianjin University, Tianjin 300072, China
2
Tianjin Engineering Center for Technology of Protection and Function Construction of Ecological Critical Zone, Tianjin 300072, China
3
School of Chemical Engineering and Technology, Tianjin University, Tianjin 300072, China
*
Author to whom correspondence should be addressed.
Sustainability 2021, 13(21), 11838; https://doi.org/10.3390/su132111838
Submission received: 15 August 2021 / Revised: 13 October 2021 / Accepted: 23 October 2021 / Published: 26 October 2021
(This article belongs to the Special Issue Ecological Assessment and Management Strategy for Aquatic Ecosystems)

Abstract

:
Human industrialization has caused damage to ecosystems. In this context, researchers have developed several methods to assess the health of various types of ecosystems. In this paper, we evaluated the developmental history and status of ecosystem health (EH) and summarized the concept of EH. We also reviewed ecosystem health assessment (EHA) methods and analyzed the application of EHA methods. EHA methods are generally classified into biological indicator and index system method. The former method is mainly based on the number of dominant species, such as diatom, plankton, and macroinvertebrate. Results indicate that trophic diatom index (TDI), plankton index of biotic integrity (P-IBI), and Ephemeroptera, Plecoptera, and Trichoptera (EPT) are the most commonly used indices. The latter method combines multiple ecosystem metrics and reflects ecosystem processes. The pressure–state–response (PSR) model most commonly uses the index system method. For the application of EHA methods, biological indicator methods are mostly applied in rivers/streams ecosystem, while the index system is primarily involved in urban ecosystems. Therefore, the information presented in this review may be helpful for the modification of EHA methods.

1. Introduction

With the development of industrial civilization, the increase in pollution has severely affected the natural environment [1,2]. According to the assessment results of the Millennium Ecosystem Assessment project, human activities have significantly altered several ecosystems on Earth in the last 50 years of the 20th century [3]. The status of ecosystem health is closely related to sustainable human development [4], and natural ecosystems provide the materials and services needed for human survival [5]. When disturbances reduce or exceed the regulatory capacity of the system itself, the ecosystem also limits the sustainable growth of human well-being by providing lower-quality ecosystem services [6]. Maintaining ecosystem health is the primary factor in achieving sustainable socio-economic development. Consequently, the assessment of the overall health of ecosystems is of great significance.
The assessment of the ecosystem has helped us to understand the degree of the persecution of the ecosystem, identify the pollutants flowing into the ecosystem, and prevent contaminants from increasing pollution [7,8]. These pollutants would affect the development of organisms in the ecosystem and lead to toxic effects on organisms that are exposed to them [9]. For example, diatoms [10,11], planktons [12,13,14], and macroinvertebrates [15,16] can characterize heavy metals (Zn, Cu, Hg, and AS), microplastics, and organic pollutants in the ocean. In addition, EHA helps to understand the impact of EH on the human living environment, which is embodied in population, economy, and social responses [17,18]. Ecosystem services reflect the interdependent relationship between human beings and ecosystems, which is critical for ecosystem health [19,20]. When ecosystems deteriorate, ecosystem services and functions are significantly reduced, reducing their social and economic benefits to a considerable extent [20,21,22]. Moreover, the health assessment of ecosystems provides a scientific basis for managers to improve scientific management [23], which is helpful to build sustainable livelihoods [24]. When confronted with different types of ecosystems, decision-makers make and manage decisions according to their goals. In natural ecosystems, the corresponding adjustment of the ecosystem is mainly based on the pollution level [25,26]. In the urban ecosystem, decisions are based on sustainability to maximize social and natural benefits [27,28].
This study examines the developmental history and developmental status of EH. It summarizes the current popular keywords and studies conducted by famous scholars in the field of research. We also reviewed the assessment methods of EH, which were classified into two ways. One of the methods is the biological indicator method, which mostly utilizes metrics or indexes of selected indicator organisms such as diatoms, plankton, and macroinvertebrates to characterize the ecosystem’s health. The present study collected and analyzed the indexes of the above three commonly used indicator organisms. The other method is the index system method, which utilizes large-scale economic and social metrics, combines other metrics, determines weights, and thus forms a comprehensive index to assess the ecosystem’s health. Comparisons between the two methods are presented in Table S1. In addition, the application of the EHA method is reviewed and analyzed.

2. The Development of Ecosystem Health

2.1. Brief History of Ecosystem Health

EH development can be divided into three periods (Figure S1). The first stage is the ideology enlightenment. As early as 1941, Leopold put forward the concept of “Land health” based on the idea of medical health [29]. The Soil and Health Association of New Zealand was established in the same year, resulting in being the first academic organization to implement EH as the research target [30]. In the 1970s, due to the development of stress ecology, researchers studied ecosystem services and ecosystem functions [31,32,33,34], laying the foundation for the proposal of EH.
The second stage is the proposal of concept. Researchers discussed the concept of EH from 1980 to 1990. The general development of this stage is presented in Table S2. In the past, researchers have mainly tried to explain the health of the ecosystem in two aspects. From a process perspective, researchers explain the ecosystem’s stress and responsiveness by analyzing how the ecosystem changes from a normal state to an abnormal state. From the perspective of results, researchers pay attention to the damaged state of the ecosystem and focus on using physiology to describe the syndrome of an unhealthy ecosystem. The views of some representative researchers are summarized in Table S3. In addition, we give our definition of EH: “an ecosystem that is of great biodiversity, able to resist natural and man-made disturbances, maintain structural integrity, be self-sustaining and renewing, meet the reasonable needs of people, and serve society”.
The third stage is the development of EH. Here, the research focus shifted to methods of EHA. The general development of this stage is presented in Table S4. As early as the concept stage, researchers used ecological indicators to assess ecosystem status [35]. However, early research was limited by conditions and operability, and the results have no greater scientific significance for environmental management. For example, in an aquatic ecosystem, when there are enough species of organisms at the same trophic level, fluctuations in the number of a single organism at the same trophic level will not have much impact on the entire ecosystem [36,37]. Researchers have been working on the innovation of assessment methods for different types of ecosystems.

2.2. Research on EHA in 21st Century

In the 21st century, researchers improved and innovated assessment methods and conducted case studies in a wide range of ecosystems, including aquatic and terrestrial ecosystems. In the present study, the Web of Science core database was used to perform bibliographic retrieval on “ecosystem health assessment” in the last 20 years of the 21st century. The retrieval results were analyzed using VosViewer (version 1.6.16). Here are the search criteria: TS = ((“ecosystem health”) AND (evaluate* OR assess*)), database: core collection of Web of Science, language: English, paper type: Article, time: 2000–2020. The title, abstract, keywords, and authors of 1750 publications were recorded and reviewed. The number of articles published each year is shown in Figure S2. In particular, the number of articles in 2013 increased by 64% compared to the previous year. The number of articles published in 2020 decreased compared to 2019, which may be due to the impact of COVID-19.
The 1750 retrieval results were analyzed using the keyword co-occurrence in VosViewer. In the data preprocessing, the occurrence frequency was set to ten to screen 9858 keywords. A total of 268 keywords met the condition, and were cleaned according to the following criteria: keywords with different formats but the same nouns are removed (e.g., “water quality” and ”water-quality”); single and plural nouns are removed (e.g., ”bioindicators”, “bioindicators”, and “biological indicators”); meaningless keywords are removed (e.g., “challenge”); keywords with the same meaning but different spelling were removed (e.g., “Estuarine” and “Estuary”). Ultimately, 231 keywords were determined. The co-occurrence analysis results were shown in Figure 1a. As observed from the figure, the 231 keywords were divided into five clusters, with different colors representing different clusters. The highest occurrence frequency is “ecosystem health”, which appeared 305 times. Except ecosystem health, the term “management” appears in the most in the publications. The overall clustering effect is not apparent, indicating that there was no significant degree of classification in the research in this field. Researchers mainly conduct ecological research (such as biodiversity and management) and toxicology research (contaminant and metal). Each cluster presents a tendency of overlapping, and the keywords are closely related, indicating that the study in this direction is comprehensive.
The 1750 retrieval results were analyzed in VosViewer for the co-citation of authors. In the data preprocessing, the citation frequency was set to 25 to screen 54093 authors. A total of 165 articles met the condition. The data were cleaned as follows: the authors with the wrong format but the same author name (such as “*EPA” and “US, EPA”) were merged; the abbreviated names of the authors and the full names of the authors (such as “Costanza, R” and “Costanza, Robert”) were merged. As a result, 157 results were determined, and the co-cited analysis results are shown in Figure 1b. The 157 authors are divided into 6 clusters. The authors with the highest citation frequency are “Rapport, DJ”, whose article has been cited 356 times in total. The authors with the closest connection are “Jorgensen, Se” and “Xu, Fl”. At the same time, the fact that “Rapport, DJ” and “Costanza, Robert” often collaborate academically is also proved by this figure, as the intensity of co-citation between the two authors is 478. Five authors who have made significant contributions to this field are visible in the figure: “Karr, JR”, “US, EPA” (US Environmental Protection Agency), “Rapport, DJ”, “Costanza, Robert”, and “Jorgensen, Se”. These results reduce the blindness of reading literature and provide a basis for researchers to quickly understand the development of this field.

3. EHA Methods

Researchers have developed many methods for the health assessment of various environmental ecosystems, including aquatic and terrestrial ecosystems. Generally, two major assessment methods exist. The first method is the biological indicator method, which is mainly based on the number of dominant species, key species, and sensitive species in the community to analyze the environmental changes and assess the health of the natural ecosystem [38]. The second method is the index system method. This method integrates a large amount of complex information. It combines biochemistry, ecology, economics, and other disciplines to screen out appropriate comprehensive metrics, establish an index system, and comprehensively assess the EH [5,24,39].

3.1. Biological Indicator Method

3.1.1. Benthic Diatoms

In temperate regions, aquatic systems are formed by various communities. However, diatom species play a vital role in these communities [40]. These species are often utilized as water quality indicator organisms, which can significantly reflect the biological integrity of the study area and the anthropogenic stressors affecting EH [41]. Diatoms respond quickly to the physical and chemical characteristics of the aquatic system [42]. Herein, DO, turbidity, nitrate, and phosphate levels were found to be significantly correlated to the diatom index (R > 0.9) [43]. Diatoms are considered more efficient than other communities because their production time is shorter than that of fish and macroinvertebrates [44]. Compared with other organisms, the diatom community structure provides a time-integrated indication of water quality composition [45]. Furthermore, the major advantage of diatoms is that most diatom species have a wide geographic distribution and universal applicability [46,47,48]. In China [49], South Africa [50], Turkey [51], Brazil [45], the United Kingdom [52], and the United States [53] there are cases of using diatoms as indicator organisms to assess ecosystem health. The integrity of these communities provides a straightforward but not an overall measure of the ecosystem, which further reflects the pollution of the ecosystem [54].
Owing to the diatom size and living conditions, the diatom index is widely used [55]. Diatom indices are based on ecological metrics, such as species abundance and diversity index, and use the formula to calculate the new index [56]. Half of the published papers about diatoms studied the diatom index [55]. Therefore, the biological diatom index is a key point in diatom research. Table S5 presents 38 diatom indices of the studies that were reviewed in this study. All the publications were relatively highly cited references which were published since 2000. It can be observed from the table that the Trophic Diatom Index (TDI) is the most commonly used, appearing 16 times in the table. It is worth noting that the index of biological integrity based on diatoms is also often implemented by researchers. The individual ecological index based on diatoms and IBI are two basic methods for evaluating the environmental conditions of rivers and streams using diatoms [57]. In terms of research areas, the diatom index has global applications. The most important application areas are concentrated in Europe, which appears ten times in the table, along with various countries in Europe which have applied the diatom index for EHA. China and North America are also popular areas of research. As for metrics, species abundance is the most used metric in the diatom index, which suggests that the biggest difference between the reference point and the damage point was species abundance. The results are shown in Figure 2a.

3.1.2. Plankton

Plankton is utilized to assess the health of aquatic ecosystems, such as lakes, rivers, and reservoirs. Plankton is a collection of species that mostly includes phytoplankton and zooplankton. Phytoplanktons are the most critical aquatic organism in aquatic ecosystems [58]. Phytoplanktons are at the first trophic level and absorb light energy for energy transfer and material transformation [59]. Their biological activity affects the circulation of several primary and trace elements, such as carbon, nitrogen, and iron [60]. However, excessive nutrients usually accelerate the growth of phytoplankton, and excessive phytoplankton populations may lead to algal blooms [61,62]. In coastal zones, phytoplankton is always a good indicator, as population growth increases the importation of nutrients into the seawater, leading to frequent HAB accidents [63]. Zooplanktons are the primary consumers of aquatic ecosystems and are indispensable in biochemical transformation process [64]. The community responds quickly to environmental variables related to climate change [65,66]. It is a vital link in the food chain and food web, and most zooplankton feed on phytoplankton [67]. Many researchers suggest that zooplanktons should be taken as biological quality elements of Water Framework Directive (WFD) [68,69,70].
The plankton-based assessment method is also mainly modified based on the Index of Biological Integrity (IBI) and has been applied globally [71,72,73,74]. Table S6 lists 38 plankton index studies reviewed in this study. All the publications were relatively highly cited references published since 2000. Among the 38 plankton indexes in Table S6, 18 were developed or used based on the index of biological integrity (IBI). Furthermore, the next most used are the plankton trophic index (PTI) and the water quality index (WQI), which are utilized three times. It should be noted that an index such as the phytoplankton community index, which is only applied in one area (the UK), also has a high frequency of use [75,76], but it is not applicable. In terms of research areas, the most significant number of studies were carried out in China, with 20 occurrences, followed by 11 in Europe and 3 in the United States. The most frequently used metric is species abundance, including the abundance of each species and species combination. Ten studies selected this metric. In addition, species biomass and chlorophyll concentration are also frequently chosen by researchers, with frequencies of 8 and 7, respectively. The results are shown in Figure 2b.

3.1.3. Macroinvertebrate

Macroinvertebrates are mostly used to assess the health of river ecosystems. Owing to their limited mobility in river channels, they are relatively easy to collect [77]. Macroinvertebrates are consumers of medium nutrient levels in aquatic ecosystems. They act as nodes in the system and contribute to nutrient cycling, primary productivity, and material decomposition and transfer [78]. The existence of macroinvertebrate species often alters the physical surroundings or the flow of resources, thereby creating or modifying habitats and influencing other organisms in the community [79]. The activities of these organisms create dynamic sediment mosaic, effectively transport solutes into burrows, and increase sediment oxygenation [80]. In addition, macroinvertebrates are sensitive to low concentrations of pollutants in water and can be utilized to detect and assess the early state of rivers [81].
Generally, the health index of macroinvertebrates is divided into macroinvertebrate-based biotic indices and macroinvertebrate-based multi-metric indices [82,83]. A biotic index based on the tolerances of each observed taxa generally uses only one metric to assess river health, and the other elements need to be idealized. In comparison, multi-metric indices use several metrics to assess river health. Their development should consider the complexity of river ecosystems and they provide more detailed information for decision-makers [84]. Table S7 lists the 41 plankton index studies that were reviewed in this study. All the publications were relatively highly cited references which had been published since 2000. Among the 41 indexes counted, 15 studies utilized Ephemeroptera Plecoptera Trichoptera (EPT) as the basic index, making EPT the most commonly used basic index. Among the modifications to the EPT, most researchers added biological metrics such as the number or percentage of Trichoptera [85,86]. This enables the modified index to better reflect the internal conditions of the river and consider local characteristics. Assessment research using the macroinvertebrate index is mainly concentrated in Europe, North America, and South America. Europe and the United States are at the top level in this field. Researchers often use the EPT as a metric to calculate new indices. In addition, they commonly use tolerance metrics and Shannon–Wiener index. The results are displayed in Figure 2c.

3.1.4. Other Indicators

Several other species were selected as the biological indicators. Fish have been used as indicators of aquatic ecosystem changes mostly because of their accessible collection, handling, identification, and sensitivity to habitat loss and other environmental stressors [87,88,89]. According to Pérez-Domínguez [90], most studies of fish-based indices have been carried out in streams and rivers of the United States and other temperate countries. It is also one of the four key BQEs in the WFD [91]. Besides fish, Simone Ciadamidaro selected the black fly (Simuliidae) as an indicator to assess the ecosystem health of streams in urban areas because its larvae are distributed in the waters [92]. In addition, oysters [93], marine turtles [94], seagrass [95], and many other organisms were used as indicators. When the assessed target is a terrestrial natural ecosystem, other flora and fauna could be used as alternatives. Ants could perfectly reflect the health condition in a comprehensive way [96,97]; specific species like sled dogs [98], which only live in cold zones, are a very good choice to assess arctic ecosystem health.

3.2. Index System Method

Although the biological indicator method provides a feasible and straightforward way to assess the health of aquatic ecosystems, limitations still exist. Thus, it can be inferred that: (1) Species of different ecological levels should be taken into consideration. (2) Species interactions are ignored. (3) The external pressure on the ecosystem is not well-reflected. To make corrections and better reflect the actual situation, it is necessary to establish an index system to synthesize a large amount of complex information. The vigor (V), organization (O), and resilience (R) proposed by Costanza in the early stages are the prototype of this method [99]. This method combines multiple metrics of the ecosystem and reflects the process of the ecosystem, which also aims to assess ecosystem health from the perspective of ecosystem structure, function succession process, ecological services, and product services. The index system method emphasizes the ecosystem’s services to humans and the evolutionary relationship between the ecosystem and the regional environment [100]. Based on the VOR idea, researchers have developed many models and frameworks, such as PSR, DPSR, and DPSEEA, as listed in Table S8. Small-scale metrics help to understand the community’s pollution level and spatial distribution, while the metric selected on the medium-scale and large-scale can be used for regional differences but ignores specific details [101]. Multi-scale metrics of toxicology, chemistry, community structure functions, and socio-economic factors can provide more comprehensive information and display a more realistic level of ecosystem health. After establishing a suitable index system, the ecosystem health index (EHI) is calculated according to the weight of each metric. Different weighting methods lead to different ranges of the EHI.
In the large scale assessment of EH, remote sensing (RS) has potential for assessing and monitoring ecosystem health at different temporal and spatial scales across extensive areas with a broad extent [102,103]. The main advantage of RS tools is that they can be used for directly detailing ecological health indictors, such as productivity, species richness [104,105], and resilience after natural and human-induced disturbances and for indirectly providing inputs for spatially explicit ecological process modeling [103,104,105,106]. In addition, RS removes barriers of scales [107]. The crucial point of using RS is the relevance of metrics that are obtained by RS to ecosystem health. An analytical framework has been provided when using remote sensing tools in EHA [108]. It is a procedure for researchers which can make metrics reflect the ecosystem health better. Land use/land cover is the most commonly used RS data [109]. Based on this, landscape indices such as PD, NP, SHID, LPI, SIDI, and MPS were calculated and widely applied in models [110,111,112].

3.2.1. Classification and Selection of Metrics

The establishment of the EHA index system can be conducted in two ways. The first is the internal metric of the ecosystem, including toxicology, ecology, and biochemistry; the second is the external metric of the ecosystem, such as the socio-economic metric and ecosystem service metric [113]. In the health assessment of a rapidly urbanizing urban ecosystem, ecological function and production function can be utilized as internal metrics, and economic metrics such as GDP can be utilized as external metrics [114]. Some researchers have proposed a more comprehensive index classification framework or model [115,116]. The “pressure-state-response” (PSR) model [117] proposed by the OECD in 1993 has been applied by most researchers in EHA. This model classified metrics into pressure, state, and response, which makes it easier to select metrics [118].
A more positive response generally indicates a healthier ecosystem. The selection of metrics determines the reliability of the response. Selecting appropriate metrics such as environmental protection investment [119] and sewage treatment capacity [120] will influence the assessment results. It needs to be quantified if the chosen metric is not a measurable variable, such as public awareness of environmental protection [121]. One problem is that the number of metrics is uneven. It does not mean that the reliability of the ecosystem’s health assessment results is related to the number of metrics. Zhang [120] and Sun [122] assessed the urban ecosystem of Lanzhou City based on the PSR model. The former selected 20 metrics, while the latter selected only 15 metrics. However, there is little difference between the assessment results. Detailed comparisons are presented in Table S9. The quality of the ecosystem health index is related to the quality of the selected metrics, but not to the quantity [123].

3.2.2. Ecosystem Services

Ecosystem services (ES) are a significant metric that concerns sustainability [124]. ES, such as soil retention, water yield, and carbon storage, are determined by natural resources and habitats [125]. However, ES are often ignored when conducting a traditional EHA as such an assessment focuses more on the integrity and sustainability of the actual ecosystem itself. Therefore, it is necessary to enable a link between EH and the provision of ES, and to determine how any ecosystem dysfunction relates to these services when making an EHA [126]. In recent years, with the popularity of various methods to measure ES, researchers take ES as a metric of the index system, developed the VORS framework which combines ES with vigor, organization, and resilience [127,128,129]. Changes in EH directly or indirectly affect the output of ES [130]. It is important to focus on the changes in ES to gain a more comprehensive understanding of EH.

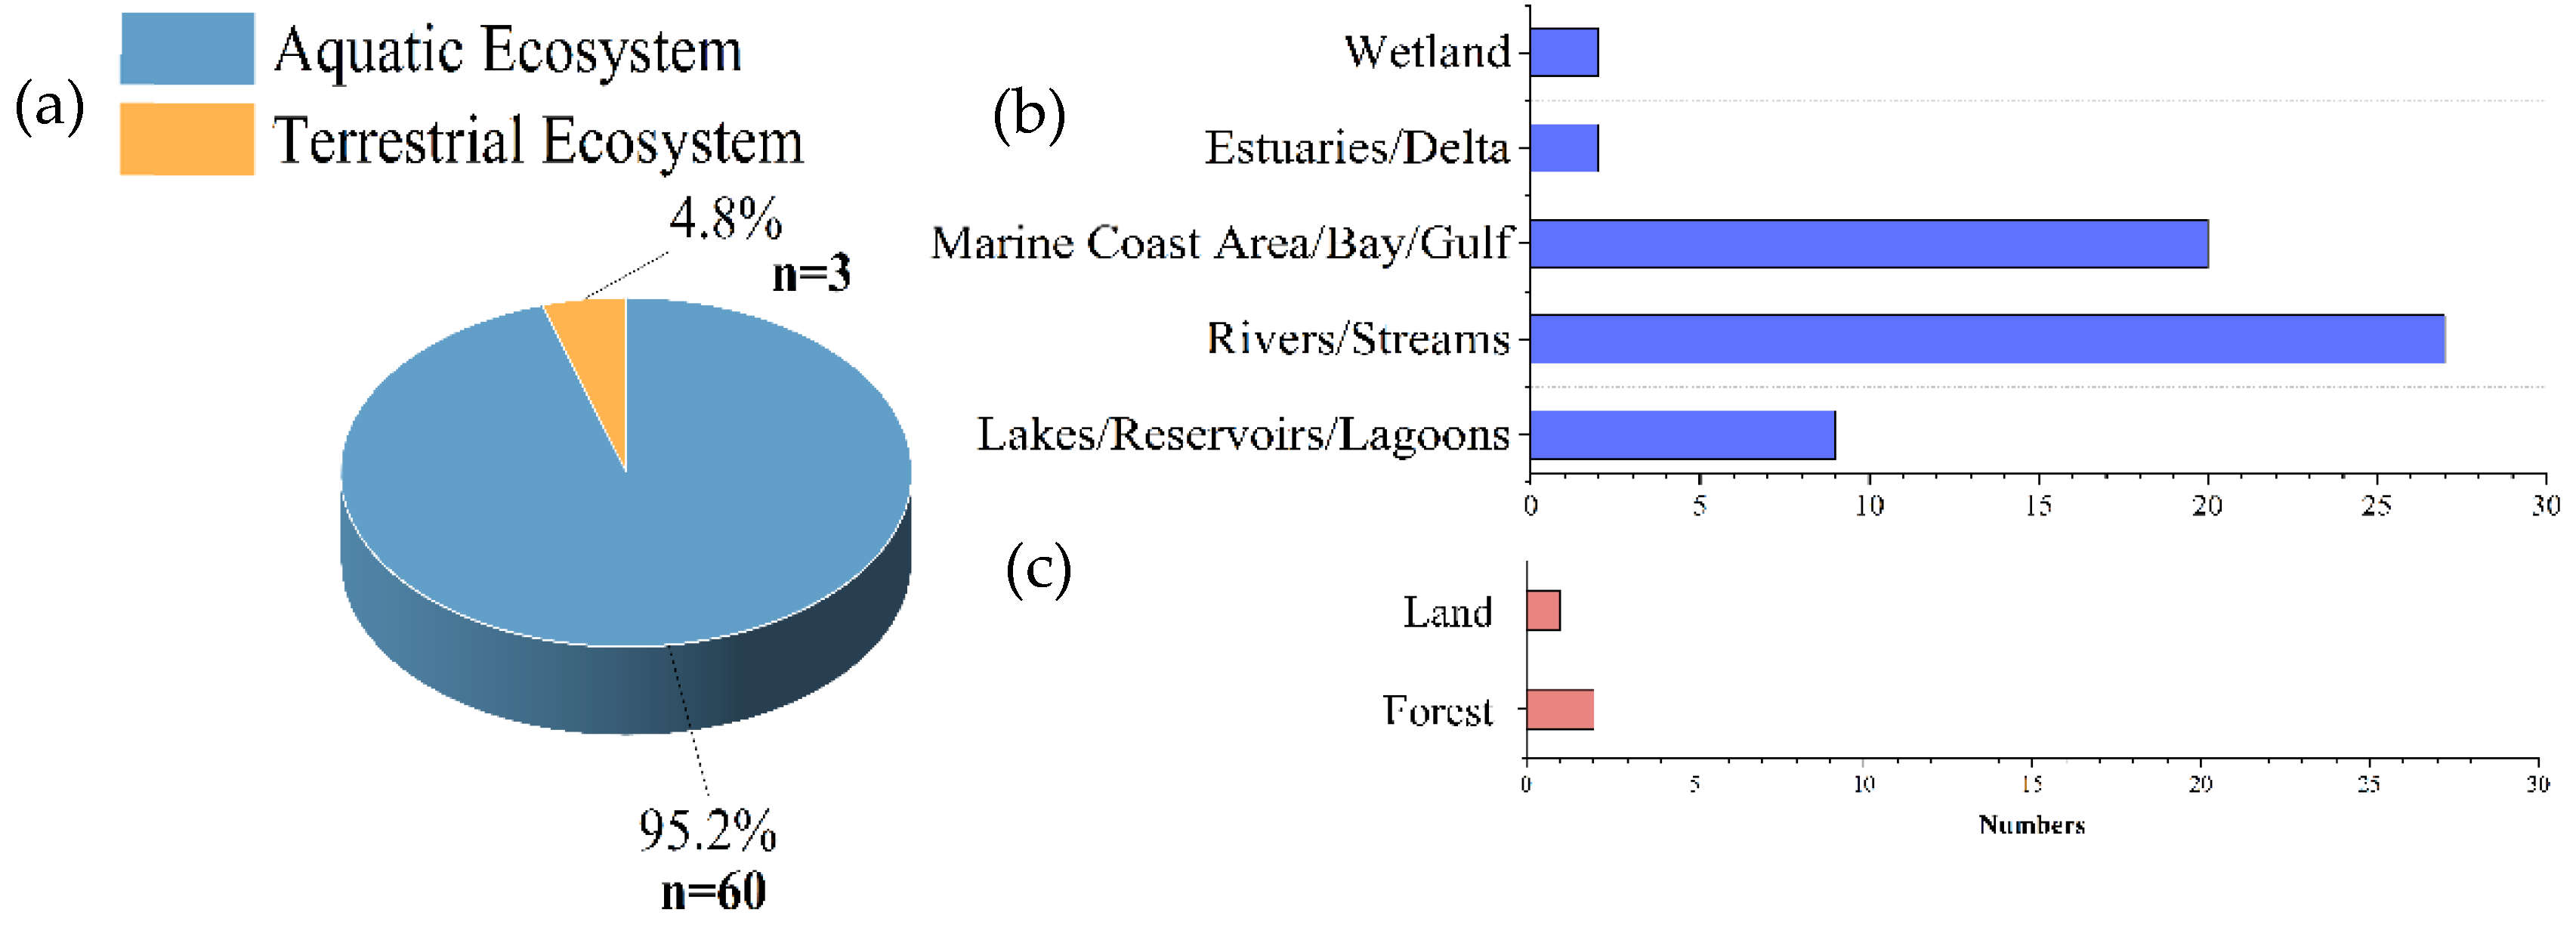
4. Application in Different Ecosystems

We adopted the Web of Science Core Collection Database to illustrate the application of the two methods in different ecosystems. Here are the search criteria: database: core collection of Web of Science, time: 1 January 2010, to 31 May 2021, paper type: Article, language: English, TI = (“Ecosystem health” OR “Ecosystem integrity” OR “Ecosystem quality” OR “Ecosystem status”) AND (“assess*” OR “evaluate*” OR “measure*”). In addition, an asterisk (*) was inserted at the end of the words “assess”, “evaluate”, and “measure” to guarantee greater search precision. Only publications with full pdf format text were analyzed. The following data were recorded for analysis: (1) year, (2) journal, (3) study country, (4) ecosystem type, (5) methods, and (6) title. In total, 143 articles were found in the WOS result. After screening, a total of 127 publications belonging to 83 journals met the criteria, which could be all retrieved from the Scopus database. As expected, the main application methods of EHA are biological indicator and index system (Figure S3). Almost half of the studies utilized the biological indicator method in the current study. The index system method is also prevalent in EHA. Other methods take up nearly 10% of the study. For the application region (Figure S4), 65 studies were carried out in China, which is the most applied region. Applications in Asia, North America, and South America are significant and regional, while applications in Europe are small and dispersed. Most of the current studies were conducted in aquatic ecosystems (Figure 3a), and approximately one-third of the studies were conducted on terrestrial ecosystems. The total number of ecosystems was greater than the number of publications because one publication was carried out in aquatic and terrestrial ecosystems. The aquatic ecosystem was reclassified into lakes, reservoirs, lagoons, rivers, streams, marine coast area/Bay/Gulf, estuaries/delta, and wetland (Figure 3b), whereas the terrestrial ecosystem was reclassified into urban, forest, grassland, land, and desert (Figure 3c). Not surprisingly, rivers/streams were the most concerning targets, followed by marine coast area/bay/gulf. By comparison, urban, rivers/streams, and marine coast area/bay/gulf were at the same level; these were more frequently assessed than others.
Among the studies that adopted the biological indicator method (Figure 4a), the majority of the studies were applicable to aquatic ecosystems, which accounted for 95.2% of the total publications. Rivers/streams are the ecosystems where the biological indicator methods were applied most frequently, followed by marine coast area/bay/gulf (Figure 4b). The terrestrial ecosystems where the biological indicator method was adopted accounted for 4.8% of the total publications. Wike and Bharti [97,131] both utilized the ant as a biological indicator in the study, while Jenssen [132] used lumbricoides to assess the soil properties. For studies that applied the index system method (Figure 5a), about 61.5% of the studies were on terrestrial ecosystems. Aquatic ecosystems accounted for 38.5% of the total publications. Among the studies in which the index system method was adopted with aquatic ecosystems, the majority of the studies (7) were on the marine coast area/bay/gulf (Figure 5b). Two studies utilized the PSR model in seven studies [119,133]. Three out of six studies applied the PSR model in wetland ecosystems. Among the 32 studies that adopted the index system method (Figure 5c), 24 were on urban ecosystems. Furthermore, the other eight included forest, grassland, land, and desert areas.
Additionally, a few researchers have attempted to innovate the EHA method [134,135]. Commonly assessed ecosystems are rivers/streams, marine coast area/bay/gulf, and urban areas. These ecosystems are heavily polluted and are highly associated with anthropogenic activities. The biological indicator method was mostly applied to aquatic ecosystems. In comparison, the index system method was applied in all kinds of ecosystems. However, urban ecosystems are more appropriate for index system methods.

5. Discussion

5.1. Biological Indicator Method

The biological indicator method focuses on environmental pollution and reflects impact of single factor to the ecosystem. The diatom, plankton, and macroinvertebrate indexes discussed in this paper are site-specific, which means that the index needs to be suitable for the conditions of the site to ensure an accurate assessment of ecosystem health. The Hilsenhoff biotic index (HBI) is a good index of organic pollutants [85] and can also be used as a metric of other indices [136]. However, HBI may not be applicable in other areas because the tolerance of species to pollutants may vary from place to place depending on the natural conditions of different habitats. The EPT index is applied to detect low levels of degradation because Ephemeroptera (mayflies), Plecoptera (stoneflies), and Trichoptera (caddisflies) are sensitive [137]. Several plankton and macroinvertebrate communities also have seasonal dynamic characteristics that would affect the community structure both upstream and downstream.

5.2. Index System Method

The index system method represents a comprehensive result. At present, we suggest that researchers focus on the index system method. It not only reflects pollution level but also indicates sustainable development. It should be a trend to adopt ecosystem services as a regular metric. A comprehensive index system should be developed as a standard [138]. Several researchers ignore the fact that the change in the ecosystem status has a certain lag, making it impossible for government departments to implement timely prevention and control. On the one hand, it makes it difficult for the study area to recover in a short time. On the other hand, it will also cause residents to suffer. Consequently, time scales should be considered based on assessment metrics. Moreover, researchers conducted the EHA, while the government departments controlled the collection and collation of data, which led to research inconvenience. Most of the spatial distribution of river basin ecosystems is across administrations units. The data available to the public are often divided by administrative unit, and the record indicators of each unit are not the same, resulting in the inability to obtain general information about the area. So far, no researchers have used two different methods to assess the ecosystem’s health in the same area on the same time scale. It is worth trying to combine the two methods to assess the same target area and compare it with the assessment result of a single method.

Supplementary Materials

The following are available online at https://www.mdpi.com/article/10.3390/su132111838/s1, Figure S1: The development of ecosystem health. Figure S2: Number of papers published annually from 2000 to 2020. (a) Publications annually from 2000 to 2020. (b) Publications change from 2000 to 2020. Figure S3: The number and ratio of publications which applied Biological Indicators, Index System, and Others. Figure S4: Geographic distribution of surveys found in the systematic review. The bubble sizes refer to the number of studies. Table S1: The comparisons between Biological Indicators Method and Index System Method. Table S2: The concept proposal stage. Table S3: Representative opinions of different researchers on EH. Table S4: The development stage. Table S5: List of diatom indices, origin, modifications, characteristics, application regions, and metrics. Table S6: List of plankton indices, origin, modifications, characteristics, application regions, and metrics. Table S7: List of macroinvertebrate indices, origin, modifications, characteristics, application regions, and metrics. Table S8: Models and frameworks developed by researchers based on VOR. Table S9: The metrics comparison of Zhang and Sun in EHA of Lanzhou City, China.

Author Contributions

Bibliographic retrieval, S.F., T.S., M.S., Y.H. and S.H.; writing—original draft preparation, S.F.; writing—review and editing, Z.Q. and Y.Z.; supervision, L.Z. All authors have read and agreed to the published version of the manuscript.

Funding

This research received no external funding.

Institutional Review Board Statement

Not applicable.

Informed Consent Statement

Not applicable.

Data Availability Statement

Web of Science Core Collection Database (http://ifbicd85ae6022a1f4d78sbvbbck56c5o56cno.fiac.eds.tju.edu.cn/wos/woscc/basic-search) (accessed on 26 July 2021).

Acknowledgments

This research was supported by the Tianjin Key Scientific and Technological Project (Grant No. 18ZXSZSF00240).

Conflicts of Interest

The authors declare no conflict of interest.

References

  1. Chapman, P.M. Future Challenges for Marine Pollution Monitoring and Assessment. Mar. Pollut. Bull. 2015, 95, 1–2. [Google Scholar] [CrossRef] [PubMed]
  2. Khim, J.S.; Wang, T.; Snyder, S.A. The Yellow Sea Ecosystem: Pollution, Ecosystem Threats, and Environmental Health. Chemosphere 2017, 182, 794–796. [Google Scholar] [CrossRef]
  3. Carpenter, S.R.; DeFries, R.; Dietz, T.; Mooney, H.A.; Polasky, S.; Reid, W.V.; Scholes, R.J. Millennium Ecosystem Assessment: Research Needs. Science 2006, 314, 257–258. [Google Scholar]
  4. Wolf, K.L.; Blahna, D.J.; Brinkley, W.; Romolini, M. Environmental Stewardship Footprint Research: Linking Human Agency and Ecosystem Health in the Puget Sound Region. Urban Ecosyst. 2013, 16, 13–32. [Google Scholar] [CrossRef]
  5. Rapport, D.J.; Maffi, L. Eco-Cultural Health, Global Health, and Sustainability. Ecol. Res. 2011, 26, 1039–1049. [Google Scholar] [CrossRef] [PubMed]
  6. Villns, A.; Norkko, J.; Hietanen, S.; Josefson, A.B.; Lukkari, K.; Norkko, A. The Role of Recurrent Disturbances for Ecosystem Multifunctionality. Ecology 2013, 94, 2275–2287. [Google Scholar] [CrossRef]
  7. Hader, D.P.; Banaszak, A.T.; Villafane, V.E.; Narvarte, M.A.; Gonzalez, R.A.; Helbling, E.W. Anthropogenic Pollution of Aquatic Ecosystems: Emerging Problems with Global Implications. Sci. Total Environ. 2020, 713, 136586. [Google Scholar] [CrossRef]
  8. Rocha, L.; Hegoburu, C.; Torremorell, A.; Feijoo, C.; Navarro, E.; Fernandez, H.R. Use of Ecosystem Health Indicators for Assessing Anthropogenic Impacts on Freshwaters in Argentina: A Review. Environ. Monit. Assess. 2020, 192, 611. [Google Scholar] [CrossRef]
  9. Backhaus, T.; Snape, J.; Lazorchak, J. The impact of chemical pollution on biodiversity and ecosystem services: The need for an improved understanding. Integr. Environ. Assess. Manag. 2012, 8, 575–576. [Google Scholar] [CrossRef] [PubMed]
  10. Aguirre-Rubí, J.R.; Ortiz-Zarragoitia, M.; Izagirre, U.; Etxebarria, N.; Espinoza, F.; Marigómez, I. Prospective Biomonitor and Sentinel Bivalve Species for Pollution Monitoring and Ecosystem Health Disturbance Assessment in Mangrove–Lined Nicaraguan Coasts. Sci. Total Environ. 2019, 649, 186–200. [Google Scholar] [CrossRef]
  11. Łuczyńska, J.; Paszczyk, B.; Łuczyński, M.J. Fish as a Bioindicator of Heavy Metals Pollution in Aquatic Ecosystem of Pluszne Lake, Poland, and risk Assessment for Consumer’s Health. Ecotoxicol. Environ. Saf. 2018, 153, 60–67. [Google Scholar] [CrossRef]
  12. Jung, J.-W.; Park, J.-W.; Eo, S.; Choi, J.; Song, Y.K.; Cho, Y.; Hong, S.H.; Shim, W.J. Ecological Risk Assessment of Microplastics in Coastal, Shelf, and Deep Sea Waters with a Consideration of Environmentally Relevant Size and Shape. Environ. Pollut. 2021, 270, 116217. [Google Scholar] [CrossRef] [PubMed]
  13. Nava, V.; Leoni, B. A Critical Review of Interactions between Microplastics, Microalgae and Aquatic Ecosystem Function. Water Res. 2021, 188, 116476. [Google Scholar] [CrossRef]
  14. Vanapalli, K.R.; Dubey, B.K.; Sarmah, A.K.; Bhattacharya, J. Assessment of Microplastic Pollution in the Aquatic Ecosystems—an Indian Perspective. Case Stud. Chem. Environ. Eng. 2021, 3, 100071. [Google Scholar] [CrossRef]
  15. Chessman, B.; Williams, S.; Besley, C. Bioassessment of Streams with Macroinvertebrates: Effect of Sampled Habitat and Taxonomic Resolution. J. N. Am. Benthol. Soc. 2007, 26, 546–565. [Google Scholar] [CrossRef]
  16. Forio, M.A.E.; Lock, K.; Radam, E.D.; Bande, M.; Asio, V.; Goethals, P.L. Assessment and Analysis of Ecological Quality, Macroinvertebrate Communities and Diversity in Rivers of a Multifunctional Tropical Island. Ecol. Indic. 2017, 77, 228–238. [Google Scholar] [CrossRef]
  17. Costanza, R.; De Groot, R.; Sutton, P.; Van Der Ploeg, S.; Anderson, S.; Kubiszewski, I.; Farber, S.; Turner, R.K. Changes in the Global Value of Ecosystem Services. Glob. Environ. Chang. 2014, 26, 152–158. [Google Scholar] [CrossRef]
  18. Rapport, D.J.; Costanza, R.; McMichael, A.J. Assessing Ecosystem Health. Trends Ecol. Evol. 1998, 13, 397–402. [Google Scholar] [CrossRef]
  19. Costanza, R.; d’Arge, R.; De Groot, R.; Farber, S.; Grasso, M.; Hannon, B.; Limburg, K.; Naeem, S.; O’neill, R.V.; Paruelo, J. The Value of the World’s Ecosystem Services and Natural Capital. Nature 1997, 387, 253–260. [Google Scholar] [CrossRef]
  20. Costanza, R. Ecosystem Health and Ecological Engineering. Ecol. Eng. 2012, 45, 24–29. [Google Scholar] [CrossRef] [Green Version]
  21. Li, W.; Xie, S.; Wang, Y.; Huang, J.; Cheng, X. Effects of Urban Expansion on Ecosystem Health in Southwest China from a Multi-Perspective Analysis. J. Clean. Prod. 2021, 294, 126341. [Google Scholar] [CrossRef]
  22. Curran, S.; Kumar, A.; Lutz, W.; Williams, M. Interactions between Coastal and Marine Ecosystems and Human Population Systems: Perspectives on How Consumption Mediates this Interaction. Ambio 2002, 31, 264–268. [Google Scholar] [CrossRef]
  23. Moiseenko, T.; Voinov, A.; Megorsky, V.; Gashkina, N.; Kudriavtseva, L.; Vandish, O.; Sharov, A.; Sharova, Y.; Koroleva, I. Ecosystem and Human Health Assessment to Define Environmental Management Strategies: The Case of Long-Term Human Impacts on an Arctic Lake. Sci. Total Environ. 2006, 369, 1–20. [Google Scholar] [CrossRef]
  24. Connell, D.J. Sustainable Livelihoods and Ecosystem Health: Exploring Methodological Relations as a Source of Synergy. EcoHealth 2010, 7, 351–360. [Google Scholar] [CrossRef]
  25. An, K.-G.; Lee, J.-Y.; Kumar, H.K.; Lee, S.-J.; Hwang, S.-J.; Kim, B.-H.; Park, Y.-S.; Shin, K.-H.; Park, S.; Um, H.-Y. Control of Algal Scum Using Top-Down Biomanipulation Approaches and Ecosystem Health Assessments for Efficient Reservoir Management. Water Air Soil Pollut. 2009, 205, 3–24. [Google Scholar] [CrossRef]
  26. Horwitz, P.; Finlayson, C. Wetlands as Settings for Human Health: Incorporating Ecosystem Services and Health Impact Assessment into Water Resource Management. BioScience 2011, 61, 678–688. [Google Scholar] [CrossRef]
  27. Su, M.; Chen, B.; Yang, Z. Implication of Ecosystem Health Assessment for Urban Management. Procedia Environ. Sci. 2010, 2, 674–680. [Google Scholar] [CrossRef] [Green Version]
  28. Su, M.; Yang, Z.; Chen, B.; Liu, G.; Zhang, Y.; Zhang, L.; Xu, L.; Zhao, Y. Urban Ecosystem Health Assessment and Its Application in Management: A Multi-Scale Perspective. Entropy 2012, 15, 1–9. [Google Scholar] [CrossRef]
  29. Leopold, A. Wilderness as a Land Laboratory. Living Wilderness 1941, 6, 3. [Google Scholar]
  30. Hodgson, J. Grazing Management. Science into Practice; Longman Group UK Ltd.: London, UK, 1990. [Google Scholar]
  31. Bradshaw, A.D.; Barrett, G.W.; Rosenberg, R. Stress Effects on Natural Ecosystems. J. Appl. Ecol. 1982, 19, 988. [Google Scholar] [CrossRef]
  32. Barrett, G.W.; Van Dyne, G.M.; Odum, E.P. Stress Ecology. BioScience 1976, 26, 192–194. [Google Scholar] [CrossRef]
  33. Jernelöv, A.; Rosenberg, R. Stress Tolerance of Ecosystems. Environ. Conserv. 1976, 3, 43–46. [Google Scholar] [CrossRef]
  34. Woodwell, G.M. Effects of Pollution on the Structure and Physiology of Ecosystems. Science 1970, 168, 429–433. [Google Scholar] [CrossRef]
  35. Karr, J.; Fausch, K.; Angermeier, P. Assessing Biological Integrity in Running Water Waters: A Method and Its Rational; Illinois Natural History Survey Special Publication: Champaign, IL, USA, 1986; Volume 5. [Google Scholar]
  36. Norton, B.G. A New Paradigm for Environmental Management. In Ecosystem Health: New Goals for Environmental Management; Island Press: Washington, DC, USA, 1992; pp. 23–41. [Google Scholar]
  37. Reynoldson, T.B.; Metcalfe-Smith, J.L. An Overview of the Assessment of Aquatic Ecosystem Health Using Benthic Invertebrates. J. Aquat. Ecosyst. Health 1992, 1, 295–308. [Google Scholar] [CrossRef]
  38. Marshall, F.E.; Banks, K.; Cook, G.S. Ecosystem Indicators for Southeast Florida Beaches. Ecol. Indic. 2014, 44, 81–91. [Google Scholar] [CrossRef]
  39. Wu, Z.; Chen, R.; Meadows, M.E.; Liu, X. Application of the Ocean Health Index to Assess Ecosystem Health for the Coastal Areas of Shanghai, China. Ecol. Indic. 2021, 126, 107650. [Google Scholar] [CrossRef]
  40. Oeding, S.; Taffs, K.H. Are Diatoms a Reliable and Valuable Bio-Indicator to Assess Sub-Tropical River Ecosystem Health? Hydrobiologia 2015, 758, 151–169. [Google Scholar] [CrossRef]
  41. Tan, X.; Sheldon, F.; Bunn, S.E.; Zhang, Q. Using Diatom Indices for Water Quality Assessment in a Subtropical River, China. Environ. Sci. Pollut. Res. 2013, 20, 4164–4175. [Google Scholar] [CrossRef] [Green Version]
  42. Xiang, Z.; Chen, H.; Li, C.; Yin, X.; Xu, Z.; Zhang, Y. Application of Diatom Index in Assessment of Aquatic Ecosystem Health in Taizi River, China. J. Dalian Ocean. Univ. 2016, 31, 416–425. [Google Scholar]
  43. Bere, T. Challenges of Diatom-Based Biological Monitoring and Assessment of Streams in Developing Countries. Environ. Sci. Pollut. Res. 2016, 23, 5477–5486. [Google Scholar] [CrossRef] [PubMed] [Green Version]
  44. Hering, D.; Johnson, R.K.; Kramm, S.; Schmutz, S.; Szoszkiewicz, K.; Verdonschot, P.F.M. Assessment of European Streams with Diatoms, Macrophytes, Macroinvertebrates and Fish: A Comparative Metric-Based Analysis of Organism Response to Stress. Freshw. Biol. 2006, 51, 1757–1785. [Google Scholar] [CrossRef]
  45. Bere, T.; Tundisi, J.G. Applicability of Borrowed Diatom-Based Water Quality Assessment Indices in Streams around São Carlos-SP, Brazil. Hydrobiologia 2011, 673, 179–192. [Google Scholar] [CrossRef] [Green Version]
  46. Rodríguez-Alcalá, O.; Blanco, S.; García-Girón, J.; Jeppesen, E.; Irvine, K.; Nõges, P.; Nõges, T.; Gross, E.M.; Bécares, E. Large-Scale Geographical and Environmental Drivers of Shallow Lake Diatom Metacommunities across Europe. Sci. Total Environ. 2020, 707, 135887. [Google Scholar] [CrossRef]
  47. Taylor, J.C.; Prygiel, J.; Vosloo, A.; De La Rey, P.A.; Van Rensburg, L. Can diatom-Based Pollution Indices Be Used for Biomonitoring in South Africa? A Case Study of the Crocodile West and Marico Water Management Area. Hydrobiologia 2007, 592, 455–464. [Google Scholar] [CrossRef]
  48. Vishnyakov, V.S.; Kulikovskiy, M.S.; Genkal, S.I.; Dorofeyuk, N.I.; Lange-Bertalot, H.; Kuznetsova, I.V. Taxonomy and Geographical Distribution of the Diatom Genus Epithemia Kützing in Water Bodies of Central Asia. Inland Water Biol. 2014, 7, 318–330. [Google Scholar] [CrossRef]
  49. Xue, H.; Zheng, B.; Meng, F.; Wang, Y.; Zhang, L.; Cheng, P. Assessment of Aquatic Ecosystem Health of the Wutong River Based on Benthic Diatoms. Water 2019, 11, 727. [Google Scholar] [CrossRef] [Green Version]
  50. Dalu, T.; Bere, T.; Froneman, P.W. Assessment of Water Quality Based on Diatom Indices in a Small Temperate River System, Kowie River, South Africa. Water 2016, 42, 183. [Google Scholar]
  51. Rıdvan, E.S.; Sophia, B.; Cuuml neyt, N.S.; Kadir, C.O. Ecological Assessment of Great Lota Lake (Turkey) on the Base of Diatom Communities. Afr. J. Biotechnol. 2013, 12, 453–464. [Google Scholar] [CrossRef]
  52. Bennion, H.; Kelly, M.G.; Juggins, S.; Yallop, M.L.; Burgess, A.; Jamieson, J.; Krokowski, J. Assessment of Ecological Status in UK Lakes Using Benthic Diatoms. Freshw. Sci. 2014, 33, 639–654. [Google Scholar] [CrossRef] [Green Version]
  53. Kireta, A.R.; Reavie, E.D.; Sgro, G.V.; Angradi, T.R.; Bolgrien, D.W.; Jicha, T.M.; Hill, B.H. Assessing the Condition of the Missouri, Ohio, and Upper Mississippi Rivers (USA) using Diatom-Based Indicators. Hydrobiologia 2012, 691, 171–188. [Google Scholar] [CrossRef]
  54. Desrosiers, C.; Leflaive, J.; Eulin, A.; Ten-Hage, L. Bioindicators in Marine Waters: Benthic Diatoms as a Tool to Assess Water Quality from Eutrophic to Oligotrophic Coastal Ecosystems. Ecol. Indic. 2013, 32, 25–34. [Google Scholar] [CrossRef]
  55. Rimet, F. Recent Views on River Pollution and Diatoms. Hydrobiologia 2012, 683, 1–24. [Google Scholar] [CrossRef]
  56. Lobo, M.T.M.P.S.; Scalize, P.S.; Kraus, C.N.; Da Silva, W.J.; Garnier, J.; Marques, D.D.M.; Bonnet, M.-P.; Nogueira, I.D.S. Biological Index Based on Epiphytic Diatom Assemblages is More Restrictive than the Physicochemical Index in Water Assessment on an Amazon Floodplain, Brazil. Environ. Sci. Pollut. Res. 2020, 27, 10642–10657. [Google Scholar] [CrossRef]
  57. Stevenson, R.J.; Pan, Y.; Van Dam, H. Assessing Environmental Conditions in Rivers and Streams with Diatoms. Diatoms Appl. Environ. Earth Sci. 1999, 1, 57–85. [Google Scholar]
  58. Feng, B.; Zhang, M.; Chen, J.; Xu, J.; Xiao, B.; Zhou, M.; Zhang, M. Reduction in the Phytoplankton Index of Biotic Integrity in Riverine Ecosystems Driven by Industrial Activities, Dam Construction and Mining: A Case Study in the Ganjiang River, China. Ecol. Indic. 2021, 120, 106907. [Google Scholar] [CrossRef]
  59. Cai, W.; Zhou, Z.; Xia, J.; Wang, W.; Dou, C.; Zeng, Z. An Advanced Index of Ecological Integrity (IEI) for Assessing Ecological Efficiency of Restauration Revetments in River Plain. Ecol. Indic. 2020, 108, 105762. [Google Scholar] [CrossRef]
  60. Falkowski, P.G.; Barber, R.T.; Smetacek, V. Biogeochemical Controls and Feedbacks on Ocean Primary Production. Science 1998, 281, 200–206. [Google Scholar] [CrossRef] [PubMed] [Green Version]
  61. Scholz-Starke, B.; Bo, L.; Holbach, A.; Norra, S.; Floehr, T.; Hollert, H.; Roß-Nickoll, M.; Schäffer, A.; Ottermanns, R. Simulation-based Assessment of the Impact of Fertiliser and Herbicide Application on Freshwater Ecosystems at the Three Gorges Reservoir in China. Sci. Total Environ. 2018, 639, 286–303. [Google Scholar] [CrossRef]
  62. O’Boyle, S.; McDermott, G.; Silke, J.; Cusack, C. Potential Impact of an Exceptional Bloom of Karenia Mikimotoi on Dissolved Oxygen Levels in Waters off Western Ireland. Harmful Algae 2016, 53, 77–85. [Google Scholar] [CrossRef] [PubMed]
  63. Herrera-Silveira, J.A.; Morales-Ojeda, S.M. Evaluation of the Health Status of a Coastal Ecosystem in Southeast Mexico: Assessment of Water Quality, Phytoplankton and Submerged Aquatic Vegetation. Mar. Pollut. Bull. 2009, 59, 72–86. [Google Scholar] [CrossRef]
  64. Liu, Y.; Yu, N.; Feng, D.; Xiong, Z.; Jiang, X.; Li, E.; Chen, L. Annual Variations of Zooplankton Community Structure in Shanghai Downtown Rivers. Chin. J. Ecol. 2010, 29, 370–376. [Google Scholar]
  65. Beaugrand, G.; Edwards, M.; Legendre, L. Marine Biodiversity, Ecosystem Functioning, and Carbon Cycles. Proc. Natl. Acad. Sci. USA 2010, 107, 10120–10124. [Google Scholar] [CrossRef] [PubMed] [Green Version]
  66. Bucklin, A.; Lindeque, P.; Rodriguez-Ezpeleta, N.; Albaina, A.; Lehtiniemi, M. Metabarcoding of Marine Zooplankton: Prospects, Progress and Pitfalls. J. Plankton Res. 2016, 38, 393–400. [Google Scholar] [CrossRef] [Green Version]
  67. Shao, N.F.; Yang, S.T.; Sun, Y.; Gai, Y.; Zhao, C.S.; Wang, F.; Yin, X.; Dong, B. Assessing Aquatic Ecosystem Health through the Analysis of Plankton Biodiversity. Mar. Freshw. Res. 2019, 70, 647. [Google Scholar] [CrossRef]
  68. Davidson, T.A.; Bennion, H.; Jeppesen, E.; Clarke, G.H.; Sayer, C.D.; Morley, D.; Odgaard, B.V.; Rasmussen, P.; Rawcliffe, R.; Salgado, J.; et al. The Role of Cladocerans in Tracking Long-Term Change in Shallow Lake Trophic Status. Hydrobiologia 2011, 676, 299–315. [Google Scholar] [CrossRef]
  69. Jeppesen, E.; Nõges, P.; Davidson, T.; Haberman, J.; Nõges, T.; Blank, K.; Lauridsen, T.; Søndergaard, M.; Sayer, C.; Laugaste, R.; et al. Zooplankton as Indicators in Lakes: A Scientific-Based Plea for Including Zooplankton in the Ecological Quality Assessment of Lakes According to the European Water Framework Directive (WFD). Hydrobiologia 2011, 676, 279–297. [Google Scholar] [CrossRef]
  70. Irvine, K.; Caroni, R. The Potential of Zooplankton Communities for Ecological Assessment of Lakes: Redundant Concept or Political Oversight? In Biology and Environment: Proceedings of the Royal Irish Academy; Royal Irish Academy: Dublin, Ireland, 2010; Volume 110, pp. 35–53. [Google Scholar]
  71. Baek, S.H.; Son, M.; Kim, D.; Choi, H.-W.; Kim, Y.-O. Assessing the Ecosystem Health Status of Korea Gwangyang and Jinhae bays based on a Planktonic Index of Biotic Integrity (P-IBI). Ocean Sci. J. 2014, 49, 291–311. [Google Scholar] [CrossRef]
  72. Houssou, A.M.; Adjahouinou, D.C.; Bonou, C.A.; Montchowui, E. Plankton Index of Biotic Integrity (P-IBI) for Assessing Ecosystem Health within the Ouémé River Basin, Republic of Benin. Afr. J. Aquat. Sci. 2020, 45, 452–465. [Google Scholar] [CrossRef]
  73. Kane, D.D.; Gordon, S.I.; Munawar, M.; Charlton, M.N.; Culver, D.A. The Planktonic Index of Biotic Integrity (P-IBI): An Approach for Assessing Lake Ecosystem Health. Ecol. Indic. 2009, 9, 1234–1247. [Google Scholar] [CrossRef]
  74. Rivera, I.N.; Souza, K.M.; Souza, C.P.; Lopes, R.M. Free-Living and Plankton-Associated Vibrios: Assessment in Ballast Water, Harbor Areas, and Coastal Ecosystems in Brazil. Front. Microbiol 2012, 3, 443. [Google Scholar] [CrossRef] [PubMed] [Green Version]
  75. Tett, P.; Carreira, C.; Mills, D.K.; Van Leeuwen, S.; Foden, J.; Bresnan, E.; Gowen, R.J. Use of a Phytoplankton Community Index to Assess the Health of Coastal Waters. ICES J. Mar. Sci. 2008, 65, 1475–1482. [Google Scholar] [CrossRef]
  76. Whyte, C.; Davidson, K.; Gilpin, L.; Mitchell, E.; Moschonas, G.; McNeill, S.; Tett, P. Tracking Changes to a Microplankton Community in a North Atlantic Sea Loch Using the Microplankton Index PI(mp). ICES J. Mar. Sci. 2017, 74, 311–325. [Google Scholar] [CrossRef]
  77. Hou, Y.; Kong, F.; Li, Y.; Xi, M.; Yu, Z. Key Factors of the Studies on Benthic Macroinvertebrate in Coastal Wetlands: Methods and Biodiversity. Ecohydrol. Hydrobiol. 2020, 20, 424–436. [Google Scholar] [CrossRef]
  78. Fierro, P.; Bertrán, C.; Tapia, J.; Hauenstein, E.; Peña-Cortés, F.; Vergara, C.; Cerna, C.; Vargas-Chacoff, L. Effects of Local Land-Use on Riparian Vegetation, Water Quality, and the Functional Organization of Macroinvertebrate Assemblages. Sci. Total Environ. 2017, 609, 724–734. [Google Scholar] [CrossRef]
  79. Gogina, M.; Zettler, M.L. Diversity and Distribution of Benthic Macrofauna in the Baltic Sea: Data Inventory and its Use for Species Distribution Modelling and Prediction. J. Sea Res. 2010, 64, 313–321. [Google Scholar] [CrossRef]
  80. Noman, A.; Mamunur, R.; Islam, M.S.; Hossain, M.B. Spatial and Seasonal Distribution of Intertidal Macrobenthos with their Biomass and Functional Feeding Guilds in the Naf River Estuary, Bangladesh. J. Oceanol. Limnol. 2019, 37, 1010–1023. [Google Scholar] [CrossRef]
  81. Guimarães, A.T.B.; Rodrigues, A.S.D.L.; Pereira, P.S.; Silva, F.G.; Malafaia, G. Toxicity of Polystyrene Nanoplastics in Dragonfly Larvae: An Insight on how these Pollutants Can Affect Bentonic Macroinvertebrates. Sci. Total Environ. 2021, 752, 141936. [Google Scholar] [CrossRef]
  82. Herman, M.R.; Nejadhashemi, A.P. A Review of Macroinvertebrate—And Fish-Based Stream Health Indices. Ecohydrol. Hydrobiol. 2015, 15, 53–67. [Google Scholar] [CrossRef] [Green Version]
  83. Ollis, D.J.; Dallas, H.; Esler, K.; Boucher, C. Bioassessment of the Ecological Integrity of River Ecosystems Using Aquatic Macroinvertebrates: An Overview with a Focus on South Africa. Afr. J. Aquat. Sci. 2010, 31, 205–227. [Google Scholar] [CrossRef]
  84. Rakocinski, C.F. Evaluating Macrobenthic Process Indicators in Relation to Organic Enrichment and Hypoxia. Ecol. Indic. 2012, 13, 1–12. [Google Scholar] [CrossRef]
  85. Butcher, J.T.; Stewart, P.M.; Simon, T.P. A Benthic Community Index for Streams in the Northern Lakes and Forests Ecoregion. Ecol. Indic. 2003, 3, 181–193. [Google Scholar] [CrossRef]
  86. Houston, L.; Barbour, M.; Lenat, D.; Penrose, D. A Multi-Agency Comparison of Aquatic Macroinvertebrate-Based Stream Bioassessment Methodologies. Ecol. Indic. 2002, 1, 279–292. [Google Scholar] [CrossRef]
  87. Breine, J.; Quataert, P.; Stevens, M.; Ollevier, F.; Volckaert, F.A.; Bergh, E.V.D.; Maes, J. A Zone-Specific Fish-Based Biotic Index as a Management Tool for the Zeeschelde Estuary (Belgium). Mar. Pollut. Bull. 2010, 60, 1099–1112. [Google Scholar] [CrossRef] [PubMed] [Green Version]
  88. Martinho, F.; Nyitrai, D.; Crespo, D.; Pardal, M.A. Efficacy of Single and Multi-Metric Fish-Based Indices in Tracking Anthropogenic Pressures in Estuaries: An 8-Year Case Study. Mar. Pollut. Bull. 2015, 101, 153–162. [Google Scholar] [CrossRef]
  89. Viana, A.P.; Frédou, F.L.; Frédou, T. Measuring the Ecological Integrity of an Industrial District in the Amazon Estuary, Brazil. Mar. Pollut. Bull. 2012, 64, 489–499. [Google Scholar] [CrossRef] [PubMed]
  90. Pérez-Domínguez, R.; Maci, S.; Courrat, A.; Lepage, M.; Borja, A.; Uriarte, A.; Neto, J.M.; Cabral, H.; Raykov, V.; Franco, A.; et al. Current Developments on Fish-Based Indices to Assess Ecological-Quality Status of Estuaries and Lagoons. Ecol. Indic. 2012, 23, 34–45. [Google Scholar] [CrossRef]
  91. Van Hoey, G.; Borja, A.; Birchenough, S.; Buhl-Mortensen, L.; Degraer, S.; Fleischer, D.; Kerckhof, F.; Magni, P.; Muxika, I.; Reiss, H.; et al. The Use of Benthic Indicators in Europe: From the Water Framework Directive to the Marine Strategy Framework Directive. Mar. Pollut. Bull. 2010, 60, 2187–2196. [Google Scholar] [CrossRef] [PubMed] [Green Version]
  92. Ciadamidaro, S.; Mancini, L.; Rivosecchi, L. Black flies (Diptera, Simuliidae) as Ecological Indicators of Stream Ecosystem Health in an Urbanizing Area (Rome, Italy). Ann. Dell’ist. Super. Sanita 2016, 52, 269–276. [Google Scholar] [CrossRef]
  93. Aguirre-Rubí, J.; Luna-Acosta, A.; Ortiz-Zarragoitia, M.; Zaldibar, B.; Izagirre, U.; Ahrens, M.J.; Villamil, L.; Marigómez, I. Assessment of Ecosystem Health Disturbance in Mangrove-Lined Caribbean Coastal Systems Using the Oyster Crassostrea Rhizophorae as Sentinel Species. Sci. Total Environ. 2018, 618, 718–735. [Google Scholar] [CrossRef]
  94. Aguirre, A.A.; Lutz, P. Marine Turtles as Sentinels of Ecosystem Health: Is Fibropapillomatosis an Indicator? EcoHealth 2004, 1, 275–283. [Google Scholar] [CrossRef]
  95. Montefalcone, M. Ecosystem Health Assessment Using the Mediterranean Seagrass Posidonia Oceanica: A Review. Ecol. Indic. 2009, 9, 595–604. [Google Scholar] [CrossRef]
  96. Andersen, A.N.; Majer, J.D. Ants Show the Way Down Under: Invertebrates as Bioindicators in Land Management. Front. Ecol. Environ. 2004, 2, 291–298. [Google Scholar] [CrossRef]
  97. Wike, L.D.; Martin, F.D.; Paller, M.H.; Nelson, E.A. Impact of Forest Seral Stage on use of Ant Communities for Rapid Assessment of Terrestrial Ecosystem Health. J. Insect Sci. 2010, 10, 1–16. [Google Scholar] [CrossRef] [PubMed]
  98. Sonne, C.; Letcher, R.J.; Jenssen, B.M.; Desforges, J.-P.; Eulaers, I.; Andersen-Ranberg, E.; Gustavson, K.; Bossi, R.; Styrishave, B.; Sinding, M.-H.S.; et al. Sled Dogs as Sentinel Species for Monitoring Arctic Ecosystem Health. In Pets as Sentinels, Forecasters and Promoters of Human Health; Springer: Cham, Switzerland, 2020; pp. 21–45. [Google Scholar] [CrossRef]
  99. Costanza, R. Toward an Operational Definition of Ecosystem Health. Ecosyst. Health: New Goals Environ. Manag. 1992, 239, 269. [Google Scholar]
  100. Xu, F.-L.; Zhao, Z.-Y.; Zhan, W.; Zhao, S.-S.; Dawson, R.; Tao, S. An Ecosystem Health Index Methodology (EHIM) for Lake Ecosystem Health Assessment. Ecol. Model. 2005, 188, 327–339. [Google Scholar] [CrossRef]
  101. Su, M.; Fath, B.D.; Yang, Z. Urban Ecosystem Health Assessment: A Review. Sci. Total Environ. 2010, 408, 2425–2434. [Google Scholar] [CrossRef]
  102. Ludwig, J.A.; Bastin, G.N.; Chewings, V.H.; Eager, R.W.; Liedloff, A.C. Leakiness: A New Index for Monitoring the Health of Arid and Semiarid Landscapes Using Remotely Sensed Vegetation Cover and Elevation Data. Ecol. Indic. 2007, 7, 442–454. [Google Scholar] [CrossRef]
  103. Qiao, Z.; Wu, C.; Zhao, D.; Xu, X.; Yang, J.; Feng, L.; Sun, Z.; Liu, L. Determining the Boundary and Probability of Surface Urban Heat Island Footprint Based on a Logistic Model. Remote Sens. 2019, 11, 1368. [Google Scholar] [CrossRef] [Green Version]
  104. Kerr, J.T.; Ostrovsky, M. From Space to Species: Ecological Applications for Remote Sensing. Trends Ecol. Evol. 2003, 18, 299–305. [Google Scholar]
  105. Hilker, T.; Coops, N.C.; Wulder, M.A.; Black, T.A.; Guy, R.D. The Use of Remote Sensing in Light Use Efficiency Based Models of Gross Primary Production: A Review of Current Status and Future Requirements. Sci. Total Environ. 2008, 404, 411–423. [Google Scholar]
  106. Qiao, Z.; Liu, L.; Qin, Y.; Xu, X.; Wang, B.; Liu, Z. The Impact of Urban Renewal on Land Surface Temperature Changes: A Case Study in the Main City of Guangzhou, China. Remote Sens. 2020, 12, 794. [Google Scholar] [CrossRef] [Green Version]
  107. Cao, C.; Xu, M.; Chen, W.; Tian, R. A Framework for Diagnosis of Environmental Health based on Remote Sensing. In Proceedings of the Conference on Land Surface Remote Sensing, Kyoto, Japan, 21 November 2012. [Google Scholar]
  108. Li, Z.; Xu, D.; Guo, X. Remote Sensing of Ecosystem Health: Opportunities, Challenges, and Future Perspectives. Sensors 2014, 14, 21117–21139. [Google Scholar] [CrossRef] [Green Version]
  109. Grecchi, R.C.; Gwyn, Q.H.J.; Bénié, G.B.; Formaggio, A.R.; Fahl, F.C. Land Use and Land Cover Changes in the Brazilian Cerrado: A Multidisciplinary Approach to Assess the Impacts of Agricultural Expansion. Appl. Geogr. 2014, 55, 300–312. [Google Scholar] [CrossRef]
  110. Sun, T.; Lin, W.; Chen, G.; Guo, P.; Zeng, Y. Wetland Ecosystem Health Assessment through Integrating Remote Sensing and Inventory Data with an Assessment Model for the Hangzhou Bay, China. Sci. Total Environ. 2016, 566–567, 627–640. [Google Scholar] [CrossRef] [PubMed]
  111. Wang, H.; Hou, P.; Jiang, J.; Xiao, R.; Zhai, J.; Fu, Z.; Hou, J. Ecosystem Health Assessment of Shennongjia National Park, China. Sustainability 2020, 12, 7672. [Google Scholar] [CrossRef]
  112. Yue, H.; Liu, Y.; Li, Y.; Lu, Y. Eco-Environmental Quality Assessment in China’s 35 Major Cities Based on Remote Sensing Ecological Index. IEEE Access 2019, 7, 51295–51311. [Google Scholar] [CrossRef]
  113. Pan, W.; Huang, H.; Yao, P.; Zheng, P. Assessment Methods of Small Watershed Ecosystem Health. Pol. J. Environ. Stud. 2021, 30, 1749–1769. [Google Scholar] [CrossRef]
  114. Shen, W.; Zheng, Z.; Pan, L.; Qin, Y.; Li, Y. A Integrated Method For Assessing The Urban Ecosystem Health Of Rapid Urbanized Area in China based on SFPHD Framework. Ecol. Indic. 2020, 121, 107071. [Google Scholar] [CrossRef]
  115. Bell, S. DPSIR=A Problem Structuring Method? An Exploration from the “Imagine” Approach. Eur. J. Oper. Res. 2012, 222, 350–360. [Google Scholar] [CrossRef]
  116. Gregory, A.J.; Atkins, J.P.; Burdon, D.; Elliott, M. A Problem Structuring Method for Ecosystem-Based Management: The DPSIR Modelling Process. Eur. J. Oper. Res. 2013, 227, 558–569. [Google Scholar] [CrossRef]
  117. Ramos, T.B.; Alves, I.; Subtil, R.; de Melo, J.J. Environmental Performance Policy Indicators for the Public Sector: The Case of the Defence Sector. J. Environ. Manag. 2007, 82, 410–432. [Google Scholar] [CrossRef] [PubMed]
  118. Song, Q.; Wang, H.; Wen, F.; Ledwich, G.; Xue, Y. Pressure State Response-Based Method for Evaluating Social Benefits from Smart Grid Development. J. Energy Eng. 2015, 141, 04014020. [Google Scholar] [CrossRef]
  119. Sun, B.; Tang, J.; Yu, D.; Song, Z.; Wang, P. Ecosystem Health Assessment: A PSR Analysis Combining AHP and FCE Methods for Jiaozhou Bay, China. Ocean Coast. Manag. 2019, 168, 41–50. [Google Scholar] [CrossRef]
  120. Zhang, X.; Shi, P. The Assessment of Urban Ecosystem Health Based on PSR Model-A Case Study of Lanzhou City. J. Arid. Land Resour. Environ. 2010, 24, 77–82. [Google Scholar]
  121. Wang, Y.-T.; Wang, Y.-S.; Wu, M.-L.; Sun, C.-C.; Gu, J.-D. Assessing Ecological Health of Mangrove Ecosystems along South China Coast by the Pressure–State–Response (PSR) Model. Ecotoxicology 2021, 30, 622–631. [Google Scholar] [CrossRef]
  122. Sun, J.; Wei, F. The Health Assessment of the Urban Ecosystem and Analysis of Coordination for the City of Lanzhou. J. Geo. Inf. Sci. 2017, 19, 511–517. [Google Scholar]
  123. Niu, M.; Wang, J. Discussion over Health Assessment Indicator System of Ecosystem in Yellow River Estuary Area. Water Resour. Prot. 2016, 32, 57–63. [Google Scholar]
  124. Zhao, B.; Kreuter, U.; Li, B.; Ma, Z.; Chen, J.; Nakagoshi, N. An ecosystem service value assessment of land-use change on Chongming Island, China. Land Use Policy 2004, 21, 139–148. [Google Scholar] [CrossRef]
  125. Butler, C.; Oluoch-Kosura, W. Linking Future Ecosystem Services and Future Human Well-being. Ecol. Soc. 2006, 11, 30. [Google Scholar] [CrossRef] [Green Version]
  126. Pan, Z.; He, J.; Liu, D.; Wang, J.; Guo, X. Ecosystem Health Assessment Based on Ecological Integrity and Ecosystem Services Demand in the Middle Reaches of the Yangtze River Economic Belt, China. Sci. Total Environ. 2021, 774, 144837. [Google Scholar] [CrossRef]
  127. Peng, J.; Liu, Y.; Wu, J.; Lv, H.; Hu, X. Linking Ecosystem Services and Landscape Patterns to Assess Urban Ecosystem Health: A Case Study in Shenzhen City, China. Landsc. Urban Plan. 2015, 143, 56–68. [Google Scholar] [CrossRef]
  128. Liu, R.; Dong, X.; Zhang, P.; Zhang, Y.; Wang, X.; Gao, Y. Study on the Sustainable Development of an Arid Basin Based on the Coupling Process of Ecosystem Health and Human Wellbeing Under Land Use Change—A Case Study in the Manas River Basin, Xinjiang, China. Sustainability 2020, 12, 1201. [Google Scholar] [CrossRef] [Green Version]
  129. Mallick, J.; AlQadhi, S.; Talukdar, S.; Pradhan, B.; Bindajam, A.; Islam, A.; Dajam, A. A Novel Technique for Modeling Ecosystem Health Condition: A Case Study in Saudi Arabia. Remote Sens. 2021, 13, 2632. [Google Scholar] [CrossRef]
  130. Toro, I.D.; Ribbons, R.R.; Pelini, S.L. The Little Things that Run the World Revisited: A Review of Ant-Mediated Ecosystem Services and Disservices (Hymenoptera: Formicidae). Myrmecol. News 2014, 17, 133–146. [Google Scholar]
  131. Bharti, H.; Bharti, M.; Pfeiffer, M. Ants as Bioindicators of Ecosystem Health in Shivalik Mountains of Himalayas: Assessment of Species Diversity and Invasive Species. Asian Myrmecol. 2016, 8, 65–79. [Google Scholar]
  132. Jenssen, M.; Nickel, S.; Schütze, G.; Schröder, W. Reference States of Forest Ecosystem Types and Feasibility of Biocenotic Indication of Ecological Soil Condition as Part of Ecosystem Integrity and Services Assessment. Environ. Sci. Eur. 2021, 33, 1–18. [Google Scholar] [CrossRef]
  133. Harwell, M.A.; Gentile, J.H.; McKinney, L.D.; Tunnell, J.W.; Dennison, W.C.; Kelsey, R.; Stanzel, K.M.; Stunz, G.W.; Withers, K.; Tunnell, J. Conceptual Framework for Assessing Ecosystem Health. Integr. Environ. Assess. Manag. 2019, 15, 544–564. [Google Scholar] [CrossRef]
  134. Mariano, D.A.; dos Santos, C.A.; Wardlow, B.; Anderson, M.C.; Schiltmeyer, A.V.; Tadesse, T.; Svoboda, M.D. Use of Remote Sensing Indicators to Assess Effects of Drought and Human-Induced Land Degradation on Ecosystem Health in Northeastern Brazil. Remote Sens. Environ. 2018, 213, 129–143. [Google Scholar] [CrossRef]
  135. Stoll, S.; Frenzel, M.; Burkhard, B.; Adamescu, M.; Augustaitis, A.; Baeßler, C.; Bonet, F.J.; Carranza, M.L.; Cazacu, C.; Cosor, G.L.; et al. Assessment of Ecosystem Integrity and Service Gradients Across Europe Using the LTER Europe Network. Ecol. Model. 2015, 295, 75–87. [Google Scholar] [CrossRef]
  136. Haase, R.; Nolte, U. The Invertebrate Species Index (ISI) for Streams in Southeast Queensland, Australia. Ecol. Indic. 2008, 8, 599–613. [Google Scholar] [CrossRef]
  137. Couceiro, S.; Hamada, N.; Forsberg, B.; Pimentel, T.; Luz, S. A Macroinvertebrate Multimetric Index to Evaluate the Biological Condition of Streams in the Central Amazon Region of Brazil. Ecol. Indic. 2012, 18, 118–125. [Google Scholar] [CrossRef]
  138. Costanza, R.; Patten, B.C. Defining and Predicting Sustainability. Ecol. Econ. 1995, 15, 193–196. [Google Scholar] [CrossRef]
Figure 1. Bibliographic analysis results. (a) Keywords co-occurrence analysis. Cluster 1 is a toxicological cluster, clusters 2 and 5 are ecological clusters, cluster 3 and 4 are biological clusters. (b) Author co-citation analysis.
Sustainability 13 11838 g001
Figure 2. The most commonly used indices, metrics of indices, and where they are used most. (a) Diatom indices: BDI: Biological Diatom Index; SPI: Specific Pollution Sensitivity Index; TDI: Trophic Diatom Index. (b) Plankton indices: PTI: Phytoplankton Trophic Index; IBI: Index of Biotic Integrity. (c) Macroinvertebrate indices: BMWP: Biological Monitoring Working Party; HBI: Hilsenhoff biotic index; EPT: Ephemeroptera, Plecoptera, and Trichoptera.
Sustainability 13 11838 g002
Figure 3. Summary of assessed ecosystem types in the publications found in the systematic review. All studies were classified by aquatic ecosystems and terrestrial ecosystem (a). The aquatic ecosystem (b) and terrestrial ecosystem (c) were also classified.
Sustainability 13 11838 g003
Figure 4. Summary of assessed ecosystems which adopted biological indicator method. The study was classified by aquatic ecosystem and terrestrial ecosystem (a). The aquatic ecosystem (b) and terrestrial ecosystem (c) were also classified.
Sustainability 13 11838 g004
Figure 5. Summary of assessed ecosystems which adopted index system method. The study was classified by aquatic ecosystem and terrestrial ecosystem (a). The aquatic ecosystem (b) and terrestrial ecosystem (c) were also classified.
Sustainability 13 11838 g005
Publisher’s Note: MDPI stays neutral with regard to jurisdictional claims in published maps and institutional affiliations.

