Abstract
In this work, an improved approach to enhance the training performance of an Artificial Neural Network (ANN) for prediction of the output of renewable energy systems is proposed. Using the proposed approach, a significant reduction of the Mean Squared Error (MSE) in training performance is achieved, specifically from 4.45 × 10⁻⁷ to 3.19 × 10⁻¹⁰. Moreover, a simplified application of the already trained ANN is introduced through which photovoltaic (PV) output can be predicted without the availability of real-time current weather data. Moreover, unlike the existing prediction models, which ask the user to apply multiple inputs in order to forecast power, the proposed model requires only the set of dates specifying forecasting period as the input for prediction purposes. Moreover, in the presence of the historical weather data this model is able to predict PV power for different time spans rather than only for a fixed period. The prediction accuracy of the proposed model has been validated by comparing the predicted power values with the actual ones under different weather conditions. To calculate actual power, the data were obtained from the National Renewable Energy Laboratory (NREL), USA and from the Universiti Teknologi Malaysia (UTM), Malaysia. It is envisaged that the proposed model can be easily handled by a non-technical user to assess the feasibility of the photovoltaic solar energy system before its installation.
1. Introduction
Solar photovoltaic (PV) modules of various sizes have been commercialized due to their potential long term economic and environmental benefits [1,2,3,4]. The prospects of PV are enhanced by continuous price reduction in the modules and inverter. However, like most sustainable energy sources, its availability is intermittent due to varying weather conditions [2,5,6,7,8,9,10,11,12,13]. It is established that PV power depends on various complex weather conditions like temperature, radiation, wind speed, dust and humidity. To handle these kinds of complexities and to provide accurate predictions, development of authentic as well as practical prediction models is extremely significant [14]. Moreover, in order to efficiently utilize PV power, particularly when connected to the electrical grid, there is a need for accurate predictions of the power yield, as power system operation with proper planning is a task of utmost importance for enhancing the reliability of the system [7,15,16,17,18,19]. This, in turn, requires real-time measurement of electrical and meteorological data. With the availability of this information, artificial intelligence (AI) techniques can be used to synchronize PV power generation with the grid and subsequently take advantage of the tariff structure [15,20].
The Artificial Neural Network (ANN) is an important tool to solve non-linear relationships among data without prior assumptions concerning the nature of their correlations. The ANN is extensively employed in the modelling, identification, optimization, prediction and control of complex systems [8,15,21]. In PV system applications, ANN is used mainly to predict power output. It has been shown to give superior results compared to classical or analytical approaches like the regression, time-series or state-space methods [22,23,24,25,26].
To date, various ANN models have been proposed with various complexity and accuracy [5,6,15,22,23,27,28,29,30,31]. A novel PV power prediction model utilizing a deep Convolutional Neural Network (CNN) system and the input signal decomposition algorithm was presented in [32]. This CNN system takes out deep features for short-term power forecasting by means of the transfer learning-based AlexNet. In another work [33], the authors aimed to integrate the data from the Numerical Weather Prediction system with machine learning in order to accurately forecast PV power. In this work, the ANN structure was applied to forecast PV output by means of irradiation and temperature data extracted from Global Data Assimilation System (GDAS). In a recent work [34], a short-term prediction system was presented to improve the hybrid forecasting accuracy of multiple generation sources, such as PV and wind in the same area. The researchers in [35] proposed a two-step method for PV power forecasting using weather data through Machine Learning. This approach proposed a process which connects unannounced weather data with announced weather forecasts. The existing prediction models can forecast PV power in the presence of real-time current weather data and predict for a fixed time span: for instance, the model in [27] can predict for one day ahead only; in [28] for a day ahead; in [29] for a day ahead; in [30] for a day ahead; in [15] for a week ahead; in [23] for a month ahead; in [36] for a month ahead; in [37] for a year ahead; and in [38] for a day ahead. The proposed work is an effort to make the prediction model capable of forecasting for different time spans even in the presence of current weather data. It bears mentioning that the aforementioned models have differences in structures and different complexity levels.
Based on the dissimilarities and complexities found in existing prediction models, they can generally be divided into four types: (1) the hybrid model [15,28,29,30], where ANN is combined with other classical or analytical tool such as time-series model (nonlinear autoregressive network with exogenous) [28] and multiregression analysis [15]; (2) the indirect model [5,39], where solar irradiance is predicted based on related weather data in a first step, then in a second step this irradiance is converted to PV power output; (3) the direct model [6,15,22,23,27,28,29,30], where PV power is predicted directly by the use of weather data in only one step; and (4) the standalone model [6,22,23,27], where the ANN is solely used as a prediction engine, such as multilayered feedforward back-propagation neural network [6,27], standard feedforward back propagation (FFBP) and general regression neural network [23].
Among these models, (3) and (4) are found to be simpler due to the lower number of steps and tools involved in their training. Moreover, their combination gives better training performance, as proven by in [23], where performance was improved with respect to the lowest Mean Squared Error (MSE) compared to the other models. Despite the simplicity of the model proposed in [23], it exhibits several disadvantages: (1) it involves normalization and denormalization of data before and after training the ANN, which increases the overall processing steps; (2) five years of data is used for both training and testing of the ANN, while normally it is not feasible to get data for such a long period; and (3) it considers a standard FFBP neural network to be the best choice for the PV prediction model, which is not true according to the most recent research [40,41,42].
In view of these shortcomings, a bayesian regulation backpropagation neural network with multiple hidden layers is proposed in this paper to overcome the highlighted problems. The proposed work needs no normalization and denormalization steps before or after training of the ANN, which simplifies the model. Moreover, unlike the previous work where five years data were considered for training purposes [23], one year’s data is used here for both training and testing of the ANN, while achieving better training performance in terms of reduced MSE. Using these data, PV power is calculated with the help of the single diode model and Newton Raphson Method. For better training performance, the ANN is provided with two sets of inputs. The first set of inputs consists of the weather parameters in their original fluctuating form. The second set of inputs comprises the smooth values (obtained by applying a moving average) of the most fluctuating parameters. Application of the moving average removes short-term variation from the data [43,44], and thus helps the ANN to be trained accurately.
It is worth mentioning that almost all existing prediction models require the same number of inputs at the time of prediction as were applied while training the ANN. Consequently, the user is unable to predict PV power without having current real-time weather data. To overcome this shortcoming, the proposed model can be simply used for PV power prediction (for various time spans) by applying a set of dates as the only input by the user. This model is configured in such a way that the remaining inputs required by the already-trained network are automatically extracted from the existing database (having historical weather parameters) instead of real-time current weather parameters, as per the user-applied dates. Thus, the contributions of this work are summarized as:
- Improving the training performance of the ANN
- Prediction of PV power without real-time current weather data
- Model needs only the set of dates for prediction from the user
- Proposed model can predict PV power for various time spans
The rest of the paper is organized as follows: In the second section, a PV single diode model to calculate the module’s output power is presented. The third section explains the overall methodology. In the fourth section, the results and discussion are presented. Lastly, conclusions and possibilities for future work are provided.
2. PV Diode Model for Power Prediction
The most commonly used model to calculate power production by PV cell is the single diode equivalent circuit [1,45,46]. Due to its non-ideal structure in nature, there are some losses which occur in real PV cells. These losses are expressed by series (Rs) and parallel (Rsh) resistances in equivalent circuits, as shown in Figure 1 [47,48,49,50].
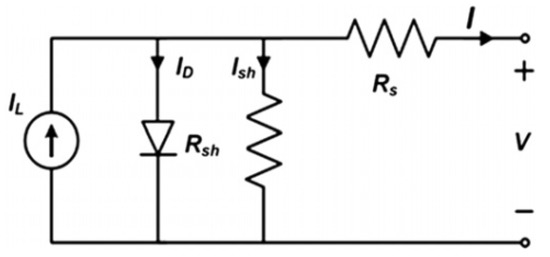
Figure 1.
PV single diode circuit model.
By applying Kirchhoff’s law, the output current I will be obtained by Equation (1) [49]:
where IL is photo current, i.e., current generated by the incidence of light, ID is diode current and Ish is leakage current in shunt resistor. Photo current can be obtained by Equation (2) [22]:
where is the short circuit reference current (in Ampere) at STC, G is the surface irradiance of the cell, is irradiance at STC (1000 W/m2), is short circuit current coefficient provided by manufacturer, Tc is temperature of environment in Kelvin, and Tref is temperature at STC (298° K).
The diode current can be obtained by Equation (3) [49]:
where I0 is saturation or leakage current of the diode, q is electron charge (1.602 × 10⁻¹⁹ C), V is voltage imposed on the diode, and n is ideality factor. The value of the ideality factor is typically 1 ≥ n ≤ 2 [51]; n is taken as 1 in this work, as suggested in [1], k is Boltzmann constant defined as 1.381 × 10⁻²³ J/K and T is actual cell temperature, which is normally equal to environmental temperature. For multiple solar cells connected in series and parallel, the value of output current of PV module can be found by Equation (4) [1,52,53,54]:
where NP and NS is number of solar cells connected in parallel and in series, respectively. The value of RS can be obtained analytically; however, RSh is assumed to be infinity [51]. The output voltage can be calculated by Equation (5) [22,51]:
where Voc,ref is the reference voltage at STC given by the manufacturer and is the temperature coefficient of voltage, also normally given by the manufacturer.
The module’s reverse saturation current can be found by Equation (6) [53].
The saturation or leakage current of diode can be found by Equation (7) [52,53,55,56]:
where Eg is the energy gap or band gap for silicon, equal to 1.1 eV for silicon and 1.39 for gallium arsenide [49,57]
The value of PV power (considering maximum power point tracking, i.e., MPPT) is then calculated using Equation (8) [57,58,59].
The PV power calculation is discussed in detail under the following subsection on methodology.
3. Methodology
The proposed work was carried out using Matlab (R2021a) software. The illustration of the overall prediction system in a graphical manner is shown in Figure 2.
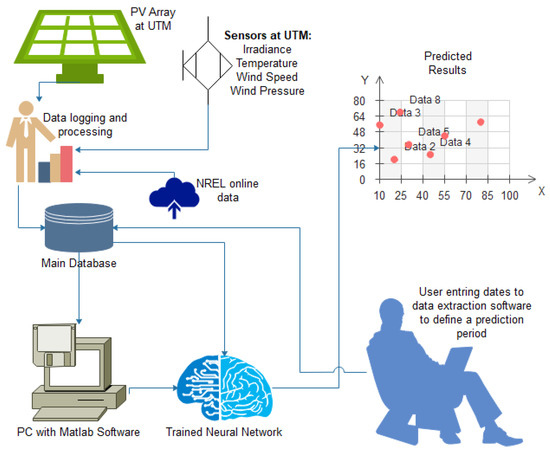
Figure 2.
Illustration of the overall prediction system in graphical manner.
For accurate training of the ANN and in order to use the data at the time of prediction without having current real-time weather data, a main database must be maintained consisting of the historical metrological parameters. Data were taken from two sources with different weather conditions. The first source was the National Renewable Energy Laboratory (NREL), USA. The hourly NREL data were obtained from the official website, http://www.nrel.gov/, accessed on 27 August 2021. This database consists of ten years of data from 1st July 2003 to 30th June 2013. The one-year data were selected as a case study for training and testing purposes while the remaining data were used for prediction purposes in the absence of current weather data. The second source of data was the PV-based EV charging station at the Universiti Teknologi Malaysia (UTM), Malaysia. The Centre of Electrical Energy Systems, UTM has established a 15kW grid-connected PV setup with a fully equipped data logging system, as shown in Figure 3.
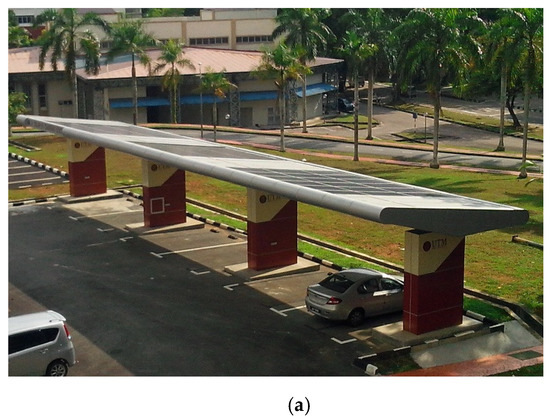
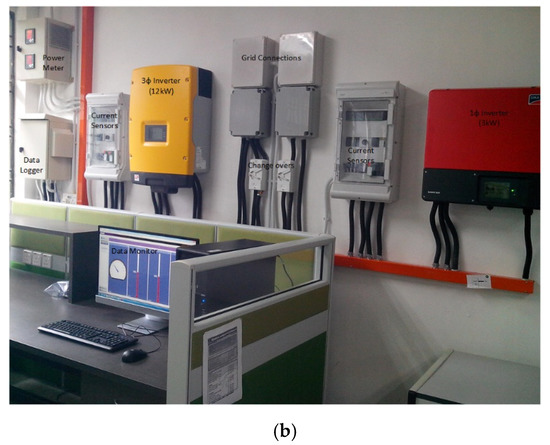
Figure 3.
(a) PV-EV charging Station, (b) Data logging system at UTM.
The data logger has ability to track and store weather parameters and electrical variables for every minute, thirty minutes and one hour of the day. These weather parameters are directly used to calculate the output power of the PV array.
3.1. PV Power Calculations
For output power calculation, the parameters of the PV module of Kyocera company were taken as the case study. These parameters are given in Table 1. The reverse saturation current is calculated using Equation (6). Similarly, the saturation or leakage current and photo current are calculated using Equatizons (7) and (2), respectively. The series resistance of the single diode model is calculated using the simple relation RS = (Voc − Vmp)/Imp and the parameters from Table 1. Rsh is taken as 10 kΩ, because Rsh is very high [51]. Based on the parameters given in the PV datasheet, the maximum power (Pmp) is calculated using values given in Table 1 as Pmp = Vmp × Imp. Since Equation (4) is transcendental in nature, the method of Newton–Raphson (NR) iteration was applied to find photovoltaic current, as shown in Figure 4 [1,49,57]. NR algorithm has the advantage of very quick quadratic convergence for initial values near the root; thus, a good solution can be achieved within a few iterative steps [1].

Table 1.
Module specifications at STC, KD325GX-LFB Model.
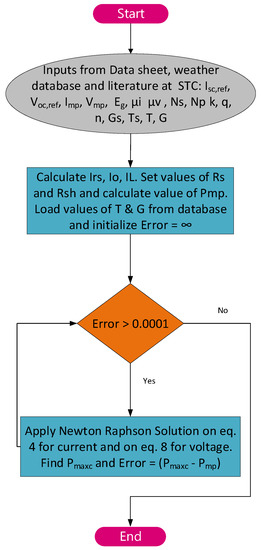
Figure 4.
Newton Raphson Solution for PV current and power calculation.
The PV power using Equation (8) is calculated and maximum power (Pmaxc) extracted by taking maximum power point tracking into account. To calculate the accurate value of current and power, a small iteration termination threshold for error was taken equal to 0.0001; the error was calculated as (Pmaxc − Pmp) [1].
The calculated PV power is stored in the already maintained database to use as a target during the training phase of ANN and for comparison purposes. Nevertheless, before applying the fluctuating parameters to the network for its training, the moving average was applied on these parameters.
3.2. Application of Moving Average
As per the help document of MATLAB R2021a, Arima enables a user to create variations of the autoregressive integrated moving average (ARIMA) model, including an autoregressive (AR(p)), moving average (MA(q)), or ARMA(p,q) model. As discussed earlier, weather conditions are always fluctuating and thus influencing the generation of PV power directly [5,6]. To remove these short-term variations/fluctuations for better training of the network, the moving average (MA) of these variables was obtained before applying them to the ANN in this work. For this purpose, the abruptly fluctuating parameters were divided into more than one value by taking their moving average for one day, two days and so forth. The increased number of variables with less variation helped the ANN to be trained in a more generalized way. This is because the moving average smoothens the data, which then provide a clear visual picture of the variable to the neural network for better training [43,44]. The simple moving average (MA) concept can be explained by the Equation (9) [44].
is the average value, are historical values, and D is the number of days for which the moving average is to be calculated. The most important and directly affecting parameter on PV power generation is solar irradiance, of which the actual and moving average-based patterns for eleven days (i.e., D = 11) are shown in Figure 5. In this figure, the blue lines show the actual values of solar irradiance and the orange lines represent their moving average.
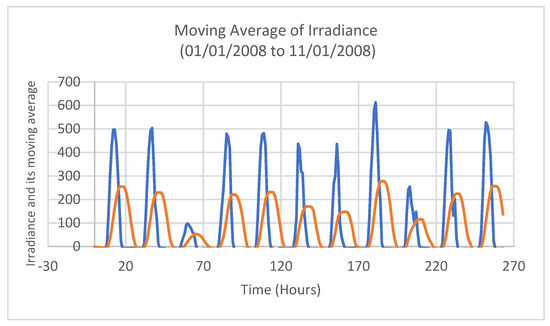
Figure 5.
Irradiance and its moving average.
The moving average of irradiance shows the same pattern as the original one, however with considerably reduced and smooth variations. Therefore, the inclusion of MA-based parameters during the training phase of the ANN has enhanced training performance by reducing the MSE by a significant amount, as shown in the results section. This is the main contribution of this work, which is proved in the next section. It is to be mentioned here that MSE to measure the training performance of feedforward neural networks is used by various researchers [50,60].
3.3. ANN Training Phase
Only one year of data out of the main ten-year database was used for ANN training (80%) and testing (20%) purposes; the remaining data were used for validation and prediction of PV power. The purpose of using only one year of data for training was to make the proposed model comparable with existing work, as most researchers use one year data for training of the ANN [15,27,28,29,30]. The specifications of selected networks in this work are as follows:
Algorithm: Bayesian regulation backpropagation
The trainbr (Bayesian regularization) training function was used in this work. This is because the trainbr algorithm generally works best when the network falls approximately in both the positive and negative range of inputs [42]. Though it takes a longer training time than other training functions, this is good choice in the case of complex problems because it produces better generalization capability [42]. It updates the weight and bias values according to Levenberg–Marquardt optimization and then determines the correct combination to produce a well-generalized network [61].
Layers: Six hidden layers with sizes of 11 11 11 10 10 10, respectively, and one output layer.
It is worth mentioning that, in order to train the network accurately, the average of weather parameters was also added as an input besides their actual values. The weather parameters used for training the ANN were quite fluctuating, and their quantity has thus been increased by adding their average values. This makes the system more complex; thus, in order to enhance the training performance of the network and to have more generalized prediction capabilities, the number of hidden layers was increased. To get the finalized structure as shown in Figure 6, different combinations of hidden layers and number of neurons were checked until getting the smallest MSE in training performance on a trial basis, as adopted in existing research works [62,63,64,65].
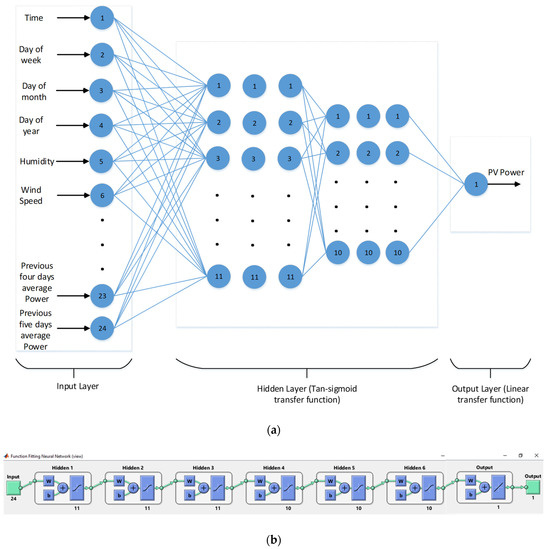
Figure 6.
(a) shows the structure of final ANN (b) depicts the structure of final ANN generated by the Matlab itself.
Transfer function: Tan-sigmoid for each hidden and linear transfer function for output layer was selected. This was because the tan-sigmoid covers both positive and negative values, which suits the nature of the applied input variables in this work. For ease of reading, the parameters of the proposed ANN structure are given in Table 2.
Table 2.
Parameters of the proposed ANN structure.
Input data: The inputs applied to the neural network are given in Table 3
Table 3.
Input parameters/variables applied for neural network training.
The first four inputs in Table 2 were used (in the form of dates) during the training and prediction phases in order to extract the remaining parameters from the already-maintained historical database.
The next five inputs, humidity, wind speed, air pressure, irradiance and temperature, were the main inputs used for training the network. The remaining average inputs (obtained by means of RA) were used mainly for reduction of training and prediction errors.
Target: PV Power
Target is the variable that is the mandatory input of the ANN at the time of training. This is the input which is to be predicted by using the already trained network; that is, PV power in this work. The structure of the proposed multilayer neural network is shown in Figure 6. Figure 6a shows the detailed structure of the proposed ANN showing each hidden layer, their neurons and the transfer functions within entire network.
Matlab has the capability to generate the graph of MSE against each iteration (epoch) during the training phase of the network, as shown in Figure 7. This MSE actually represents the training performance of the network.
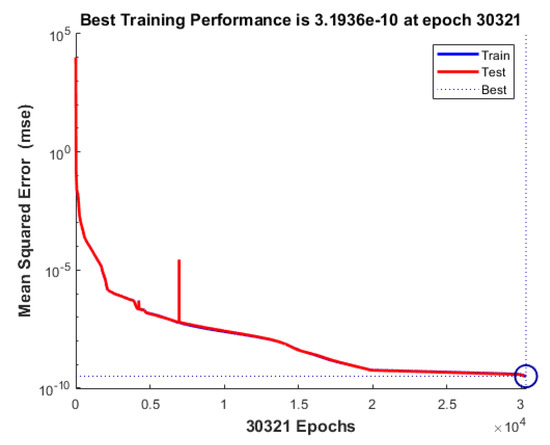
Figure 7.
Training epochs to reach the target MSE.
It is clear from Figure 7 that the obtained error (i.e., MSE) with the proposed structure of network was 3.19 × 10⁻¹⁰, which is much lower than the least obtained error in the existing literature (i.e., 4.45 × 10⁻⁷ [23]). It is worth mentioning that the data of a five year period was used in [23] for training and testing purposes, while in our proposed work the data of only one year’s span was used for the same purpose. Even then, the obtained error in the case of the proposed model was smaller, which shows the remarkable improvement in the training performance of the ANN.
The Matlab generated regression plots, as shown in Figure 8, clearly depict the accuracy of the training as well as the testing phases of the proposed network.
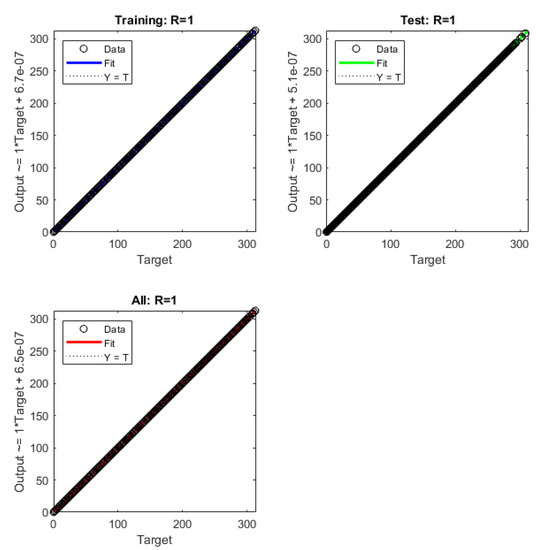
Figure 8.
NN training regression plots.
Once the network was trained, it could be used for predicting PV power by applying the required input parameters.
3.4. Prediction Phase
In this work, the utilization of the already trained neural network was made quite simple compared to the already-proposed networks in the existing literature. The existing models need current real-time weather parameters as an input (exactly equal in number to those applied during the training phase) in order to predict PV power. However, in our proposed work, the operator needs to apply only a set of dates (to specify prediction period) as an input in order to forecast the power. The remaining input parameters are extracted from a historical database which already contains the time, day and weather parameters. A simple data extraction algorithm (the pseudocode is given in the next section) was developed to automatically extract the remaining input parameters from this database by matching the days with the user’s applied date. Firstly, the user’s applied date is converted to day of week, month and year using the built-in functions of Matlab. As the database contains the value of each parameter for ten years against that specific date, the algorithm takes the mean of each variable for every hour to obtain a single value of each parameter. This average gives a very close value of each parameter to the real one. Thus, the extracted parameters are applied to the already trained NN for PV power prediction without having current real-time data. Therefore, the proposed work not only improves the training performance of the ANN but also makes use of this trained network for prediction of PV power without the presence of the real-time weather parameters. Thus, the proposed work makes the prediction process completely independent of any kind of external data except a set of dates.
A flowchart describing the overall functionality of the final prediction algorithm is shown in Figure 9.
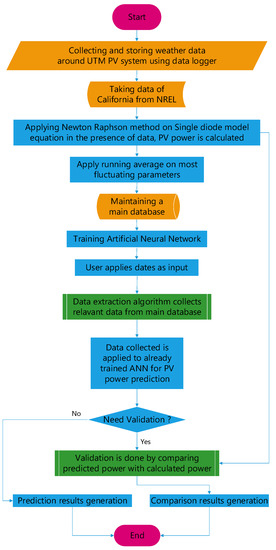
Figure 9.
A flowchart describing the functionality of the final prediction algorithm.
For ease of reading, the above flowchart provides self-explanatory details of the overall methodology of the proposed work. It is important to note that the proposed prediction model is capable of forecasting power for different time spans depending upon the applied dates used to extract the data. This is another contribution of this work, as the exiting models can make predictions for a fixed time span.
3.5. Pseudocode of Data Extraction Algorithm
The pseudocode of the simple algorithm used for extraction of required input data from the main ten-year historical database according to the dates entered by the user is presented in this section. The extracted inputs were automatically applied to the already-trained network in order to predict the PV power for every hour of the mentioned time span.
Data extraction algorithm starts
Load historical database
Ask user to enter start and end dates
Obtain days of year from entered dates using Matlab built-in function
Starts For loop for 24 h, i.e., 0:23
Starts While loop (<=days of year) %depends on years of historical database
Extract historical parameters of every hour for every day of year
Ends While loop
Take average of each parameter to get single value
Perform moving average (MA) on fluctuating variables
Apply extracted and RA-based parameters to the already-trained ANN to predict PV Power
Ends For loop
The data extraction algorithm facilitates a user (without requiring any knowledge of AI) to predict PV power for any time span in the absence of real-time weather parameters by merely entering a set of dates.
4. Results and Discussion
It is important to note that in the existing literature, researchers have validated their work through comparisons of predicted data with actual data from a single source [5,30,66,67,68]. However, in this work, the data from two different countries (Malaysia and United States) having entirely different weather conditions are used for validation purposes. Due to its existence on the equator, the weather of Malaysia is quite unstable compared to that of the USA. Figure 10a,b show the successful comparison between actual and predicted PV power under unstable weather conditions at UTM, Malaysia, while Figure 10c,d show the comparison under stable weather conditions at NREL (California), USA, each for different time spans. The coherency of predicted power with actual power in these results successfully validates the proposed prediction model.
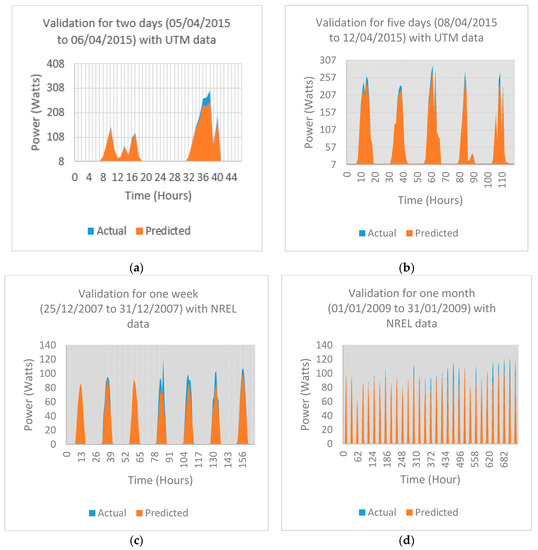
Figure 10.
(a,b) show comparison between actual and predicted PV power for validation with UTM Malaysian data; (c,d) show comparison between actual and predicted PV power for validation with NREL USA data.
The previous results in Figure 10 validate the accuracy of the prediction by means of comparison between actual and predicted power. Figure 11 shows the capability of the proposed model to use the already-trained neural network to predict power for any span of time without the presence of real-time weather data by utilizing historical data only. Figure 11a–d show the predicted power for one day, one week, one month and three years using the proposed algorithm. This shows that the proposed model is quite flexible in predicting power for various time periods.
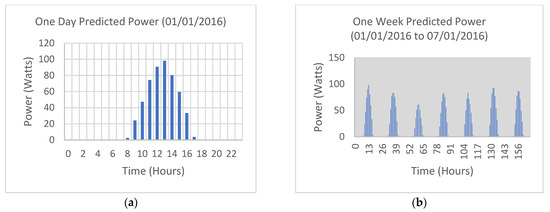
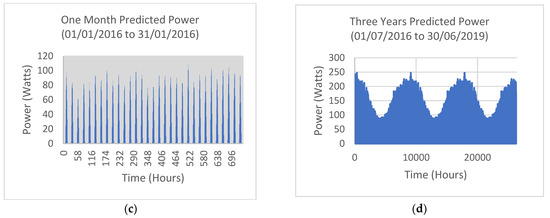
Figure 11.
(a–d) show predicted power for one day, one week, one month and three years.
The comparison of errors for training performance (mean squared error, i.e., MSE) and prediction performance (mean absolute percentage error, i.e., MAPE) obtained with the proposed and the already published models is given in Table 4. The results in the table clearly show the significant reductions in MSE and MAPE in the case of the proposed work.
Table 4.
Comparison of proposed approach with the existing work.
Since the application of the already-trained network is made simple in this work, the proposed solution also provides a guide to the installers of the PV system to estimate its yield (by predicting PV power) prior to its installation in the presence of the historical weather data only.
5. Conclusions and Future Work
PV power prediction through ANN is a real life application of artificial intelligence in the field of renewable energy systems. This work has improved the training performance of a neural network by applying the moving average of the most sensitive and fluctuating weather parameters and increasing the hidden layers of the ANN. The results evidently show that the training performance error has been considerably reduced (from 4.45 × 10⁻⁷ to 3.19 × 10⁻¹⁰) compared to the errors obtained in existing ANN-based models. Moreover, prediction of PV power without real-time current weather data is made possible by exploiting historical weather data. It is worth mentioning that the proposed model asks the user to apply externally only the set of dates for prediction purpose, instead of multiple weather parameters. Unlike the existing prediction models, the proposed model has the capability to predict PV power for various time spans. Though the proposed approach is simple, it is quite novel and very useful for prediction of PV power without real-time current weather data. As a future work, the accuracy of the proposed work can be further enhanced by training the network with larger historical weather data (more than one year) and by using the two-diode model of solar cell instead of the single diode model.
Author Contributions
Conceptualization, A.R.B. and Z.S.; methodology, A.R.B. and Z.S.; software, A.B.A. and W.A.; validation, A.S.B.H., P.R.P. and K.B.; formal analysis, A.R.B.; investigation, A.B.A. and W.A.; resources, A.B.A. and W.A.; data curation, A.R.B. and A.B.A.; writing—original draft preparation, A.R.B.; writing—review and editing, A.R.B. and Z.S.; visualization, A.B.A. and W.A.; supervision, Z.S.; project administration, W.A.; funding acquisition, A.B.A., W.A., A.S.B.H., P.R.P. and K.B.; All authors have read and agreed to the published version of the manuscript.
Funding
This research was funded by the Ministry of Education of Saudi Arabia, grant number IFP-2020-01 and the APC was funded through IFP-2020-01.
Institutional Review Board Statement
Since this study is not involving humans or animals, no need of Institutional Review Board Statement and its approval number.
Informed Consent Statement
Since this study is not involving humans or animals, no need of Consent Statement.
Data Availability Statement
The major portion of data were taken from National Renewable Energy Laboratory (NREL), USA through its official website, http://www.nrel.gov/ (accessed on 27 August 2021).
Acknowledgments
The Ministry of Education of Saudi Arabia has supported this research work under Grant IFP-2020-01. The authors are thankful to Universiti Teknologi Malaysia (UTM), Malaysia for providing metrological and electrical data. They are also grateful to the National Renewable Energy Laboratory (NREL), USA for providing open-source data that helped greatly during the training and validation phases of this research work.
Conflicts of Interest
The authors declare no conflict of interest.
References
- Ishaque, K.; Salam, Z. A comprehensive MATLAB Simulink PV system simulator with partial shading capability based on two-diode model. Sol. Energy 2011, 85, 2217–2227. [Google Scholar] [CrossRef]
- Demircan, C.; Bayrakçı, H.C.; Keçebaş, A. Machine learning-based improvement of empiric models for an accurate estimating process of global solar radiation. Sustain. Energy Technol. Assess. 2020, 37, 100574. [Google Scholar] [CrossRef]
- Bhatti, A.R.; Salam, Z.; Rasheed, N.; Sultana, B. Optimized sizing of photovoltaic grid-connected electric vehicle charging system using particle swarm optimization. Int. J. Energy Res. 2019, 43, 500–522. [Google Scholar] [CrossRef]
- Kumar, A.; Rizwan, M.; Nangia, U. A Hybrid Intelligent Approach for Solar Photovoltaic Power Forecasting: Impact of Aerosol Data. Arab. J. Sci. Eng. 2020, 45, 1715–1732. [Google Scholar] [CrossRef]
- Yona, A.; Senjyu, T.; Saber, A.Y.; Funabashi, T.; Sekine, H.; Kim, C.H. Application of neural network to 24-hour-ahead generating power forecasting for PV system. In Proceedings of the Power and Energy Society General Meeting—Conversion and Delivery of Electrical Energy in the 21st Century, Pittsburgh, PA, USA, 20–24 July 2008. [Google Scholar]
- Kou, J.; Liu, J.; Li, Q.; Fang, W.; Chen, Z.; Liu, L.; Guan, T. Photovoltaic power forecasting based on Artificial Neural Network and meteorological data. In Proceedings of the TENCON 2013 IEEE International Conference on Robotics and Automation, Karlsruhe, Germany, 6–10 May 2013. [Google Scholar]
- Cho, Y.; Shaygan, A.; Daim, T.U. Energy technology adoption: Case of solar photovoltaic in the Pacific Northwest. USA Sustain. Energy Technol. Assess. 2019, 34, 187–199. [Google Scholar] [CrossRef]
- Castro, R. Data-driven PV modules modelling: Comparison between equivalent electric circuit and artificial intelligence based models. Sustain. Energy Technol. Assess. 2018, 30, 230–238. [Google Scholar] [CrossRef]
- Bhatti, A.R.; Salam, Z.; Aziz, M.J.B.A.; Yee, K.P.; Ashique, R.Q. Electric vehicles charging using photovoltaic: Status and technological review. Renew. Sustain. Energy Rev. 2016, 54, 34–47. [Google Scholar] [CrossRef]
- Awan, A.B.; Zubair, M.; Sidhu, G.A.S.; Bhatti, A.R.; Abo-Khalil, A.G. Performance analysis of various hybrid renewable energy systems using battery, hydrogen, and pumped hydro-based storage units. Int. J. Energy Res. 2019, 43, 6296–6321. [Google Scholar] [CrossRef]
- Khan, N.A.; Sidhu, G.A.S.; Awan, A.B.; Ali, Z.; Mahmood, A. Modeling and operation optimization of RE integrated microgrids considering economic, energy, and environmental aspects. Int. J. Energy Res. 2019, 43, 6721–6739. [Google Scholar] [CrossRef]
- Awan, A.B. Optimization and techno-economic assessment of rooftop photovoltaic system. J. Renew. Sustain. Energy 2019, 11, 033501. [Google Scholar] [CrossRef]
- Li, H.; Liu, Y.; Yang, J. A Novel FCS-MPC Method of Multi-Level APF Is Proposed to Improve the Power Quality in Renewable Energy Generation Connected to the Grid. Sustainability 2021, 13, 4094. [Google Scholar] [CrossRef]
- Yildiz, C.; Acikgoz, H. A kernel extreme learning machine-based neural network to forecast very short-term power output of an on-grid photovoltaic power plant. Energy Sources Part A Recovery Util. Environ. Eff. 2021, 43, 395412. [Google Scholar] [CrossRef]
- De Giorgi, M.G.; Congedo, P.M.; Malvoni, M. Photovoltaic power forecasting using statistical methods: Impact of weather data. Sci. Meas. Technol. 2014, 8, 90–97. [Google Scholar] [CrossRef]
- Saddique, M.S.; Bhatti, A.R.; Haroon, S.S.; Sattar, M.K.; Amin, S.; Sajjad, I.A.; ul Haq, S.S.; Awan, A.B.; Rasheed, N. Solution to optimal reactive power dispatch in transmission system using meta-heuristic techniques―Status and technological review. Electr. Power Syst. Res. 2020, 178, 106031. [Google Scholar] [CrossRef]
- Sahin, A.Z.; Ismaila, K.G.; Yilbas, B.S.; Al-Sharafi, A. A review on the performance of photovoltaic/thermoelectric hybrid generators. Int. J. Energy Res. 2020, 44, 3365–3394. [Google Scholar] [CrossRef]
- Kumar, R.; Deshmukh, V.; Bharj, R.S. Performance enhancement of photovoltaic modules by nanofluid cooling: A comprehensive review. Int. J. Energy Res. 2020, 44, 6149–6169. [Google Scholar] [CrossRef]
- Guo, J.; Xu, X.; Lian, W.; Zhu, H. A new approach for interval forecasting of photovoltaic power based on generalized weather classification. Int. Trans. Electr. Energy Syst. 2019, 29, 2802. [Google Scholar] [CrossRef]
- Sauer, K.J.; Roessler, T.; Hansen, C. Modeling the Irradiance and Temperature Dependence of Photovoltaic Modules in PVsyst. IEEE J. Photovolt. 2015, 5, 152–158. [Google Scholar] [CrossRef]
- Ibnelouad, A.; Kari, A.E.; Ayad, H.; Mjahed, M. Improved cooperative Artificial Neural Network-particle swarm optimization approach for solar photovoltaic systems using maximum power point tracking. Int. Trans. Electr. Energy Syst. 2020, 30, 12439. [Google Scholar] [CrossRef]
- Lo Brano, V.; Ciulla, G.; Di Falco, M. Artificial Neural Networks to Predict the Power Output of a PV Panel. Int. J. Photoenergy 2014, 2014, 193083. [Google Scholar] [CrossRef]
- Saberian, A.; Hizam, H.; Radzi, M.A.M.; Ab Kadir, M.Z.A.; Mirzaei, M. Modelling and Prediction of Photovoltaic Power Output Using Artificial Neural Networks. Int. J. Photoenergy 2014, 2014, 469701. [Google Scholar] [CrossRef] [Green Version]
- Mandal, P.; Senjyu, T.; Funabashi, T. Neural network models to predict short-term electricity prices and loads. In Proceedings of the IEEE International Conference on Industrial Technology, Hong Kong, 14–17 December 2005. [Google Scholar]
- Almonacid, F.; Rus, C.; Pérez-Higueras, P.; Hontoria, L. Calculation of the energy provided by a PV generator. Comparative study: Conventional methods vs. Artificial Neural Networks. Energy 2011, 36, 375–384. [Google Scholar] [CrossRef]
- Karamirad, M.; Omid, M.; Alimardani, R.; Mousazadeh, H.; Heidari, S.N. ANN based simulation and experimental verification of analytical four- and five-parameters models of PV modules. Simul. Model. Pract. Theory 2013, 34, 86–98. [Google Scholar] [CrossRef]
- Yu, T.C.; Chang, H.T. The forecast of the electrical energy generated by photovoltaic systems using neural network method. In Proceedings of the International Conference on Electric Information and Control Engineering, Wuhan, China, 25–27 March 2011. [Google Scholar]
- Cococcioni, M.; D’Andrea, E.; Lazzerini, B. 24-hour-ahead forecasting of energy production in solar PV systems. In Proceedings of the 11th International Conference on Intelligent Systems Design and Applications, Córdoba, Spain, 22–24 November 2011. [Google Scholar]
- Chen, C.; Duan, S.; Cai, T.; Liu, B. Online 24-h solar power forecasting based on weather type classification using Artificial Neural Network. Sol. Energy 2011, 85, 2856–2870. [Google Scholar] [CrossRef]
- Yang, H.T.; Huang, C.M.; Huang, Y.C.; Pai, Y.S. A Weather-Based Hybrid. Method for 1-Day Ahead Hourly Forecasting of PV Power Output. IEEE Trans. Sustain. Energy 2014, 5, 917–926. [Google Scholar] [CrossRef]
- Sharma, A.; Kolhe, M.; Konara, K.M.S.Y.; Ulltveit-Moe, N.; Muddineni, K.; Mudgal, A.; Gardu, S. Performance assessment of institutional photovoltaic based energy system for operating as a micro-grid. Sustain. Energy Technol. Assess. 2020, 37, 100563. [Google Scholar] [CrossRef]
- Korkmaz, D.; Acikgoz, H.; Yildiz, C. A Novel Short-Term Photovoltaic Power Forecasting Approach based on Deep Convolutional Neural Network. Int. J. Green Energy 2021, 1, 525–539. [Google Scholar] [CrossRef]
- López Gómez, J.; Martinez, A.O.; Pastoriza, F.T.; Garrido, L.F.; Alvarez, E.D.; Garcia, Y.A.O. Photovoltaic Power Prediction Using Artificial Neural Networks and Numerical Weather Data. Sustainability 2020, 12, 10295. [Google Scholar] [CrossRef]
- Pang, S.; Zheng, Z.; Luo, F.; Xiao, X.; Xu, L. Hybrid Forecasting Methodology for Wind Power-Photovoltaic-Concentrating Solar Power Generation Clustered Renewable Energy Systems. Sustainability 2021, 13, 6681. [Google Scholar] [CrossRef]
- Kim, S.G.; Jung, J.Y.; Sim, M.K. A Two-Step Approach to Solar Power Generation Prediction Based on Weather Data Using Machine Learning. Sustainability 2019, 11, 1501. [Google Scholar] [CrossRef] [Green Version]
- Vaz, A.G.R.; Elsinga, B.; van Sark, W.G.J.H.M.; Brito, M.C. An Artificial Neural Network to assess the impact of neighbouring photovoltaic systems in power forecasting in Utrecht, the Netherlands. Renew. Energy 2016, 85, 631–641. [Google Scholar] [CrossRef] [Green Version]
- Hu, Y.; Lian, W.; Han, Y.; Dai, S.; Zhu, H. A seasonal model using optimized multi-layer neural networks to forecast power output of PV plants. Energies 2018, 11, 326. [Google Scholar] [CrossRef] [Green Version]
- Lee, D.; Kim, K. Recurrent neural network-based hourly prediction of photovoltaic power output using meteorological information. Energies 2019, 12, 215. [Google Scholar] [CrossRef] [Green Version]
- Capizzi, G.; Napoli, C.; Bonanno, F. Innovative Second-Generation Wavelets Construction With Recurrent Neural Networks for Solar Radiation Forecasting. IEEE Trans. Neural Netw. Learn. Syst. 2012, 23, 1805–1815. [Google Scholar] [CrossRef] [PubMed] [Green Version]
- Bhatia, M.P.S.; Chandra, P. Comparison of sigmoidal FFANN training algorithms for function approximation problems. In Proceedings of the 2nd International Conference on Computing for Sustainable Global Development, New Delhi, India, 11–13 March 2015. [Google Scholar]
- Pan, X.; Lee, B.; Zhang, C. A comparison of neural network backpropagation algorithms for electricity load forecasting. In Proceedings of the IEEE International Workshop on Intelligent Energy Systems, Vienna, Austria, 14 November 2013. [Google Scholar]
- Beale, M.H.; Demuth, H. Neural Network Toolbox™ User’s Guide R2014a; The MathWorks Inc.: Natick, MA, USA, 2014. [Google Scholar]
- Hung, C.; Huang, X.Y.; Lin, H.K.; Hou, Y.H. Integrated Time Series Forecasting approaches using moving average, grey prediction, support vector regression and bagging for NNGC. In Neural Networks (IJCNN). In Proceedings of the 2010 International Joint Conference on Neural Networks, Barcelona, Spain, 18–23 July 2010. [Google Scholar]
- Gentry, T.W.; Wilamowski, B.M.; Weatherford, L.R. A Comparison of Traditional Forecasting Techniques and Neural Networks. Intell. Eng. Syst. Artif. Neural Netw. 1995, 5, 765–770. [Google Scholar]
- Goossens, D.; Lundholm, R.; Goverde, H.; Govaerts, J. Effect of soiling on wind-induced cooling of photovoltaic modules and consequences for electrical performance. Sustain. Energy Technol. Assess. 2019, 34, 116–125. [Google Scholar] [CrossRef]
- Bhatti, A.R.; Salam, Z.; Aziz, M.J.B.A.; Yee, K.P. A critical review of electric vehicle charging using solar photovoltaic. Int. J. Energy Res. 2016, 40, 439–461. [Google Scholar] [CrossRef]
- Herder, D.T. Design and Simulation of Photovoltaic Super System Using Simulink; California Polytechnic State University: San Luis Obispo, CA, USA, 2006. [Google Scholar]
- Siddiqui, M.U.; Airf, A.F.M.; Bilton, A.M.; Dubowsky, S.; Elshafei, M. An improved electric circuit model for photovoltaic modules based on sensitivity analysis. Sol. Energy 2013, 90, 29–42. [Google Scholar] [CrossRef]
- Bellia, H.; Youcef, R.; Fatima, M. A detailed modeling of photovoltaic module using MATLAB. J. Astron. Geophys. 2014, 3, 53–61. [Google Scholar] [CrossRef] [Green Version]
- Mellit, A.; Sağlam, S.; Kalogirou, S.A. Artificial neural network-based model for estimating the produced power of a photovoltaic module. Renew. Energy 2013, 60, 71–78. [Google Scholar] [CrossRef]
- Ishaque, K.; Salam, Z. An improved modeling method to determine the model parameters of photovoltaic (PV) modules using differential evolution (DE). Sol. Energy 2011, 85, 2349–2359. [Google Scholar] [CrossRef]
- Abdulkadir, M.; Samosir, S.A.; Yatim, A.H. Modeling and simulation based approach of photovoltaic system in simulink model. J. Eng. Appl. Sci. 2012, 7, 616–623. [Google Scholar]
- Pandiarajan, N.; Muthu, R. Mathematical Modeling of Photovoltaic Module with Simulink. In Proceedings of the International Conference on Electrical Energy Systems, Chennai, India, 3–5 January 2011. [Google Scholar]
- Ishaque, K.; Salam, Z.; Taheri, H. Simple, fast and accurate two-diode model for photovoltaic modules. Sol. Energy Mater. Sol. Cells 2011, 95, 586–594. [Google Scholar]
- Ishaque, K.; Salam, Z.; Taheri, H. Accurate MATLAB simulink PV system simulator based on a two-diode model. J. Power Electron. 2011, 11, 179–187. [Google Scholar] [CrossRef] [Green Version]
- Salam, Z.; Ishaque, K.; Taheri, H. An improved two-diode photovoltaic (PV) model for PV system. In Proceedings of the International Conference on Power Electronic Drives and Energy Systems for Industrial Growth, New Delhi, India, 20–23 December 2010. [Google Scholar]
- Jakhrani, A.Q.; Samo, S.R.; Kamboh, S.A.; Labadin, J.; Rigit, A.R.H. An Improved Mathematical Model for Computing Power Output of Solar Photovoltaic Modules. Int. J. Photoenergy 2014, 1, 1–9. [Google Scholar] [CrossRef]
- Kumari, J.S.; Babu, C.S. Mathematical Modeling and Simulation of Photovoltaic Cell using Matlab-Simulink Environment. Int. J. Electr. Comput. Eng. 2012, 2, 26–34. [Google Scholar]
- Celikel, R.; Gundogdu, A. System identification-based MPPT algorithm for PV systems under variable atmosphere conditions using current sensorless approach. Int. Trans. Electr. Energy Syst. 2020, 30, 12433. [Google Scholar] [CrossRef]
- Khosravi, A.; Koury, R.N.N.; Machado, L.; Pabon, J.G.G. Prediction of wind speed and wind direction using Artificial Neural Network, support vector regression and adaptive neuro-fuzzy inference system. Sustain. Energy Technol. Assess. 2018, 25, 146–160. [Google Scholar] [CrossRef]
- Bayesian Regularization Backpropagation. MathWorks, Help Center. Available online: http://www.mathworks.com/help/nnet/ref/trainbr.html (accessed on 27 August 2021).
- Dhanuskodi, R.; Kaliappan, R.; Narayanan, A.; Suresh, S. Artificial Neural Networks model for predicting wall temperature of supercritical boilers. Appl. Therm. Eng. 2015, 90, 749–753. [Google Scholar] [CrossRef]
- Tarafdar, A.; Shahi, N.C.; Singh, A.; Sirohi, R. Artificial neural network modeling of water activity: A low energy approach to freeze drying. Food Bioprocess Technol. 2018, 11, 164–171. [Google Scholar] [CrossRef]
- Suryawanshi, B.; Mohanty, B. Application of an Artificial Neural Network model for the supercritical fluid extraction of seed oil from Argemone mexicana (L.) seeds. Ind. Crop. Prod. 2018, 123, 64–74. [Google Scholar] [CrossRef]
- Verma, A.; Singh, T.; Sarkar, K.; Chauhan, N.K. A hybrid FEM–ANN approach for slope instability prediction. J. Inst. Eng. (India) Ser. A 2016, 97, 171–180. [Google Scholar] [CrossRef]
- Mao, M.; Gong, W.; Chang, L. Short-term photovoltaic output forecasting model for economic dispatch of power system incorporating large-scale photovoltaic plant. In Proceedings of the Energy Conversion Congress and Exposition (ECCE), Denver, CO, USA, 15–19 September 2013. [Google Scholar]
- Grimaccia, F.; Mussetta, M.; Zich, R. Neuro-fuzzy predictive model for PV energy production based on weather forecast. in Fuzzy Systems (FUZZ). In Proceedings of the IEEE International Conference on Computer Science and Automation Engineering (CSAE), Barcelona, Spain, 10–12 June 2011. [Google Scholar]
- Chupong, C.; Plangklang, B. Forecasting power output of PV grid connected system in Thailand without using solar radiation measurement. Energy Procedia 2011, 9, 230–237. [Google Scholar] [CrossRef] [Green Version]
Publisher’s Note: MDPI stays neutral with regard to jurisdictional claims in published maps and institutional affiliations. |
© 2021 by the authors. Licensee MDPI, Basel, Switzerland. This article is an open access article distributed under the terms and conditions of the Creative Commons Attribution (CC BY) license (https://creativecommons.org/licenses/by/4.0/).