Poor Ventilation Habits in Nursing Homes Have Favoured a High Number of COVID-19 Infections
Abstract
:1. Introduction
2. Materials and Methods
2.1. Comfort
2.2. Air Quality Factors
- Elderly residents spend practically all of their time in these places (90%) since it is their home.
- The quality of the environment in the residences will be vitiated by a greater number of viruses, due to the fact that their occupants usually suffer from different infections.
- In residences, food and different types of drugs or medicines are maintained on the premises to care for the elderly, and these products need the air quality to be optimal.
- It is essential to use air-conditioning systems in homes to ensure the comfort of the users and to renew the indoor air. In winter, it is necessary to temper the indoor air to prevent cold currents, which can affect the health of the elderly. In summer, the opposite will occur, and air-conditioning systems need to be used to prevent the occurrence of hot flushes or heat in the occupants.
- The use of air-conditioning systems in residences is as important as their cleaning and maintenance: the lubrication of mechanisms, revision, change of filters, etc.
- Cleaning and disinfection of the building need to be carried out daily to maintain the quality of the indoor environment in the residence halls since different groups of people live together in these areas every day. In the residents’ rooms, in the reception areas and in the corridors, it is necessary to carry out a deep cleaning or even disinfection several times a day to improve the safety of the guests and visitors.
2.3. Consequences of Poor Air Quality
- Airways: dryness, itching/heartburn, nasal congestion, sneezing and sore throat;
- Lungs: chest tightness, choking sensation, dry cough and bronchitis;
- Skin: redness, dryness and generalised itching;
- General malaise: headache, weakness, drowsiness/lethargy, difficulty concentrating, irritability, anxiety, nausea and dizziness;
- Diseases: hypersensitivity pneumonitis, humidification fever, asthma, rhinitis and dermatitis;
- Infections: legionellosis, Pontiac fever, tuberculosis, common cold and flu.
2.4. Chemical Pollutants
2.4.1. Nitrogen Oxides (NOx)
2.4.2. Suspended Particles
2.4.3. Formaldehyde
2.4.4. Ozone
2.4.5. Sulphur Dioxide
- PM10 particles:
- Daily value: No. of days in the year when the 50 μg/m3 limit is exceeded. When it is greater than 35 days, the daily limit established by the regulations is exceeded, and if it is greater than 3 days, the WHO recommendation is exceeded.
- Annual average: Average value of PM10 during the year. The limit established by the regulation is 40 μg/m3 per year, while the WHO recommends not to exceed an annual average of 20 μg/m3.
- PM2.5 particles:
- Daily value: Number of days during the year when 25 μg/m3 is exceeded. When it is greater than 3 days, the WHO recommendation is exceeded.
- Annual average: Average value of PM2.5 during the year. The regulations do not allow exceeding 25 μg/m3 per year. WHO recommends not to exceed 10 μg/m3 as an annual average.
- Nitrogen dioxide NO2:
- Annual average: Average value of NO2 during the year. The annual limit value set by the regulations is 40 μg/m3, which is in line with the WHO recommendation.
- Ozone O3:
- Eight-hour value: Number of days over the year when the average value of 120 μg/m3 (legal) or 100 μg/m3 (WHO) ozone is exceeded in 8 h periods (defined as the maximum daily 8 h moving average). The regulations do not allow more than 25 days per year (averaged over three consecutive years), a threshold also adopted in this report for the WHO recommendation (in 2018).
- AOT40 May–July: Sum of the difference between hourly concentrations above 80 μg/m3 and 80 μg/m3 between 8:00 and 20:00, from 1 May to 31 July. The legal target is 18,000 μg/m3 h (the average of over five consecutive years), and the long-term target is 6000 μg/m3 h (in 2019).
- Sulphur dioxide SO2:
- Daily value: Number of days per year when the average daily value of 125 μg/m3 (legal) or 20 μg/m3 (WHO) of SO2 is exceeded. The regulations do not allow more than 3 days per year, a threshold that is also adopted in this report for the WHO recommendation.
3. Results
4. Discussion
5. Conclusions
Author Contributions
Funding
Conflicts of Interest
References
- Klepeis, N.E.; Nelson, W.C.; Ott, W.R.; Robinson, J.P.; Tsang, A.M.; Switzer, P.; Behar, J.V.; Hern, S.C.; Engelmann, W.H. The national human activity pattern survey (NHAPS): A resource for assessing exposure to environmental pollutants. J. Expo. Sci. Environ. Epidemiol. 2001, 11, 231–252. [Google Scholar] [CrossRef] [PubMed] [Green Version]
- Wargocki, P. Ventilation, Indoor Air Quality, Health, and Productivity. In Ergonomic Workplace Design for Health, Wellness, and Productivity; Wargocki, P., Ed.; CRC Press: Boca Raton, FL, USA, 2016; pp. 39–72. [Google Scholar]
- Borsboom, W.; De Gids, W.; Logue, J.; Sherman, M.; Wargocki, P.; Civil Engineering, Technical University of Denmark (Eds.) Technical Note AIVC 68 Residential Ventilation and Health; INIVE: Brussels, Belgium, 2016. [Google Scholar]
- Wargocki, P. The effects of outdoor air supply rate in an office on perceived air quality, sick building syndrome (SBS) symptoms and productivity. Indoor Air 2000, 10, 222–236. [Google Scholar] [CrossRef]
- Nathanson, T. Indoor Air Quality in Office Buildings: A Technical Guide; Health Canadá: Ottawa, ON, Canada, 1993.
- Cao, G.; Awbi, H.; Yao, R.; Fan, Y.; Sirén, K.; Kosonen, R.; Zhang, J. A review of the performance of different ventilation and airflow distribution systems in buildings. Build. Environ. 2014, 73, 171–186. [Google Scholar] [CrossRef]
- Li, Y.; Leung, G.M.; Tang, J.W.; Yang, X.; Chao CY, H.; Lin, J.Z.; Yuen, P.L. Role of ventilation in airborne transmission of infectious agents in the built environment-A multidisciplinary systematic review. Indoor Air 2007, 17, 2–18. [Google Scholar] [CrossRef] [PubMed]
- Daisey, J.M.; Angell, W.J.; Apte, M.G. Indoor air quality, ventilation and health symptoms in schools: An analysis of existing information. Indoor Air 2003, 13, 53–64. [Google Scholar] [CrossRef]
- Wagner, H.U.; Verhoeff, A.P.; Colombi, A.; Flannigan, B.; Gravesen, S.; Moulliseux, A.; Nevelainen, A.; Papadakis, J.; Sebel, K. Biological Particles. In In-Door Environments. Indoor Air Quality and Its Impact on Man; Comisión Europea: Brussels, Belgium, 1993. [Google Scholar]
- Wargocki, P. What Are Indoor Air Quality Priorities for Energy-Efficient Buildings? Indoor and Built Environment; SAGE Publications Ltd.: Thousand Oaks, CA, USA, 2015. [Google Scholar] [CrossRef]
- González-Lezcano, R.A.; Hormigos-Jiménez, S. Energy saving Due to Natural Ventilation in Housing Blocks in Madrid. In IOP Conference Series: Materials Science and Engineering; Institute of Physics Publishing: Bristol, UK, 2016; Volume 138. [Google Scholar] [CrossRef]
- Organización Mundial de la Salud. Air Quality Guidelines for Europe, European Series, no. 23; Publicaciones Regionales de la OMS: Copenhagen, Denmark, 1987. [Google Scholar]
- Yocom, J.E.; McCarthy, S.M. Measuring Indoor Air Quality: A Practical Guide; Wiley: Chichester, UK, 1991. [Google Scholar]
- Spengler, J.D.; Chen, Q. Indoor air quality factors in designing a healthy building. Annu. Rev. Energy Environ. 2000, 25, 567–600. [Google Scholar] [CrossRef] [Green Version]
- Hormigos-Jimenez, S.; Padilla-Marcos, M.A.; Meiss, A.; Gonzalez-Lezcano, R.A.; Feijó-MuÑoz, J. Experimental validation of the age-of-the-air CFD analysis: A case study. Sci. Technol. Built Environ. 2018, 24, 994–1003. [Google Scholar] [CrossRef]
- Turiel, I. Indoor Air Quality and Human Health; Stanford University Press: Palo Alto, CA, USA, 1986. [Google Scholar]
- Berenguer, M.J.; Guardino, X.; Hernández, A.; Martí, M.C.; Nogareda, C.; Solé, M.D. El Síndrome del Edificio Enfermo. Guía Para su Evaluación; Instituto Nacional de Seguridad e Higiene en el Trabajo: Madrid, Spain, 1994.
- Wadden, R.A.; Schelf, P.A. Indoor Air Pollution. Characterization, Prediction and Control; Wiley: New York, NY, USA, 1983. [Google Scholar]
- Dimitroulopoulou, C. Ventilation in European dwellings: A review. Build. Environ. 2012, 47, 109–125. [Google Scholar] [CrossRef]
- Van Buggenhout, S.; Zerihun Desta, T.; Van Brecht, A.; Vranken, E.; Quanten, S.; Van Malcot, W.; Berckmans, D. Data-based mechanistic modelling approach to determine the age of air in a ventilated space. Build. Environ. 2006, 41, 557–567. [Google Scholar] [CrossRef]
- Xu, C.; Luo, X.; Yu, C.; Cao, S.J. The 2019-nCoV Epidemic Control Strategies and Future Challenges of Building Healthy Smart Cities. Indoor and Built Environment; SAGE Publications Ltd.: Thousand Oaks, CA, USA, 2020. [Google Scholar] [CrossRef] [Green Version]
- Código Técnico de la Edificación (CTE). Documento Básico HS3: Calidad del Aire Interior; Ministerio de Fomento del Gobierno de España: Madrid, Spain, 2018.
- Fernández, M. Sistema Integral de Ventilación de Viviendas de Acuerdo con el Código Técnico de la Edificación (HS3). Instalaciones y Técnicas del Confort; Ministerio De Fomento: Madrid, Spain, 2008; pp. 10–21.
- RITE. Reglamento de Instalaciones Térmicas de los Edificios; Ministerio para la Transición Ecológica y el Reto Demográfico: Madrid, Spain, 2020.
- Namiesnik, J.; Gorecki, T.; Krosdon-Zabiegala, B.; Lusiak, J. Indoor air quality pollutants, their sources and concentration levels. Build Environ. 1992, 27, 339–356. [Google Scholar] [CrossRef]
- Knoppel, H.; Wolkoff, P. Chemical, Microbiological, Health and Confort Aspects of Indoor Air Quality-State of the Art in SBS; Kluwert Academic: Dordrecht, The Netherlands, 1992. [Google Scholar]
- Davidson, L.; Olsson, E. Calculation of age and local purging flow rate in rooms. Build. Environ. 1987, 22, 111–127. [Google Scholar] [CrossRef]
- Kwon, K.S.; Lee, I.B.; Han, H.T.; Shin, C.Y.; Hwang, H.S.; Hong, S.W.; Han, C.P. Analysing ventilation efficiency in a test chamber using age-of-air concept and CFD technology. Biosyst. Eng. 2011, 110, 421–433. [Google Scholar] [CrossRef]
- Li, J.; Tartarini, F. Changes in Air Quality during the COVID-19 Lockdown in Singapore and Associations with Human Mobility Trends. Aerosol Air Qual. Res. 2020, 20, 1748–1758. [Google Scholar] [CrossRef]
- Liu, M.; Tilton, J.N. Spatial distributions of mean age and higher moments in steady continuous flows. AIChE J. 2010, 56, 2561–2572. [Google Scholar] [CrossRef]
- CCAyES. Centro de Coordinación de Alertas y Emergencias Sanitarias del Ministerio de Sanidad. 2020. Available online: https://www.mscbs.gob.es/profesionales/saludPublica/ccayes/home.htm (accessed on 6 March 2021).
- Abellán García, A.; Aceituno Nieto, P.; Ramiro Fariñas, D. Estadísticas Sobre Residencias: Distribución de Centros y Plazas Residenciales por Provincia. Datos de Abril de 2019. Available online: http://envejecimiento.csic.es/documentos/documentos/enred-estadisticasresidencias2019.pdf (accessed on 22 October 2021).
- INE 2020. Instituto Nacional de Estadística. Available online: https://www.ine.es/covid/covid_inicio.htm (accessed on 6 March 2021).
- Rasmussen, M.; Foldbjerg, P.; Christoffersen, J.; Daniell, J.; Bang, U.; Galiatto, N.; Bjerre, K. Healthy Homes Barometer 2017-Buildings and Their Impact on the Health of Europeans; Rasmussen, M.K., Ed.; VELUX Group: Hørsholm, Denmark, 2017. [Google Scholar]
- Sanglier, G.; Robas, M.; Jiménez, P.A. Gamma Radiation in Aid of the Population in Covid-19 Type Pandemics. Contemporary Eng. Sci. 2020, 13, 113–129. [Google Scholar] [CrossRef]
- Wargocki, P. The Effects of Ventilation in Homes on Health. Int. J. Vent. 2013, 12, 101–118. [Google Scholar] [CrossRef]
- Kim, S.; Kim, J.A.; Kim, H.J.; Do Kim, S. Determination of formaldehyde and TVOC emission factor from wood-based composites by small chamber method. Polym. Test. 2006, 25, 605–614. [Google Scholar] [CrossRef]
- Guo, H. Source apportionment of volatile organic compounds in Hong Kong homes. Build. Environ. 2011, 46, 2280–2286. [Google Scholar] [CrossRef]
- World Health Organization. Guidelines for Indoor Air Quality: Selected Pollutants; WHO Regional Office for Europe: Bonn, Germany, 2010. [Google Scholar]
- Prevención de la Exposición a Formaldehído; Nota Técnica de Prevención; Instituto Nacional de Seguridad e Higiene en el Trabajo (INSHT): Madrid, Spain, 2010; Volume 830.
- Stymne, H.; Axel Boman, C.; Kronvall, J. Measuring ventilation rates in the Swedish housing stock. Build. Environ. 1994, 29, 373–379. [Google Scholar] [CrossRef]
- Kostiainen, R. Volatile organic compounds in the indoor air of normal and sick houses. Atmos. Environ. 1995, 29, 693–702. [Google Scholar] [CrossRef]
- Tham, K.W. Indoor air quality and its effects on humans—A review of challenges and developments in the last 30 years. Energy Build. 2016, 130, 637–650. [Google Scholar] [CrossRef]
- European Collaborative Action. Indoor Air Quality and its Impact on Man. Report No.11: Guidelines for Ventilation Requirements in Buildings; Office fot Publications of EU: Luxembourg, 1992. [Google Scholar]
- UNE EN ISO 7730:2006. Determinación analítica e interpretación del bienestar térmico mediante el cálculo de los índices PMV y PPD y los criterios de bienestar térmico local; ISO: Geneva, Switzerland, 2006. [Google Scholar]
- AEMet. Agencia Estatal de Meteorología. 2020. Available online: http://www.aemet.es/es/portada (accessed on 12 February 2021).
- Health Canadá. 2005. Available online: https://www.canada.ca/en/health-canada/services/health-care-system/reports-publications/canada-health-act-annual-reports/annual-report-2004-2005.html (accessed on 6 January 2021).
- Directiva 2008/50/CE Del Parlamento Europeo y del Consejo. 2008. Relativa a la calidad del aire ambiente y a una atmósfera más limpia en Europa. Available online: https://www.boe.es/doue/2008/152/L00001-00044.pdf (accessed on 14 March 2021).
- Real Decreto 102/2011 (2011). Relativo a la mejora de la calidad del aire. Available online: https://www.boe.es/buscar/act.php?id=BOE-A-2011-1645 (accessed on 10 December 2020).
- Organización Mundial de la Salud (OMS) y Organización Meteorológica Mundial. Atlas de la Salud y del Clima; World Health Organization: Geneva, Switzerland, 2012. [Google Scholar]
- Ceballos, M.A.; Segura, P.; Gutiérrez, E.; Gracia, J.C.; Ramos, P.; Reaño, M.; García, B. La Calidad del Aire en el Estado Español Durante 2018; Ecologistas en Acción: Madrid, Spain, 2018. [Google Scholar]
- Hormigos-Jimenez, S.; Padilla-Marcos, M.Á.; Meiss, A.; Gonzalez-Lezcano, R.A.; Feijó-Muñoz, J. Computational fluid dynamics evaluation of the furniture arrangement for ventilation efficiency. Build. Serv. Eng. Res. Technol. 2018, 39, 557–571. [Google Scholar] [CrossRef]
- Saéz, E. Análisis de la Calidad del Aire en Función de la Tipología de Ventilación. Aplicación al Frototipo E3. Edificación Eco-Eficiente de la UPM; Universidad Politécnica de Valencia: Valencia, Spain, 2017. [Google Scholar]
- Guardino, X. Calidad del Aire Interior; Instituto Nacional de Seguridad e Higiene en el Trabajo (INSHT): Madrid, Spain, 2012; Chapter 44; p. 36. [Google Scholar]
- Sanglier, G.; Robas, M.; Jiménez, P.A. Application of Forecasting to a Mathematical Models for adjusting the Determination of the Number of People Infected by Covid-19 in the Comunity of Madrid (Spain). Contemp. Eng. Sci. 2020, 13, 89–101. [Google Scholar] [CrossRef]
- Fernández-García, J.; Dosil Díaz, O.; Taboada Hidalgo, J.; Fernández, J.; Sánchez-Santos, L. Influencia del clima en el infarto de miocardio en Galicia. Med. Clín. 2014, 145, 97–101. [Google Scholar] [CrossRef]
- Monsalve, F. Influencia del Tiempo y de la Contaminación Atmosférica Sbre Enfermedades de los Sistemas Circulatorio y Respiratorio en Castilla-La Mancha; University of La Rioja: La Rioja, Spain, 2011. [Google Scholar]
- Organización Mundial de la Salud (OMS/WHO). Guías de Calidad del Aire de la OMS Relativas al Material Particulado, el Ozono, el Dióxido de Nitrógeno y el Dióxido de Azufre; World Health Organization: Geneva, Switzerland, 2005. [Google Scholar]
- Querol, X.; Viana, M.; Moreno, T.; Alastuy, A. Bases Científicos-Técnicas Para un Plan Nacional de Mejora de la Calidad del Aire; Spanish National Research Council: Madrid, Spain, 2012.
- Sanglier, G.; González, R.A.; Cesteros, S.; López, E.J. Validation of the Mathematical Model Applied to Four Autonomous Communities in Spain to Determine the Number of People Infected by Covid-19. Mod. Appl. Sci. 2020, 14. [Google Scholar] [CrossRef]
- Villalba, D.; Fajardo, E.; Romero, H. Relación entre el material particulado PM10 y variables meteorológicas en la ciudad de Bucaramanga–Colombia: Una aplicación del análisis de datos longitudinal. In Proceedings of the XXVIII Simposio Internacional de Estadística, Bucaramanga, Colombia, 23–27 July 2018. [Google Scholar]
- Harapan Harapan Itoh, N.; Yufita, A.; Winardi, W.; Te, H.; Megawati, D.; Hayati, Z.; Wagner, A.L.; Mudatsir, M. Coronavirus disease 2019 (COVID-19): A literature review. J. Infect. Public Health 2020, 13, 667–673. [Google Scholar] [CrossRef]
- Law, R.C.K.; Lai, J.H.K.; Edwards, J.D.; Hou, H. COVID-19: Research directions for non-clinical aerosol-generating facilities in the built environmental. Buildings 2021, 11, 282. [Google Scholar] [CrossRef]
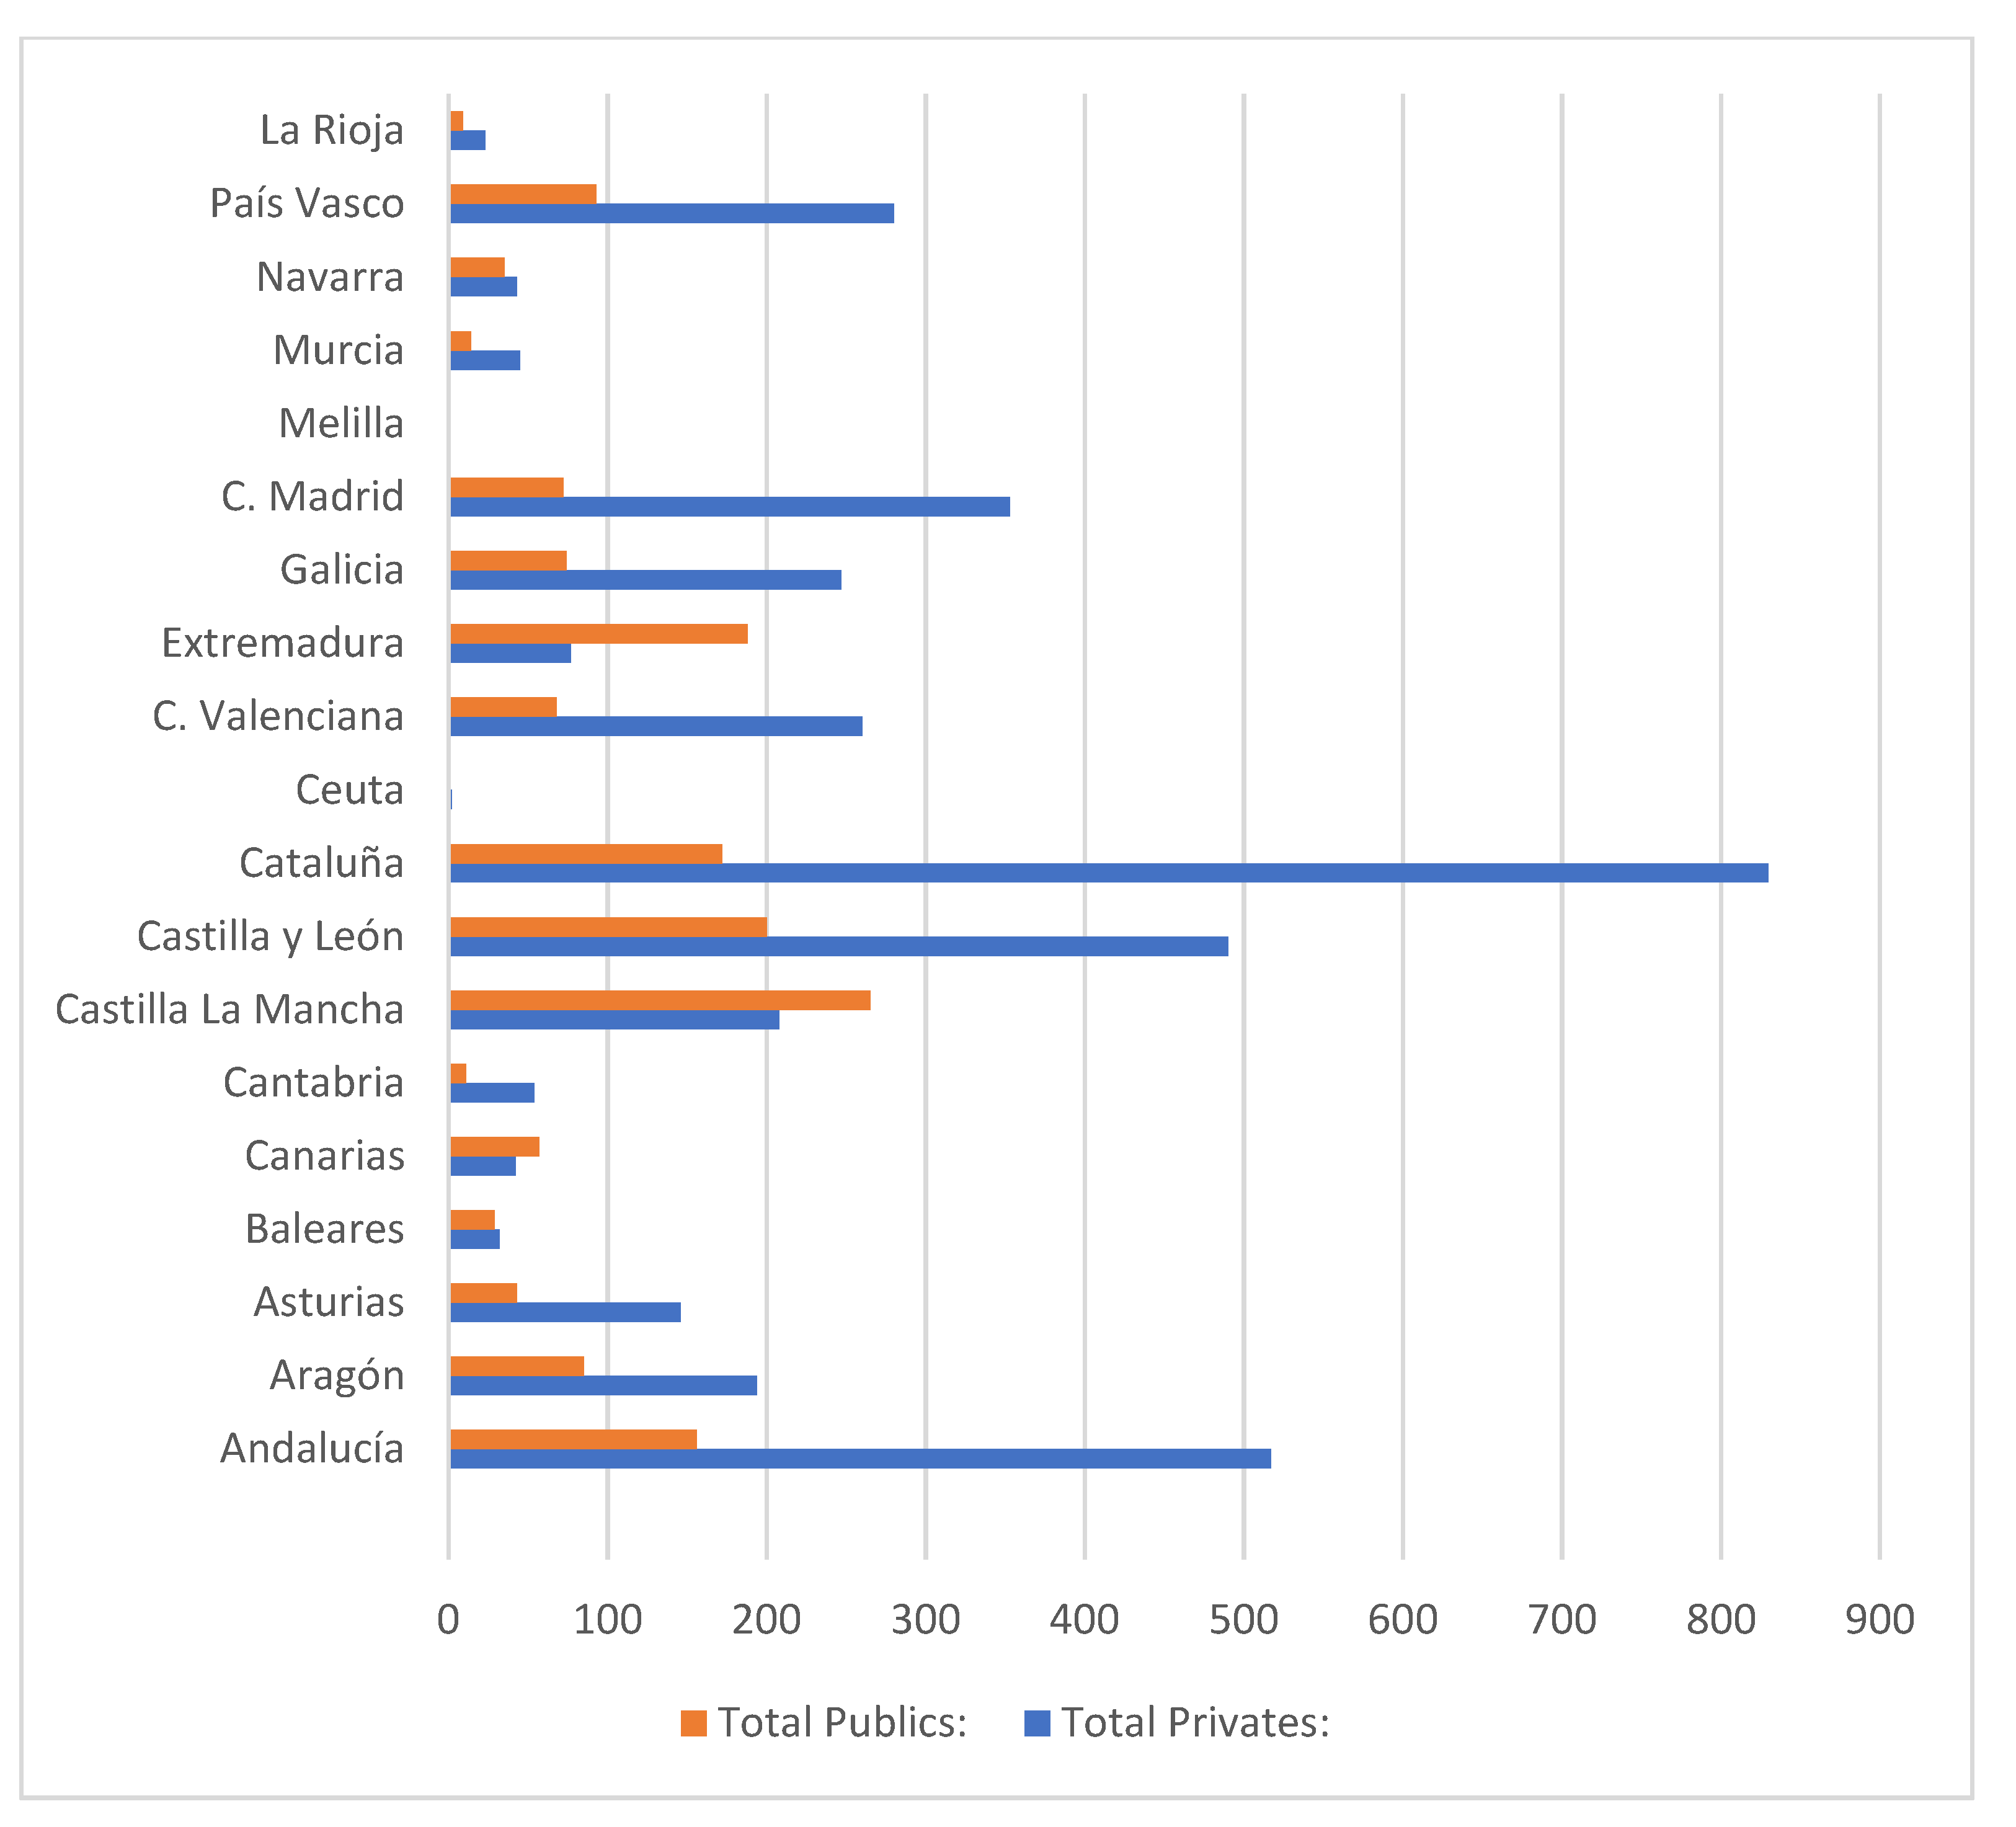
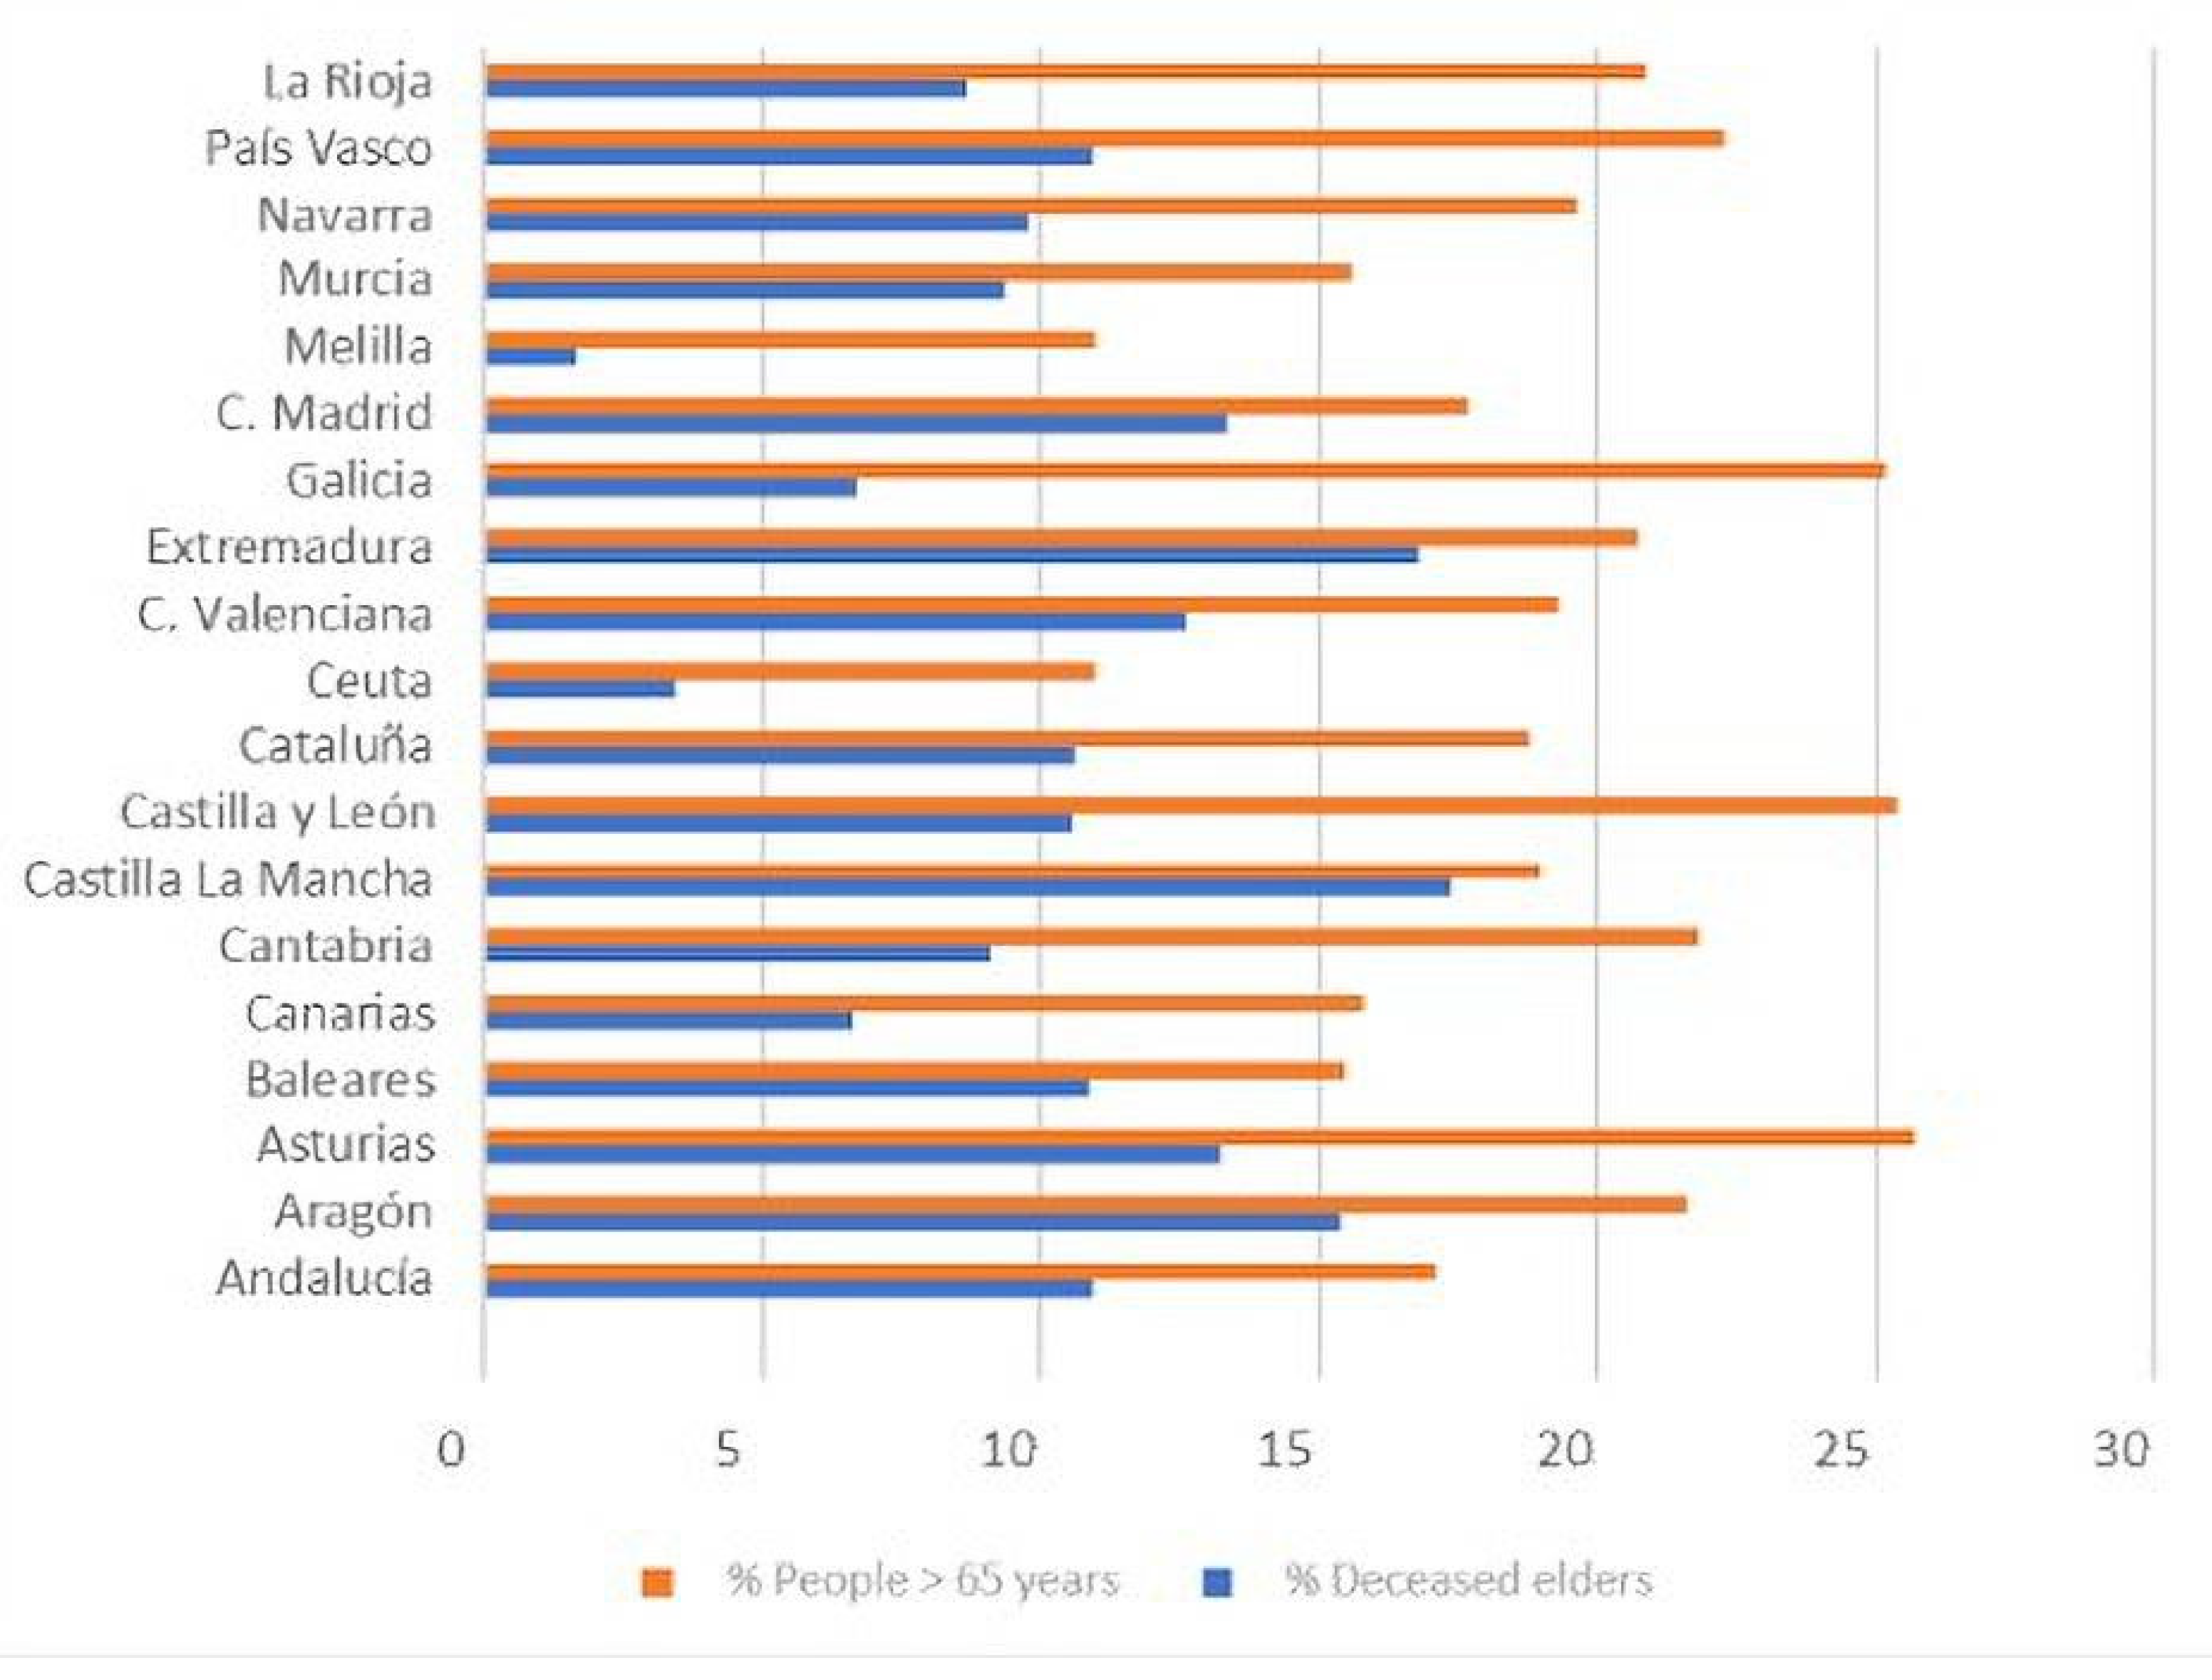
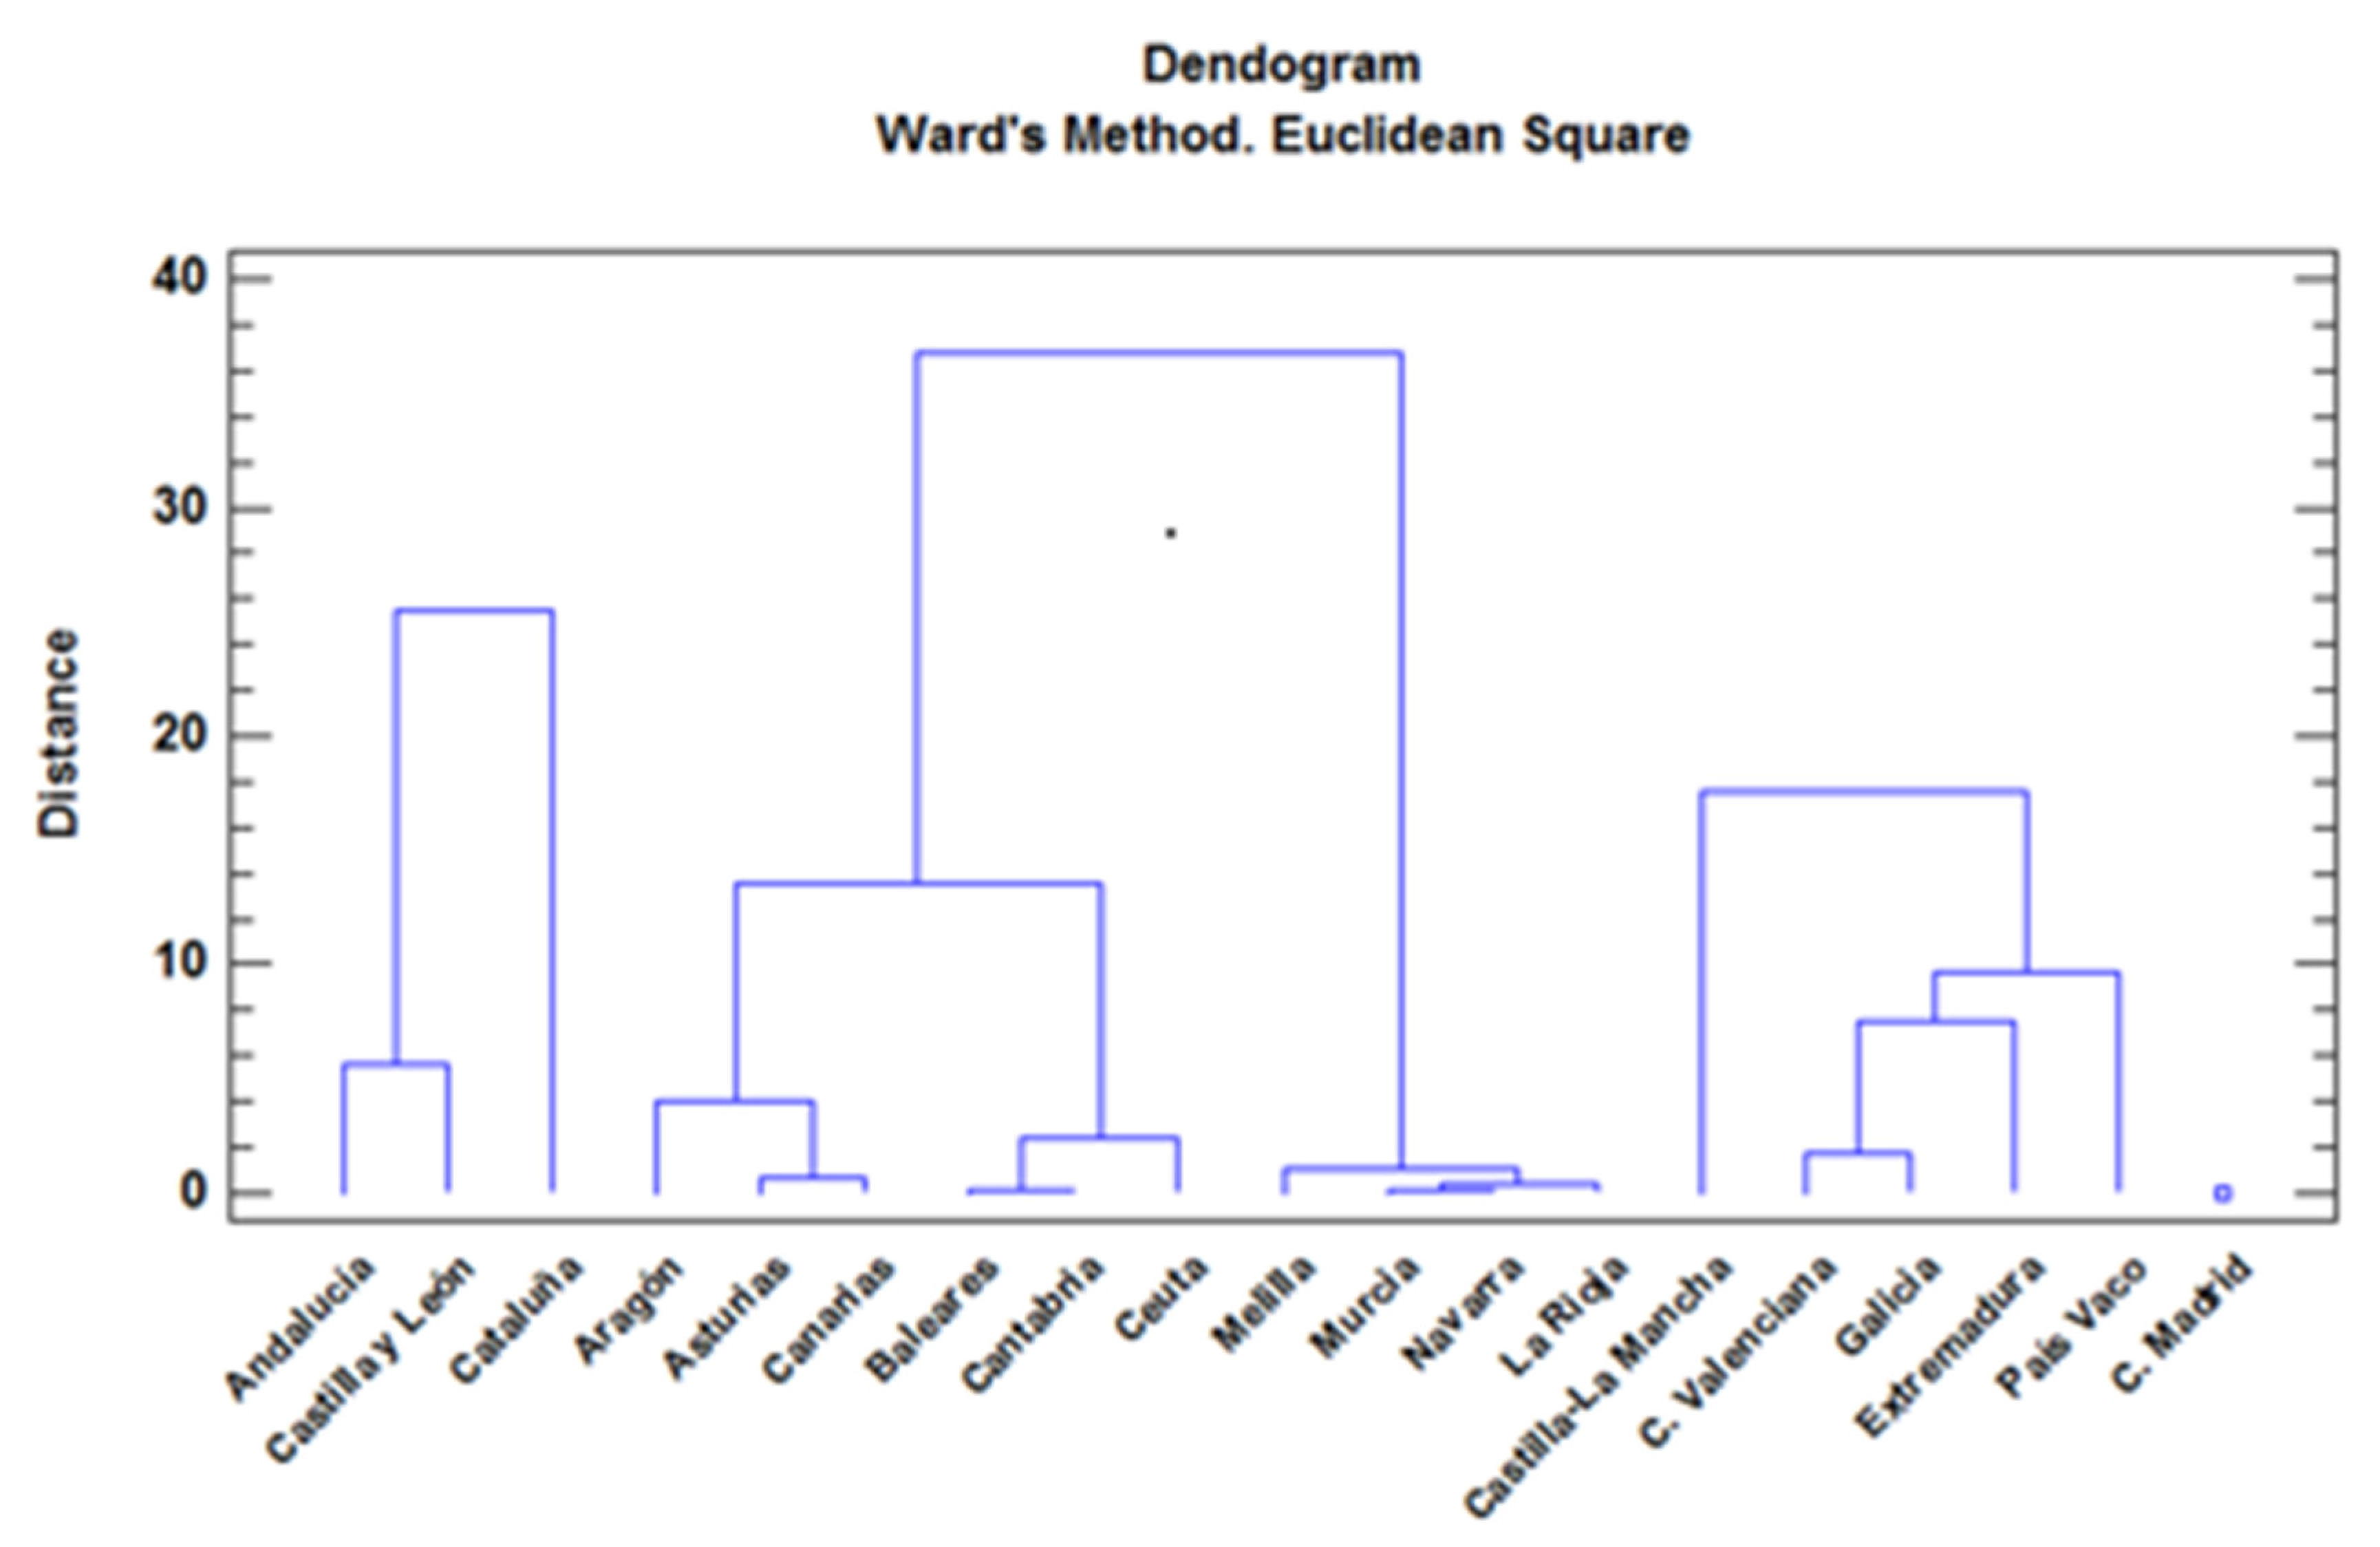
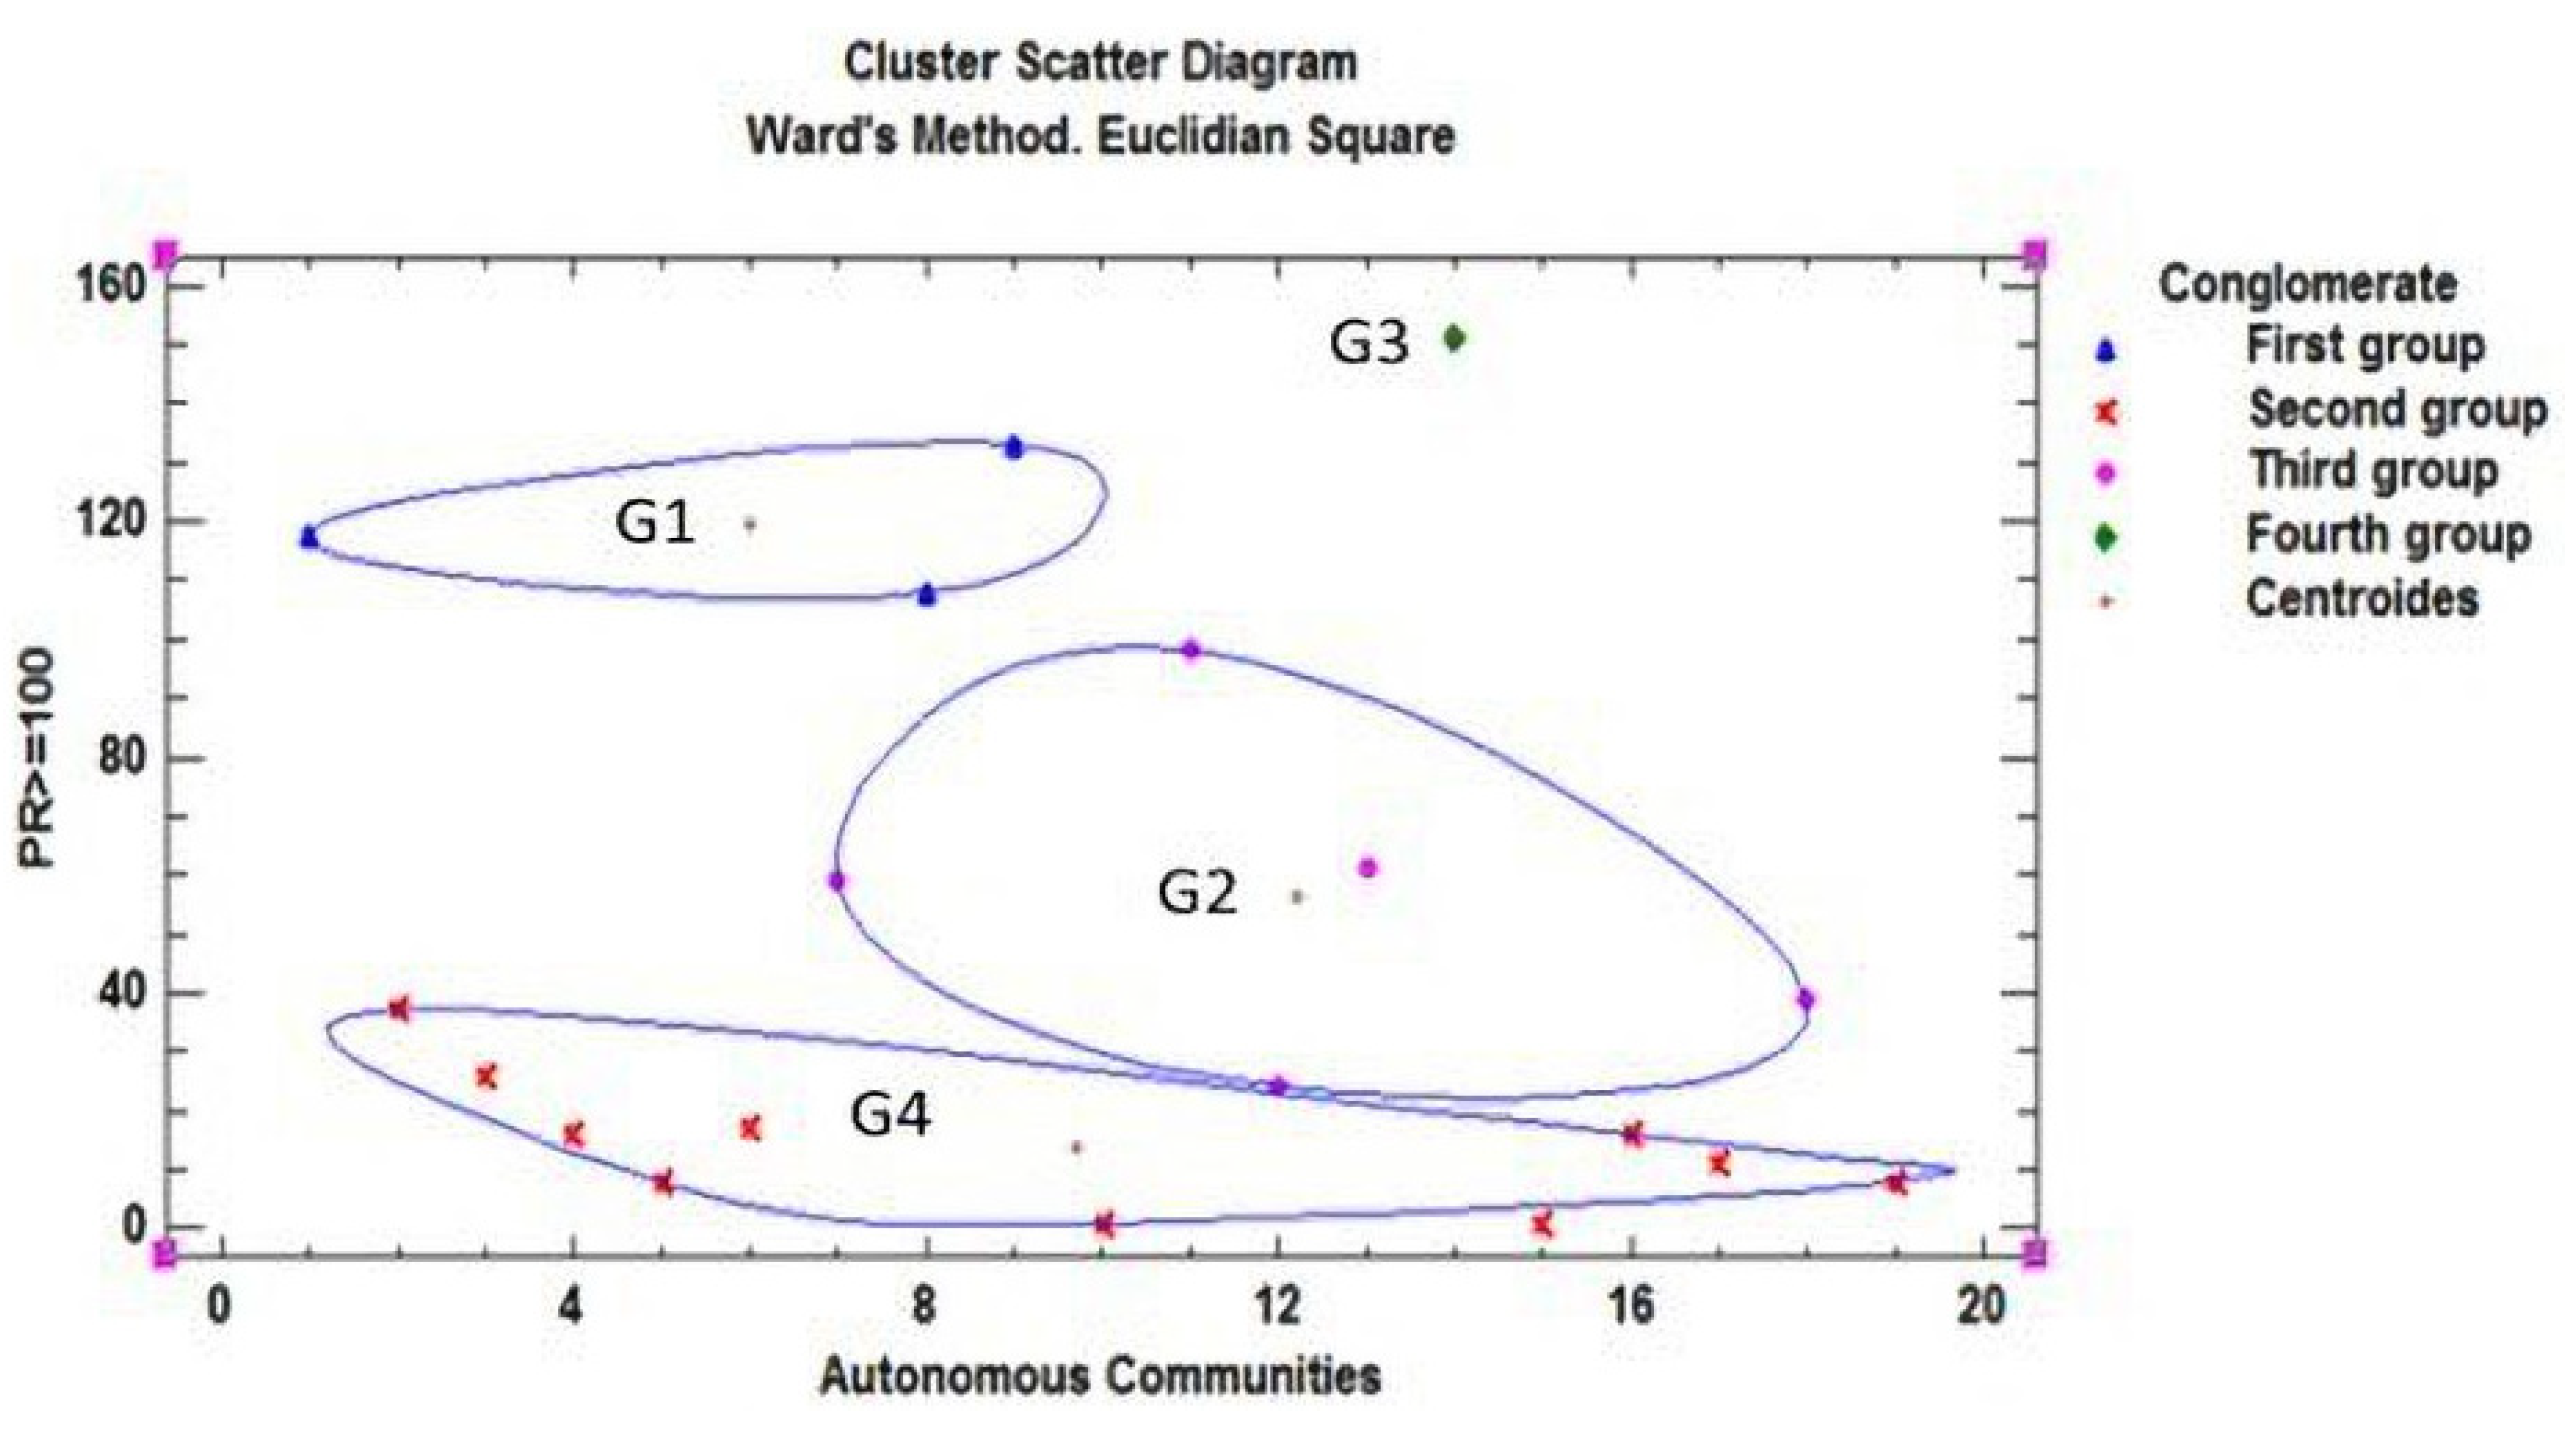
| CC.AA. | (RD) Residential Deaths | (CD) Community Deaths | Average Temperature (C) | Average Humidity (%) | Precipitation (mm) | Sum Hours (h) |
|---|---|---|---|---|---|---|
| Andalucía | 527 | 1355 | 19.4 | 53.6 | 344.5 | 3342 |
| Aragón | 704 | 838 | 14.6 | 61 | 272.7 | 3112 |
| Asturias | 192 | 313 | 13.8 | 80 | 908.2 | 1962 |
| Baleares | 84 | 216 | 19.3 | 73.5 | 466.5 | 3034 |
| Canarias | 18 | 151 | 22 | 61 | 78.5 | 3165 |
| Cantabria | 135 | 206 | 13.8 | 74 | 1157.6 | 1826 |
| Castilla–La Mancha | 2395 | 2883 | 16.4 | 49 | 221.8 | 2779 |
| Castilla y León | 2519 | 1940 | 12.1 | 65 | 384.3 | 2894 |
| Cataluña | 3394 | 5915 | 16.9 | 63.3 | 329.3 | 2731 |
| Ceuta | 0 | 4 | 19.1 | 74 | 650.2 | 2640 |
| C. Valenciana | 518 | 1365 | 19.1 | 62 | 335.6 | 2808 |
| Extremadura | 418 | 497 | 17.4 | 53 | 271.8 | 3326 |
| Galicia | 269 | 604 | 14.5 | 74 | 798.5 | 2342 |
| C. Madrid | 5909 | 8826 | 16 | 53 | 256.1 | 2970 |
| Melilla | 0 | 2 | 19.6 | 70 | 239.7 | 2778 |
| Murcia | 67 | 144 | 20 | 55 | 177.9 | 3348 |
| Navarra | 422 | 501 | 13.2 | 67 | 696.9 | 2512 |
| País Vasco | 584 | 1455 | 14.4 | 75.5 | 1456.7 | 1780 |
| La Rioja | 199 | 348 | 144 | 61 | 3907 | 2708 |
| PM10 (Particles < 10 Micras) | PM2,5 (Particles < 2.5 Micras) | NO2 | O3 (Tropospheric Ozone) | SO2 | Formal-dehyde | |||||
|---|---|---|---|---|---|---|---|---|---|---|
| Daily Value | Annual Average | Daily Value (OMS) | Annual Average | Annual Average | Eighth Hour (Normative) | Eighth Hour (OMS) | AOT40 (Normative) | Daily Value (OMS) | Annual Average | |
| No Days > 50 µg/m3 Normative: Máx = 35 OMS: Máx:3 | µg/m3 Normative: Máx = 40 OMS: Máx:20 | No Days > 50 µg/m3 OMS: Máx:3 | µg/m3 Normative: Máx = 25 OMS: Máx:10 | µg/m3 Normative: Máx = 40 OMS: Máx:40 | No Days > 120 µg/m3 Normative: Máx = 25 | No Days > 100 µg/m3 OMS: Máx = 3 | Normative: Máx: 18,000 | No Days > 20 µg/m3 OMS: Máx = 3 | µg*m2 | |
| Andalucía | 5.36 | 23.27 | 12.36 | 13.27 | 15,9 | 18.36 | 94.18 | 18,767.54 | 0.36 | 59.2 |
| Aragón | 1 | 14.25 | 2.75 | 8.75 | 8 | 12.75 | 69.5 | 13,766.5 | 0 | 60.4 |
| Asturias | 7.75 | 22 | 6.25 | 11.75 | 13.5 | 1.75 | 18.75 | 3223.25 | 8.25 | 54.6 |
| Baleares | 1 | 13.75 | 1.33 | 7.33 | 11.75 | 8.75 | 77 | 14,018.5 | 0.75 | 76.1 |
| Canarias | 17 | 22.83 | 7.5 | 8.16 | 11.83 | 0.83 | 16.16 | 2274.66 | 2.66 | 57.4 |
| Cantabria | 4.33 | 19 | 1.66 | 9.3 | 18 | 1 | 35.33 | 4180.66 | 1.33 | 68 |
| Castilla La Mancha | 15.33 | 21.66 | 13.66 | 10.66 | 11.66 | 23.66 | 88 | 18,153.66 | 2.33 | 59.3 |
| Castilla y León | 3.1 | 15.2 | 1.8 | 6.4 | 10.1 | 9.6 | 66.1 | 10,345.5 | 2 | 57 |
| Cataluña | 2.2 | 19.6 | 5.64 | 10.5 | 15.92 | 14.66 | 77 | 19,245.78 | 1.76 | 58.2 |
| Ceuta | N/A | N/A | N/A | N/A | N/A | N/A | N/A | N/A | N/A | 61.3 |
| C.Valenciana | 1.21 | 14.78 | 4.28 | 9 | 11.71 | 16.64 | 90.28 | 19,060.35 | 0.64 | 61 |
| Extremadura | 5.5 | 15 | 4.5 | 9 | 11.71 | 16.64 | 90.28 | 19,060.35 | 0.64 | 61 |
| Galicia | 5 | 22 | 10.66 | 12.33 | 20.83 | 6.5 | 33.5 | 4911.16 | 2.66 | 65 |
| C.Madrid | 4.71 | 16.28 | 4 | 10 | 20.42 | 36.14 | 110.71 | 22,506.42 | 0.42 | 57.1 |
| Melilla | N/A | N/A | N/A | N/A | N/A | N/A | N/A | N/A | N/A | 60.6 |
| Murcia | 26.5 | 27 | N/A | N/A | 27 | 28.5 | 76.5 | 22,224.5 | 20.5 | 57.8 |
| Navarra | 0.5 | 13.5 | 5 | 12 | 11.25 | 5 | 29.75 | 8902 | 1.5 | 59.8 |
| País Vasco | 0.87 | 15 | 1.62 | 8.25 | 15.25 | 5 | 36 | 7419.25 | 0.28 | 58.6 |
| La Rioja | 2 | 17 | 1 | 9 | 7 | 7 | 59 | 10,237 | 0 | 60.1 |
| CC.AA. | (RD) Residential Deads | (RD) Community Deads | (TD) Total Deads | PR<25 Private Residences (<25) | PR25_49 (25–49) | PR50_93 (50–93) | PR ≥ 100 (≥100) | PR_NI No inf. | PR Total Privates: | PU < 25 Public Residences (<25) | PU25_49 (25–49) | PU50_93 (50–93) | PU ≥ 100 (≥100) | PU_NI No inf. | PU Total Publics: | |
|---|---|---|---|---|---|---|---|---|---|---|---|---|---|---|---|---|
| CC.AA | 0.0458 | 0.0706 | 0.0819 | –0.0371 | –0.2717 | –0.2076 | –0.1577 | –0.4264 | –0.2107 | –0.1546 | –0.3066 | –0.278 | –0.1034 | –0.2121 | –0.273 | |
| (RD) | 0.0458 | 0.9699 | 0.9737 | 0.8801 | 0.5474 | 0.6624 | 0.7889 | –0.0744 | 0.6228 | 0.2255 | 0.2891 | 0.4689 | 0.8157 | –0.0005 | 0.4605 | |
| (CD) | 0.0706 | 0.9699 | 0.9862 | 0.4415 | 0.5704 | 0.6802 | 0.8094 | –0.0124 | 0.6595 | 0.1169 | 0.1946 | 0.5065 | 0.8079 | 0.0174 | 0.3872 | |
| (TD) | 0.0819 | 0.9437 | 0.9862 | 0.545 | 0.6585 | 0.749 | 0.8319 | –0.0041 | 0.7366 | 0.0492 | 0.2005 | 0.5835 | 0.7946 | –0.042 | 0.3741 | |
| PR < 25 | –0.0371 | 0.3659 | 0.4415 | 0.545 | 0.8066 | 0.7652 | 0.5907 | 0.1824 | 0.8462 | 0.02 | 0.3536 | 0.7683 | 0.6352 | –0.0992 | 0.4313 | |
| PR25_49 | –0.2719 | 0.5474 | 0.57 | 0.65 | 0.8 | 0.96 | 0.79 | 0.33 | 0.97 | 0.12 | 0.58 | 0.92 | 0.69 | 0.11 | 0.6 | |
| PR50_93 | –0.2 | 0.66 | 0.68 | 0.74 | 0.76 | 0.96 | 0.87 | 0.23 | 0.97 | 0.22 | 0.57 | 0.92 | 0.69 | 0.11 | 0.6 | |
| PR ≥ 100 | –0.15 | 0.78 | 0.8 | 0.83 | 0.59 | 0.79 | 0.82 | 0.35 | 0.87 | 0.14 | 0.48 | 0.71 | 0.86 | 0.28 | 0.55 | |
| PR_NI | –0.42 | –0.074 | –0.012 | –0.004 | 0.18 | 0.33 | 0.23 | 0.35 | 0.34 | –0.02 | 0.37 | 0.24 | 0.23 | 0.47 | 0.21 | |
| PR | –0.21 | 0.62 | 0.65 | 0.73 | 0.84 | 0.97 | 0.97 | 0.87 | 0.34 | 0.14 | 0.56 | 0.9 | 0.79 | 0.15 | 0.61 | |
| PU < 25 | –0.15 | 0.22 | 0.11 | 0.04 | 0.02 | 0.12 | 0.22 | 0.14 | –0.02 | 0.14 | 0.71 | 0.2 | 0.39 | 0.6 | 0.83 | |
| PU25_49 | –0.3 | 0.28 | 0.19 | 0.2 | 0.35 | 0.58 | 0.57 | 0.48 | 0.37 | 0.56 | 0.71 | 0.62 | 0.55 | 0.58 | 0.92 | |
| PU50_93 | –0.27 | 0.46 | 0.5 | 0.58 | 0.76 | 0.92 | 0.9 | 0.71 | 0.24 | 0.9 | 0.2 | 0.62 | 0.63 | 0.23 | 0.66 | |
| PU ≥ 100 | –0.1 | 0.81 | 0.8 | 0.79 | 0.63 | 0.69 | 0.77 | 0.86 | 0.23 | 0.79 | 0.39 | 0.55 | 0.63 | 0.24 | 0.69 | |
| PU_NI | –0.21 | –0.0005 | 0.0174 | –0.0042 | –0.00992 | 0.11 | 0.18 | 0.28 | 0.47 | 0.15 | 0.6 | 0.58 | 0.23 | 0.24 | 0.59 | |
| PU | –0.27 | 0.46 | 0.38 | 0.37 | 0.43 | 0.6 | 0.66 | 0.55 | 0.21 | 0.61 | 0.83 | 0.92 | 0.66 | 0.69 | 0.59 |
| Factor | Variance | Cumulative | |
|---|---|---|---|
| Number | Eigenvalor | Porcentage | Porcentage |
| 1 | 4.09141 | 31.472 | 31.472 |
| 2 | 2.43407 | 18.724 | 50.196 |
| 3 | 2.28212 | 17.555 | 67.751 |
| 4 | 1.50677 | 11.591 | −79.341 |
| 5 | 0.9121 | 7.016 | 86.358 |
| 6 | 0.67221 | 5.171 | 91.528 |
| 7 | 0.347443 | 2.673 | 94..201 |
| 8 | 0.315038 | 2.423 | 96.624 |
| 9 | 0..22916 | 1.763 | 98.387 |
| 10 | 0.099754 | 0.767 | 99.l54 |
| 11 | 0.0636375 | 0.490 | 99.644 |
| 12 | 0.029118 | 0.224 | 99.868 |
| 13 | 0.0171641 | 0.132 | 100.000 |
| Factor | Factor | Factor | Factor | |
|---|---|---|---|---|
| 1 | 2 | 3 | 4 | |
| Autonomous Communities | 0.251871 | −0.471631 | 0.262884 | −0.52807 |
| RD | −0.347442 | −0.0841992 | 0.744084 | −0.367933 |
| AT | −0.555084 | 0.1I2131 | 0.0783305 | 0.662564 |
| AH | 0.912213 | 0.0516618 | −0.145363 | 0.185372 |
| PREC | 0.927481 | −0.00501128 | 0.0524455 | −0.0907723 |
| SH | −0.920873 | −0.145316 | −0.0741857 | 0.215049 |
| DP | −0.0857457 | −0.09622712 | 0.886502 | 0.076693 |
| PM10 AA | −0.070322 | 0.904561 | 0.0244 | 0.1497t4 |
| PM 2.5 AA | 0.0782149 | 0.714746 | 0.174668 | 0.128887 |
| NO2 | 0.383983 | 0.424818 | 0.760336 | 0.172825 |
| O3OCTNOR | −0.704236 | −0.157771 | 0.455243 | −0.23757 |
| SO2 | 0.326536 | 0.72773 | −0.200042 | −0.13505 |
| FOR | 0.324599 | −0.325889 | 0.0236463 | 0.75947 |
| Combination of Factors | Bubble Diagram |
|---|---|
| RD + DP | 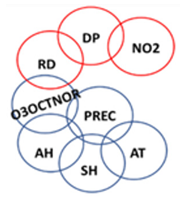 |
| RD + O3OCTNOR | |
| AH + PREC | |
| AH + SH | |
| AH + O3OCTNOR | |
| AT + PREC | |
| AT + SH | |
| PREC + SH | |
| PREC + O3OCTNOR | |
| PREC + NO2 | |
| PM10AA + PM2.5AA |  |
| PM10AA + SO2 |
Publisher’s Note: MDPI stays neutral with regard to jurisdictional claims in published maps and institutional affiliations. |
© 2021 by the authors. Licensee MDPI, Basel, Switzerland. This article is an open access article distributed under the terms and conditions of the Creative Commons Attribution (CC BY) license (https://creativecommons.org/licenses/by/4.0/).
Share and Cite
Sanglier-Contreras, G.; López-Fernández, E.J.; González-Lezcano, R.A. Poor Ventilation Habits in Nursing Homes Have Favoured a High Number of COVID-19 Infections. Sustainability 2021, 13, 11898. https://doi.org/10.3390/su132111898
Sanglier-Contreras G, López-Fernández EJ, González-Lezcano RA. Poor Ventilation Habits in Nursing Homes Have Favoured a High Number of COVID-19 Infections. Sustainability. 2021; 13(21):11898. https://doi.org/10.3390/su132111898
Chicago/Turabian StyleSanglier-Contreras, Gastón, Eduardo J. López-Fernández, and Roberto Alonso González-Lezcano. 2021. "Poor Ventilation Habits in Nursing Homes Have Favoured a High Number of COVID-19 Infections" Sustainability 13, no. 21: 11898. https://doi.org/10.3390/su132111898
APA StyleSanglier-Contreras, G., López-Fernández, E. J., & González-Lezcano, R. A. (2021). Poor Ventilation Habits in Nursing Homes Have Favoured a High Number of COVID-19 Infections. Sustainability, 13(21), 11898. https://doi.org/10.3390/su132111898


