1. Introduction
Sustainability in healthcare is a new trend all across the globe. The term sustainability has many meanings in different contexts. Shediac-Rizkallah and Bone [
1] considered it as maintaining the health benefits of the service over a long period and continuing the service within an organizational structure. In its simplest form, sustainability can be seen as “holding the gains” and “evolving as required” [
2]. An example of doctors in primary and secondary care working together to develop new forms is a practical sustainability project.
The current medical and scientific knowledge could keep the majority of people healthy, preventing most heart diseases, diabetes, cancers, asthma, and other serious diseases. However, the mortality rate is still very high for patients with multiple comorbidities or elderly patients. In addition, for many years, there has been a visible increase in the death rate caused by cancer diseases as well. Therefore, medical institutes provide comprehensive healthcare services to improve sustainability, patient satisfaction, and work efficiency.
Comprehensive healthcare [
3,
4], aka total healthcare or holistic care, is considered as patient-centered care to achieve total patient care from different aspects, including physical, emotional, social, economic, and spiritual needs. Personalized care is the process of taking into account a patient’s unique characteristics such as clinical history and risk factors to provide personalized care and treatments [
5]. Both are important for treating elderly patients or patients with comorbidities or cancers, as they demand medical resources and require treatments across multidisciplinary medical professionals. Such high-quality care requires integrated healthcare resources but could improve patients living quality and health conditions.
Multiple factors play an integral part in considering whether patients need comprehensive care or not. To facilitate sustainable healthcare, medical institutes rely on an efficient comprehensive care system that keeps track of all the relevant patient records for monitoring disease progression, improving patient satisfaction, and reducing health care costs. With limited resources, an efficient method of forecasting patients’ needs is critical for sustainability and service improvement.
The field of recurrent neural networks (RNNs) has evolved considerably in the last decades, and many RNN applications have been deployed in various contexts. However, it remained challenging to apply RNN technology to obtain an efficient prediction model. On the other hand, the available datasets collected from real environments contain mostly negatives and a small portion of positives, where such imbalanced data would affect the effectiveness of model training. The past studies rarely discussed the implication of imbalanced data as well as model training. Therefore, this study aimed to evaluate multiple contemporary deep learning models and the impact of imbalanced data on model training and to propose an efficient RNN-assisted prediction system that forecasts patients in need of comprehensive care.
Machine-learning-based clinical decision support systems (CDSS) play an important role in enhancing the quality of healthcare provided to patients. Neural networks (NNs) are becoming increasingly popular for a wide range of health care tasks, and among the different NN models, RNNs have been applied for prediction-related tasks by applying historical time-series data and learning the patterns from the past. Based on the literature review [
6], few past studies have addressed personalized care needs or have implemented a decision-making system by applying deep learning techniques in support of the need for comprehensive care.
To address the abovementioned issues, this research analyzed the care need for different groups of inpatients and proposed a CDSS that applies deep learning techniques to predict the need for comprehensive care for different groups of inpatients. A prototype system was developed for practical evaluation with the aim to improve clinic staff work efficiency and healthcare sustainability.
This research makes the following contributions: (1) a deep-learning-based CDSS for personalized care that predicts the need for comprehensive care for different groups of inpatients; (2) an analysis of the prediction efficiency on different groupings of inpatients in need of comprehensive care; (3) an analysis of the impact of imbalanced data on deep learning model training; and (4) a prototype system to demonstrate the practicality of the proposed model.
The remainder of this article is organized as follows.
Section 2 reviews the deep learning techniques applied to healthcare, and
Section 3 explains the proposed model. Experimental results applying empirical data to the proposed model are explained in
Section 4, followed by concluding remarks and future work recommendations in
Section 5.
2. Related Work
The Alliance for Natural Health International [
7] is an internationally active non-governmental organization promoting natural and sustainable approaches to healthcare worldwide and has defined sustainable healthcare in the following way [
8] as: a complex system of interacting approaches to the restoration, management, and optimization of human health that have an ecological base; that are environmentally, economically, and socially viable indefinitely; that work harmoniously both with the human body and the non-human environment; and which do not result in unfair or disproportionate impacts on any significant contributory element of the healthcare system.
Artificial intelligence is a large computer science field that encompasses logic, probability, and continuous mathematics; perception, reasoning, learning, and action; fairness, trust, social good, and safety; and performs sophisticated tasks in different industries. AI includes but is not limited to machine learning, deep learning, and natural language processing (NLP) and whichever techniques can help medical staff find important information from data. Some medical organizations have already applied AI for daily routines as a CDSS; it can assist medical staff to make decisions, reduce false rates, and increase productivity by performing risk assessments, analyzing different types of diseases, and finding the relationships among the medical data.
Cadar et al.’s study [
9] on analyzing clusters of customers who use medicinal plants indicated that analyzing by groupings contributes a better understanding of user behaviors. It inspired this study to cluster patients in groups in order to have a better understanding of patients’ care needs as well as an efficient comprehensive care prediction. Antoniadi and Mooney [
10] advised that a fair and usable ML-assisted CDSS should provide the right decision with a clear explanation on how that decision was made and should preserve the privacy of the information used to fulfill its purpose in the healthcare environment.
Many factors affect the success of machine learning on a given task, and among them, the representation and quality of data are critical. A study [
11] indicates that irrelevant, redundant, noisy, or unreliable data make knowledge discovery difficult during the training phase. Therefore, data preprocessing and feature selection are important for constructing an effective prediction model. This study selected key features to establish the RNN-based CDSS system, which provide good accuracy.
Datta et al. [
12] evaluated the efficiency of deep neural network architectures and concluded that soft attention improves the image classification performance as it boosts the important features and suppresses noisy features. Dawoodbhoy et al. [
13] conducted an interview and suggested that AI could improve patient flow by streamlining administrative tasks and optimizing resource allocation and that real-time data analytics systems could support clinical decision-making.
Machine learning techniques have been extensively researched for disease predictions. Data-mining algorithms like naïve Bayes, linear regression, decision tree, and random forest have been used on the dataset taken from the UCI machine learning repository. The past study [
14] showed that the random forest model produced the highest accuracy for heart disease prediction among the aforementioned techniques. Nawaz et al.’s study [
15] compared different ML models for predicting disorders of the heart and blood vessels, including support machine vector, K-nearest neighbor, naïve Bayes, artificial neural networks, random forest, and gradient descent optimization. It concluded that gradient descent optimization yields the best performance.
The COVID-19 pandemic has caused huge damage in the world since 2019. Several studies [
16,
17,
18,
19] applied deep neural networks to detect coronavirus diseases from the X-ray and computed tomography (CT) images, and some evaluated multiple convolutional neural network (CNN) models. Chen et al. [
20] proposed an efficient deep learning model for removing irrelevant backgrounds, extracting spatial features, and automatically segmenting lung lesions from CT images. Vidal [
21] et al. proposed a multi-stage transfer learning approach to obtain a robust system able to segment lung regions from portable X-ray devices despite the lack of samples. Haneczok and Delijewski performed drug discovery screenings based on supervised ML models for identifying potential coronavirus diseases and compared the prediction performance of different ML models with different molecular representations. In their study, ML approaches enable drug discovery screenings.
Khreis et al. [
22] evaluated CDSS with the assistance of ML techniques to help healthcare providers in making the clinical judgement of patients’ therapy and reducing medication errors. They concluded that applying ML techniques into CDSS design can remove duplicated and unimportant alerts. Baker et al. [
23] applied a hybrid NN model, CNN+LSTM, for estimating blood pressure from raw electrocardiogram and photoplethysmogram waveforms and demonstrated that ML techniques are an effective approach for blood pressure estimation and are ready for implementing them into wearable devices. Minnema et al. [
24] evaluated different CNN training strategies for CT image segmentation. The results indicate that analyzing the structure of the images helps performance improvement. Lakshmanaprabu et al. [
25] proposed a deep neural network model for lung cancer classification on CT lung images by applying linear discriminate analysis for feature reduction and a modified gravitational search algorithm for weight optimization.
Liu et al. [
26] developed a CNN model to identify tuberculosis infection from X-ray images. Dong et al. [
27] applied a CNN model on chest X-ray image classification to detect multiple diseases such as pleural thickening, otosclerosis, and pulmonary interstitial hyperplasia, not just tuberculosis. This multi-classification model required more than 16,000 labeled X-ray images to train and yielded an accuracy of 82.2%.
A study [
28] reviewed computerized CDSS to support automatic detection of critical conditions and observed a trend toward the use of data-driven algorithms. Given the current lack of best practice guidance to ML and AI, a study [
29] highlighted that patients and healthcare professionals require clinical prediction models to accurately guide healthcare decisions and that ML and AI models potentially improve diagnostic accuracy and reliable prediction.
Most past research applied CNN-based classification models to predict diseases based on images. Only a few published studies focused on applying RNN for predicting patient care, and most discussed the impacts and needs of applying AI technologies to the healthcare sector. To our best knowledge and based on the above literature review, the present study is the first attempt to apply an RNN model to develop a CDSS that predicts personalized care needs.
3. Proposed Methodology
3.1. LSTM-Based Personalized Care Prediction System
The literature review [
9,
24] inspired our study of personalized health care prediction by analyzing the groups of patients for comprehensive care needs. The literature review [
27] has demonstrated that multi-classifiers could yield high detection performance. Therefore, this study applied a multi-classifier for personalized health care prediction.
Figure 1 presents the proposed system architecture, where the left dashed box indicates the training process of constructing the prediction model based on the historical data, and the right box shows the process of applying it in support of personalized care decision making. The training data were the medical data of hospitalized inpatients collected from a medical center that has practiced the CC service since 2017, where the de-identified data include daily medical records extracted from EMR. The proposed method applies the under-sampling technique to mitigate the impact of imbalanced data on model training, clusters patients in groups, and adopts model-selected features to improve prediction performance.
In the evaluation, the steps mentioned above in the training process were evaluated with different approaches in order to obtain the best prediction model. For example, feature selection is one of the key components of ML model training. This study considered all the vital indexes in the daily medical records as the feature set. Another method of selecting important features is relying on domain experts to select key features. This study evaluated the above two feature selection approaches, which are elaborated more in the discussion section.
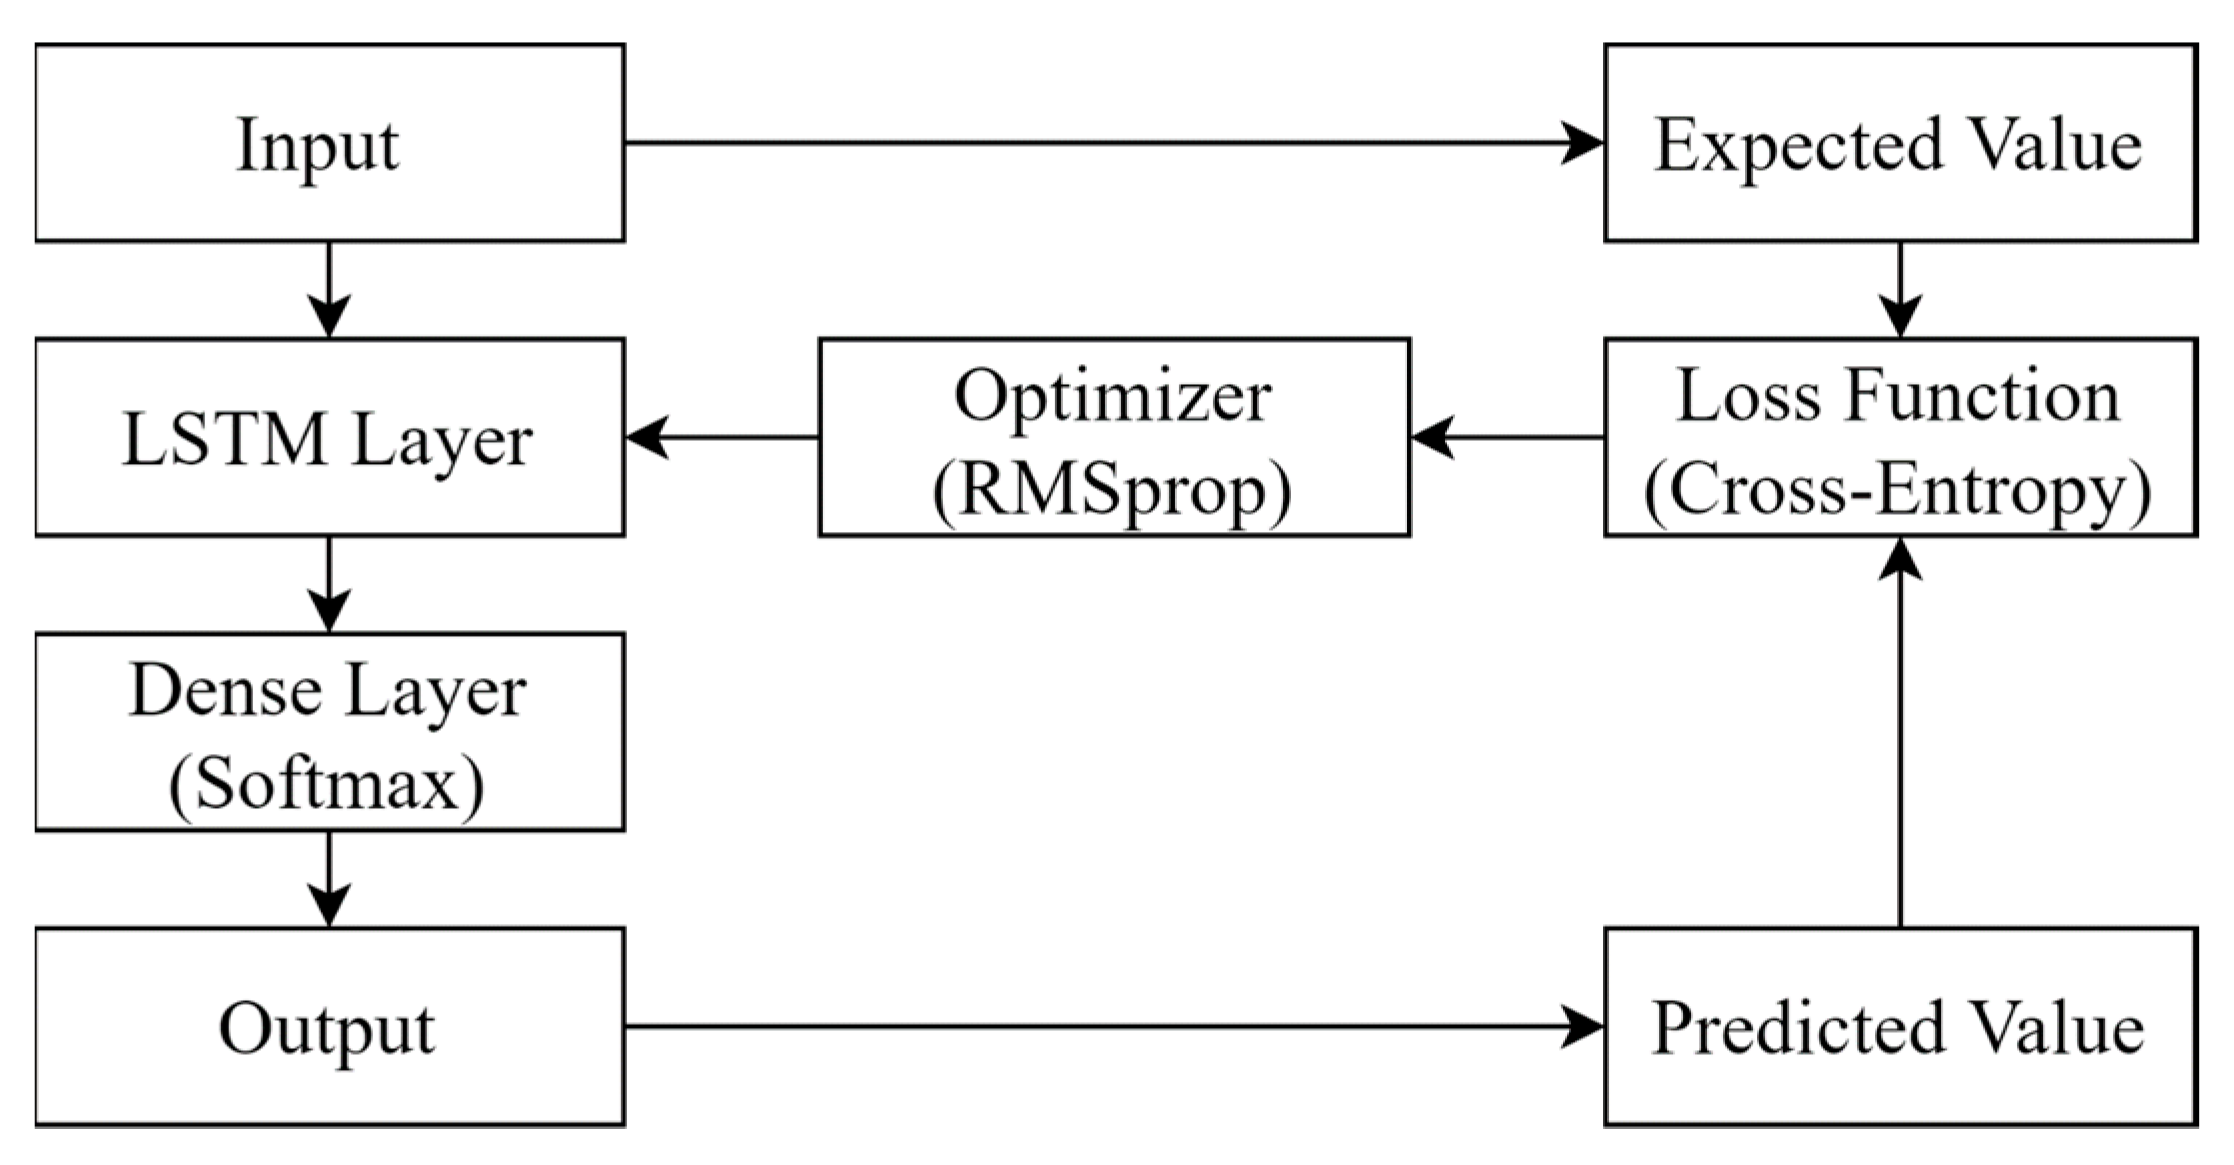
This study proposed an LSTM model for predicting personalized care needs, where LSTM is an improved RNN model that learns the temporal dependency of time-series data. LSTM networks perform exceptionally well on sequential data due to their ability to “remember” what they have previously seen. The proposed LSTM network is composed of four layers, as illustrated in
Figure 2. The input layer is fed with the time-series data: the current medical data (
Dt) of a given patient plus his/her past N-day historical medical records (D
t−6~D
t−1), where N = 6 days. The softmax [
30,
31], aka normalized exponential function, is used in the dense layer, as illustrated in
Figure 3. It normalizes the output into a probability distribution over the predicted output classes. The output layer forecasts if a given patient needs comprehensive care based on the given input data.
The softmax function is used as the activation function in the output layer of NN models. It transforms a vector of
k values into another vector of
k values that sum to 1 and has a normalized probability distribution. The softmax function
is expressed by Formula 1 below, where
is the input vector,
is an element of the input vector, and
denotes the standard exponential function of element
.
Neural networks learn to map a set of inputs to a set of outputs from training data and are trained using an optimization process that requires an objective function (loss function in this case) to evaluate a candidate solution (i.e., a set of weights). NN models typically are trained using the stochastic gradient descent optimization algorithm, and weights are updated using the backpropagation of error algorithm, where the gradient in gradient descent refers to an error gradient. Therefore, the objective function for NN models usually is a loss function calculating the model error.
Figure 3 illustrates the optimization process of the proposed LSTM model. It repeatedly improves the prediction by adjusting the features and their weighting in an LSTM cell in order to minimize the loss function. For a predicted result, it compares with the expected result and calculates the loss. The optimizer then revises the weighting of the features in the LSTM cell to minimize the loss.
3.2. Hyperparameter Selection
Based on our preliminary evaluation of parameter tuning,
Table 1 lists the hyperparameters chosen by the proposed model. An LSTM cell contains two activation functions: one is for the model and the other is for recurrent usage. A performance analysis study [
32] comparing 23 different combinations of activation functions recommended hyperbolic tangent for activation function and sigmoid for recurrent activation function.
The literature review indicated that cross-entropy performs well at generalizing beyond the training data and initializing the weights [
33] and that binary cross-entropy yields the best performance for binary classification applications [
34]. Therefore, the proposed prediction model chose binary cross-entropy as the loss function.
An analysis of the optimization algorithms [
35] concluded that Adam, RMSprop, and AdaDelta perform approximately well; the Keras documents [
36] recommended RMSprop for RNN models. As LSTM falls into the RNN category, the proposed system implemented RMSprop as the optimizer.
The number of instances from the training data set used in the estimate of the error gradient is called the batch size and is an important hyperparameter that influences the dynamics of the learning algorithm. One training epoch means that the learning algorithm has made one pass through the training data set, where the training data are separated into randomly selected “batch size” groups [
37].
A too-small batch size may fail to converge and may lead to underfitting, while a too-large batch size may exhaust computing resources. An analysis study [
38] observed that controlling the ratio of the batch size to the learning rate to be not too large could achieve a good generalization ability. An investigation [
39] demonstrated that a large batch tends to converge to sharp minimizers, leading to poor generalization and degrading the model quality, while another past work [
40] suggested increasing the batch size instead of decaying the learning rate. Therefore, our preliminary testing ran multiple combinations of epoch and batch size and concluded with the parameter values listed in
Table 1.
3.3. Data Pre-Processing
The literature review proved that data pre-processing has a significant impact on machine learning performance. The representation and quality of the instance data are some of the foremost factors for building an effective model. Noisy or invalid data may disrupt the model training.
To construct an effective ML model, the data preprocessing module examined the validity of the patient’s records, including missing data points, empty values, and outlier values. It applies linear interpolation to estimate missing data, for example, a missing blood pressure measurement in a patient’s daily vital record. A default value of 0 is filled in for null or empty values in a data field. A value larger than two standard deviations of a given field is considered as an outlier and is replaced by an interpolation value.
The data were collected from a medical center composed of diverse medical information such as body temperature, blood pressure, comorbidity, etc. The private information about inpatients, such as name and birthday, had been removed and de-identified. The reasonable range of each data field was verified, and unreasonable or missing data were corrected by interpolation.
3.4. Data Resampling
Effective model training requires a balanced or approximately balanced class distribution. However, the training data collected from the real environment were imbalanced, where most inpatients made up a majority class and where only a very small amount of the comprehensive care patients made up a minority class. In this study, less than 0.5% of inpatients received comprehensive care, which is extremely imbalanced data. Sampling is a process of resampling data that generates a sampling distribution based on the actual data, and the resampling is to produce a less-skewed training dataset for model training purposes. Two types of resampling strategies are commonly applied: over-sampling and under-sampling.
Over-sampling (or up-sampling) increases the number of minority class samples to reduce the degree of imbalanced distribution. For over-sampling, this study adopted the synthetic minority over-sampling technique (SMOTE) [
41]. It is one of the most commonly used over-sampling approaches in which the minority class is over-sampled by creating synthetic examples. The synthetic samples are generated based on randomly selected k nearest neighbors of the minority class. They cause the classifier to create larger and less-specific decision regions so that the more general regions could be learned for the minority class.
On the other hand, since there are much more samples of the majority class than the minority one in the imbalanced class distribution problem, under-sampling approaches reduce the number of samples from the majority class. To keep the selected samples representative and to prevent the problem of information loss in most under-sampling techniques, near-neighbor methods are widely used. This study adopted the NearMiss3 under-sampling approach [
42], which selects the majority class samples for which the average distance to the N nearest-neighbors is the largest. In other words, it attempts to select the samples of the decision boundary. Based on our preliminary study, under-sampling yields better performance and is suggested in the proposed method.
3.5. Data Clustering
According to our preliminary study on analyzing different patient groupings and interviewing the physicians, the proposed method divided the patients into six groups based on their age and disease, where there are three age groups (<65, 65~80, >80) and two disease groups (with or without cancer). In practice, elderly patients usually require more special care needs than young ones, so the grouping specifically ranges out two aged groups: 65~80 and >80 in order to emphasize their different needs. Likewise, cancer patients need special care as well.
Table 2 summarizes the patient grouping results and the data distribution of each group, where CC denotes patients who have received comprehensive care.
3.6. Feature Selection and Encoding
There were three types of data in this study: categorical, continuous numerical, and discrete numerical data, as shown in
Table 3, and all the data fields collected were considered as features in the proposed prediction model. The data need to be represented in numerical form in order to be fed into ML models as they only work with numerical values.
Categorical data, such as disease and gender, need to perform a transformation before applying an ML model. This study applied one-hot encoding for categorical data, which converts each categorical value into one bit in a bit string.
For numerical data, this study applied data normalization to quantify the significance of the feature value. For continuous numerical data, such as temperature and blood pressure, the proposed system applied the MinMaxScaler standardization approach for data normalization in order to quantify the significance of the feature, where MinMaxScaler transforms a feature by scaling it to a given range to preserve the shape of the original distribution. For each value in a feature
X, MinMaxScaler subtracts the minimum value in the feature and divides by the range, where the range is the difference between the original maximum and the original minimum value of the feature. MinMaxScaler standardization is expressed in the following formula, where
max and
min stand for the maximum and minimum values of feature
X, respectively, and
Xstd is the standardized value of feature
X ranging in 0~1.
Regarding discrete numerical data, such as check-in and check-out dates, this study transformed these parameters into meaningful values for the ML model, for example, in this case the number of hospitalized days. The number of hospitalized days,
Ddelta, a discrete numerical feature, can be expressed as follows, where
DD and
ED mean the check-out and check-in dates, respectively.
A discrete numerical feature, such as coma status, combines multiple pieces of medical information into one. The Glasgow coma scale (GCS) is a neurological scale to give a reliable and objective method of recording the state of a patient’s consciousness, which contains three physical aspects of coma seriousness: eye (
CSeye), vocal (
CSvocal), and motion (
CSmotion). This study combined the above three scales into one feature, coma status (
CSall), as expressed below.
Table 4 illustrates how the patient’s EMR is represented originally and encoded for applying the ML models, where the two red boxes indicate the corresponding data records before and after the feature encoding.
Table 4A lists the raw data of a patient’s medical records including the dates of the admission and discharge, age, daily health measurements, diseases, etc., where the first record denotes the patient’s medical record on the first day of the admission (15 May 2019) and so on. Based on the aforementioned feature-encoding methods, the data were encoded as outlined in
Table 4B. The LSTM acquires the past N days of the EMR data for predicting the patient’s health care need, where N = 6 in this case. For example, to predict the patient’s health care need on his/her 8th day (22 May 2019), the input to the prediction model is the time-series feature vectors dated from 16 May 2019 to 22 May 2019 (a total of 6 + 1 days) as marked in the red box.
Figure 2 describes the neural networks of the proposed LSTM model. For this illustration, the input layer is the time-series feature vectors (D
2, D
3, …, D
8, where t = 8), and these feature vectors are the input to the corresponding LSTM cells.
4. System Evaluation
The proposed system and the models used for evaluation were implemented and evaluated in the same environment. They were developed in the programming language Python with the open-source library Keras. The experiments were run on a personal computer with the computing resources described in
Table 5.
Table 6 outlines the evaluation that consists of the following experiments: Exp. 1 evaluated the impact of imbalanced data; Exp. 2 analyzed whether a bi-classifier or a multi-classifier is suitable for predicting personalized care; Experiment 3 analyzed which patient grouping is suitable for practicing the personalized care prediction; Experiment 4 compared two different feature selection schemes, human vs. AI; Experiment 5 analyzed the performance of different prediction models in order to construct the best model for providing personalized care suggestions.
This research adopted accuracy, precision, recall, and F1 score as primary performance measurements, where they were defined by the confusion matrix as shown in
Table 7. For completeness, the negative predictive value (NPV) is provided for reference. Except presenting the mean of a result, this study also calculated its confidence interval and adopted the most commonly used confidence level, 95%. A confidence interval represents the estimation of a result and is comprised of two values: the upper and lower bound. In other words, the confidence interval displays the probability that the result will fall between the pair of the values around the mean.
Because the main purpose of the prediction was to identify the patients who need comprehensive care, recall was a primary performance measure considered in this study. Because of highly unbalanced data with a huge number of non-comprehensive-case cases (negatives), the negative predictive value was not considered in this study. However, all the measurements were calculated for reference as well as the overall performance analysis.
Accuracy is the degree of closeness to a true value and is defined as the proportion of the correct predictions among the total number of the data set. Precision, aka positive predictive value, is defined as the fraction of the predicted comprehensive care instances divided by the correctly predicted comprehensive care instances. Recall, aka sensitivity, is the fraction of the actual comprehensive care instances divided by the correctly predicted comprehensive care instances. Negative predictive value is defined as the fraction of the predicted non-comprehensive-care cases divided by the correctly predicted non-comprehensive-care cases.
The F1 score combines the precision and recall of a prediction model into a single metric by taking their harmonic mean. As multiple performance indices were considered in the evaluation, this study considered the F1 score as the overall performance comparison measure when there was a trade-off among the different prediction models.
4.1. Study Population
This study adopted de-identified inpatient medical records collected over two years from a medical center in Taiwan that has practiced comprehensive care since 2017. The physiological measurements of all hospitalized patients were available from the EMR system, including vital signs, emotional conditions, sleeping quality, food intake, medication status, etc. A total of 250,000 inpatient cases with 1.9 million medical records and 949 comprehensive care patients was referenced to model training and evaluation, where comprehensive care patients were verified manually by physicians.
The data set had the ratio of negatives to positives = 0.379%. All the neural networks were trained using 50% of the data, and the remaining 50% of the data was unseen to the networks for testing purposes. A prediction was considered valid if it fell within two weeks of the actual date of occurrence. Cross-validation tests were performed to eliminate the overfitting issue.
4.2. Patient and Public Involvement
This research was carried out without patient or public involvement in the design or result interpretation. Patients and members of the public did not contribute to the writing or editing of this manuscript.
4.3. Exp. 1: Imbalanced Data
Exp. 1 compares the prediction performance with and without data resampling to evaluate the impact of imbalanced data on model training. Two data resampling strategies were considered for mitigating the imbalanced data issue, where up-sampling applied the synthetic minority oversampling technique (SMOTE) and down-sampling adopted the Fourier method. The data resampling strategies adjusted the ratio of negatives to positives into 8:2.
Table 8 summarizes the attributes of the collected data set and those of the training data after applying the data sampling strategies. The collected data set was divided evenly into two parts: one for training and the other for testing. Therefore, both had the same amount of positive and negative cases, and the number of the associated data records in training and that in testing were approximately even with the ratio of 1.22:1 as indicated in the table. As mentioned above, the data sampling was to obtain a better data distribution for improving the model training. This study applied the resampling strategies and redistributed the positives and negatives to the ratio of 2:8, where the original data had an extremely skewed ratio of 3.79:1000, as listed in the table.
Table 9 outlines the impact of different data sampling strategies on the performance of the model training. In this study, the data set contained a very huge amount of negative samples. Therefore, even though under-sampling eliminated a large amount of negative cases from the majority class, it still retained enough representative samples of the majority class so that the ML models were able to learn the class patterns. On the other hand, with an extremely small number of positive samples, some synthetic positive cases generated by over-sampling might not be able to provide the expected patterns of the minority class and hence affect the efficiency of the model training. The results indicate that, even though under-sampling had the least number of samples as well as data records, it consumed the least training time and outperformed the other two sampling strategies. No resampling performed the worst, which demonstrates that imbalanced data may affect the effectiveness of the model training. This experiment implies that data resampling could mitigate the impact of imbalanced data, and under-sampling obtained the best prediction model.
4.4. Exp. 2: Bi-vs Multi-Classifier
A personalized health care prediction model is a multi-classes question and has two solution options: a single multi-classifier or a binary classifier for each group. Therefore, Exp. 2 analyzed the three classification models: (1) a multi-classifier for all the patient groups; (2) one bi-classifier for each group; (3) one bi-classifier for all the patients. The results are summarized in
Table 10, where
M(C) denotes the bi-classifier for all patients,
M(Cgroup_i) denotes the bi-classifier for patients in group
i, and
M(Cgroup_1,
Cgroup_2, …,
Cgroup_n) denotes the multi-classifier for the patient clustering of
Cgroup_1, Cgroup_2, …,
Cgroup_n. The results demonstrate that the multi-classifier yields the best prediction performance and that patient clustering improves the prediction performance as it reduces data complexity. Comparing with the best training time, the increased training time of the multi-classifier is neglectable.
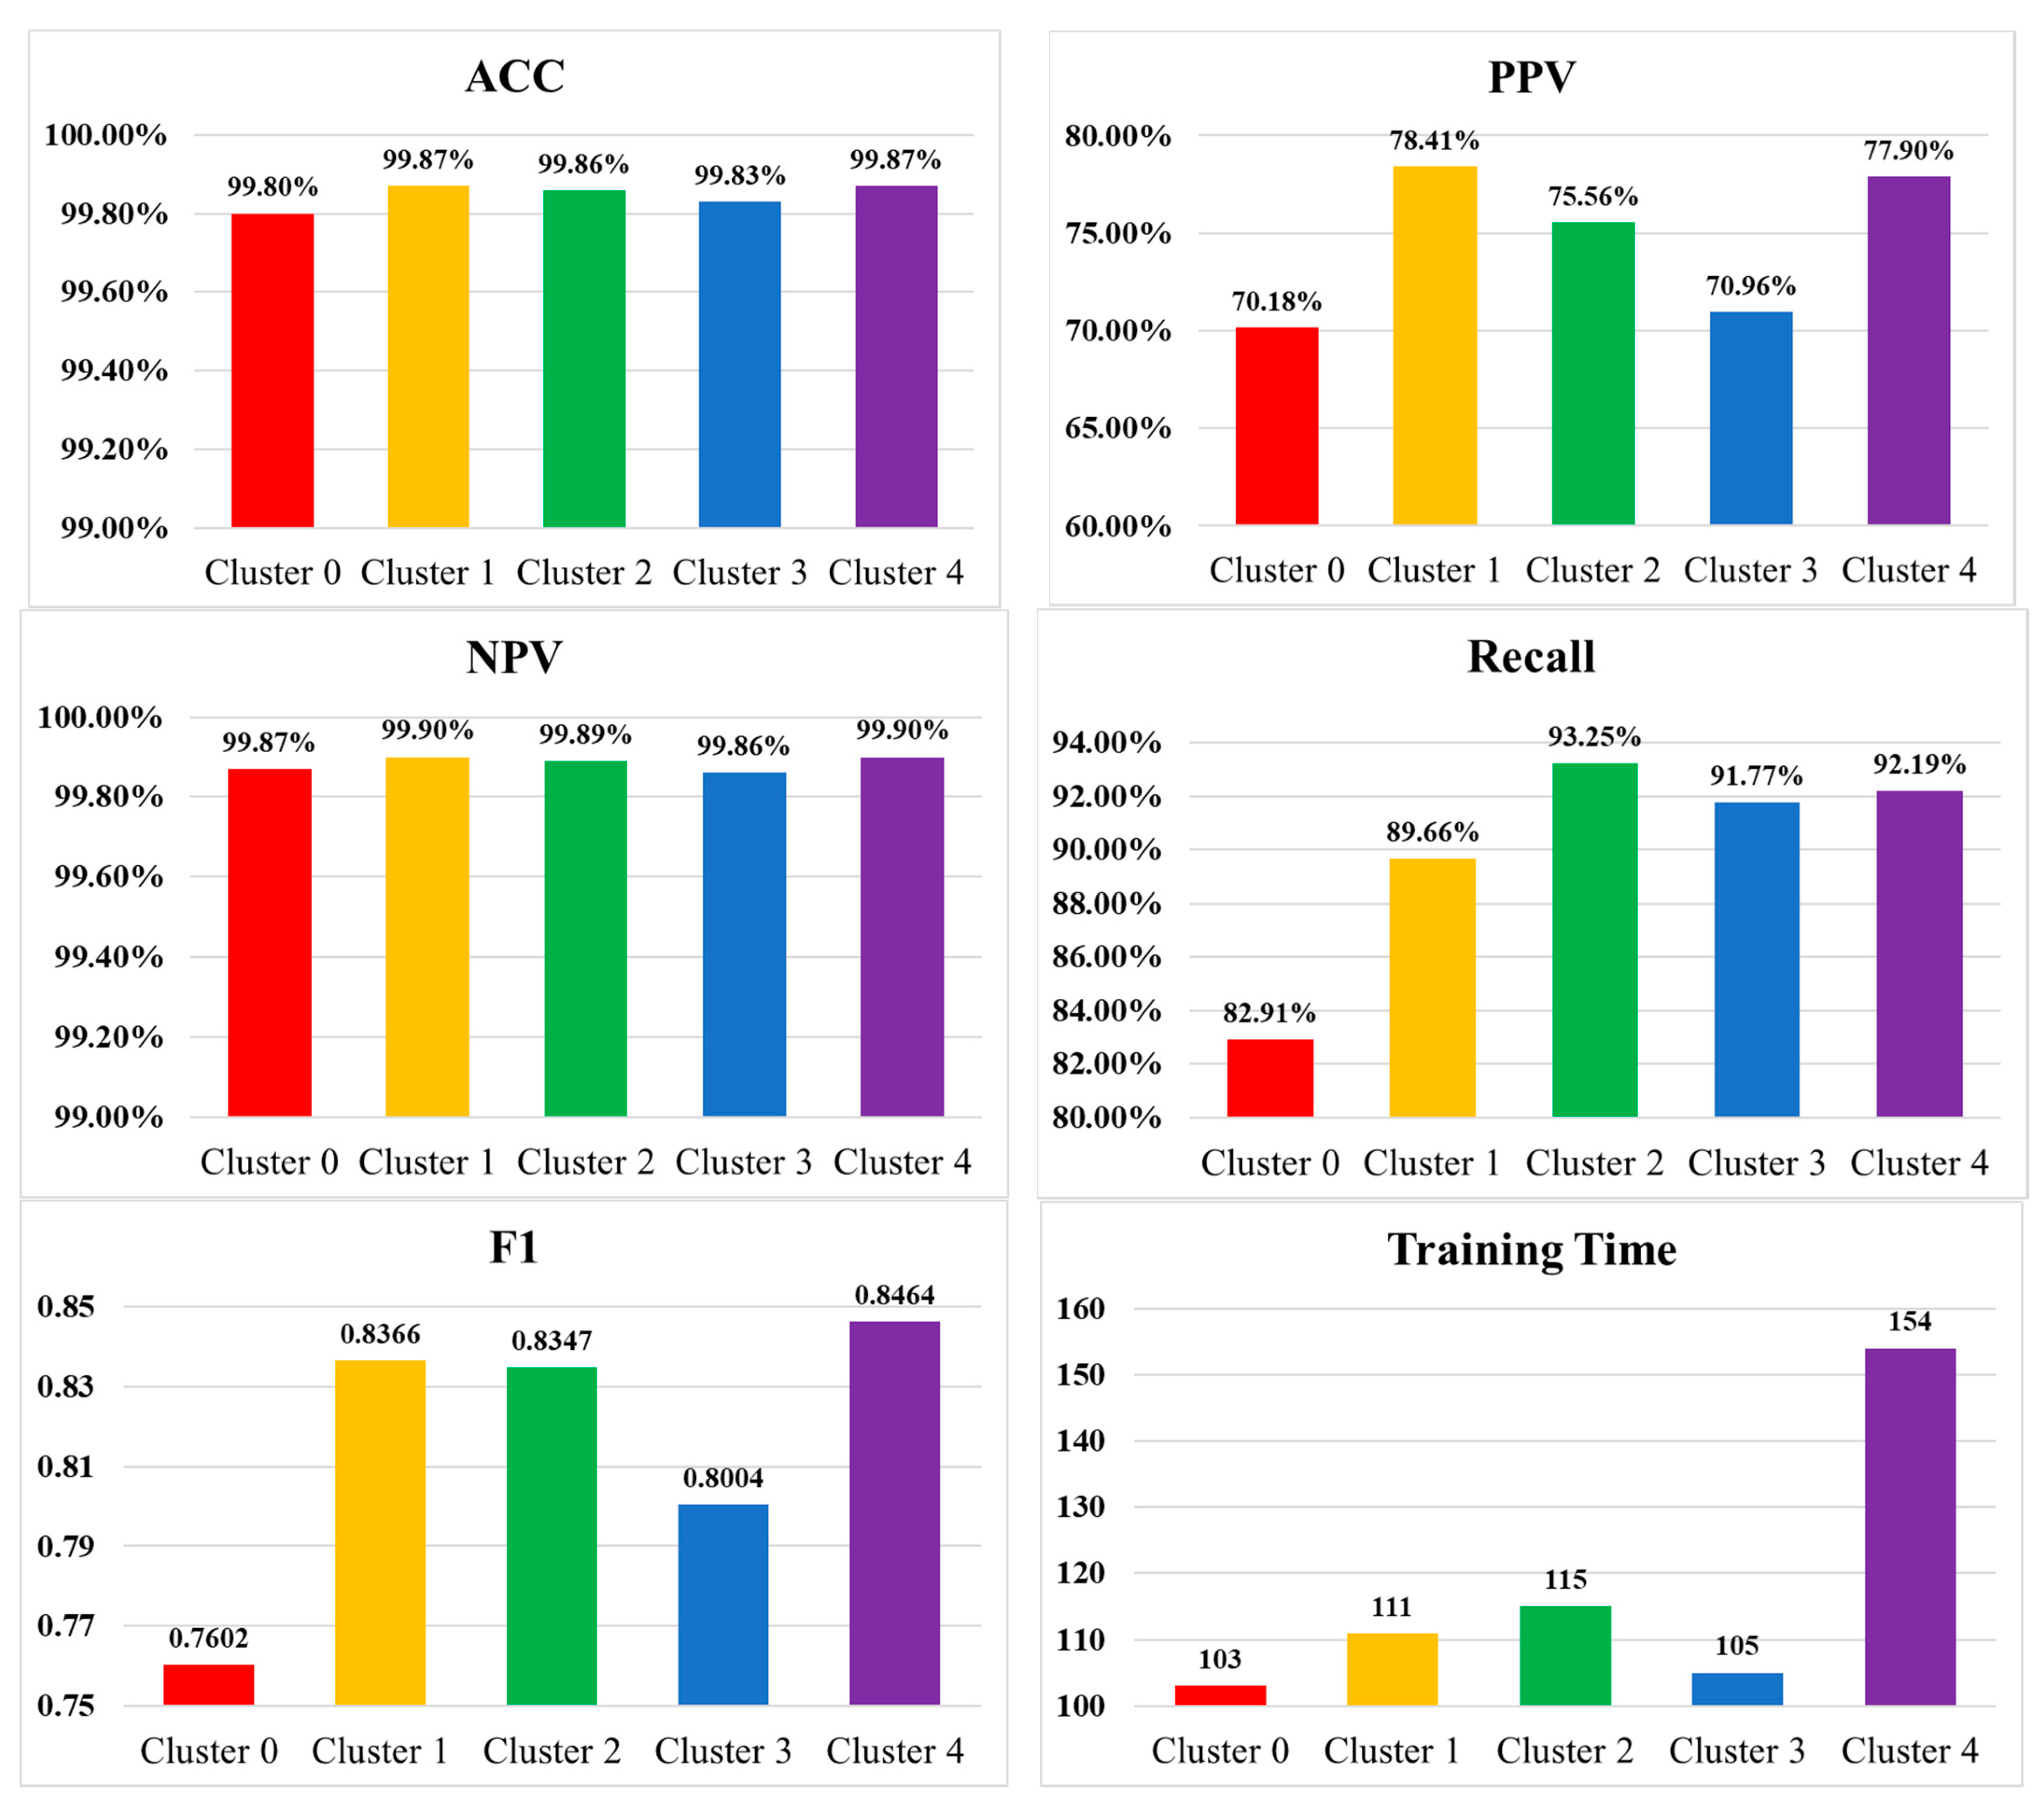
4.5. Exp. 3: Patient Clustering
Exp. 3 analyzed different patient groupings to find an optimal patient clustering for personalized care suggestions. Patient clustering was factored by age and cancer disease, and Exp. 3 analyzed the following patient groupings:
Cluster 0: all patients in one group, no clustering.
Cluster 1: (C<65, C≥65)
Cluster 2: (C<65, C65~80, C≥80)
Cluster 3: (Ccancer, Cno-cancer)
Cluster 4: (C<65 cancer, C65~80+caner, C≥80+caner, C<65+no-cancer, C65~80+no-cancer, C≥80 no-cancer)
The results of Exp. 3 are summarized in
Table 11 and
Figure 4. Considering clustering in age, the clustering of (C
<65, C
≥65) yielded the best performance. However, based on the interviews with physicians and clinical staff who practice the comprehensive care service, they preferred clustering patients in three age groups: C
<65, C
65~80, C
≥80, as it fits in their operation. Based on their practice experience, patients with cancer often require comprehensive care than those without cancer. Therefore, the age groups were further divided by cancer disease, which produced Cluster 4.
Cluster 4, (C<65+cancer, C65~80+caner, C≥80+caner, C<65 no-cancer, C65~80 no-cancer, C≥80 no-cancer), yielded the best performance, except that its precision was slightly less than Cluster 1. Overall, Cluster 4 outperformed all the others but required a longer training time. The results imply that a classifier with many classes requires longer training than one with not too many classes, but this would not affect its performance. The increased training time is in an acceptable range, so Cluster 4 was adopted in the proposed system.
4.6. Exp. 4: Feature Selection
Exp. 4 analyzed the performance of two methods of feature selection: human-selected vs. model-selected, where the human-selected refers to the features chosen by the domain experts and the model-selected refers to those chosen by the ML model. The model-selected applied the EMR data records without summarizing or emphasizing any indicator so that the ML model could extract the correlation among the original data.
Table 12 summarizes these two feature sets, where the human-selected feature set was adopted by the hospital that had implemented and practiced a comprehensive care suggestion system since 2017 [
43]. Except the original EMR data, they added two more health indicators (EWS and health score) calculated by patient’s physiological indicators. The experts intended to emphasize the importance of the health indicators by adding these two more features and assigning a human-defined weight for each of the health indicators in order to quantify the degree of his/her need for comprehensive care. Tuning the weighting has taken a large amount of trial-and-error experiments and discussion meetings in the studied hospital.
The health score evaluates a patient’s total health condition from the following three aspects: the patient’s wellness evaluation from the care team (TeamEval), the comorbidity condition based on the Charlson comorbidity index (CCI) [
44], and the early warning Score (EWS) [
45], as summarized in
Table 13, where pain and BSRS ranged from 0 to 10, nutrition ranged from 0 to 6, CCI scaled from 1 to 6, and EWS scaled from 0 to 3. Each index in
Table 13 contributes a ratio tuned by the experts, where B stands for the measured CCI value and C for the EWS value. Different diseases contribute different mortality risks to a patient, so weighting was given for the above three wellness aspects as listed in
Table 14. The health score is defined below.
where
Table 15 outlines the experimental results. Overall, the model-selected feature set yielded better performance. It required a longer training time than the human-selected one as its feature dimension was larger and required more time to find an optimal weighting for the features.
4.7. Exp. 5: Model Selection
Exp. 5 compared the performance of different prediction models including the proposed LSTM models, the baseline RNN, and a hybrid CNN+LSTM model, where the baseline RNN was considered as the previous model applied in the studied hospital, and the hybrid model applied CNN to perform feature selection and LSTM for prediction. The hyperparameters applied for the baseline RNN and hybrid CNN+LSTM models are outlined in
Table 16; the model comparison results are listed in
Table 17.
All models performed well on accuracy and NPV as the data set contained a high number of negatives. Both models, the baseline and the hybrid, performed equally well on all the performance measurements, but the hybrid required 2.6 times more training time than the baseline. Overall, the proposed LSTM achieved the best performance and required a little bit more time than the baseline. It could forecast comprehensive care patients efficiently with a high true positive rate and achieved the purpose well.
5. Discussion
The model-selected feature set exhibited better overall performance and yielded a better F1 score, but the human-selected one had a slightly better recall rate. As the correctness of the prediction was based on the clinician’s decision, they tended to activate the comprehensive care service by observing the values of the two human-defined features, the health score and the EWS. Therefore, the human-selected feature set may predict positive cases better because of the two additional features. Likewise, the patient’s age and comorbidity status are two important factors for the clinician while making the decision. Therefore, the patient clustering approach according to the above two factors resulted in a better recall rate as well.
When considering the overall performance by F1 score, the LSTM model outperformed the baseline as well as the hybrid model. However, the recall rate may be important for some medical applications. Even though the hybrid model (CNN+LSTM) took two times more of the training time than the LSTM model and three times more than the RNN model, it had the best recall rate, which could offset the additional training time.
An efficient clinical decision support system assists the clinicians in predicting the patients’ needs, improves the quality of healthcare service, and preserves medical resources. The proposed prediction model was designed according to the clinician’s practical experiences on comprehensive care and improved the prediction performance by resampling, patient clustering, and feature selection. The system evaluation demonstrated that the proposed method is practical and efficient. It is able to improve work efficiency, and it reduces the consumed medical resources, produces less medical waste, and hence improves the environmental sustainability of the medical institute.
6. Conclusions
Good-quality care for patients with comorbidities is one of the most important and complex problems of modern clinical health care because of the high mortality rates if not managed properly. By applying AI technologies, this study developed an LSTM-based prediction system, learning from the past patients’ medical records and decisions made by clinicians so that it provides comprehensive care suggestions. The proposed system can enhance the existing hospital information system with the ability to monitor the health condition of inpatients continuously and to fill the communication gap among multiple clinic staff taking care of them. By allocating healthcare resources properly based on need, the proposed system can improve staff work efficiency as well as increase medical service quality.
To our best knowledge, the present study is the first attempt to apply an RNN model to develop a CDSS that predicts personalized care needs. Only a few published studies focused on applying RNN for predicting patient care, and most discussed the impacts and needs of applying AI technologies to the healthcare sector.
This study addressed several design issues when applying AI models, including the type of classifier for a multi-class question, feature selection, imbalanced data, and model selection. The evaluation section conducted experiments to analyze the impact of the above issues. A multi-classifier performed better than multiple bi-classifiers. Human-selected features might not be able to perform as well as features selected by the machine learning model. Resampling is an effective strategy to mitigate the impact of imbalanced training data, where under-sampling is better if the data are extremely imbalanced, as is in this study. A prediction model combining two neural network models typically consumes more training time than a single neural network model but might not improve the performance significantly. This study demonstrated that patient clustering improves personalized care prediction and proposed an efficient CDSS approach.
It is difficult to account for the variability of the disease risks to a new illness, such as COVID-19. Investigations require domain knowledge and complex production rules where patterns are hard to predict. Further work could be focused on identifying the key factors of providing personalized comprehensive care for patients with different disease complications and mortality risks.


