Abstract
In standard district cooling (DC) plants, central chillers produce cold energy for space cooling throughout the district network. In recent times, the integration of the vapor compression system, which includes the functionalities of vapor compression chillers (VCC), and thermal energy storage (TES) tanks in the DC setup, has gained more implementation across the globe. This is due to the possibility of load shifting by using the VCC to produce chilled water for charging the TES tanks during off peak periods. Since the environmental implications of various energy intensive systems are largely determined by the amount of material and energy consumed throughout their life cycle, it is critical to conduct a sustainability assessment of these systems in terms of environmental contributions, and suggest design options to reduce these impacts. A cradle to grave life cycle assessment (LCA) model is created in response to these issues and in order to meet the project’s objectives. The life cycle impact assessment (LCIA) results of the analysis reveal that the carbon footprint per 1 RTh of the produced chilled water is estimated at 0.72 kg CO2 eq/RTh. The operation phase of the system’s life cycle accounted for the most impact, about 98%, with other life cycle phases having negligible contributions. In substantiating the study’s investigation, the environmental performance based on several design options were discussed and compared to the case study. Among the several scenarios considered, incorporating the Sweden mix technology provided the case study with the most significant environmental savings, of about 94%.
1. Introduction
About 50% of the consumed energy in many regions of the world are attributed to heating, ventilation, and air conditioning (HVAC) systems, especially in hot tropical countries such as Singapore, Saudi Arabia, Malaysia, etc. [1]. Conventional cooling systems, such as split AC units and chillers installed in the basement of buildings, are commonly used to satisfy cooling demands, globally [2]. On the other hand, a well managed district cooling (DC) technique, to supply air conditioning services to a network of buildings in cities, is 50% more efficient than conventional techniques. However, researchers have developed several methods to optimize district energy performance in terms of higher system efficiency, lower operation cost, integrating cleaner fuels for GHG reduction, etc. [3,4].
In recent times, the integration of storage systems technologies into DC setups has gained worldwide implementation. In various DC facilities, thermal energy storage (TES) systems have been installed to optimize the operation of DC plants and meet the fluctuating demand for the supply of chilled water for air conditioning purposes. Although the vapor compression chiller (VCC) accounts for about 40% of the total electricity supplied to the DC plant [5], studies have shown that integrating the functionalities of VCC and TES into the DC plant leads to a 35% reduction in electricity consumption, compared to conventional DC systems without TES. Different electricity tariffs during various times of the day benefit the integration of TES technology. The TES tank assists with load levelling and peak shaving. Peak load shaving is achieved by charging the TES tanks during the off peak period (at night), with the VCC operating at full capacity when it exhibits maximum performance. The stored chilled water satisfies the district cooling load during the day (on peak), while the VCC systems are shut down. This setup allows the cooling technologies in the central cooling station to be sized closer to the average load than the peak load. In addition, the electricity used for pumping water through the district network and operating electricity based chillers can be shifted to off peak hours.
Several qualitative and quantitative methodologies have been developed and adopted to assess the environmental performance of energy systems. The classified quantitative or qualitative techniques commonly used include environmental benchmarking; a simplified LCA checklist; a material, energy, toxic emissions matrix; life cycle assessment (LCA); etc. However, amongst these options, the LCA methodology stands out as the most preferred tool for analyzing the environmental performance of energy intensive systems [6,7].
A few notable reviews are available addressing the environmental impact implications of chiller systems. The available literature reviews of the chiller systems are addressed below.
Bukoski et al. [8] used the LCA methodology to assess the environmental impact of installing a solid hybrid cooling system in a 15,000-seat Thai stadium. The baseline research compares a solar powered absorption chiller system against an electric powered vapor compression chiller system. The solar system saved around 26–40%, in terms of environmental effect, compared to the other two systems.
Using the life cycle assessment (LCA) approach, Sonia Longo et al. [9] investigated the life cycle energy and environmental performance of a small solar space heating and cooling (SHC) system, with an adsorption chiller in different European locations. The new system was compared to the old one, which used a vapor compression unit. According to the study, the conventional system outperforms the SHC system over its entire life cycle (10 years). Furthermore, while the production phase of the SHC system has the greatest impact on the life cycle phase, the operating phase is the most crucial.
Hampo et al. [5] used a gate to gate LCA methodology to analyze the environmental performance of four electric chillers. The authors investigated the environmental performance of the chiller systems based on the composition of the 2020 Malaysia’s fuel mix and the proposed optimized electricity mix by 2030. The authors recorded an average of a 33% reduction across all the selected environmental categories, as the optimized fuel mix option (2030) was introduced into the electricity mix.
Nan Xie et al. [10] evaluated the environmental advantages of combining a LiBr/H2O absorption chiller and Kalina cycle (KC) with an individual KC, using the LCA approach. They discovered that energy production during the operation stage is a more environmentally friendly option. Furthermore, the combined system displayed a significantly higher number of ecological indexes compared with the individual KC, increasing by 46.17%.
To analyze the influence of energy systems on environmental profiles, Catrini et al. [11] presented a combined technique based on thermoeconomics and life cycle assessment. This approach was used to assess a water cooled scroll compression chiller built to cool a big office building. The authors used an IMST-ART simulator to model the operation of the chiller system and compare different chiller designs to their associated environmental improvements. According to the authors, the use phase has the most significant influence on the environment. They also claimed that the electricity production mix utilized to power the chiller (the Italian grid energy mix) presented more substantial trade offs between efficiency and cost.
In separate research, K. Almutairi et al. [12] reported on an LCA and economic analysis of a VCC placed in residential structures in Saudi Arabia. According to the findings, the use phase has the most significant environmental effect. In addition, the quantity of the effects assessed was impacted by the type of main fuel utilized to power the facility. According to the government, installing and using more energy efficient air conditioner systems is always advantageous, economically and environmentally.
In the study of Emillo et al. [13], the LCA methodology was used to evaluate the global warming potentials of two 500-ton capacity water chiller systems, focusing on the manufacturing stage, one with an oil lubricated bearing system and the other with a magnetic bearing system. The study found that over 90% of the emissions from the water chiller system’s operating stage are due to power consumption, with the most significant emissions coming from material extraction and production. As a result, magnetic bearing systems recorded reduced GHG emissions, more than oil lubricated bearings. However, according to sensitivity and uncertainty analysis, both electrical energy generation factor and chiller efficiency NPLV can strongly affect GHG emissions, though a more significant reduction in emissions can occur when the power supply for chillers is mixed with clean energy resources.
The energy consumption and emissions related to the operation of a chiller and other chiller plant components installed in a university building powered by fossil fuels were examined by Saidur et al. [14]. The authors estimated the emissions and energy savings associated with incorporating variable speed drives (VSDs) into chillers and motors in their study. They also stated that integrating VSDs into chiller systems resulted in a 60 percent reduction in speed and a 2,426,769 kg reduction in total carbon emissions.
The review of the life cycle analysis of the studies conducted in this project includes assessing the environmental impacts resulting from the life cycle energy and material usage of various chiller systems. However, despite the range of modelling options available in the literature, several gaps exist. From the general overview of the literature, some research gaps are drawn.
First, other LCA studies on HVAC systems are mostly carried out for European, American, and China case scenarios. A probable reason for this can be due to the relative presence of stricter environmental laws and higher energy costs in these countries. On the other hand, similar research for countries in southeast Asia with tropical weather conditions, such as Malaysia, is extremely rare to find. Since LCA results are largely affected by geographical location, energy source, and building types, this raises the need to conduct more case study research that reflects the peculiarity of Malaysia (and southeast Asia in general) in terms of its temperate weather condition, cooling demands and commercial grid mix.
Secondly, the VCC analyzed in most case studies operated separately, in various building attachments, to satisfy the cooling demands. However, no available research addresses integrating the functionalities of a VCS in a DC plant, especially as it involves pairing the functionalities of the TES and VCC in optimizing the economic and environmental performance of the DC plant.
Thirdly, only a few studies were found to evaluate or optimize the VCS by combining two aspects, addressing the energy and environment. Therefore, a methodology that assesses the life cycle energy and environmental performance of VCS systems is desirable.
Based on these gaps, mentioned above, the primary objectives of this paper are listed below;
- To develop a cradle to grave LCA model to investigate the environmental impact of a vapor compression system integrated into a DC plant.
- To identify several design options to reduce the environmental impact of the vapor compression system during the operation phase.
- To estimate the environmental gains resulting from the integration of TES tanks in a DC setup, compared to the conventional system designs.
This study provides an in depth version of the previous work by Hampo et al. [5], however, this document adds depth to that content. For example, Hampo et al. [5] did not conduct a cradle to grave life cycle impacts assessment, as their model was limited only to the gate to gate approach. Secondly, their research did not include TES tanks in their research scope. Thirdly, the use of LCA software, in this study, allowed for a wider variety of impact categories to be assessed, compared to the just four impact categories considered in the study of Hampo et al. Lastly, this study assessed the possibility of integrating several optimized system designs into the case study, to estimate the environmental reaction. In contrast, Hampo et al. [5] only addressed the environmental implications of switching the 2020 Malaysia fuel mix with the proposed 2030 fuel mix.
2. Methodology
2.1. Overview of Life Cycle Assessment
LCA is a tool for systematically analyzing a system’s environmental performance. When analyzing a product’s environmental effect, LCA evaluates its impact on ecosystems, natural resources, and human health [15]. The LCA method constitutes a unique concept, in the form of a functional unit that can be used to aid comparison with other systems and designs. The integrated LCA method is a set of equations, mass and energy balances, and other computations representing the collection and analysis of a wide range of system inputs, outputs, and environmental effects.
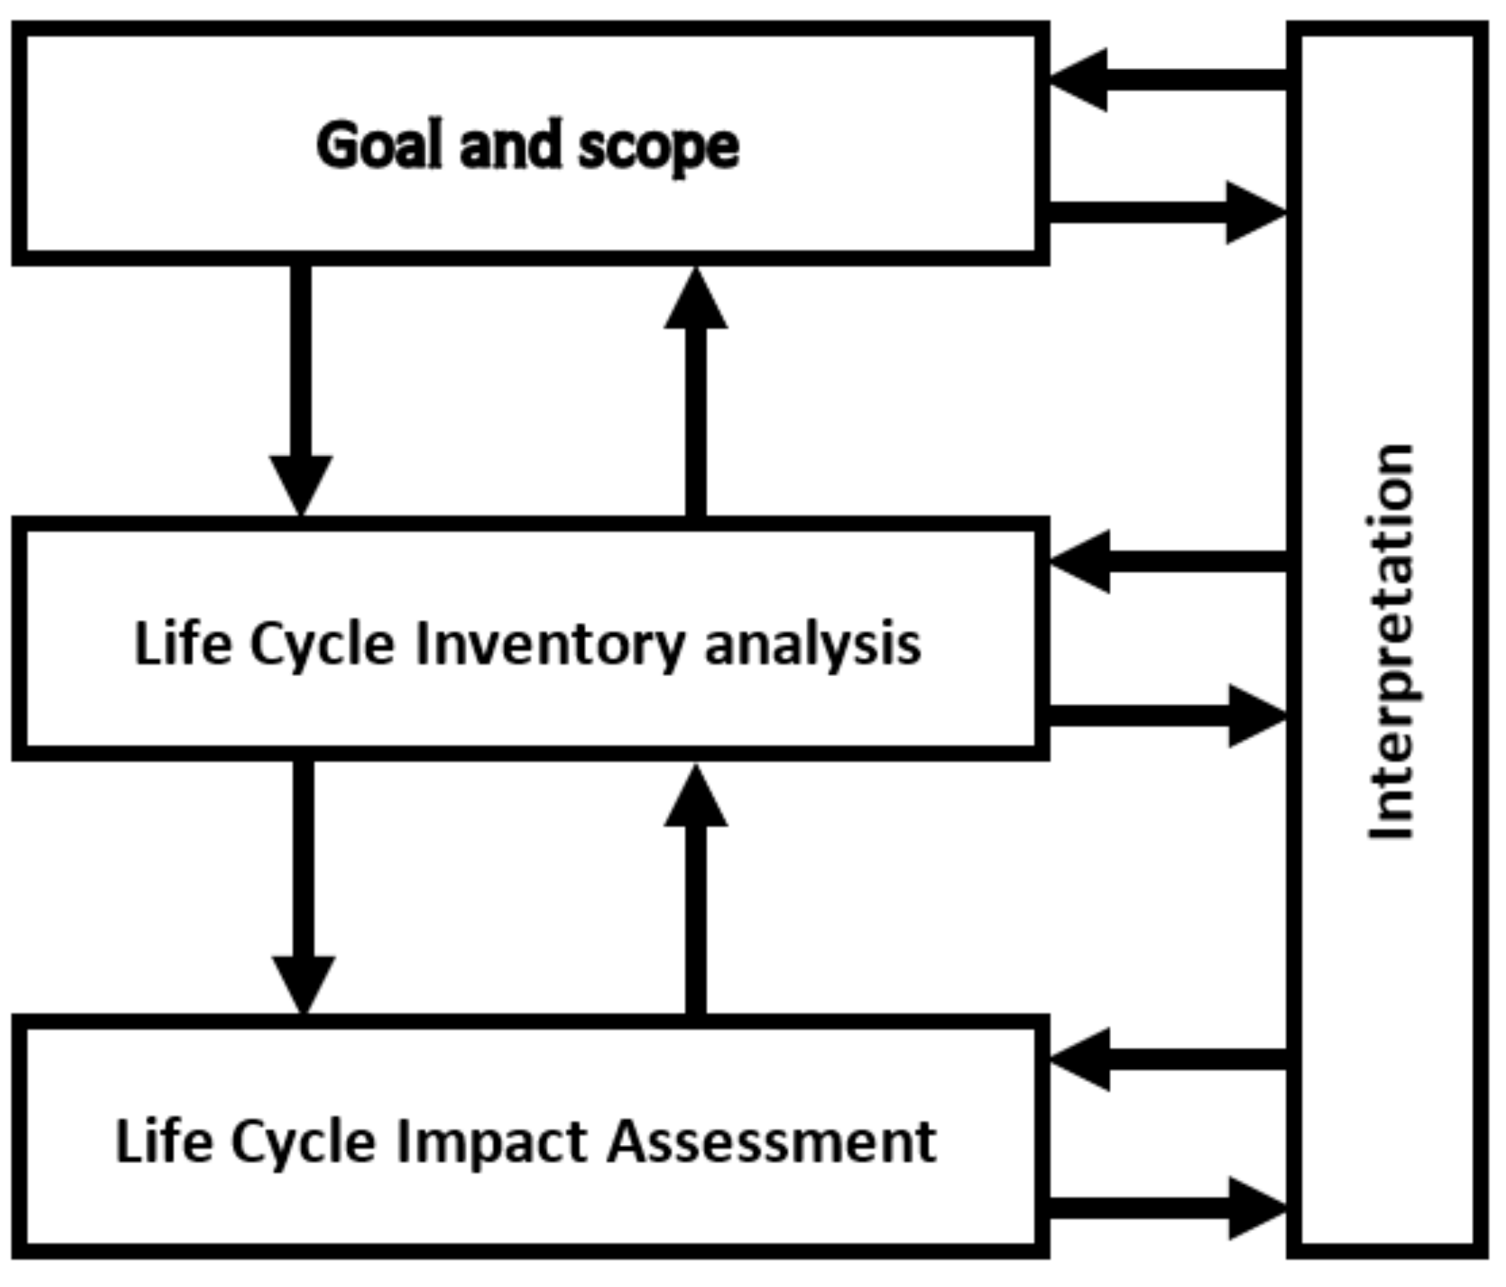
As revealed in ISO 14040 and 14044 [16], LCA has a standardized methodology that researchers and practitioners universally apply. The ISO 14040 series defines a generic LCA methodology that is characterized by a full and resilient framework that includes every component of the product life cycle, including the system upstream and downstream. Figure 1 depicts the four stages of the framework: goal and scope, life cycle inventory (LCI phase), life cycle impact assessment (LCIA), and life cycle interpretation.

Figure 1.
LCA Framework ISO 14040 [16].
2.2. Thermodynamics Modelling of Vapor Compression System
The actual cycle of a vapor compression system consists of major components, including the condenser, compressor, throttle/expansion valve, coupling pipes, and the evaporator. The irreversibility associated with the system is the principal factor that differentiates it from the ideal vapor–compression refrigeration cycle. However, excluding the compressor, the aforementioned main components are assigned a zero work value to simplify the energy balance. In addition, the gas throttling through the valves is also assumed to be adiabatic, while the compressor, on the other hand, is assumed to do real work (compression). Furthermore, insignificant changes in both potential and kinetic energy are attributed to all the components. Finally, a thermodynamics performance model to estimate the cooling load and energy consumption of the system throughout its daily operation is given in the Equation below.
The mathematical formulation to estimate the cooling load satisfied per hour by the chillers is given by Equation (1);
where,
First Law of Efficiency of Chillers
The first law of efficiency of a vapor–compression chiller unit is frequently referred to as the coefficient of performance (COP), and is as defined in Equation (2):
where,
2.3. LCA Modelling of the Vapor Compression System
This paper applies the LCA methodology, consistent with the ISO 14040 [16] series, to present an ecobalance of the VCS under different working scenarios. The methodology of LCA is applied to examine the environmental impacts arising from a VCS installed with a TES tank in a DC plant.
2.3.1. Goal and Scope Definition
The first stage of the LCA framework is to define the goals and scope. This study aims to determine the environmental impact of the life cycle of a vapor compression system, including the thermal energy storage tank. A cradle to grave LCA method is used to accomplish this. The study’s findings are intended to help policymakers and plant designers make well informed decisions that enhance environmental sustainability. In order to estimate the environmental benefits, the findings of the basic LCA research are compared to the following alternative scenarios:
- With the latest compressor system (Scenario A).
- With other country’s commercial electricity mix (Scenario B).
System Description
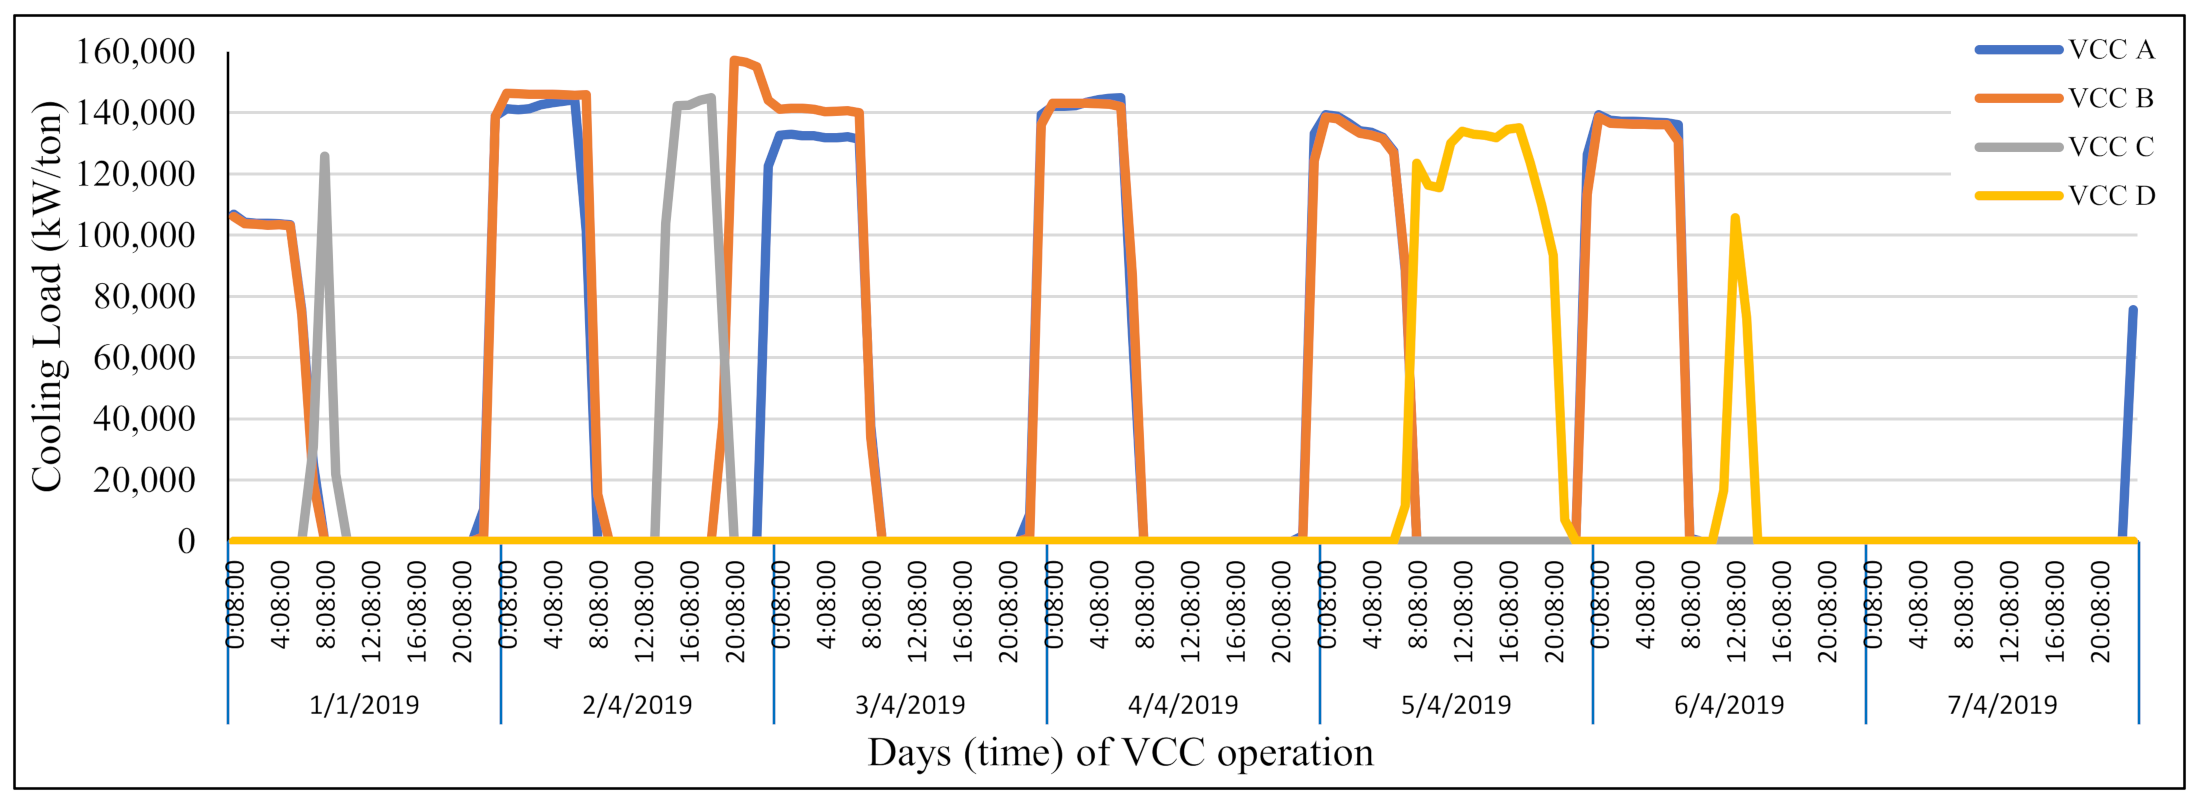
The DC plant consists of four VCC systems with a cooling capacity of 2500 RT, power rating of 8791 kW and COP value of 5.5. The two TES tanks have a combined storage capacity of 50,000 RTh, a diameter of 24.5 m, and a height of 27.8 m. The chiller system is designed to operate at full capacity, which implies that, during off peak hours, the two VCC systems will charge the TES tanks to full capacity (10 p.m. to 8 a.m.). The other two VCC systems serve as backup chillers, supporting the cooling load in a plant failure or scheduled maintenance and high chilled water demand scenarios. Figure 2 shows an example of data from the four VCC systems, over a week [17].
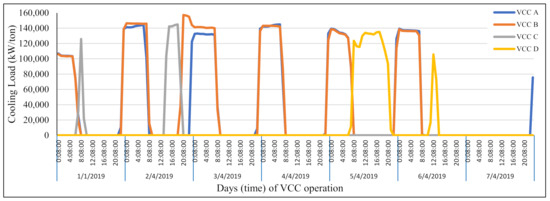
Figure 2.
A week operation of the four VCC systems.
Functional Unit (FU)
The concept of FU may be used to compare these systems against other design choices in order to highlight potential and substantial benefits. The FU chosen in this study are the VCC systems used to charge the TES tank in a DC plant. This represents 1 RTh of chilled water produced for air-conditioning purposes. The base study result allows for comparison with other plant design scenarios.
System Boundaries and Limitations
The upstream and downstream of the VCS life cycle are covered by the system boundaries considered in this study. The chiller plants and the TES tanks are estimated to have a 25-year use life. In this study, the rule for setting the system boundary consists of three decision criteria for each candidate component: unit process, mass, and energy contributions to the entire plant. In detail, a selected unit process must have a significant contribution, for example, higher than 5% of the entire product, to at least one decision criterion. Once the main unit processes are selected, the major materials involved in each unit process are chosen based on the “cut-off” result. The EcoInvent database and literature are primarily used to gather information for the upstream and downstream life cycle impact assessments. On a global scale, system boundaries are established at the RoW (rest of the world) level. The system model “Cut-Off” was chosen for all EcoInvent data. Generic datasets of firms from EcoInvent are utilized for particular procedures. The EcoInvent database categorized the datasets as “global average” [18].
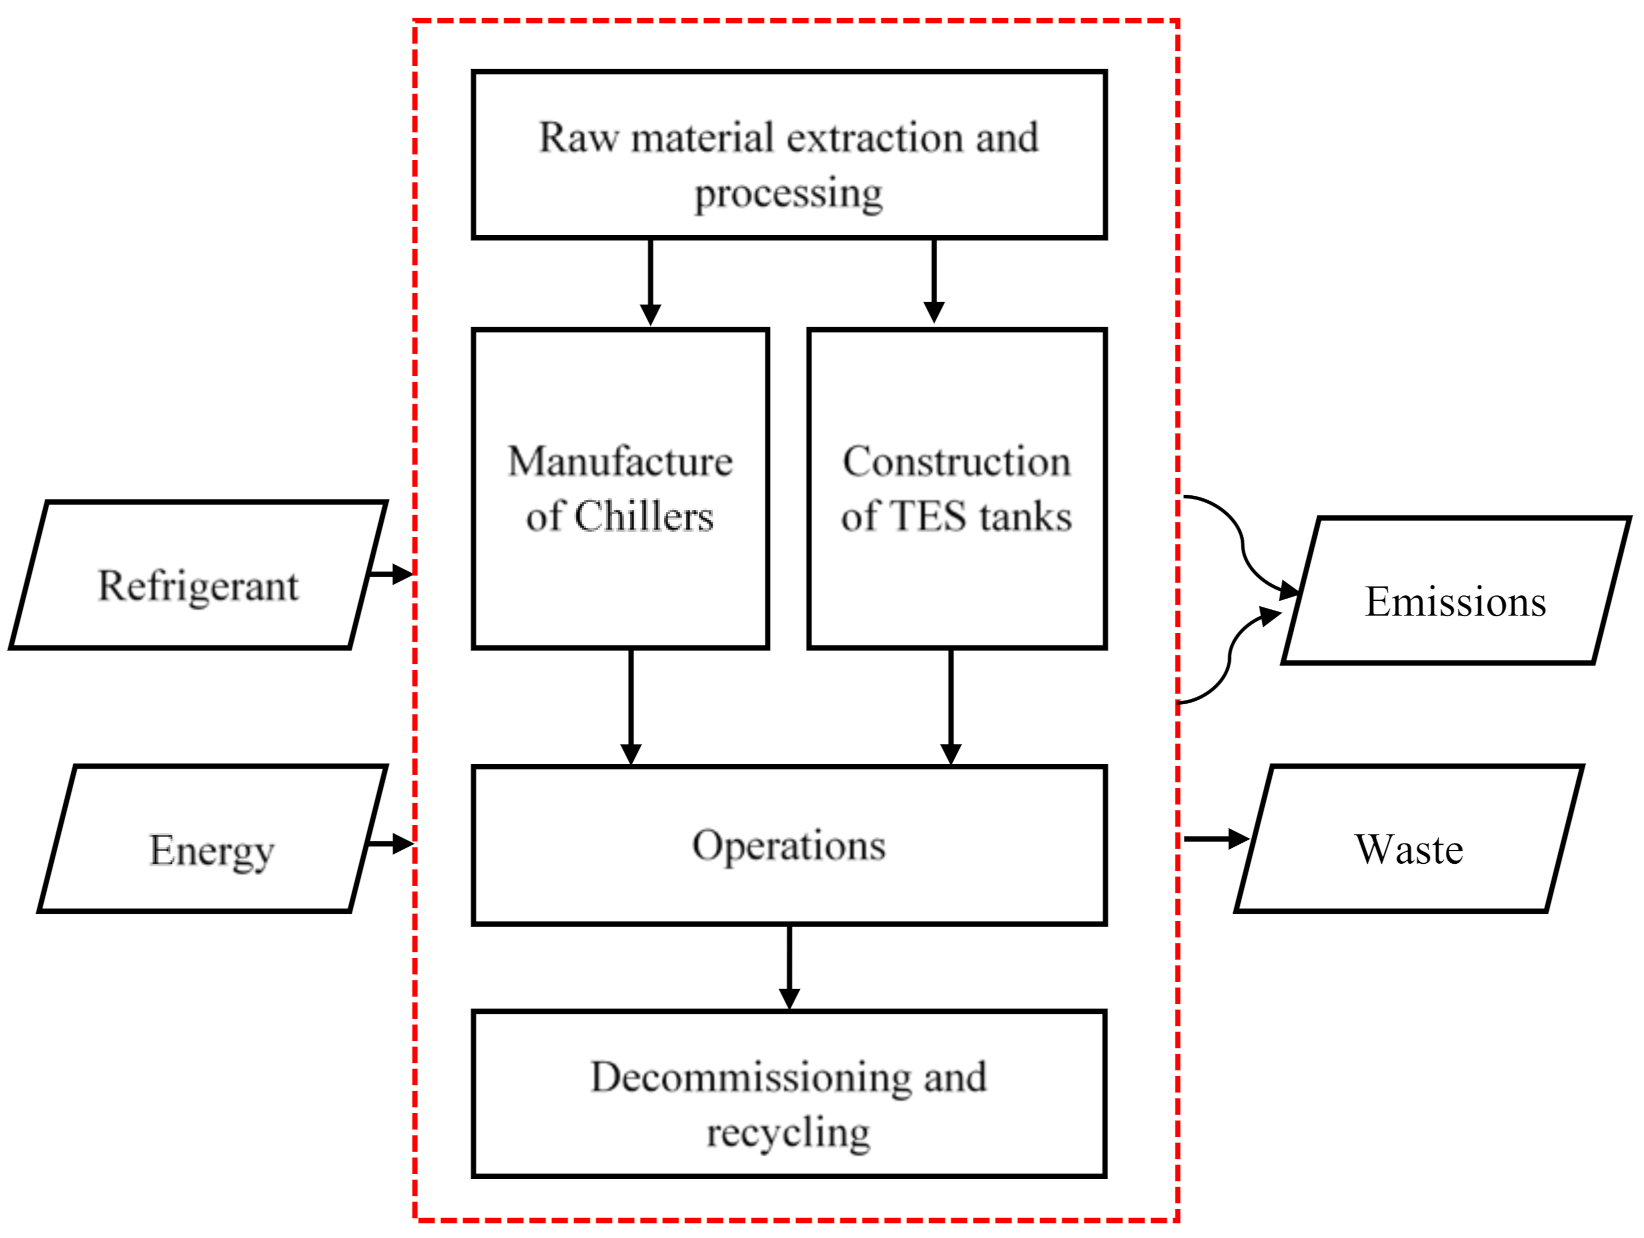
Figure 3 shows the system boundary of the VCS under investigation. Steel, copper, aluminum, and other minor metals and polymers are utilized as raw materials in the electronics and control panels of a traditional water cooled chiller. Shot blasting, which involves blasting a surface with small steel beads, improves the surface profile after the steel sheets are brought to the facility and cut into forms [19]. The steel sheets are then rolled into cylindrical shapes. Finally, the evaporator and condenser cylinder seams must be welded [19]. For the endplates of the chiller cylinders, steel sheets are also cut to shape. Along with the cut steel sheet, holes are drilled in specified locations on the endplates so that the steel chassis of the chiller may be drilled together to retain its shape. The chiller system is then welded together to prevent air leakage. [18]. Copper tubing is then attached to the evaporator and condensers. The outer cylindrical chassis is next checked for leaks by pouring water through it and verifying no excessive water leakage [18]. The condenser and evaporator must then be connected.
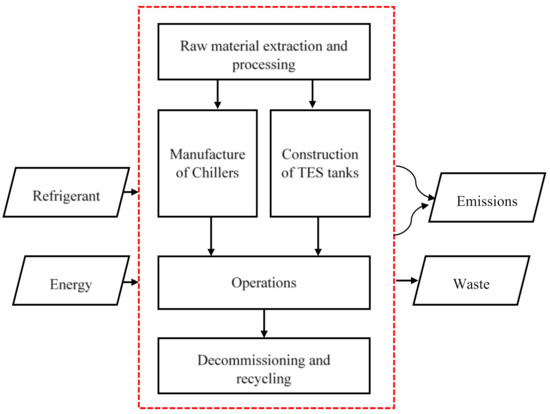
Figure 3.
System boundary of the LCA study.
In the evaporator, copper tubes are enclosed by a shell. Water is utilized to eliminate any unwanted flow within the copper tubes, as the refrigerant is on the outside. To protect the seal within the shell from leaking out, it is welded and drilled together. The condenser is welded and drilled together with a steel shell and copper tubing to ensure that the seal inside the shell does not leak [18]. Impellers, rods, rings, and cylinder walls are interworking components of the compressor. Lubricating oil is applied to the interworking components of an oiled bearing compressor, to guarantee the good operation of the moving elements. The condenser and evaporator shell stacks are then fitted with the chiller’s compressor [18].
Supply and return pipe networks are used to connect the chiller plant and the TES tanks. The stacked TES tanks are made of a variety of materials. These materials have desired thermophysical properties, such as high latent heat, high specific heat, high thermal conductivity, and so on. The stratified water TES tanks are made of carbon steel, stainless steel, concrete, and other water tight materials [20].
The power sizing technique suggested by Sullivan et al. [21] is used to estimate the material size used in this study compared with other plant capacities found in the literature, database, and manufacturer’s log list. The power sizing technique is given by Equation (3).
where X indicates the material to capacity ratio, which is 1, in the instance of a linear relationship.
The installation and transportation stages of the life cycle are not addressed in this system boundary because of a lack of quantitative data. Figure 3 depicts the life cycle phases from cradle to grave, including raw material acquisition, manufacturing, operation, and recycling. Auxiliary equipment, such as fans, pumps, and pipes, were not included in this study’s scope due to a lack of credible data. Both the inventory study and the environmental assessment were performed using the modelling software Umberto LCA+. The different stages of the VCS’s life cycle processes are linked to all the data sources used.
2.3.2. Life Cycle Inventory
Raw Material Phase
The environmental impact from this phase comes from the mining and processing of raw materials and the energy requirements to produce the VCS components. Samples of the raw materials used are outlined in Table 1 and Table 2, for the chiller and TES systems, respectively. There are different varieties of material required for both chiller designs and TES systems. The EcoInvent database installed alongside the Umberto LCA+ software serves as the source of the materials presented [22].

Table 1.
Input raw material flow of the vapor compression chiller [11,13,20,22].
Table 2.
Input raw material flow of TES tanks [11,13,20,22].
Manufacturing and Construction Phase
The main environmental impact in this phase comes from the unit parts, energy, and consumables requirements for the processing and assembly of the various components of the entire VCS, including the chillers and the TES tanks. As a result of limited credible data, some units, such as insulation glue, acetylene, cleaning agents, etc., involved in this phase were ignored. However, these units are in small quantity, and their impacts are generally considered negligible. The research data for the analysis in this phase are obtained from the literature and the EcoInvent database [22]. Details of the inventory data of the manufacturing and assembly phase are presented in Table 3. The electricity utilized in the manufacturing phase is described as a “market group for electricity, medium voltage [CN].” This EcoInvent dataset describes the electricity available on a medium voltage level in China, where the VCC is assumed to be manufactured and assembled.
Table 3.
Input raw material flow for the manufacturing phase [11,13,20,22].
Operation Phase
Unit power consumption and refrigerant emission are among the energy and material fluxes evaluated in the use phase. Plant technicians, technical datasheets for unit components, and literature were used to gather plant operating and design data. The data consisted of minute sensor readings from the four VCC systems over a year (January–December 2019). The COP value remained stable at 5.5 due to the region’s consistent ambient temperature and the VCC systems’ constant speed compressors. Since the base study is in Malaysia, the environmental profile for the electricity used to drive these VCC systems is the Malaysia power generating mix (Tenaga Nasional Berhad) [23]. According to Malaysia’s energy statistics handbook, the current fuel mix used to generate electricity in Malaysia is 43.4 percent coal, 39 percent gas, 15.6 percent hydro, and 1.92 percent other sources [24]. Furthermore, meteorological data from the Malaysian Meteorological Department [25,26] is used to compare the monthly chilled water demand trend with the average monthly temperature.
The chiller system has a 25-year lifetime. The data acquired in raw format from the plant technicians was prepared, managed, and analyzed using Excel spreadsheet software. Table 4 shows the inventory data for the input material flow of the operating phase in detail.
Table 4.
Details of the estimated electricity consumption throughout the operation phase.
Equation (4) is a mathematical formula for estimating the amount of electrical ower (EP) consumed each hour by the chillers. For this case study, the electric power (Win) utilized to power these systems is obtained directly from Malaysia’s grid energy supply.
where,
Win = electrical power demand (kWh),
m = number of chillers,
n = number of minutes,
j = number of considered working chillers,
Converting RT to kW: 1 refrigeration ton equals 3.5168525 kilowatts.
Decommissioning, Waste, and Recycling Phase
Considering the material component of the chiller and TES systems, an almost full recovery is assumed to be achieved for this study in the recycle phase. The systems are composed mainly of copper, steel, aluminium, iron, granite, etc., which are recovered and reused as scraps. Data for the environmental impact of the recycling process is sourced from the EcoInvent database, as provided in the Umberto LCA+ software. This phase also takes into account the list of all considered input materials and the waste refrigerant. The refrigerants are generally destroyed and rarely reused. Details of the recycling phase in terms of the input and output flows for both the chiller and cooling tower units are presented in Table 5.
Table 5.
Output material flow for the recycling/waste phase [11,13,22].
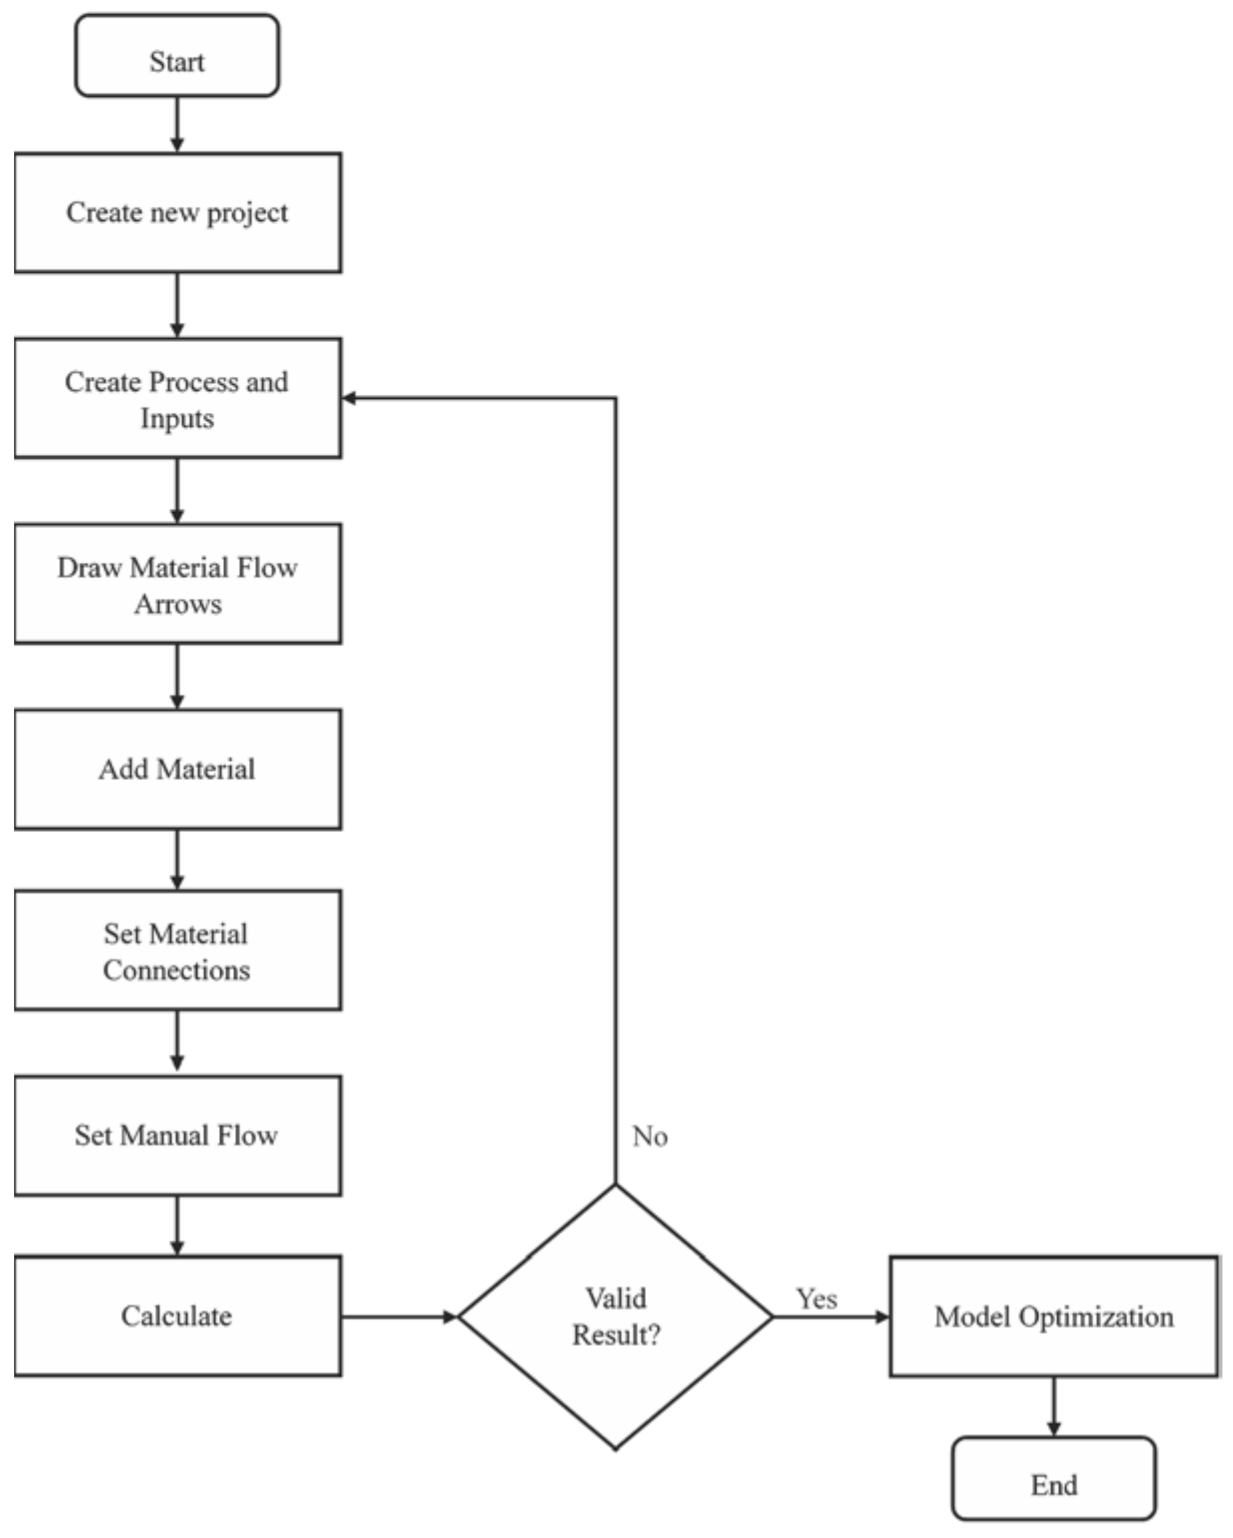
In fulfilling the objectives of this study, an LCA model was developed in the Umberto LCA+ software. The flowchart for the modelling process is outlined in Figure 4. The complete system modelling in Umberto LCA+ software is shown in Figure 5.

Figure 4.
LCA modelling flowchart in Umberto LCA+ software.
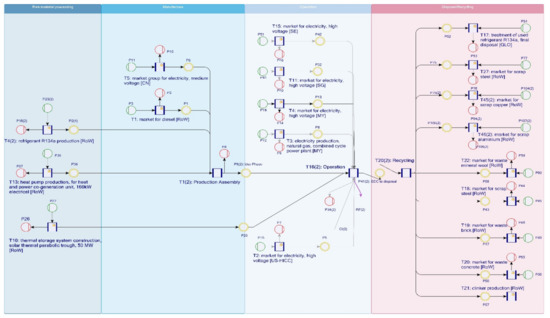
Figure 5.
The complete system modelling in Umberto LCA+ software.
2.3.3. Life Cycle Impact Assessment
The impact category indicator is calculated by multiplying the LCI result by the characterization factor. The cumulative energy demand technique [22] is used to calculate the consumption of renewable (biomass, wind, solar, geothermal, and water) and nonrenewable (fossil and nuclear) energy sources in primary energy calculations. The environmental characterization variables are computed using the Umberto LCA+ programme with the ReCiPe Midpoint impact assessment technique [27,28]. Equation (5) presents the LCIA mathematical model [29].
where,
ELn = normalized environmental impact indicator of category “n” (e.g., global warming, water depletion, etc.);
Ex = amount of an environmental aspect “x” accumulated from inventory (material consumption, emission to air, water, etc.);
CFx,n = characterization factor of an environmental aspect “x” for category “n” of the LCIA method chosen;
Nn = normalization value of impact category “n” of the LCIA method chosen.
The impact categories listed in Table 6 were utilized to calculate the FU’s environmental performance over the system life cycle stages. The table also includes a description of how each category impacts the environment. However, it should be noted that these are potential environmental impacts, not actual impacts, as the LCIA methodology uses the midpoint approach for its estimation.
Table 6.
Selected impact categories.
2.4. Defining Alternative Scenarios
To achieve a reduced environmental impact benefit of the VCS, especially in the operation phase, some adjustments must be made. In this study, the environmental performance of the base system is compared to other scenarios to point out the potential improvement that can be effected to achieve a more efficient and sustainable system. These alternative scenarios are classified below,
- Scenario A: This scenario incorporates modern oil free magnetic bearing centrifugal compressors into the electric chiller system.
- Scenario B: This scenario incorporates alternative fuel mix technologies to commercial electricity generation.
These scenarios are explained in further detail below;
- Scenario A: Oilless, magnetic bearing compressor technology removes the need for complicated oil lubrication management systems, resulting in a chiller design that is more reliable and requires less maintenance. Magnetic bearings, combined with an integrated variable speed drive, provide industry leading efficiency with little or no performance degradation during the compressor’s lifetime. The permanent magnet synchronous motor is small and efficient. The two stage compression design can benefit both water and air cooled chiller systems. There is no requirement for oil in the system because of the magnetic bearing compressor. The effectiveness of heat exchange surfaces is also improved by removing oil. However, the presence of oil in the chiller may impair performance considerably. Oil recovery systems, which are common in older refrigeration systems, can be removed as well. In the compressor, a permanent magnet motor is utilized instead of an induction motor. In comparison, older induction motors have a 92 percent efficiency while modern induction motors have a 95 percent efficiency. The Turbocor COP in water cooled applications has been recorded at over 5.6 at full load, equal to 0.62 kilowatts per tonne (kW/ton), and 9.4 (0.375 kW/ton) at part load [30,31].
The oil free compressors exhibit little to no performance deterioration during their useful life. This, along with the contact free system operation offered by magnetic bearings, ensures that the compressor’s performance stays stable over time. Chillers with oil free compressor technology feature fewer mechanical parts and a simpler system design because the oil management system is omitted. Consequently, the chiller will require less maintenance and will be more reliable during its lifetime. The total energy consumed by the magnetic VCC system during its lifespan is predicted to be 3,576,420,329 kWh, while the total energy used by the oil VCC system is 17,412,439,194 kWh.
- 2.
- Scenario B: The fuel mix technologies that contribute to commercial electricity generation as an “external input” have a major influence on the plant’s overall environmental profile and the optimum energy consumption/environmental trade offs throughout plant operation and other subsequent life cycle phases. As a result, it is essential to look at how the recommended technique helps to emphasize how these trade offs change depending on the scenario. Since the chiller system is powered by electricity, different country scenarios are examined to discover how sensitive the electricity mix is. Singapore and Sweden were two of the nations that were compared to the baseline situation.
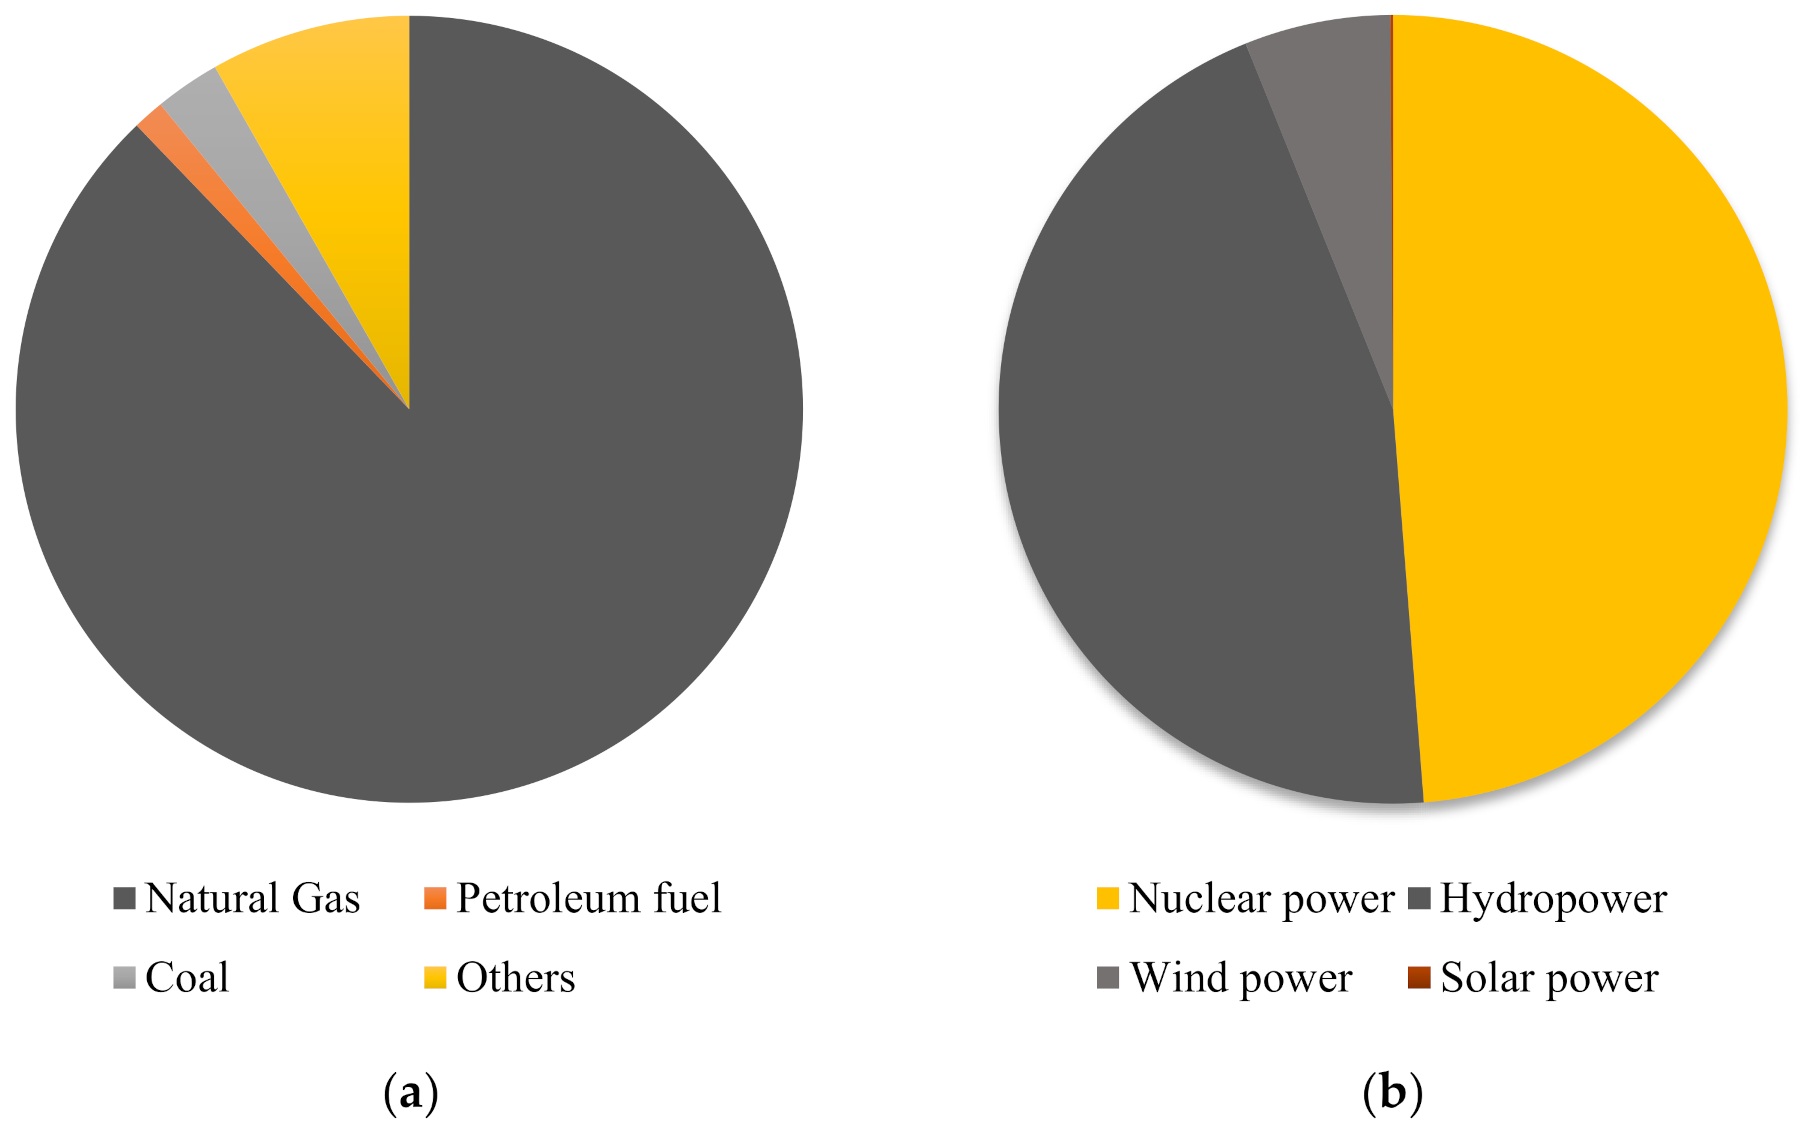
Of the ten member countries that constitute the Association of Southeast Asian Nations (ASEAN), Singapore ranks as the country with the most sustainable commercial grid electricity mix, having a fuel composition of 88.7% natural gas, 1.3% petroleum fuel, 2.7% Coal, and 8.3% of others [32], as shown in Figure 6a. On a global scale, Sweden is among the few countries with over 90% of its electricity grid energy sourced from nuclear or renewables. Nuclear power and hydropower provided 43.2% and 40% of all electricity in 2018, respectively, while wind power (11.3%), thermal power (5.3%), solar power (0.1%), and unidentified sources (0.2%) produce the rest [33], as shown in Figure 6b. The EcoInvent database was used to gather data for the comparative study of these design options.
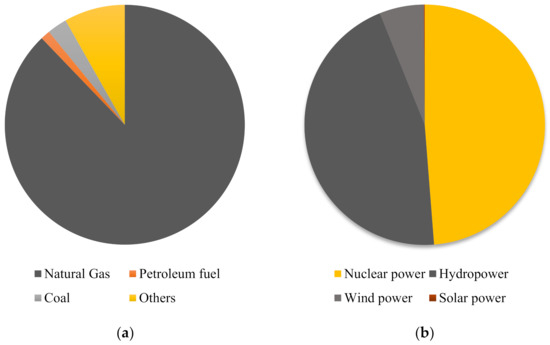
Figure 6.
Percentage contribution of the countries’ electricity fuel mixes: (a) Singapore mix; (b) Sweden mix.
3. Results and Discussion
In fulfilling the objectives of this project, the results of the environmental sustainability assessments of the VCS are presented and discussed. This includes identifying the most environmental pathway in terms of the influence of the material flow, electricity mix, and system configuration.
3.1. Life Cycle Inventory Result
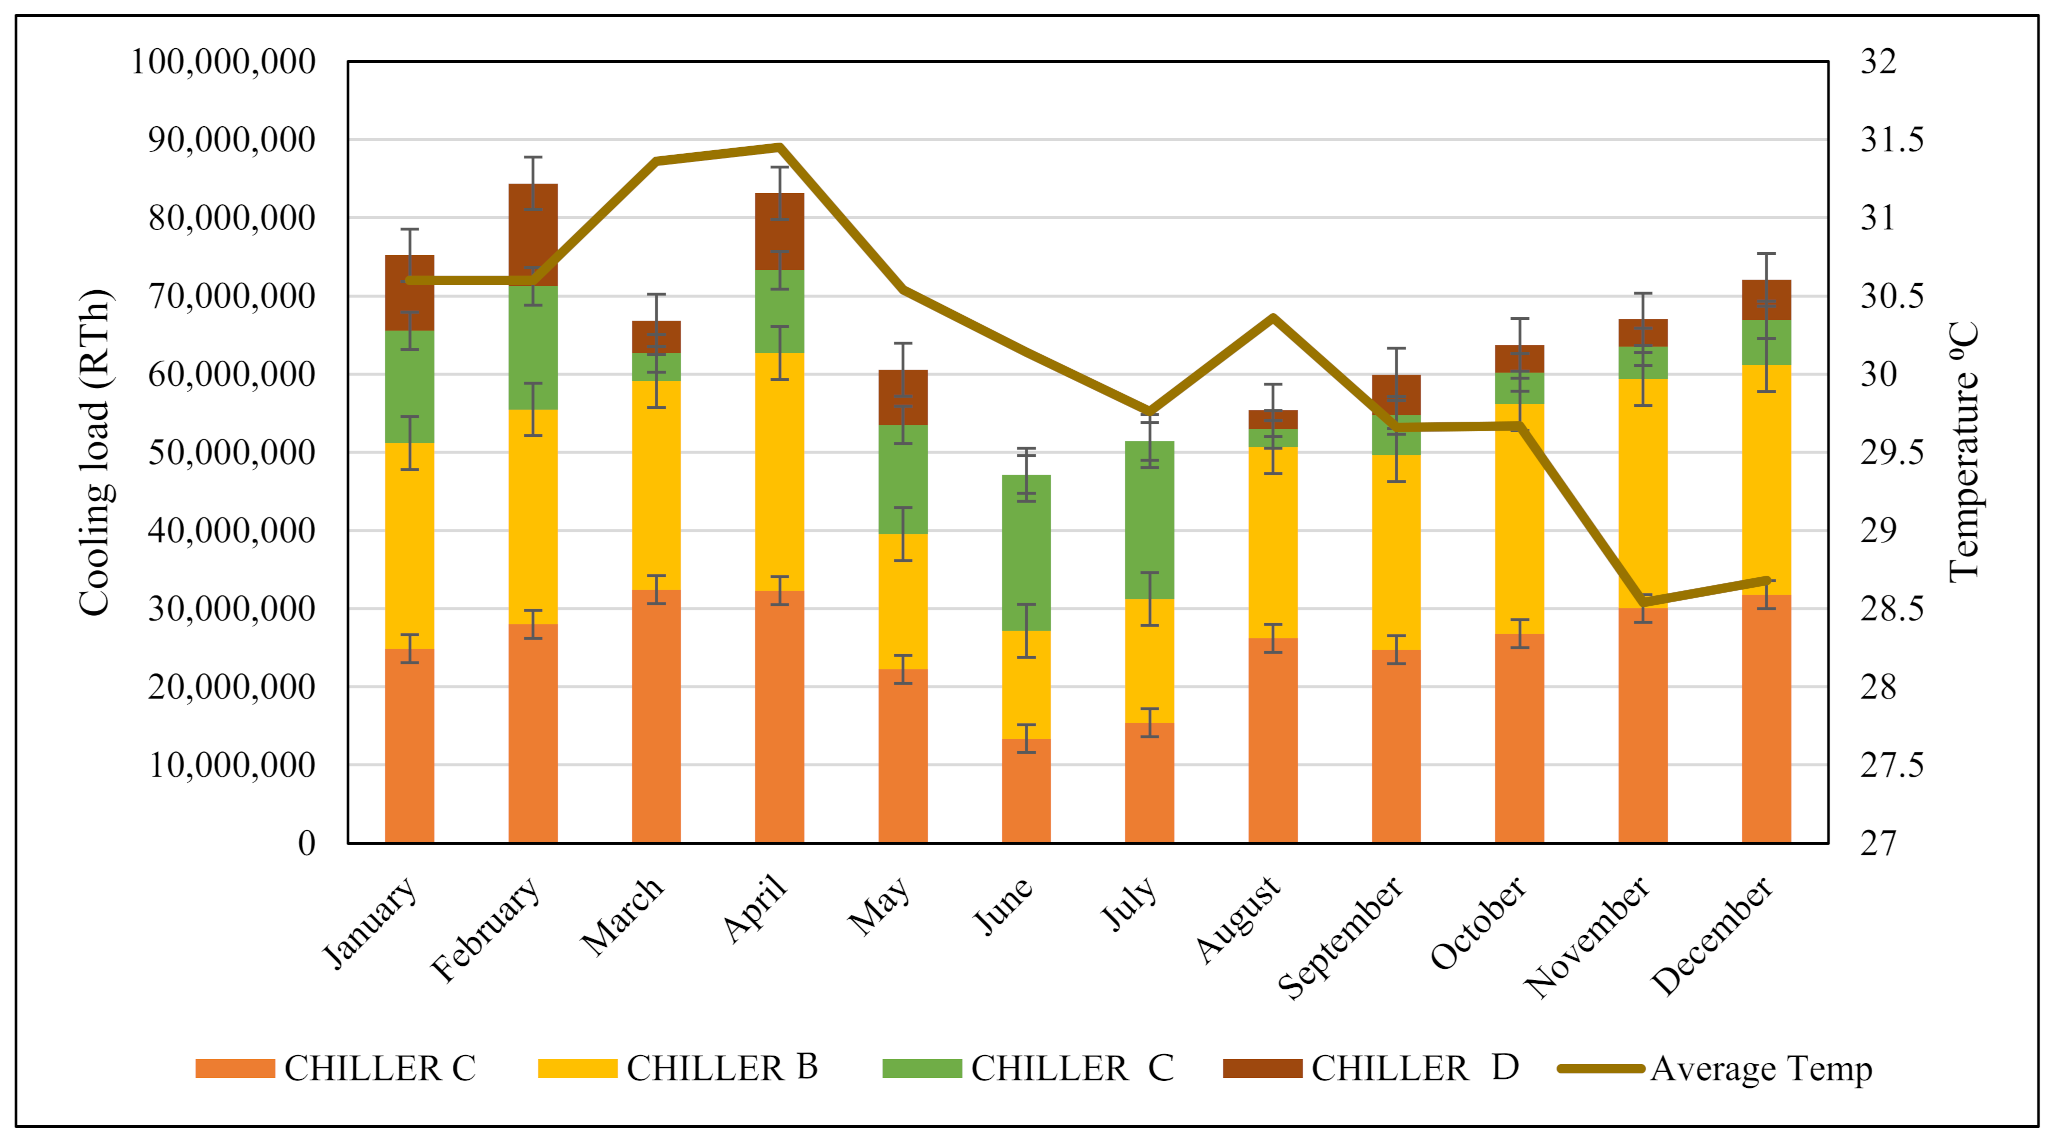
Figure 7 shows the monthly contribution of each VCC to the generation of chilled water for the DC networks. According to the analysis, the months with the largest and lowest cooling demands are April and June. The impact of climatic weather conditions on refrigeration demands is demonstrated by the average monthly temperature trend on the figure. This demonstrates that, as the globe continues to warm, the need for air conditioning will continue to rise. However, this analogy is inconsistent throughout the year, as November and December experienced the lowest temperature recorded higher cooling load. This phenomenon can best be explained as a result of the end of year festivities which causes increased human activities observed during these times in Malaysia.
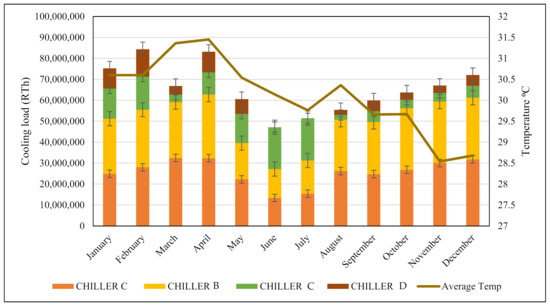
Figure 7.
Average climate temperature, monthly cooling load, and VCC cooling contribution.
The results presented in Figure 7 indicate that VCC A and B consumed more electricity than VCC C and D, in their overall operation. The total estimate of energy used by the VCS system is estimated to be 17,412,439,194 kWh. Figure 7 shows the percentage contribution of specific VCC systems to meeting monthly and annual cooling demands, respectively. From the analysis as presented in the graph, VCC A and B fulfilled about 79 percent of the annual cooling load, while VCC C and D handled the remaining 21 percent throughout the systems annual use.
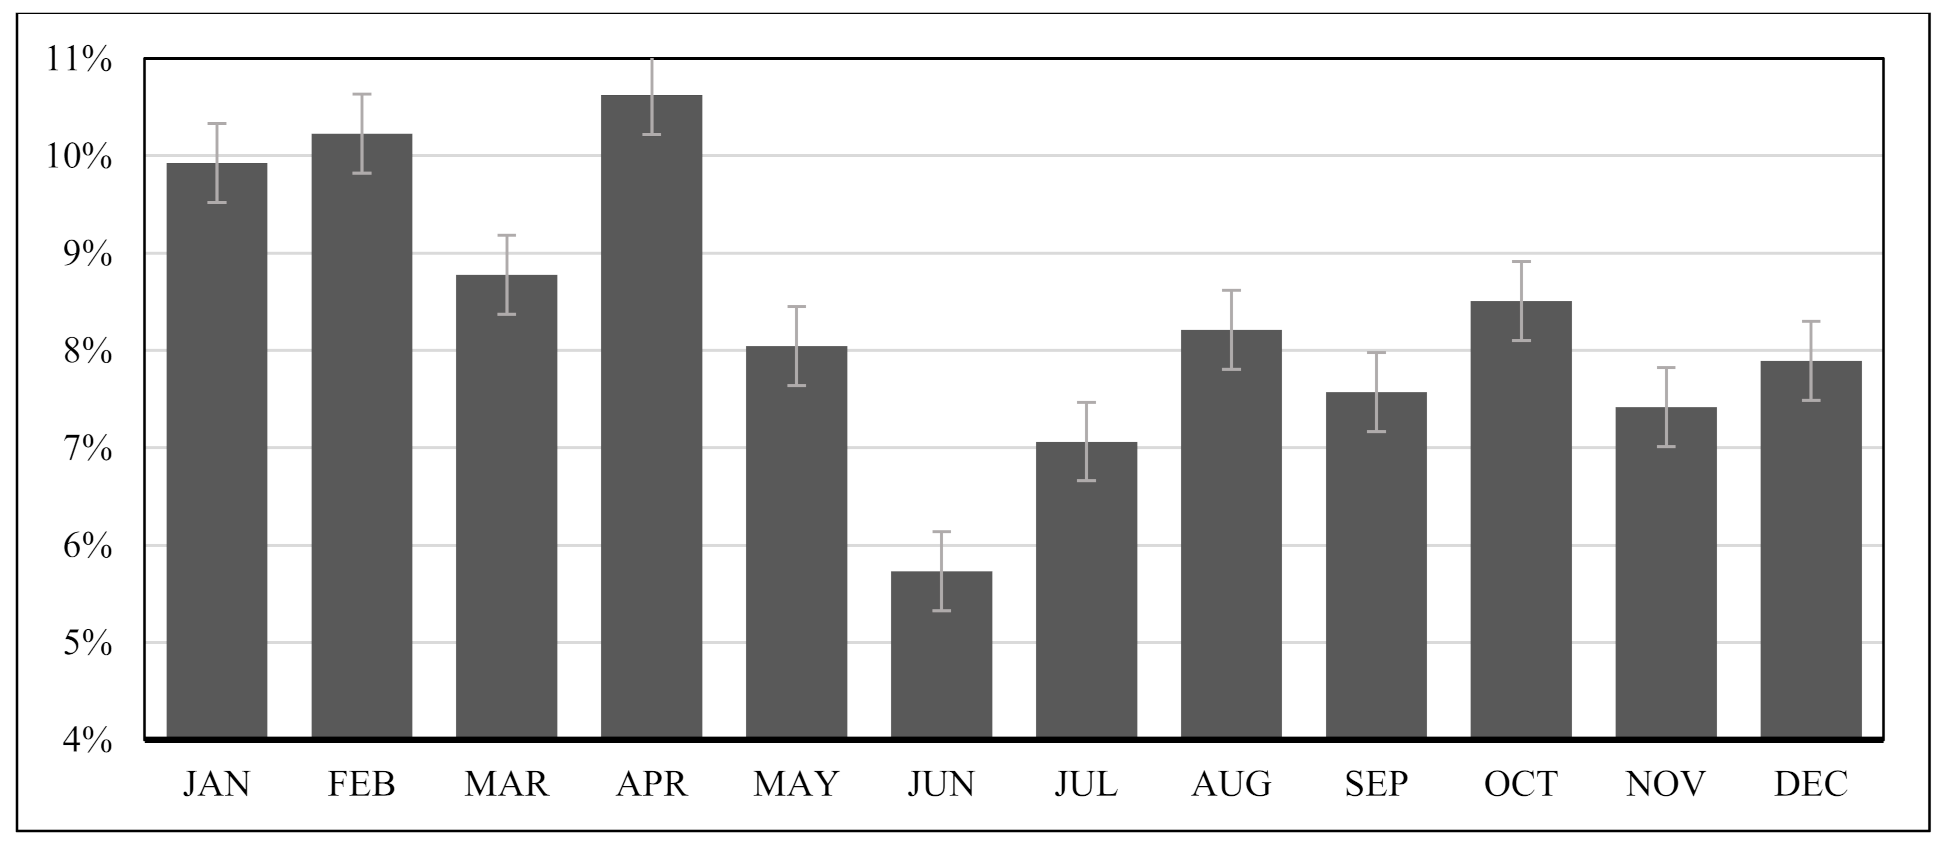
Figure 8 shows the VCC systems’ estimated monthly EP consumption in producing chilled water for the DC networks. April and June, as expected, consumed the most and least electrical energy during the research year, in proportion to their consumption rate over time.

Figure 8.
Result of electrical power consumption by the VCC systems throughout the year.
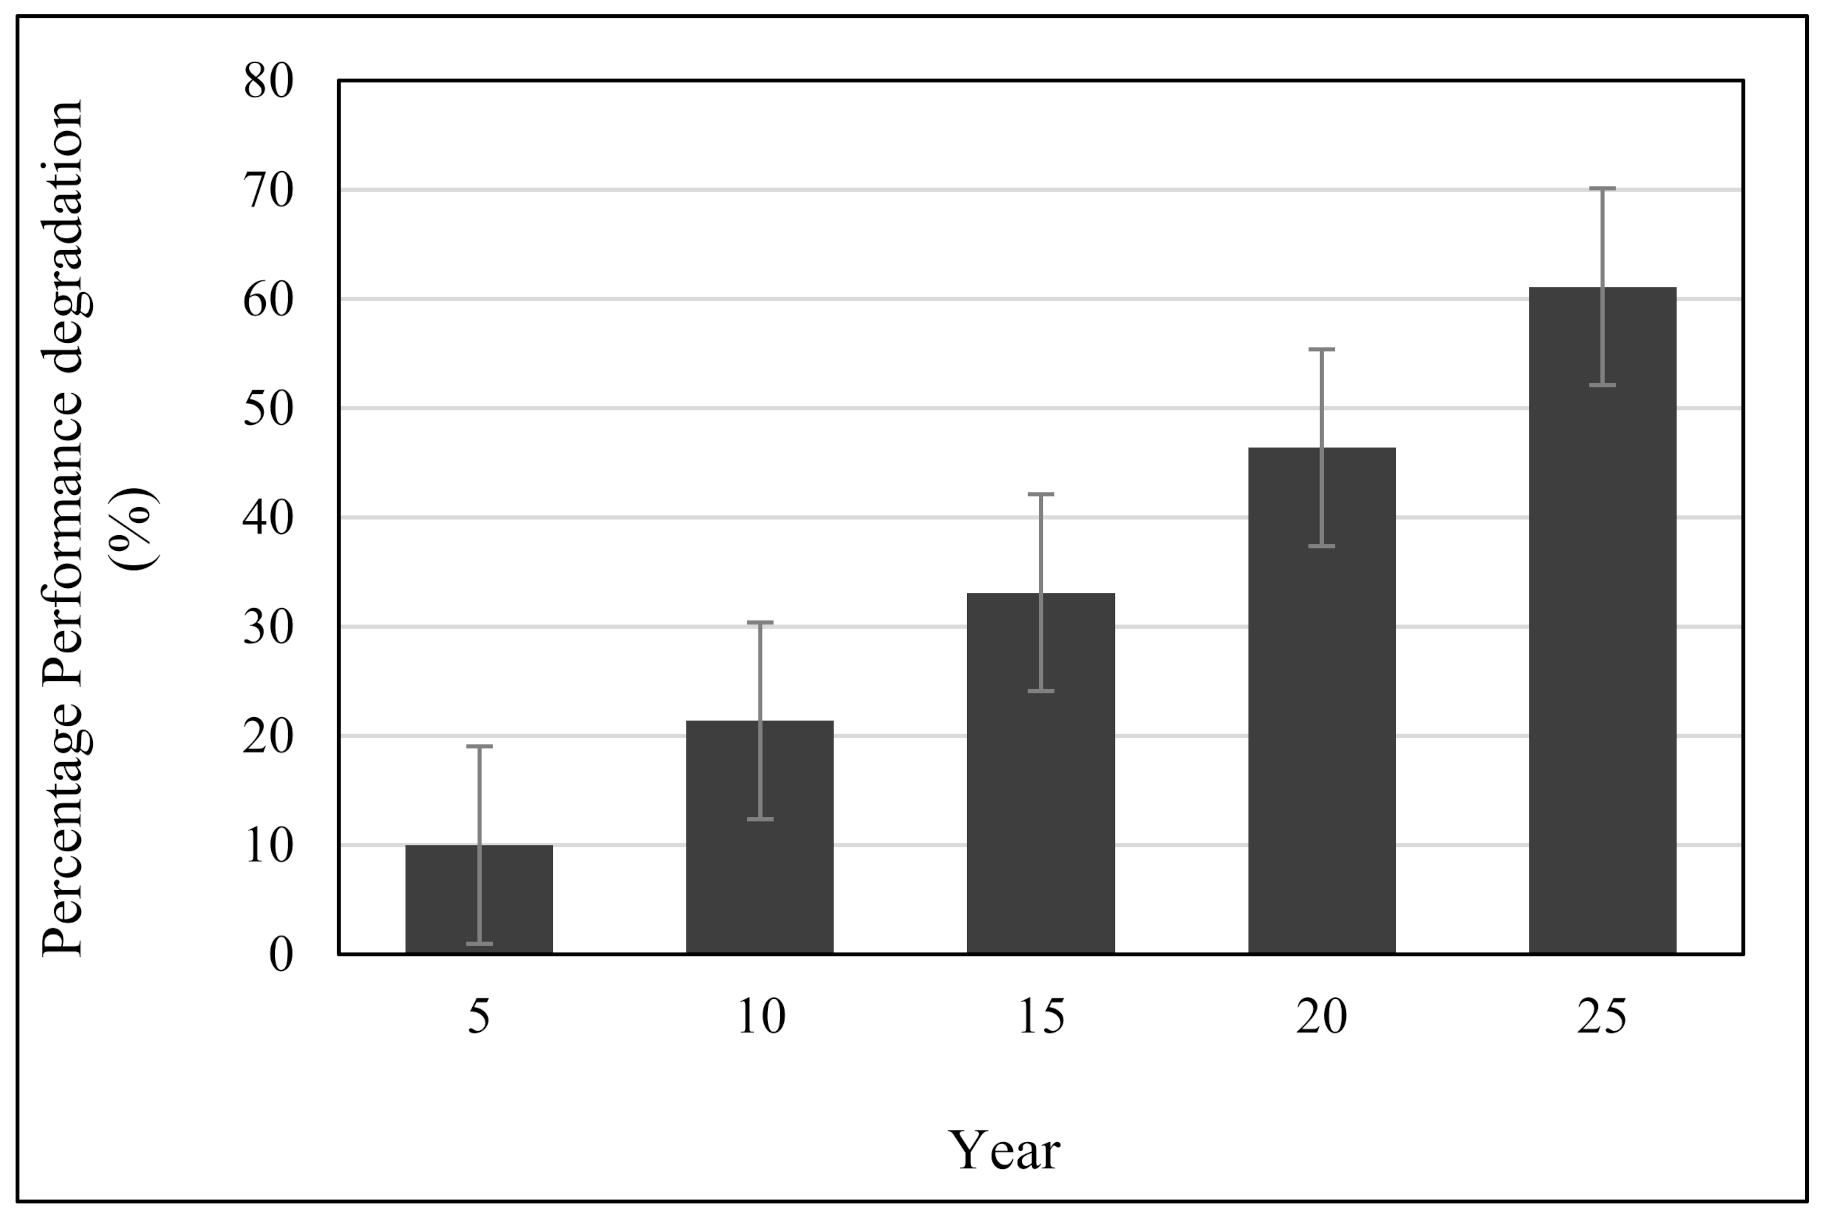
Due to the performance degradation experienced by the four installed VCC systems over time, the COP of the oiled centrifugal chiller tends to reduce with time. According to the study of Ref. [34], conventional oiled compressors, such as in VCC systems, are prone to significant performance degradation resulting from excessive bearing wear, oil impurities, rotor tip contact, poor system maintenance, and other factors. Refs [30,35] suggested a 10% loss in efficiency of the VCS system after every five years. This assumption was applied to the case study to determine the performance degradation to energy consumption over a lifetime period of 25 years. The result of this analysis is presented in Figure 9.

Figure 9.
Percentage performance degradation of the VCC system throughout its lifetime.
As shown in Figure 9, after an operation period of 10 years, the percentage increase in performance degradation would amount to about 21.4%. However, this percentage would increase progressively from 33.1% through 46.4% to 61.1% after an operation of 15, 20, and 25 years, respectively. By implication, the subsequent performance degradation is observed to increase progressively, to 11.4%, 11.7%, 13.3%, and 14.7% after 10, 15, 20, and 25 years, respectively. This also implies that, after a period of 25 years of usage, the performance efficiency of the system would have decreased to about 40% of the initial efficiency value. However, such degradation is minimal in magnetic nonoiled centrifugal chillers, and the efficiency is almost constant throughout their lifetime usage [13].
3.2. Result of the Life Cycle Impact Assessment
In understanding the dynamic trend of the life cycle environmental impact of the VCS, the result of the carbon footprint per functional unit of 1 Ton of refrigeration is given as 0.72 kg CO2 eq/RTh. The result of the contribution of each process to the overall carbon footprint of the LCA analysis is presented in Table 7. From the result, about 98% of the overall carbon footprint per FU is caused by the indirect emission from commercial electricity usage to drive the VCS during its 25 years of operation.
Table 7.
Contribution of the processes to the overall carbon footprint per functional unit.
In Table 8, the proportion of the indirect GHG emissions to the overall environmental footprint is presented. From the result, about 90% of the recorded GHG emission is occupied by carbon dioxide gases. This is mainly due to the high proportion of fossil fuels (nonrenewable energy) present in the country’s (Malaysia) commercial electricity mix. This is closely followed by methane gas (recording about 3%), primarily due to fossil and nonfossil fuel usage.
Table 8.
Ratio of the indirect GHG contribution to the overall environmental footprint for the base scenario.
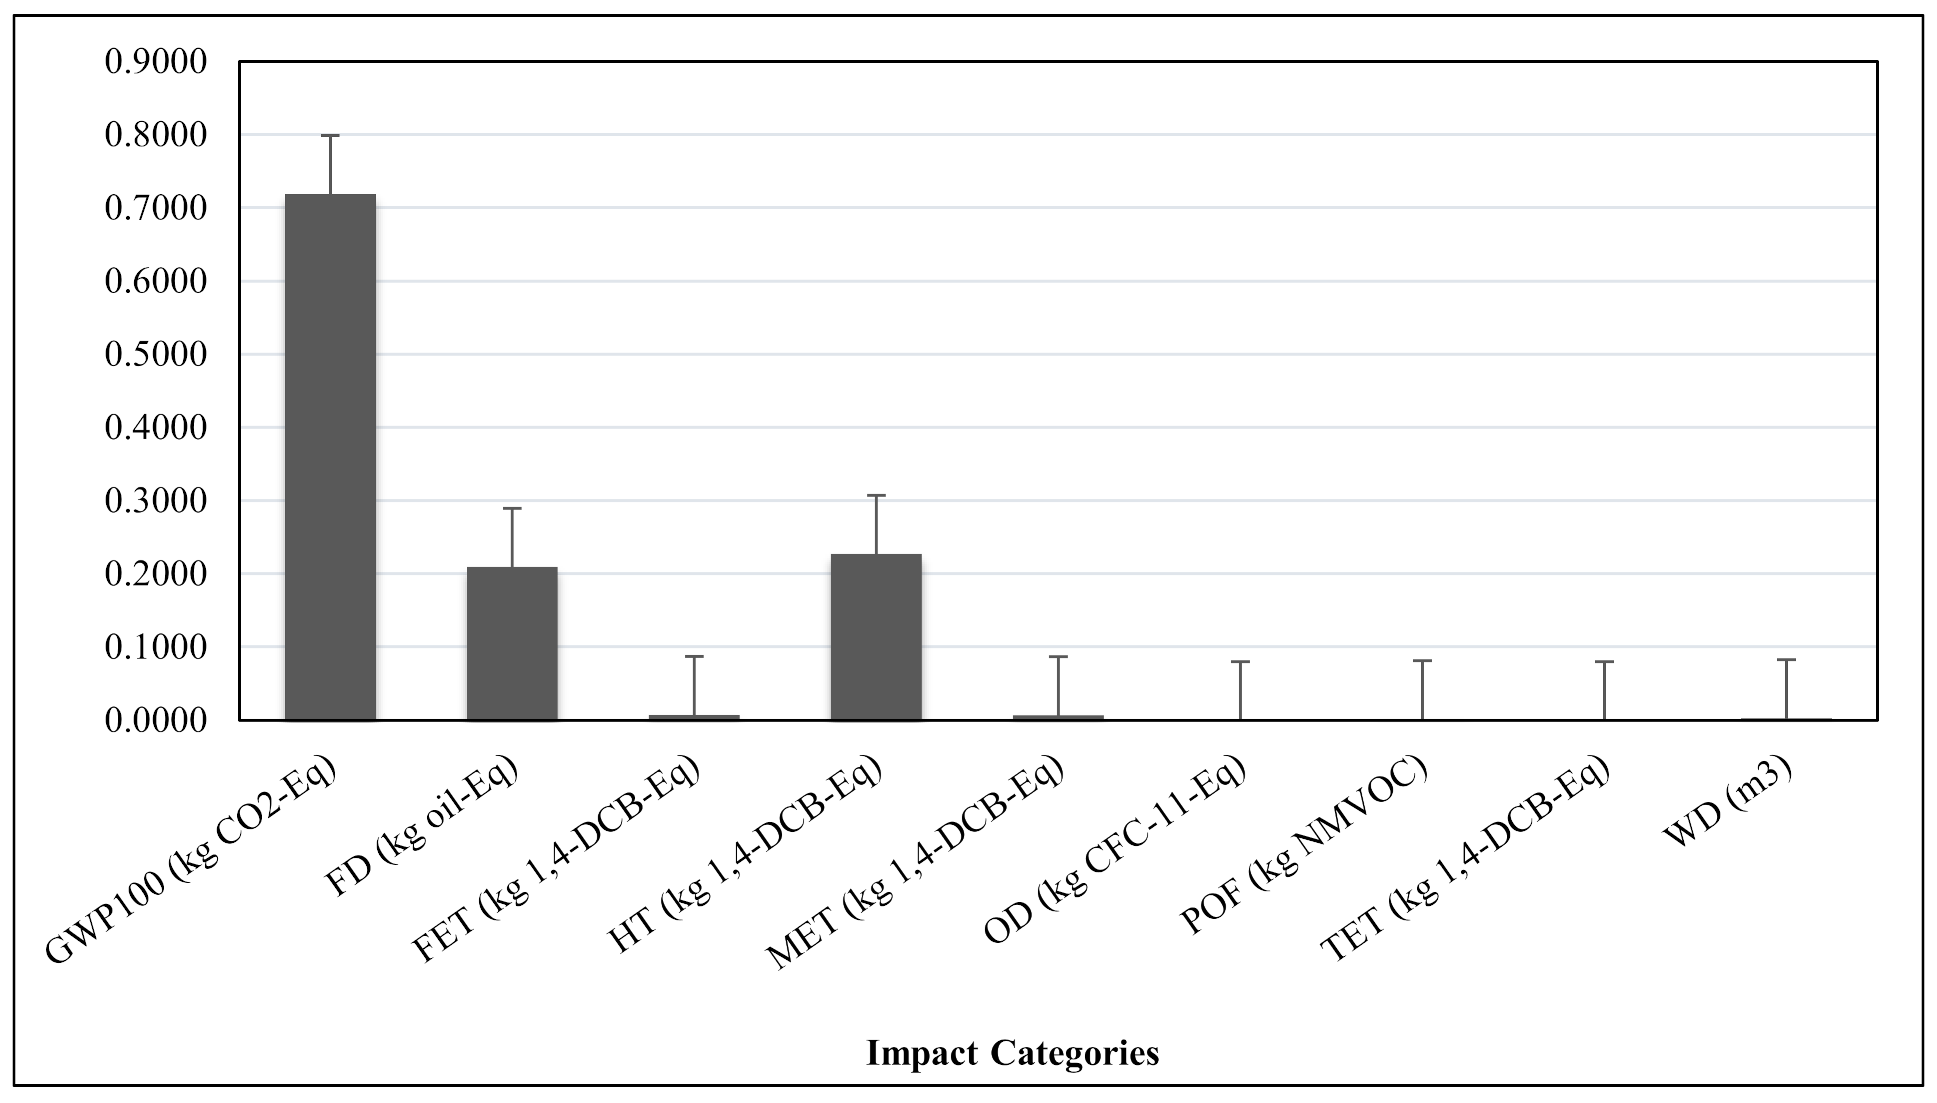
The LCIA result per FU of the selected impact categories is presented in Figure 10. From the result, GWP recorded the highest impact, of about 60% of the overall result. This is followed by human toxicity (HT) and fossil depletion (FD), with 19% and 18% impact contributions. The result of other selected impact categories had little or no significance to the overall result. The high GWP recorded is due to the nature of the GHG emission, largely composed of CO2 gases, as revealed in Table 8 above.
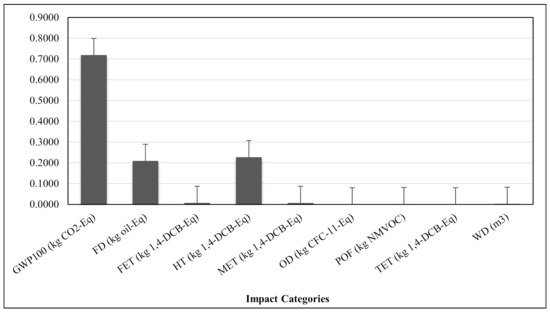
Figure 10.
LCAI result of the selected impact categories.
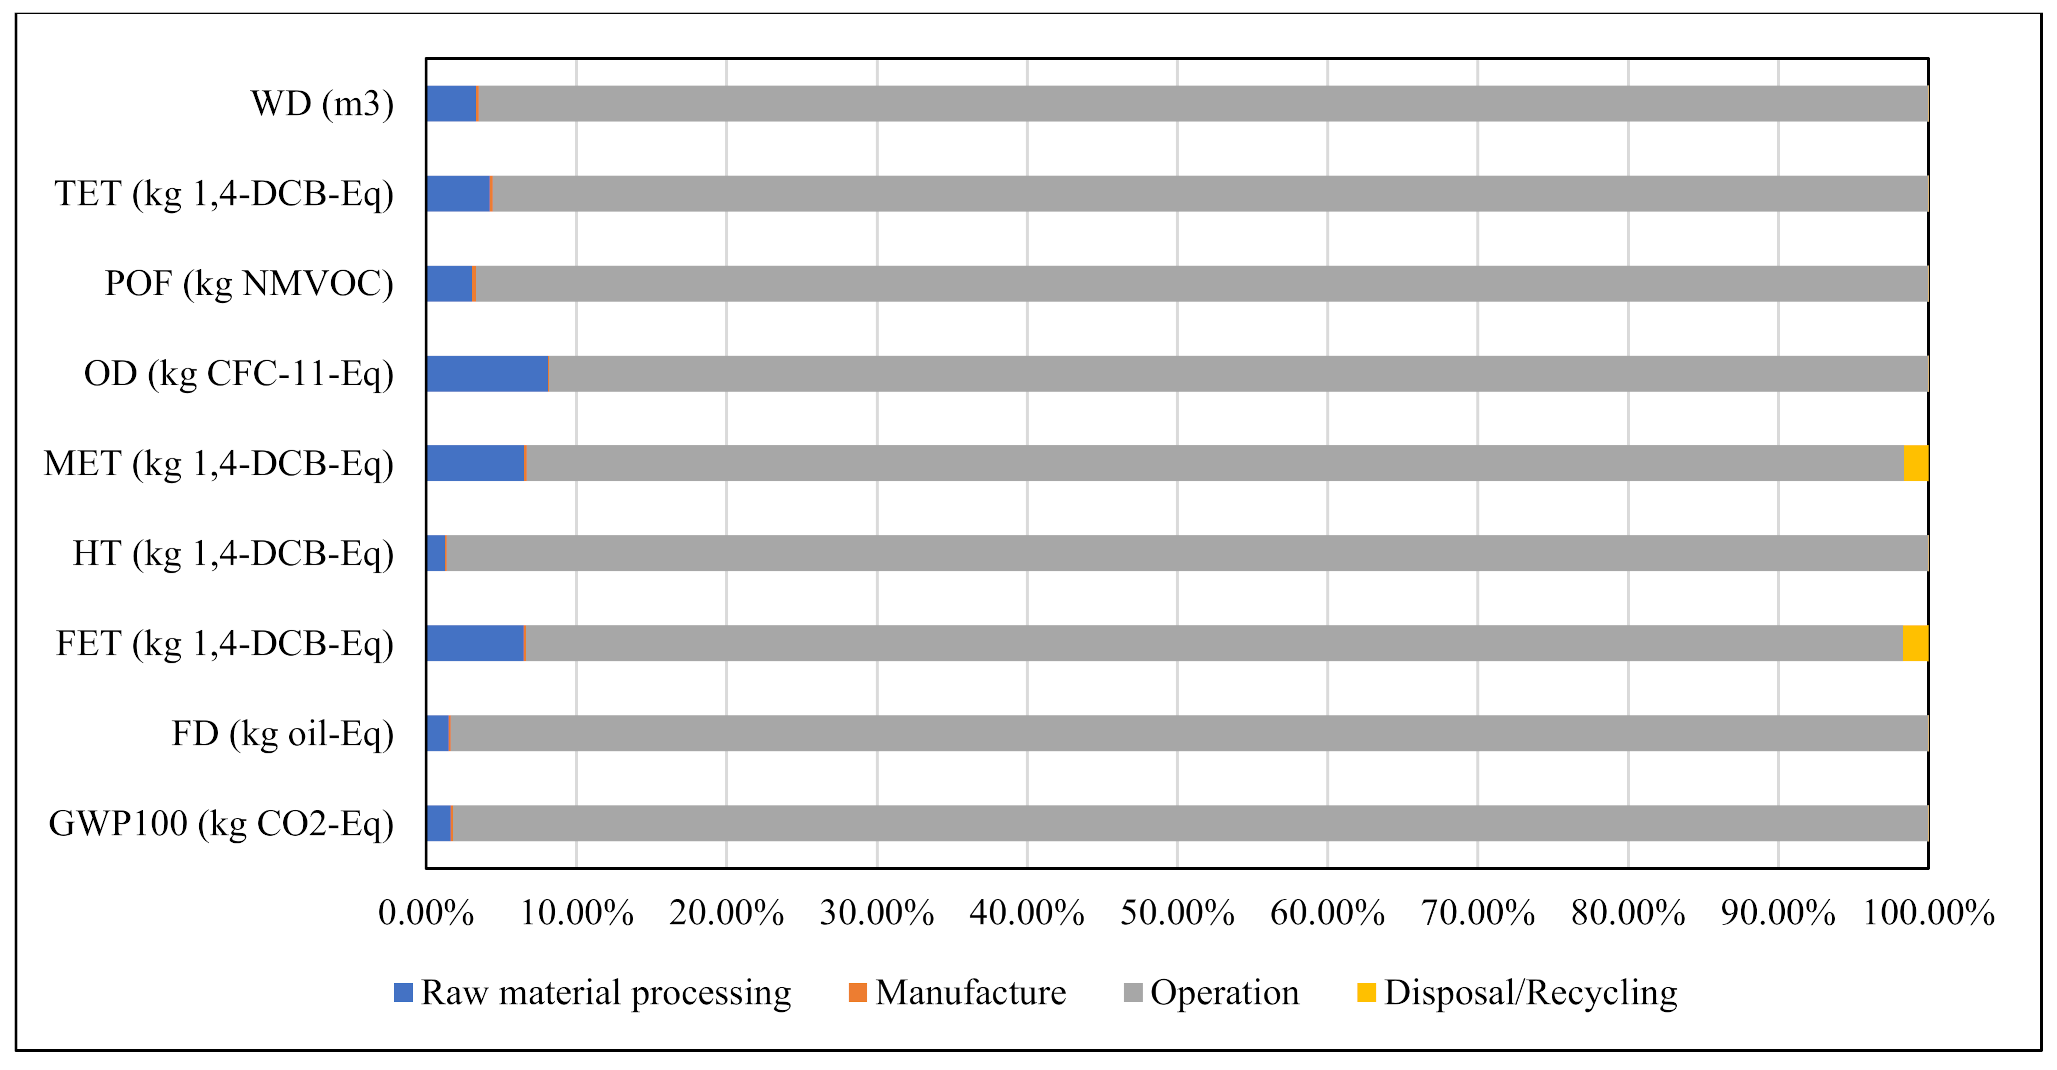
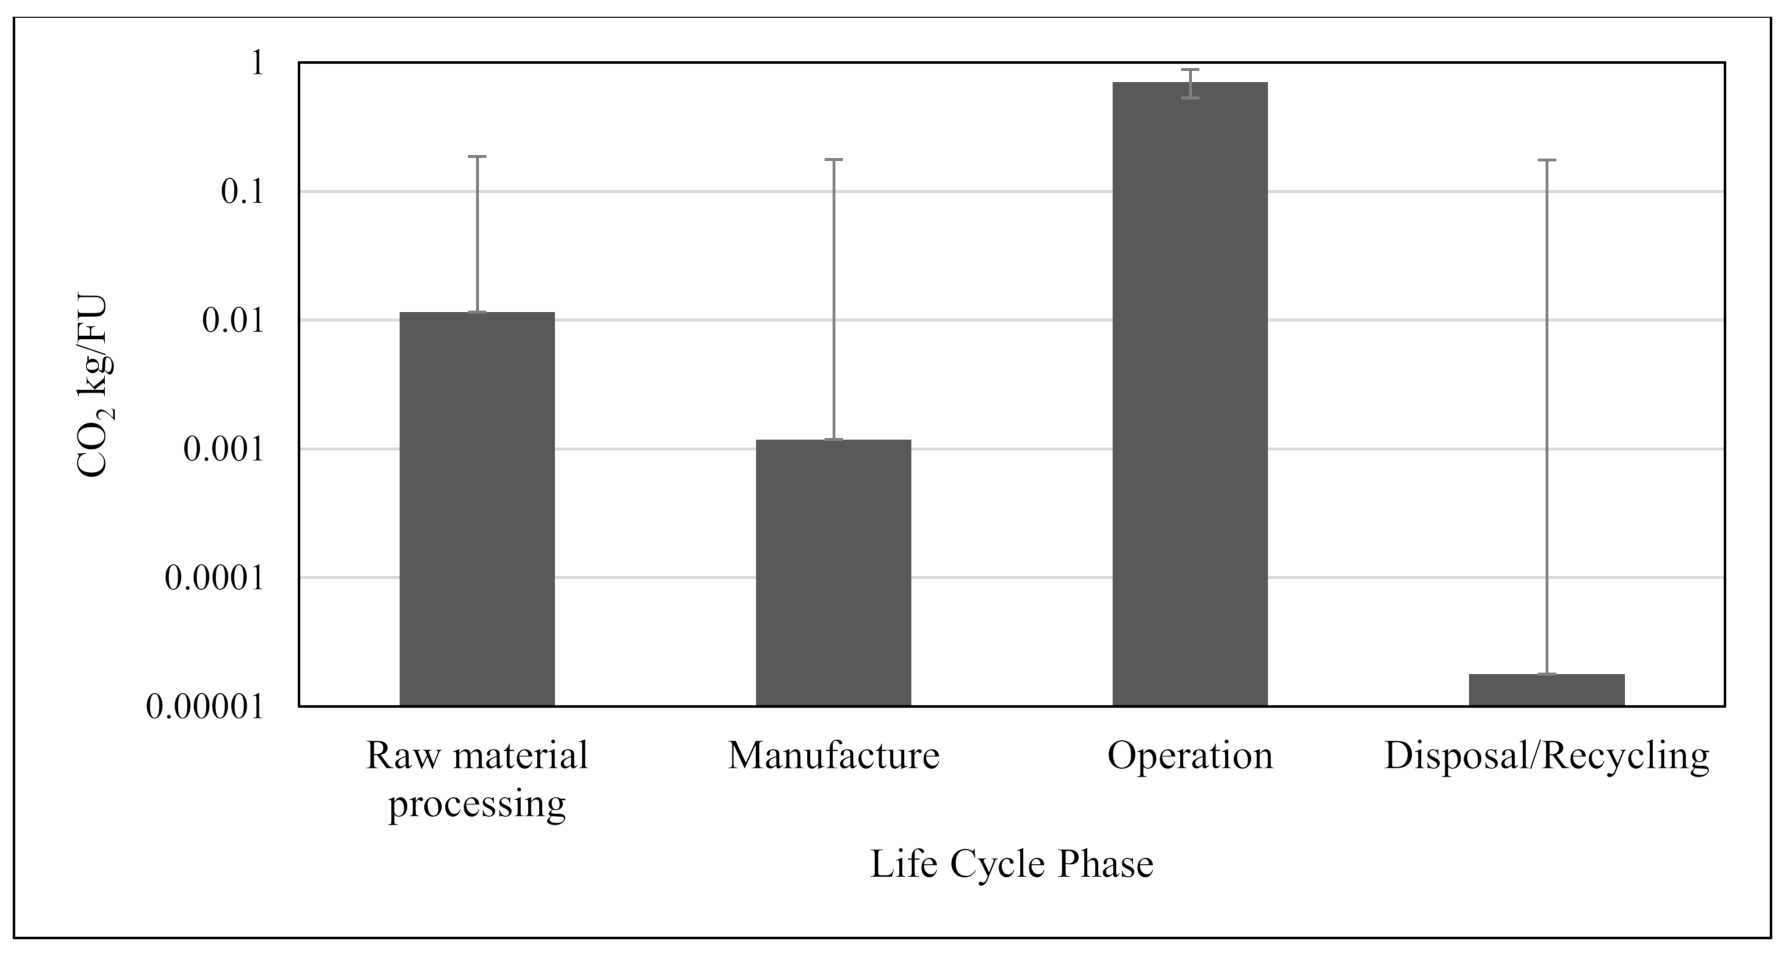
Figure 11 indicates the contribution of different life cycle stages to the selected impact categories. The major contributor is the operation phase, contributing an overall average of 95% in all categories, with human toxicity (HT) and freshwater ecotoxicity (FET) recording the highest (98.6%) and lowest (91.6%) readings, respectively. The strong influence of the operation phase on the LCAI result is primarily linked to the high energy consumption and the high ratio of fossil fuel in the grid commercial mix used to drive the plants. On the other hand, the manufacture phase contributes an average of 0.15%, with the highest and lowest contribution of 0.26% and 0.05% to the photochemical oxidant formation (POF) and ozone depletion (OD), respectively. Likewise, the raw material phase contributes an average of 4%, with the highest and lowest contribution, of 8.12% and 1.26%, to the ozone depletion (OD) and human toxicity (HT), respectively. Finally, the disposal/recycling phase contributes an average of 0.38%, with the highest and lowest contribution, of 1.7% and 0.0013%, to the freshwater ecotoxicity (FET) and water depletion (WT). The result of the overall impact of the phases is presented in Figure 12. From the result, the operation phase accounted for the highest environmental impact (about 98%), with other life cycle phases making minor or insignificant contributions.
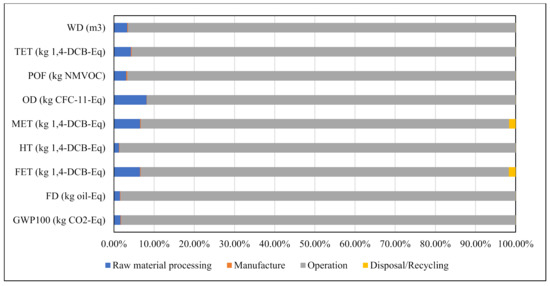
Figure 11.
Contribution of different life cycle stages of the VCS to the life cycle impacts categories.

Figure 12.
Contribution of the life cycle phases of the VCS to the environmental footprint.
3.3. Model Optimization: Comparison of Scenarios (Scenarios A, B, and the Base Case)
Since the use phase has shown to make the most significant contribution to the system’s environmental impacts, measures targeted at lowering energy consumption and utilizing cleaner fuels during VCS operation may improve the whole system’s environmental profile.
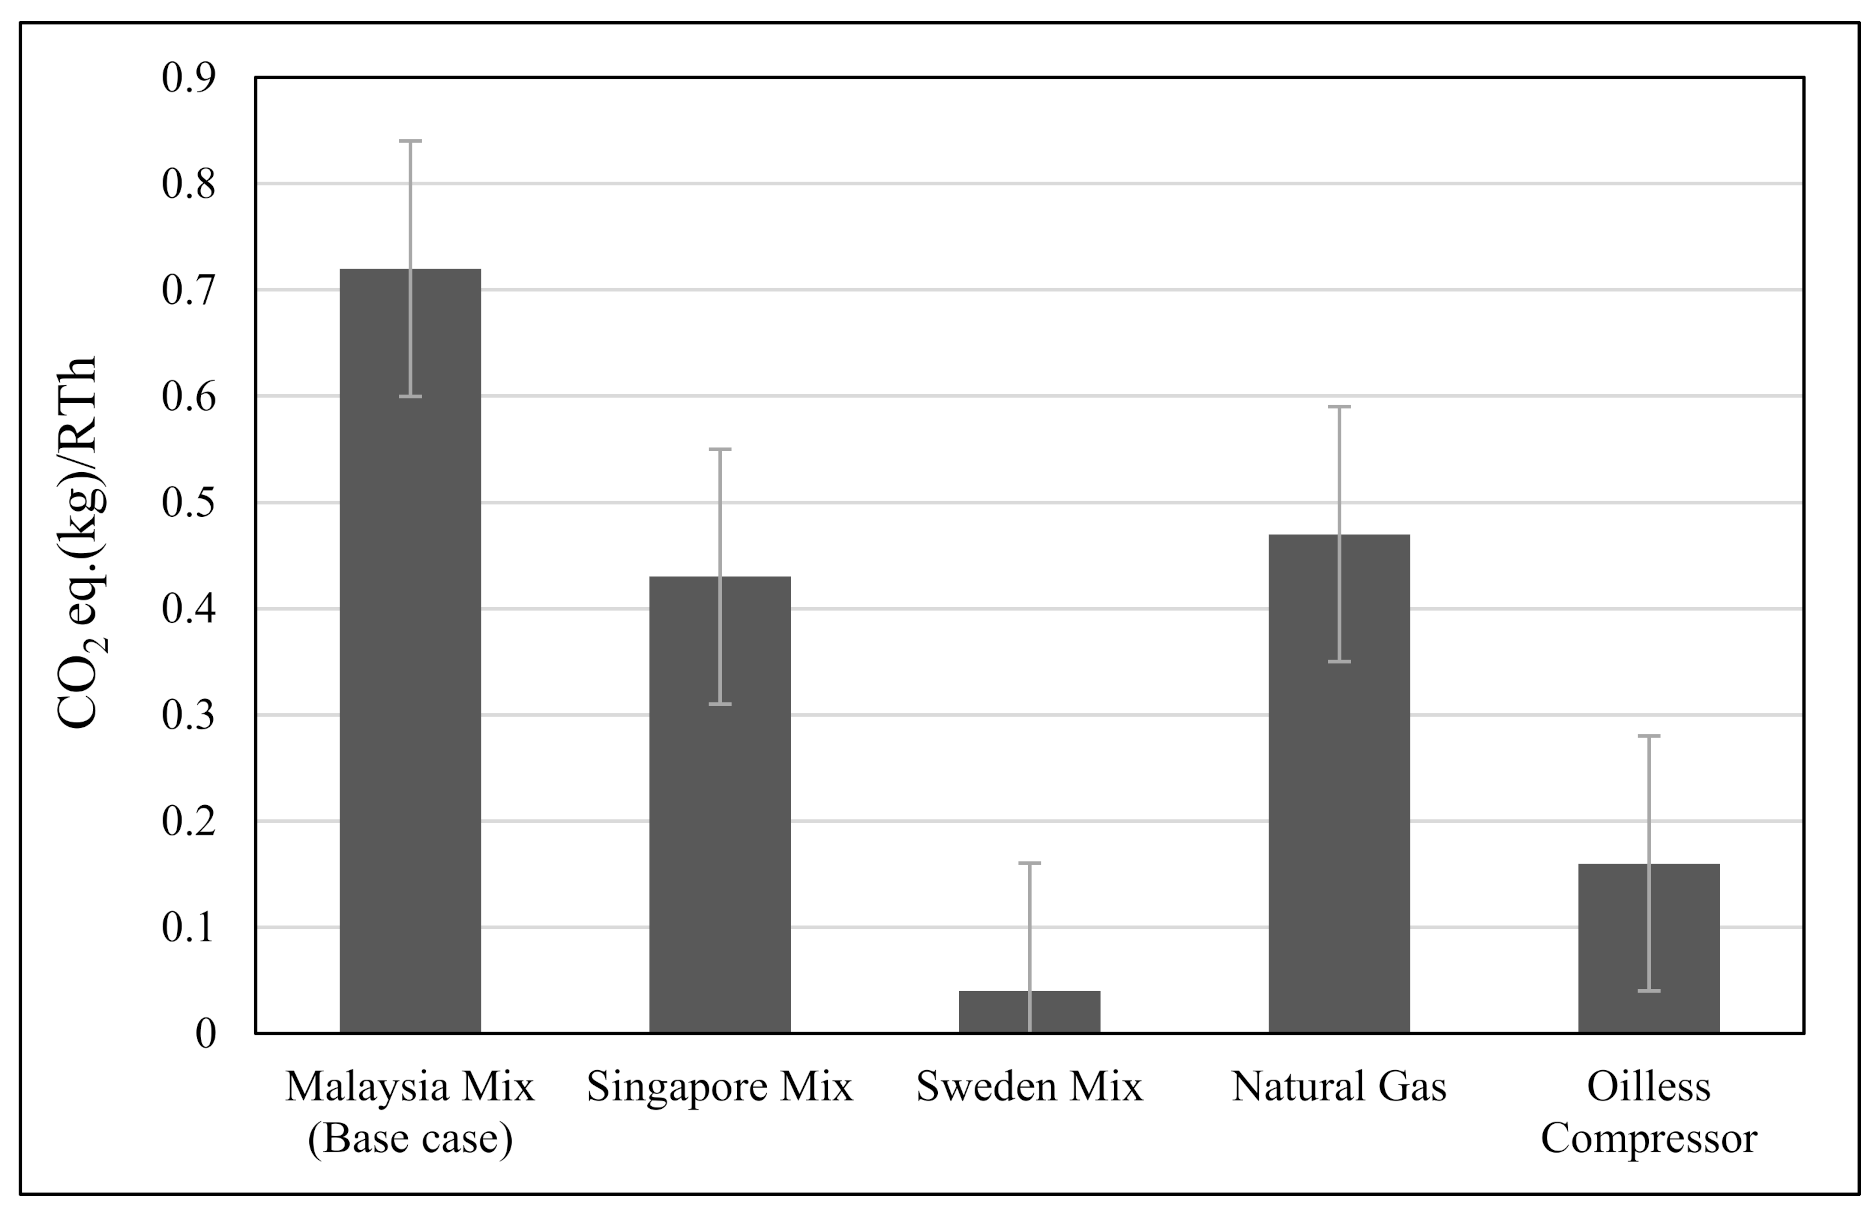
Keeping other variables constant, Figure 13 presents the environmental implications of switching countries’ commercial electricity mix and upgrading the plant compressors in the system use phase. The result indicates that integrating the Sweden commercial electricity mix produced the most sustainable option of the five considered scenarios. The carbon footprint per refrigeration for the Sweden fuel mix option recorded a 0.04 kg CO2eq/RTh, occupying just 6% of the base case carbon contribution. This implies that a 94% decrease in the environmental footprint, to the base case, is achieved by adopting the Sweden mix. This is followed by the Singapore grid mix option, which records a carbon footprint per refrigeration of 0.43 kg CO2eq/RTh, which is about 60% of the carbon contribution of the base case scenario. This implies that integrating the Singapore grid mix option will result in an estimated 40% decrease in the environmental footprint of the base case. In using energy distributed and generated solely from natural gas, the carbon footprint per refrigeration of 0.47 kg CO2eq/RTh is recorded, which is about 65% of the carbon contribution of the base case and a 35% decrease in the environmental footprint to the base scenario.

Figure 13.
Carbon footprint of the considered scenarios.
This result indicates the significant influence the country’s fuel mix has on the overall environmental impact of energy systems, stressing the need for countries (e.g., Malaysia) to reduce the presence of nonrenewable energy sources, while increasing the ratio of clean energy in the commercial grid electricity mix. This finding also correlates with the author’s previous research [5], which reported a 33% reduction across all selected environmental impact categories using the proposed 2030 Malaysia optimized electricity mix suggested by Rina et al. [36].
In assuming the base scenario while improving the design of the electric chiller component by incorporating a more efficient compressor (oilless magnetic compressor), a 0.16 kg CO2eq/RTh of the carbon footprint per refrigeration is recorded. This accounts for about 22% of the carbon contribution of the base case and a 78% decrease in the environmental footprint to the base scenario.
In Table 9, the result of the indirect GHG emissions to the overall environmental footprint for integrating the Singapore mix. From the result, about 60% of the recorded GHG emission is occupied by carbon dioxide gases, representing about a 30% decrease from the result recorded for the base case study. An increased allocation of renewable energy sources in Singapore’s grid mix compared to the base case resulted in this decrement.
Table 9.
The ratio of GHG contribution to the overall environmental footprint for the Singapore mix scenario.
The result presented in Table 10 shows the contribution of indirect GHG emissions to the overall environmental footprint for integrating the Sweden commercial electricity mix to the base case. From the result, about 30% of the recorded GHG emission is occupied by carbon dioxide gases, representing about 60% reduction from the result of the base scenario. This reduction is attributed to the higher proportion of renewable energy sources in the country’s grid mix than the base case scenario.
Table 10.
The ratio of GHG contribution to the overall environmental footprint for the Sweden mix scenario.
The result presented in Table 11 shows the contribution of the indirect GHG emissions to the overall environmental footprint for integrating natural gas to generate electricity for the base case. From the result, about 60% of the recorded GHG emission is occupied by carbon dioxide gases, representing about a 30% reduction from the result of the base scenario.
Table 11.
The ratio of GHG contribution to the overall environmental footprint for the natural gas scenario.
The result presented in Table 12 shows the contribution of the indirect GHG emissions to the overall environmental footprint for installing the oilless magnetic compressor to the electric chiller compartment. From the result, about 60% of the recorded GHG emission is occupied by carbon dioxide gases, representing about a 26% reduction from the result of the base scenario. This phenomenon is due to the reduction in energy consumed by the chiller system as a result of integrating a more stable and efficient nonlubricating compressor system.
Table 12.
The ratio of GHG contribution to the overall environmental footprint for the oilless compressor case scenario.
The LCIA result per refrigeration based on the selected impact categories of all the considered scenarios is presented in Table 13. The total of their environmental impacts per refrigeration for the base case, Singapore, Sweden, natural gas, and the oilless chiller options are given by 1.17, 0.63, 0.09, 0.68, and 0.26, respectively. The Singapore, Sweden, natural gas, and oilless chiller options all had GWP as the highest impact category, with an average of 60% impact contribution. This is followed by fossil depletion (FD) and human toxicity (HT), with an average contribution of 21% and 16%, respectively. The result of other selected impact categories had little or no influence on the overall result. However, the Sweden and oilless chiller options recorded a lower FD contribution of 9% and 18% and a higher HT contribution of 39% and 19%, respectively.
Table 13.
LCIA result of all considered scenarios.
The percentage change of all considered scenarios to the base case study is presented in Table 14. In analyzing the results, the case of the Sweden mix again provided the most sustainable option with an average of 81% environmental savings across all selected impact categories, having its highest (96%) and lowest (49%) impact savings on GWP and WD, respectively. This is followed by the oilless magnetic compressor design scenario, with an average environmental savings of 76% across all selected impact categories, having its highest (78.38%) and lowest (72.84%) impact savings on HT and FET, respectively. This is followed by the Singapore and natural gas case scenarios, with an average of 57% and 32% environmental savings. However, the Singapore mix recorded its highest savings (about 92%) on HT, while it made an extra 5% to the base case on the OD impact category. On the other hand, the natural gas case scenario recorded its highest environmental savings of 87% on HT and made an extra 69% to the base case on the OD impact category.
Table 14.
Percentage of environmental savings of all considered scenarios to the base case.
3.4. Comparison of the Base Study with Literature
A few studies on the LCA of VCC systems have been carried out in the literature [11,13]. However, owing to numerous assumptions, such as plant capacity, use time, refrigeration outputs, load factors, longevity, and geographic locations where VCC systems are built, a direct comparison of the various outcomes is problematic. In addition, various background data, such as national commercial electricity blends expected for VCS operation, result in different outcomes.
In this section, a comparison of the study conducted by Byrd et al. [13] with the case study is conducted, to analyze the environmental gains resulting from integrating TES tanks into the operation of a DC system.
A VCC system placed directly in commercial buildings in the United States is examined in the study by Byrd et al. [13]. The study’s functional unit is a 500-ton chiller that can cool a 150,000-square-foot office building. The cradle to cradle LCA, which encompasses raw material extraction, production, consumption, and end of life phases, is covered by the system boundary of their study. The amount of electrical energy consumed by the chiller system is estimated at 31,478,174 kWh throughout its lifetime. The calculated emissions of the chiller system (considering the USA electricity mix) throughout its lifecycle are estimated at 16,654,097.46 kgCO2eq. This implies that, for every 1 kW of energy used to drive the VCC system, 1.9 kg of CO2 is emitted.
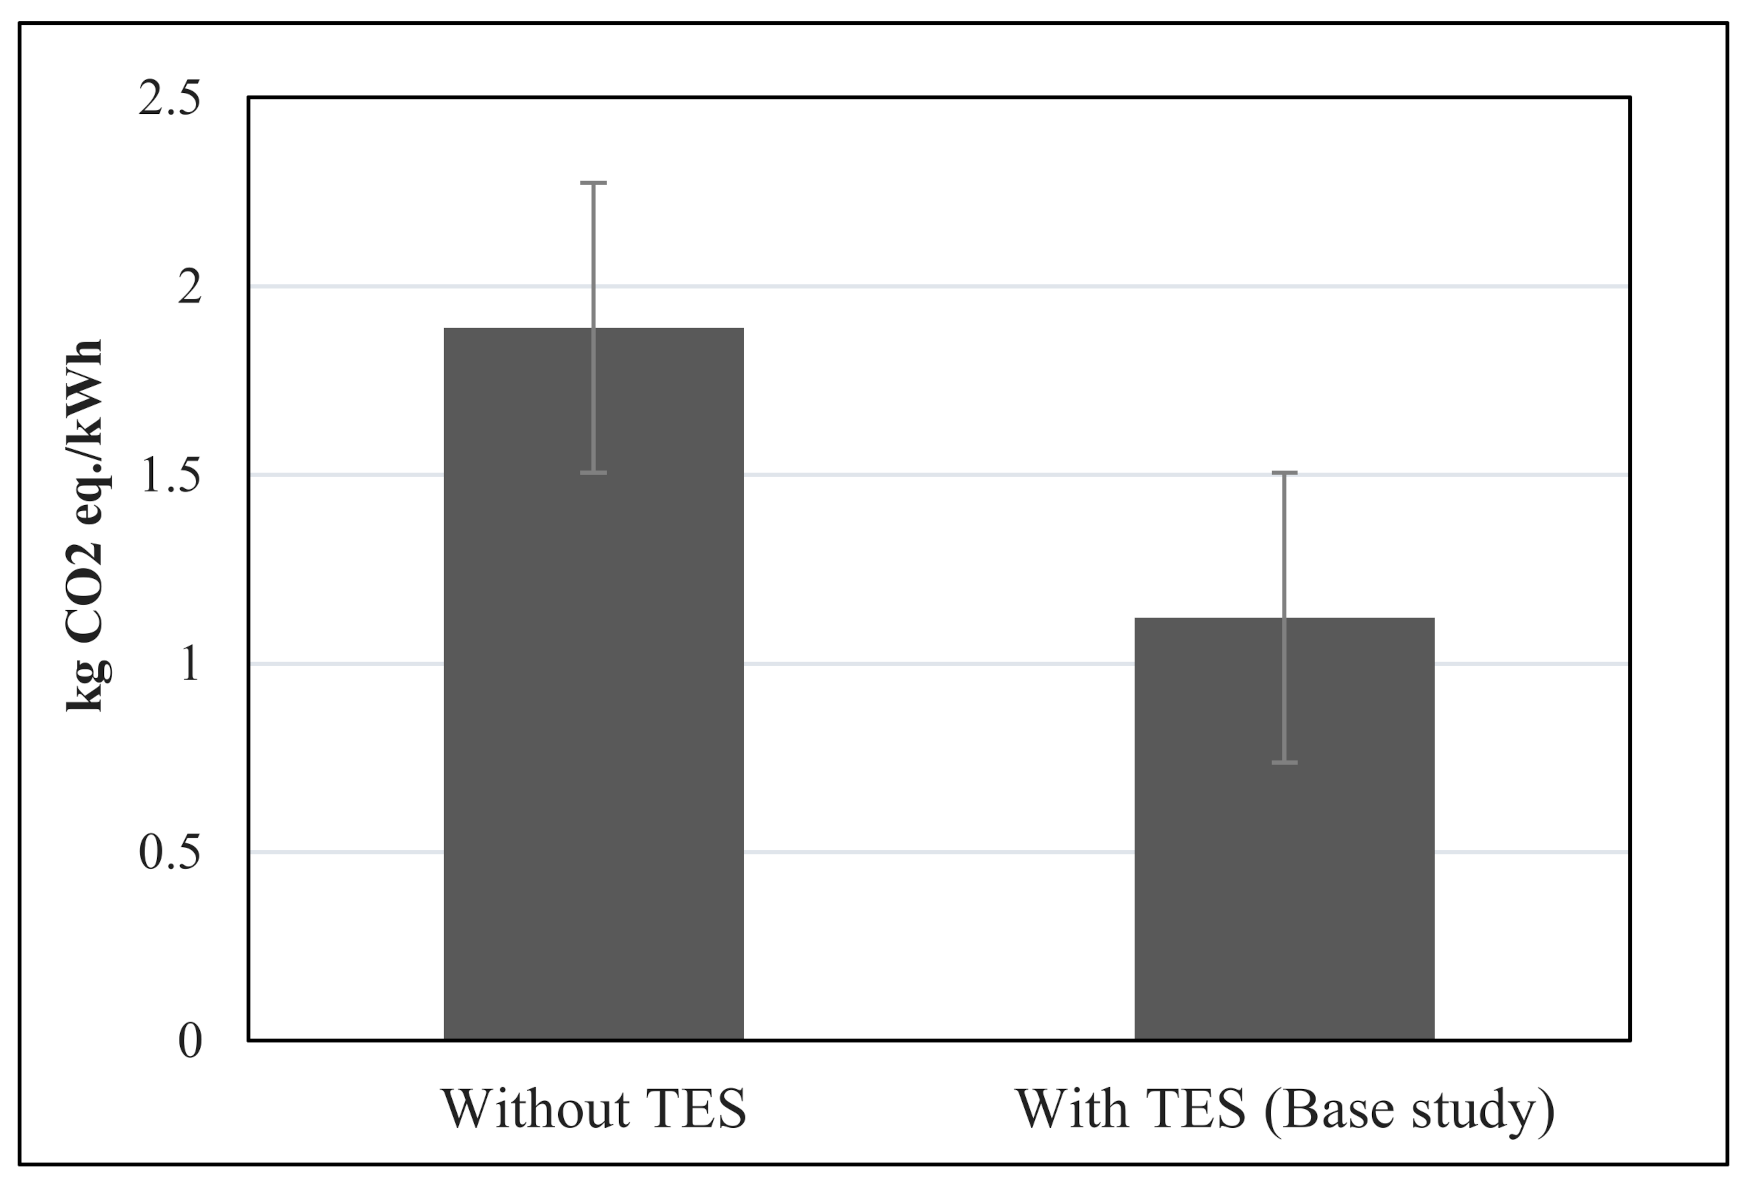
For the base study with TES tanks installed, the total amount of energy used by the VCS is estimated at 17,412,439,194 kWh throughout its lifetime. For the sake of comparison, the US electricity mix is assumed for the base system analysis. As a result, the calculated emissions of the chiller system throughout its lifecycle are estimated at 15,518,780,377 kgCO2eq. This result implies that, for every 1 kW of energy used to drive the VCS, 1.1 kg of CO2 is emitted. The result of this analysis is presented in Figure 14, and it shows that about 40% of the CO2 emission is avoided by TES tanks integration, thereby making their incorporation in a DC setup a more sustainable option.

Figure 14.
The carbon footprint of a VCC system installed with and without a TES tank.
The results and findings of the life cycle environmental assessment of the VCS in this study can be summarized as follows:
The result of the cradle to grave life cycle analysis of the VCS is given as 0.72 kg CO2 eq/RTh, and about 98% is as a result of indirect emission from commercial electricity usage to drive the system throughout its use life.
In the LCIA result of the case study, GWP recorded the highest impact contribution of about 60% of the overall selection. This is followed by human toxicity (HT) and fossil depletion (FD), with 19% and 18% impact contributions.
In comparing the contributions of the life cycle phases to the overall LCIA result, the operation phase made an average of a 95% contribution in all selected impact categories, with HT and FET recording the highest (98.6%) and lowest (91.6%) readings, respectively. This is due to the high ratio of fossil fuels in the electricity grid mix used to drive the plants.
Integrating the Sweden commercial electricity mix produced the most sustainable option compared to other scenarios, with an estimated 94% environmental savings to the base case. It also made the least CO2 contribution, of about 30% to the total GHG emissions compared to 90% and 60% of the base case and other scenarios. This result is directly proportional to the ratio of fossil fuel in the country’s fuel mix. Implying that reducing the presence of nonrenewable energy sources while increasing the ratio of clean energy in Malaysia’s grid electricity mix would generally improve the system’s environmental performance.
In analyzing the LCIA result of all the considered scenarios, GWP accounted for the highest impact category, with an average of 60% impact contribution. This is followed by FD and HT, with an average contribution of 21% and 16%, respectively. However, the Sweden and oilless chiller options recorded a lower FD, of 9% and 18%, and a higher HT, of 39% and 19%, respectively.
In analyzing the LCIA result, switching the grid electricity to the Sweden mix option resulted in an average of 81% environmental savings across all selected impact categories, having its highest (96%) and lowest (49%) savings on GWP and WD, respectively. This is followed by the oilless chiller, Singapore, and natural gas case scenarios, with an average of 76%, 57%, and 32% savings across all selected impact categories, respectively.
In estimating the environmental gains resulting from the integration of TES tanks in the VCS operation, the base study result is compared with the literature. In analyzing the result, a 40% environmental saving is recorded with TES integration.
4. Conclusions
The environmental impact of the VCS in a major DC plant installed in Malaysia is studied using a cradle to grave LCA methodology. The following conclusions were drawn, based on the numerical analysis results presented in the preceding section.
- The result of the cradle to grave life cycle analysis of the VCS is given as 0.72 kg CO2 eq/RTh, and the life cycle operation phase accounts for about 98% of the total impact, with other phases having a negligible impact. The strong influence of the operation phase on the overall environmental impact is linked mainly to the indirect GHG emission (occupied by 90% CO2 gases) from the commercial electricity used to power the system throughout its use life. GWP recorded the highest impact contribution of about 60% of the overall LCIA result. This is followed by human toxicity (HT) and fossil depletion (FD), with 19% and 18% impact contributions. The high impact result is proportional to the ratio of fossil fuel in the grid electricity mix and the intensity of energy consumed. This implies that reducing the presence of nonrenewable energy sources, while increasing the ratio of clean energy in Malaysia’s grid electricity mix, would generally improve the system’s environmental performance.
- To identify the most sustainable action to reduce the environmental contribution of the operation phase, the result of the case study was compared with other optimized scenarios. From the analysis, integrating the Sweden mix option presented the most significant environmental savings, with an estimated 94% reduction in the environmental footprint to the base case. Other considered scenarios include the oilless chiller, Singapore mix, and natural gas, which recorded an estimated environmental savings of 78%, 40%, and 35%, respectively. The result of this analysis reveals the quantitative relationship between the system efficiency and source of energy, to their corresponding environmental performance, as a more stable and efficient system powered by clean energy sources would provide the most sustainable option for the VCS design and operations.
- Finally, the result comparison of the case study with the literature reveals an estimated 40% environmental saving due to the integration of the functionalities of TES tanks in the operation of the DC plant. This result further substantiates that operating the electric chiller at night (the off peak period) provides a more sustainable environmental option than operating it during the day, as the chiller systems and the indirect electricity generation plants tend to function more efficiently, with less GHG emissions, during these times.
5. Recommendations
Based on the findings and results analysis carried out in this research project, it is recommended that future research should focus on the following areas:
- Along with the environmental analysis conducted in this study, an holistic approach to sustainability evaluation should incorporate the life cycle cost and social consequences.
- Further sensitivity and uncertainty evaluations steps are needed to be performed, to improve the quality of the data and the research results.
- Data refinement for the VCS technologies by acquiring additional primary data to decrease the reliance on secondary data from databases.
- Other phases, such as the transportation and installation phases, should also be considered in future studies.
Author Contributions
Conceptualization, C.C.H.; methodology, C.C.H. and M.A.A.M.; software, C.C.H. and A.H.D.K.R.; formal analysis, C.C.H.; investigation, C.C.H.; resources, H.H.Y. and M.A.A.M.; data curation, C.C.H.; writing—original draft preparation, C.C.H.; writing—review and editing, A.H.D.K.R. and M.M.; supervision, H.H.Y., M.A.A.M. and A.A.M.; project administration, H.H.Y.; funding acquisition, H.H.Y. All authors have read and agreed to the published version of the manuscript.
Funding
This research and APC was funded by the Yayasan Universiti Teknologi Petronas grant, with cost centre number: 015LC0-262.
Informed Consent Statement
Not applicable.
Data Availability Statement
The data analyzed in this study may be made available on request from the corresponding authors. The raw operational data are not publicly available due to the Memorandum of Understanding between the plant management and the institution.
Acknowledgments
The authors would like to appreciate the management of the Universiti Teknologi Petronas for funding this research work through the Yayasan Universiti Teknologi Petronas grant (Cost Centre: 015LC0-262).
Conflicts of Interest
There are no conflict of interest declared by the authors.
Abbreviations
| Nomenclature | |
| AC | Air condition |
| AD | Acidification |
| AHU | Air handling units |
| ASEAN | Association of Southeast Asian Nations |
| BMS | Building management systems |
| CC | Chilled ceiling |
| CN | China |
| CF | Carbon footprint |
| CL | Cooling load |
| COP | Coefficient of performance |
| CW | Chilled water |
| DC | District cooling |
| DCS | District cooling system |
| ECC | Electric centrifugal chiller |
| EEV | Electronic expansion valve |
| EL | Environmental load |
| EP | Electric power |
| EU | Eutrophication |
| FD | Fossil depletion |
| FET | Freshwater ecotoxicity |
| FM | Fuel mix |
| FU | Functional unit |
| GHG | Green house gas |
| GLO | Global |
| GWP | Global warming potentials |
| HVAC | Heat, ventilation and air conditioning |
| HT | Human toxicity |
| IGV | Inlet guide vanes |
| ISO | International standard organization |
| KC | Kalina cycle |
| LCA | Life cycle assessment |
| LCEL | Life cycle environmental load |
| LCI | Life cycle inventory |
| LCIA | Life cycle impact assessment |
| MET | Marine ccotoxicity |
| MY | Malaysia |
| MYR | Malaysia Ringgit |
| NG | Natural gas |
| OD | Ozone depletion |
| POC | Photochemical oxidant creation |
| POF | Photochemical oxidant formation |
| RE | Renewable energy |
| RM | Malaysia Ringgit |
| RoW | Rest of the world |
| SAC | Suction absorption chiller |
| SE | Sweden |
| SG | Singapore |
| TES | Thermal energy storage |
| TET | Terrestrial ecotoxicity |
| VCC | Vapor centrifugal chiller |
| VCS | Vapor compression system |
| VSD | Variable speed drives |
| WD | Water depletion |
References
- Rismanchi, B.; Saidur, R.; Masjuki, H.H.; Mahlia, T.M.I. Energetic, economic and environmental benefits of utilizing the ice thermal storage systems for office building applications. Energy Build. 2012, 50, 347–354. [Google Scholar] [CrossRef]
- Dincer, I.; Zamfirescu, C. Sustainable Energy Systems and Applications; Springer Science & Business Media: Berlin/Heidelberg, Germany, 2011. [Google Scholar]
- Eveloy, V.; Ayou, D.S. Sustainable district cooling systems: Status, challenges, and future opportunities, with emphasis on cooling-dominated regions. Energies 2019, 12, 235. [Google Scholar] [CrossRef] [Green Version]
- Steer, K.; Wirth, A.; Halgamuge, S. Control period selection for improved operating performance in district heating networks. Energy Build. 2011, 43, 605–613. [Google Scholar] [CrossRef]
- Hampo, C.C.; Akmar, A.B.; Majid, M.A.A. Life Cycle Assessment of an Electric Chiller Integrated with a Large District Cooling Plant. Sustainability 2021, 13, 389. [Google Scholar] [CrossRef]
- Lee, K.-M.; Inaba, A. Life Cycle Assessment: Best Practices of ISO 14040 Series; Center for Ecodesign and LCA (CEL), Ajou University: Suwon, Korea, 2004. [Google Scholar]
- Santoyo-Castelazo, E.; Stamford, L.; Azapagic, A. Environmental implications of decarbonizing electricity supply in large economies: The case of Mexico. Energy Convers. Manag. 2014, 85, 272–291. [Google Scholar] [CrossRef]
- Bukoski, J.; Gheewala, S.H.; Mui, A.; Smead, M.; Chirarattananon, S. The life cycle assessment of a solar-assisted absorption chilling system in Bangkok, Thailand. Energy Build. 2014, 72, 150–156. [Google Scholar] [CrossRef]
- Longo, S.; Palomba, V.; Beccali, M.; Cellura, M.; Vasta, S. Energy balance and life cycle assessment of small size residential solar heating and cooling systems equipped with adsorption chillers. Sol. Energy 2017, 158, 543–558. [Google Scholar] [CrossRef]
- Xie, N.; Liu, Z.; Luo, Z.; Ren, J.; Deng, C.; Yang, S. Multi-objective optimization and life cycle assessment of an integrated system combining LiBr/H2O absorption chiller and Kalina cycle. Energy Convers. Manag. 2020, 225, 113448. [Google Scholar] [CrossRef]
- Catrini, P.C.M.; Guarino, F.; Panno, D.; Piacentino, A. An integrated approach based on Life Cycle Assessment and Thermoeconomics: Application to a water-cooled chiller for an air conditioning plant. Energy 2018, 160, 72–86. [Google Scholar] [CrossRef]
- Almutairi, K.; Thoma, G.; Burek, J.; Algarni, S.; Nutter, D. Life cycle assessment and economic analysis of residential air conditioning in Saudi Arabia. Energy Build. 2015, 102, 370–379. [Google Scholar] [CrossRef]
- Byrd, E.; Netzel, B.; Adams, D.B.; Zhang, H. Life cycle GHG assessment of magnetic bearing and oil lubricated bearing water cooled chillers. J. Ind. Ecol. 2021, 25, 1222–1235. [Google Scholar] [CrossRef]
- Saidur, R.; Hasanuzzaman, M.; Mahlia, T.; Rahim, N.; Mohammed, H. Chillers energy consumption, energy savings and emission analysis in an institutional buildings. Energy 2011, 36, 5233–5238. [Google Scholar] [CrossRef]
- Canova, A.; Chicco, G.; Genon, G.; Mancarella, P. Emission characterization and evaluation of natural gas-fueled cogeneration microturbines and internal combustion engines. Energy Convers. Manag. 2008, 49, 2900–2909. [Google Scholar] [CrossRef]
- ISO. Environmental Management—Life Cycle Assessment—Principles and Framework ISO 14040: 2006; ISO: Geneva, Switzerland, 2006. [Google Scholar]
- Abd Majid, M.A.; Muhammad, M.; Hampo, C.C.; Akmar, A.B. Analysis of a Thermal Energy Storage Tank in a Large District Cooling System: A Case Study. Processes 2020, 8, 1158. [Google Scholar] [CrossRef]
- Stanford, H.W., III. HVAC Water Chillers and Cooling Towers: Fundamentals, Application, and Operation; CRC Press: Boca Raton, FL, USA, 2011. [Google Scholar]
- Frame, L.D. What to Consider before High-Frequency Welding of Stinless Steel. Weld. J. 2012, 91, 34–37. [Google Scholar]
- Heath, G.; Turchi, C.; Decker, T.; Burkhardt, J.; Kutscher, C. Life Cycle Assessment of Thermal Energy Storage: Two-Tank Indirect and Thermocline. In Proceedings of the ASME 2009 3rd International Conference on Energy Sustainability Collocated with the Heat Transfer and InterPACK09 Conferences, San Francisco, CA, USA, 19–23 July 2009. [Google Scholar]
- Sullivan, W.G.; Wicks, E.M.; Luxhoj, J.T. Engineering Economy; Prentice Hall: Upper Saddle River, NJ, USA, 2003; Volume 13. [Google Scholar]
- Moreno Ruiz, E.; Valsasina, L.; FitzGerald, D.; Symeonidis, A.; Müller, J.; Minas, N.; Bourgault, G.; Vadenbo, C.; Ioannidou, D.; Wernet, G. Documentation of Changes Implemented in Ecoinvent Database v3. 7; Ecoinvent Association: Zürich, Switzerland, 2020. [Google Scholar]
- TENAGA_NASIONAL_BERHAD. Commercial and Industrial Tariffs. Available online: https://www.tnb.com.my/commercial-industrial/ (accessed on 2 May 2021).
- Energy Commission. Malaysia Energy Statistics Handbook 2017; Suruhanjaya Tenaga (Energy Commission): Putrajaya, Malaysia, 2018. [Google Scholar]
- Lim, J.T. Malaysian Meterological Department (MetMalaysia), General Climate of Malaysia. Available online: https://bioone.org/www.met.gov.my/web/metmalaysia/services (accessed on 20 July 2021).
- Mukhtar, A.; Ng, K.; Yusoff, M. Passive thermal performance prediction and multi-objective optimization of naturally-ventilated underground shelter in Malaysia. Renew. Energy 2018, 123, 342–352. [Google Scholar] [CrossRef]
- EC JCR. ILCD Handbook: General Guide for Life Cycle Assessment—Provisions and Action Steps; Publications Office of the European Union: Luxembourg, 2010. [Google Scholar]
- Chomkhamsri, K.; Wolf, M.-A.; Pant, R. International reference life cycle data system (ILCD) handbook: Review schemes for life cycle assessment. Towards Life Cycle Sustain. Manag. 2011, 107–117. [Google Scholar] [CrossRef]
- Silva, D.A.L.; Nunes, A.O.; Piekarski, C.M.; da Silva Moris, V.A.; de Souza, L.S.M.; Rodrigues, T.O. Why using different Life Cycle Assessment software tools can generate different results for the same product system? A cause–effect analysis of the problem. Sustain. Prod. Consum. 2019, 20, 304–315. [Google Scholar] [CrossRef]
- Danfoss_Turbocor_Compressors_Inc. Portfolio of Oil-Free Compressors. Available online: https://assets.danfoss.com/documents/97602/AD264853192440en-000202.pdf#:~:text=The%20Danfoss%20Turbocor%C2%AE%20portfolio%20of%20oil-free%20compressors%20%E2%80%93,efficient%2C%20reliable%20and%20quiet%20compressor%20in%20the%20industry (accessed on 21 May 2021).
- Meredith, C. Turbocor, Danfoss. Product & Technology Review. Available online: https://energyideas.org/documents/factsheets/ptr/turbocor.pdf (accessed on 21 May 2021).
- Kayanan, D.R.; Fonseca, J.A.; Norford, L.K. Anthropogenic Heat of Power Generation in Singapore: Analyzing today and a future electromobility scenario. Deliv. Tech. Rep. 2020, 500. [Google Scholar] [CrossRef]
- Papageorgiou, A.; Ashok, A.; Farzad, T.H.; Sundberg, C. Climate change impact of integrating a solar microgrid system into the Swedish electricity grid. Appl. Energy 2020, 268, 114981. [Google Scholar] [CrossRef]
- Ying, Z.; Bellstedt, M. Compressor Degradation Assessment and Wear Mitigation Strategy. Available online: https://www.mla.com.au/contentassets/e3787641e36049349f8a01f9cac348ab/p.pip.0363_final_report.pdf (accessed on 27 May 2021).
- Good, R. Emerging Oil Free Technologies. Available online: https://utahashrae.org/images/downloads/Chapter_Meeting/slc_ashrae_emerging_oil_free_technologies_final.pdf (accessed on 9 October 2021).
- Haiges, R.; Wang, Y.; Ghoshray, A.; Roskilly, A. Unconventional fuel pathways for decarbonizing the electrical power generation in Malaysia by 2050. Energy Procedia 2019, 158, 4238–4245. [Google Scholar] [CrossRef]

Publisher’s Note: MDPI stays neutral with regard to jurisdictional claims in published maps and institutional affiliations. |
© 2021 by the authors. Licensee MDPI, Basel, Switzerland. This article is an open access article distributed under the terms and conditions of the Creative Commons Attribution (CC BY) license (https://creativecommons.org/licenses/by/4.0/).