Abstract
This article aims to study the political, environmental and economic factors in contemporary society that influence new approaches and decision making in design in terms of carbon emissions and energy employment. These issues are increasingly influencing political decision making and public policy throughout every aspect of society, including the design practice. Managing this kind of complexity means adopting new forms of collaboration, methodologies and tools, knowledge and technology sharing. The article aims to narrate a PhD research experience grounded in academy–industry collaboration and aimed at creating a digital methodology for impact evaluation and investment planning. In particular, the digital methodology focuses on responding to international public policy for the sustainable growth of cities, in terms of footprint and energy demand, by including a holistic view of the design process made possible by the use of life-cycle assessment (LCA) procedures. To simplify the calculation, the methodology focuses on the Environmental Product Declaration (EPD) data rather than the entire LCA. The EPD is a document that describes the environmental impacts linked to the production of a specific quantity of product or service. The objective was not to create another evaluation method but to employ the EPD results in combination with parametric and computational procedures. The integration of those procedures by using visual programming and scripting allowed the calculation of Embodied Carbon and Embodied Energy and created a user-friendly interface to query the results. The output obtained included automatic and dynamic diagrams able to identify impact scenarios in terms of CO2 emissions and MJ of embodied energy after the conceptual design stage. The strategic use of the charts lies in their potential to simulate impact conditions and, therefore, in the chance to create sustainable transformation scenarios in the early stages of design. At this point, the influence on choices is at its highest, and the costs are low. Moreover, the methodology represents a platform of collaboration that potentially increases the level of interaction between the actors of the construction process with the consequent improvement in design quality. In conclusion, building the design methodology and testing its performance within a specific sociotechnical context was important in critically evaluating certain topics, for example, the recent European strategies on new technology to reach sustainable objectives, the role of digital tools in proposing solutions towards contemporary social issues, the birth of new forms of partnership and collaboration and the new possibilities coming from digital evaluation approaches.
Keywords:
computational; parametric; sustainability; evaluation; partnership; governance; decision making; script; design 1. Introduction
1.1. The Research Implications: Digital Technologies and International Policies
The article explores the discourse around the necessity for new tools that plan, support and control decision-making processes with a holistic overview of the life cycle of products and processes. In particular, the research is focused on investigating the potential of digital tools in providing new approaches to design practice and evaluation methods by fostering knowledge and technology sharing between various institutions. Therefore, three main issues are addressed in the article:
- Explore the potential of the digital phenomenon is reshaping the design practice;
- Test new forms of collaboration and partnership between various subjects and institutions;
- Provide new methodologies to respond to current contemporary issues.
The background of the article is the review of various current methodologies addressing the task to incorporate parametric procedures with life-cycle assessment methods in order to obtain footprint scenarios. However, the article highlights a great gap in the methodologies represented by the fact that they do not fit conceptual design stages, the most strategic phase during which an evaluation method is employed (see Section 2). Therefore, the objective became to build a user-friendly digital methodology able to perform evaluation scenarios for decision making in terms of Embodied Carbon (kg CO2 eq) and Embodied Energy (MJm3) for the conceptual design stages.
Innovative evaluation methodologies are necessary because the increasing complexity of social issues at multiple levels requires new and articulated methods to interpret such matters. Recently the social, political, economic and environmental spheres are becoming more interconnected and causing additional complexity within the digital technology and international policy sphere. Distinctions between those spheres of interest are gradually eroding and requiring solutions that work across all spheres. For example, environmental issues have also become political, social and economic issues [1]. Therefore, the tools and the methodologies called on to respond to the complexities should incorporate and interpret a wave of related problems. The digital sphere is also no longer exclusively a technical area but is also political and being used as a means to reach environmental and social targets. This represents a change in perspective. Digital, and in a broad discourse, Information Technologies, create new possibilities for architecture. Conscious use of available technologies can be a means to deal with the crisis of the contemporary world, including the management of limited resources and researching ways to create a better balance between humans and the environment [2]. This balance must be found by considering two levels: the built environment and the natural one. Concerning the discourse of the built environment, it is necessary to focus on the demographic data and the consequent reflection about the sustainable growth of cities. It is predicted that around 70% of the world’s population will live in urban areas by 2050. At present, cities consume 75% of the world’s resources and energy, which leads to the generation of 80% of global greenhouse gases [3]. Therefore, the concept of “smartness” concerning city governance becomes crucial. It represents a strategy to mitigate the problems created by rapid urbanization and urban population growth, such as reducing energy consumption, water consumption, carbon emissions, transportation requirements, and city waste. The innovative side in governance discourse is that, for the first time, technologies are seen as strategic tools that mitigate environmental and social issues. Internet and Communication Technologies (ICT), Big Data and digital tools for design are recognized for their strategic potential in reaching sustainable objectives for communities [4]. Investigating further, the discourse on the built environment is a part of a broader reflection on the relationship between humans and the natural environment. International organizations such as the United Nations, with its UN Sustainable Development Goals [5], are pushing to reach world targets related to the sustainable growth of our communities by respecting human rights, safety and natural resources preservation and consumption. It is needed now to track the global sustainable development progress and identify critical ones to promote a faster achievement of SDGs. In this context, great importance is attached to the issue related to CO2 emissions and the policies towards their reduction due to the influence that carbon emissions have on climate change. The EU Emissions Trading System (ETS), is a firm EU policy to combat climate change and a vital tool for reducing greenhouse gas emissions cost-efficiently [6]. Specifically, CO2 prices increased three times from 2018 to today. This can undermine the financial sustainability of energy-intensive industries, such as oil and gas, cement, steel, chemical, etc. Those industries are committed to becoming energy neutral by 2050, and several roadmaps, action plans, implementation plans and pilot solutions are being implemented [5]. Therefore, the discourse on city governance and development has to take into account these strong dynamics in order to propose sustainable solutions for city growth.
In conclusion, the question all of this poses is what the potential of digital tools is in fostering new solutions?
1.2. The Triple Helix Model
The increasing level of complexity of political, social, environmental and economic issues throughout contemporary society requires not only a step towards multidisciplinarity but also new models of collaboration between subjects at different levels [2]. In this context, industry–academia collaboration has received increased attention. The need for innovation in the business environment and the ambition to commercialize academic knowledge intensify the need for more industry–academia collaboration [7]. However, increased collaboration between different actors also gives rise to increased issues because each actor is likely to pursue different objectives and face individual constraints. While this phenomenon can enhance the value, it can also be a source of additional complications [7]. Despite this, there are still many reasons for promoting the collaboration model: companies profit from qualified human resources such as researchers or students [8], obtain access to technology and knowledge [9] and use expensive research infrastructure (Ankrah and AL-Tabbaa 2015). Universities, in return, benefit from additional funding provided, access to industrial equipment and from licensing or patenting income [9]. In fact, collaboration with Industry has become an inevitable part of university funding. In many countries, international organizations and business enterprises represent a ‘significant source’ of funding for R&D in the higher education sector [10]. By taking into account these premises, it is necessary to take a step toward the double industry–academia domain and reflect on the role of government in the innovative model of collaboration. Governments are traditionally seen as the actor that guarantees the contractual relationship and also the one that establishes the rules of the game. Usually, academy–industry partnerships aim to respond to international policies and real-world targets at various levels, for example, in this case, sustainable city growth and CO2 reduction [5]. In particular, the Triple Helix model [11] postulates that in a knowledge-based society, the boundaries between the public and private sector, science and technology, university and Industry are increasingly fading, giving rise to a system of overlapping interactions (see Figure 1): (a) industry operates as the centre of production, (b) government acts as the source of contractual relations that guarantee stable interaction and exchange and (c) universities are the source of new knowledge and technology [12]. The triple helix concept incorporates into its innovation system format a set of features, relationships and functions. The relationships between components are synthesized into five primary types: technology transfer; collaboration and conflict moderation; collaborative leadership; substitution; and networking [13].
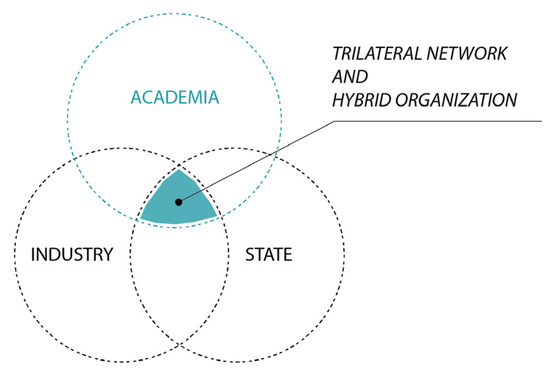
Figure 1.
Triple Helix configuration [11].
This configuration incorporates the transition toward a knowledge society in which universities and other knowledge institutions act in partnership with industry and government to develop joint initiatives [11]. The most favourable environment for innovation is where the spheres meet and synergies manifest. This represents the framework where the research is located. Next, we are going to analyze the specific collaboration system that occurred between Politecnico di Torino and CRH to respond to international policies based on real-world targets.
1.3. CRH and the ICSC (Innovation Centre for Sustainable Construction)
CRH is the leading global diversified building materials business in the world, employing 76,600 people at 3100 locations in 29 countries worldwide. It manufactures and supplies a diverse range of building materials and products for use in the construction and maintenance of infrastructure, housing and commercial projects. Its materials and products are used extensively, in construction projects of all sizes, across the world. CRH’s businesses are focused on delivering service excellence for customers in local markets and on anticipating evolving market needs in a complex and continuously changing world. While the construction industry has typically been conservative and slow to change, the challenges and opportunities presented by climate change are driving an increased focus on innovation across the industry.
CRH takes its role in helping to address the challenges of climate change seriously, and this is one of the reasons it established the Innovation Centre for Sustainable Construction (ICSC). The ICSC focuses on supporting CRH in achieving its commitments towards the United Nations Sustainable Development Goals [5] (see Figure 2). As a centre of excellence, the ICSC is tasked with identifying future trends and customer needs and then transforming them into attention points for development. This also involves networking to create an ecosystem for these trends to be properly addressed, developing new ideas internally and externally, creating the internal context for external talent to become the next generation of professionals in the Industry, managing the process of market and technology readiness levels inside CRH for the identified concepts, and delivering them to the market. A very important point in the whole value chain of the ICSC is the close relationship with Universities and Public Research Centres. On the one hand, they participate actively in the development and preparation of professionals that will work in market-facing roles in the near future, contributing to the social responsibility of educating; on the other hand, they actively ensure that CRH captures the knowhow from talented people, and collaborates with the university, to develop young generations that will help solve today’s challenges.
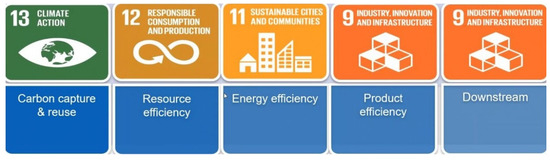
Figure 2.
Technology validation and developments: project pillars [14].
The chart shows the main research topics being focused on by the ICSC. The projects involve issues that are closely aligned to the UN SDGs with a direct effect on the design process and products. The ICSC focuses on different time horizons to deliver innovation: the longest term to deliver results but the shorter to medium term value is in the development of people. One of the ways ICSC is focusing on developing the next generation of professionals is by taking a serious approach to research and by participating in the co-funding of philosophical doctorates (PhDs).
This paper is the result of a long-lasting collaboration derived from a PhD that Polito (Politecnico di Torino) and CRH are developing together to address the digital-related requirements of a more sustainable and efficient building industry.
2. Materials and Methods
The section intends to address both the temporal and technical phases that led to the digital methodology development.
2.1. Research Gap Definition: Impact Evaluation in the Concept Design Stage
The target of the research is reaching environmental impact optimization in the preliminary design stages, in particular, in the concept design. The use of easy and user-friendly methodologies is the key factor for reducing the climate impact of a structure. Existing research on life-cycle assessment (Antón Alvarez L., 2014 [15]; Lee S., 2015 [16]; Najjar M., 2017 [17]; Röck M., 2018 [18]; Kylili A., Vaiciunas J., 2015 [19], Lavagna M., 2018 [20]) and sustainable design procedures (Soust-Verdaguer B., 2017 [21]; Lee S. et al., 2015 [16]; Shin Y., 2015 [22]) demonstrates that the primary flaw in current design methodologies lies in the fact that the information needed for estimating the climate impact of buildings is provided only during latest phases of design, in particular the technical phase, where the influence on design choices are low, and the costs are high [23]. By reading the picture from RIBA (see Figure 3) that defines all of the design phases, the methodology employed is positioned in the “2” slot:
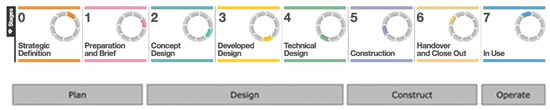
Figure 3.
Plan of work by RIBA [24].
Therefore, a reconfiguration of the strategic focus on sustainable actions at the concept design stage (stage 2), where the influence on design choices is high, and the costs for changes are low, to integrate impact evaluation in the preliminary design phases. In this manner, digital technologies and related methodologies can help in simulating object behavior by integrating a holistic view of the entire process. Building Information Modelling (BIM), in particular, enables a focusing of the design effort in the early phases during which it is possible to integrate information related to impact assessment. Anticipating this kind of analysis is necessary for the most efficient design production. In BIM, the typical effort in design moves from the late phases to the preliminary and concept stage, and goes down during the development phase. Talking about the typical effort means not only considering the design effort but also all of the efforts related to choosing the stakeholders involved, the platforms of collaboration, the interests of the actors and the output expected, defining the resources in terms of technology and knowledge sharing, and organizing a program of the activities. This level of organization is very demanding in terms of time. However, it allows an efficient exchange of information and collaboration in the early stages of design with a consequent increase in the quality of the architectural product and with better management of the design process. Improving dialogue and collaboration is the crucial activity that digital technologies are enabling with the consequent necessity of a change in mind by the actors of the design process.
By considering these premises, we began evaluating the current methodologies based on BIM and LCA integration, and from the analysis of specific literature, we selected the seven most relevant articles (Röck M., Hollberg A., Habert G., Passer A., 2017 [25]; Peng C., 2014 [26]; Najjar M., Figueiredo K., Palumbo M., Haddad A., 2017 [17]; Lee S., Tae S., Roh S., Kim T., 2015 [16]; Shin Y., Cho K., 2015 [22]; Seo S., Tucker S., Newton P., 2015 [27]; Basbagill J., Flager F., Lepech M., Fischer M., 2012 [28]). Then, we classified the information to obtain the most relevant data of value to run the integration. The results are listed in three categories:
- (1)
- Input data: quality and quantities of data needed to start the integration procedures;
- (2)
- Tools for data analysis: a benchmark of the tools necessary to run the simulation (Revit is the software most used due to its integration with various LCA software and especially Plug-Ins);
- (3)
- Output: type of impact categories mostly calculated (CO2 is the most calculated category).
The chart below resumes the toolbox needed to run the simulation (see Table 1). The information was extracted from the literary review of the articles cited.

Table 1.
BIM and LCA integration methodology.
The tendency is to use a software chain to manage three types of information: 3D geometries, energy analysis, and impact data. In this field, BIM is used to extract the quantities (m3) related to geometries. Once the amounts are obtained, it is possible to link them with the LCA database and combine the impact data. However, these methodologies have some issues:
- Medium/high skills are necessary both for the use of the LCA tools and for the management of a complete LCA database;
- It is necessary to pay a licence for the LCA software;
- To ensure the interoperability between the Revit model (and the related architectural objects) with the LCA tool, you must use a Plug-In of an LCA. The plug-in is, in fact, directly put into the Revit software. However, at the moment, there are only a few plug-ins available (such as Tally and OneClick L.C.A.), but they are not as effective as LCA software;
- If an LCA tool is used, you do not have the interoperability with the Revit model and then it is not possible to ensure dynamic results. This means that if there are some changes in geometries and the LCA analysis, the related results do not change automatically. Moreover, the LCA results are not registered into the Revit objects and thus cannot be extracted from the model.
The considerations listed come from a detailed analysis of the scientific articles concerning the methodologies currently used and from the experimentation with software and LCA analysis that we conducted during the PhD path. The analysis deepened during the paragraph which pushed me towards the definition of a digital method to solve or bypass some of the issues listed.
2.2. Building the Digital Methodology
The paragraph is organized to explain in succession the workflow of the activities, the input data needed and the steps to compose the script for the simulation.
2.2.1. Premises and the Focus on EPDs
By studying the findings coming from the specific literature concerning BIM and LCA integration and by analyzing the related issues listed (Section 2.1), we began looking for a gap in the current methodologies. We decided not to test a current method but to create a new one to provide some solutions. In particular, we focused our attention on creating a new digital method to perform impact analysis without the need for high skills in BIM and LCA software and licences. Therefore, we listed a series of indispensable features:
- Base skills for BIM software;
- Base skills for LCA analysis;
- Try to avoid the payment of a licence for LCA software;
- Simplify the calculation and focus on a few main impact categories;
- Focus on the conceptual design stage.
By considering these features, we made the hypothesis to bypass the use of the LCA software in favour of a tailor-made script created with Dynamo (integrated into the Revit software) and work on a specific section of LCA called EPDs (Environmental Product Declaration). An EPD is a declaration about the environmental performance of a product or service: this declaration follows the voluntary certification scheme expressed by the ISO 14025 standard and, for buildings, also by the standard EN 15804 [29]. The recipients of an EPD are all the stakeholders of the company that produces a product or provides a service and all those who are directly or indirectly involved in the use of that product/service. Moreover, the EPDs results are presented in a user-friendly interface, and they are summarized through the use of a series of environmental indicators, such as the amount of carbon dioxide emitted or GWP (Global Warming Potential) per declared unit of product [30] (see Table 2).
Table 2.
The EPDs chart is related to Precast concrete from the Oekobaudat database [31].
The chart shows the seven environmental impact indicators taken into consideration for an EPDs analysis:
- Global Warming Potential (GWP)
- Ozone Depletion Potential (ODP)
- Photochemical Ozone Creation Potential (POCP)
- Acidification Potential (AP.)
- Eutrophication Potential (EP.)
- Abiotic Depletion Potential for No Fossil Resources (ADPE)
These indicators are listed with the corresponding values for every design phase:
- A1–A3 Production
- C1 De-construction
- C2 Transport
- C3 Waste processing
- D Recycling potential
However, to simplify the methodology construction, the simulation does not consider all of the information related to EPDs to calculate various impact analyses but focuses on some categories in particular suited for the kgCO2 and MJ m3 calculation In this way, it was possible to reduce the calculation. However, the classes can also be expanded for special needs. The methodology aims to focus on the calculation of two results:
- The embodied Carbon (kg CO2 eq) for a single product and the whole building;
- The embodied Energy (MJm3) for a single product and the whole building.
In order to obtain the results, the strategy was to combine parametric architecture with visual programming and an EPDs database. The following chart shows all of the possible advantages coming from the methodological proposal consisting of the integration between a BIM software (.rvt), a Dynamo script (.dyn), and an EPDs database (.xls).
Here, attached are the advantages that using both a Dynamo script and impact scenarios for the concept stage allow in the design practice (see Table 3):
Table 3.
Script advantages.
The following paragraph is dedicated to explaining the practical passages (made by requirements, input, output) necessary to calculate Embodied Energy (EE) and Embodied Carbon (EC) results for the preliminary design stages.
2.2.2. The Methodological Proposal in Details
The methodological framework consists of integrating the potential of BIM modelling with visual programming calculation through the use of a script and an EPD database. Here is the chart (see Table 4) which resumes the main data in terms of software, format and information:
Table 4.
The methodological framework.
The information listed in the chart below is positioned into a workflow that contains the actors involved in the project (POLITO, Academia; CRH, Building Materials Provider; HEIJMANS, Construction Company based in the Netherlands), the activity of each stakeholder, the responsibilities and the tools employed. The workflow is divided into several steps listed below (Actor/Action):
- Actor/CRH; Action/Creation of the EPDs chart for several materials;
- Actor/POLITO; Action/Transform the EPDs into a .xls format suitable for Dynamo;
- Actor/HEIJMANS; Action/Create a 3D Model LOD 200 (focus: wall, floors, stairs);
- Actor/POLITO; Action/Create a Dynamo script for EC and EE calculation;
- Actor/POLITO; Action/Run the integration between the model and the script;
- Actor/POLITO; Action/Extract the results and compare the diagrams (.pdf/.html);
- Actor/POLITO-CRH-HEIJMANS; Action/Compare scenarios for decision making.
The graphical workflow of the activities (see Figure 4):
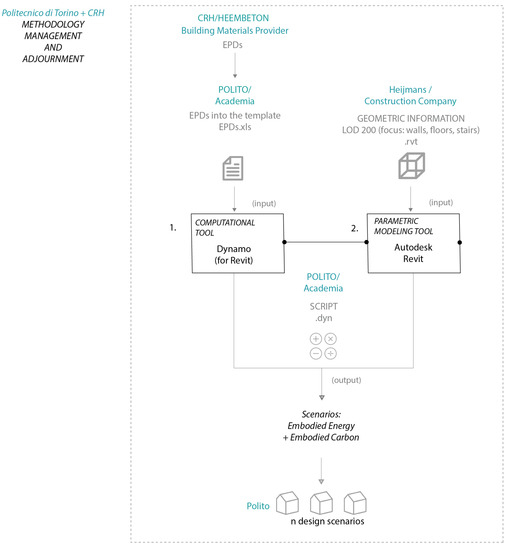
Figure 4.
The methodological proposal.
2.2.3. Choosing the Categories for the Validation Sessions
Once the BIM model has been developed in Revit by using a LOD 200, it is necessary to focus on the categories we want to consider during the impact analysis calculation. In this case, the architectural categories chosen were: walls, floors and stairs. The script is focused on linking the quantities (m3) related to those categories with the LCA data into the EPDs chart. The EPDs values useful for the Embodied Carbon is GPW and for the Embodied Energy are RSF (use of renewable secondary fuels), PENRT (total use of non-renewable primary energy resources) and NRSF (use of non-renewable secondary fuels). It is necessary to emphasize that the list of the values considered in the analysis can vary and be added with respect to the impact categories that you want to include and the stages that you want to consider. In this case, the LCA stages taken into account are A1–A3 for Embodied Carbon and A1-D for Embodied Energy.
The chart below (see Table 5) outlines the technical requirements needed to run the simulation. The list interprets the toolbox used to create and test the digital methodology. In the discussion paragraph, some suggestions are provided to integrate the methodology with additional data as a further future possible step.
Table 5.
The chart of the requirements belonging to the digital methodology.
The chart or requirements come from various validation sessions made in collaboration between Politecnico di Torino, CRH (material provider) and Heijmans (construction company). The validation sessions were organized in monthly meetings during all of the three years of PhD doctoral research and were classified into two types:
- (a)
- Internal: Politecnico di Torino and CRH
- (b)
- External: Politecnico di Torino and Heijmans
Together, we defined the generic and specific requirements to test during the validation sessions and the related information that the methodology should host to obtain a tailor-made result progressively. Developing the methodology by integrating suggestions, advice and requirements from various actors is, in fact, important to create a product suitable for the construction market and able to respond to the sustainable needs promoted by the institutions. In this case, Academia, a building materials company and a construction company worked together to build a product by assuming procedures very similar to the development of a start-up.
Once the toolbox, the datasets and the information needed were defined, it was possible to start working with the script. The script aimed to combine the quantities (m3) extracted from the walls, floors and stairs of the 3D model with the EPDs datasets in excel, in particular, with the kg CO2 eq from GWP and the MJ from PERNT, RSF and NRSF.
Once the formula for EC and EE calculation was defined and the analysis was run, the next stage was the conversion directly into Dynamo of the Shared Parameters required to populate the results associated with a single category directly into the Revit Model. In this way, it is possible to read the EC and EE associated with a single element directly into the “property” panel of the Revit element. The last stage was creating a dynamic diagram into the Dynamo script to calculate the EE and EC total value for the entire building. The diagram is readable into the Dynamo script but can also be saved as .pdf or .html to foster information sharing between stakeholders regarding environmental impact. Therefore, the script is composed of four main blocks:
- The Embodied Carbon calculation;
- The Embodied Energy calculation;
- The Shared Parameters creation;
- The Dynamic Diagrams creation.
2.2.4. Assembling the Script
The following section is dedicated to explaining the script assembly by showing details related to the main blocks employed.
- (a)
- The Embodied Carbon calculation
The Embodied Carbon calculation requires some passages:
- Block A—Import of the chart EPD.xls into Dynamo (GWP kg CO2 eq phase A1–A3).
- (Note: it is necessary to create a template.xls readable by Dynamo), (see Figure 5);
- Block B—Quantities extraction from the Revit Model in kg (category: walls), (see Figure 6);
Repeat the passages for the other architectural categories: floors and stairs.
Block A.

Figure 5.
EPD.xls import in Dynamo.
Figure 5.
EPD.xls import in Dynamo.

Block B.

Figure 6.
Selection of the values needed for the calculation.
Figure 6.
Selection of the values needed for the calculation.

Block C.

Figure 7.
Quantity and typology extraction from the Revit model.
Figure 7.
Quantity and typology extraction from the Revit model.


Figure 8.
Organizing the data.
Figure 8.
Organizing the data.


Figure 9.
Embodied Carbon calculation.
Figure 9.
Embodied Carbon calculation.

- (b)
- The Embodied Energy calculation
The Embodied Energy calculation requires some passages:
- (Note: it is necessary to create a template.xls readable by Dynamo);
- Block C—The Embodied Energy formula: link the quantities in m3 of every architectural category with the PERNT, RSF, NRSF total MJ. The result is the overall MJm3 for the architectural category considered, in this case, walls, (see Figure 14).
Repeat the passages for the other architectural categories: floors and stairs.
Block A.

Figure 10.
Script section related to Embodied Energy calculation.
Figure 10.
Script section related to Embodied Energy calculation.


Figure 11.
EPDs values selection from Excel.
Figure 11.
EPDs values selection from Excel.

Block B.

Figure 12.
Quantities extraction from the Revit model.
Figure 12.
Quantities extraction from the Revit model.


Figure 13.
Sorting the model data.
Figure 13.
Sorting the model data.

Block C.

Figure 14.
Embodied Energy calculation.
Figure 14.
Embodied Energy calculation.

- (c)
- The shared parameters creation
The Shared Parameters (SP) creation is a passage commonly developed into the Revit model. It is needed to link data with multiple families in the format.rvt. However, creating SP into Revit requires medium-high skills in BIM model management. Therefore, the proposal is to build the SP directly into Dynamo so the end-user can skip the passage of the creation and does not need to acquire more competencies in BIM model management.
- Block D—Create the block for the SP and repeat the action for every category involved in the Embodied Carbon and Embodied Energy calculation, in this case, floor, walls, stairs (see Figure 15).
Block D.

Figure 15.
Script part related to Shared Parameters creation.
Figure 15.
Script part related to Shared Parameters creation.

- (d)
- The dynamic diagrams creation
The diagrams block is organized with the following steps:
- Block E—Insert the overall results related to Embodied Carbon calculation (see Figure 16);
- Block F—Choose the type (e.g., pie chart) and the style (colours, lines, etc.) of your Diagram (see Figure 17);
- Block G—Choose the export format: .pdf or .html (see Figure 18).
Block E.

Figure 16.
Reading the values for Embodied Carbon and Embodied Energy.
Figure 16.
Reading the values for Embodied Carbon and Embodied Energy.

Block F.

Figure 17.
Choosing the chart style.
Figure 17.
Choosing the chart style.

Block G.

Figure 18.
Choosing the export format.
Figure 18.
Choosing the export format.

Finally, repeat the passages for the Embodied Energy chart creation.
The graphical output coming from the diagram creation and the possible employment will be explained in detail in the following paragraph. The objective is to highlight the advantages and the disadvantages of the method and to underline the potential of the digital methodology.
3. The Result Restitution
The results from Embodied Carbon (EC) and Embodied Energy (EE) simulations are expressed in two ways:
- Dynamic diagram: simulation results can be exported from Dynamo in .html and .pdf format;
- Revit chart: simulation results for the single architectural element are listed in the model.
Moreover, the results are expressed with two degrees of detail:
- For the single architectural element considered;
- For the overall building.
The first way listed is about diagram creation. In order to obtain the diagrams, a portion of the script was created to transpose the EC and EE calculation into a visual graphic. The diagrams display the information:
- (1)
- EC (kg CO2 eq): (a) for the overall building, (b) for the single architectural element;
- (2)
- EE (MJm3): (a) for the overall building, (b) for the single architectural element.
The benefit of those diagrams lies in the fact that they permit easy reading of the information related to EE and EC with a user-friendly interface. Secondly, the data is “dynamic”, so if you made some changes in terms of quantities in the Revit model, the diagrams change automatically. Moreover, the .html and .pdf are convenient formats to exchange information easily. E.g. Scenario 1, precast concrete (see Figure 19):
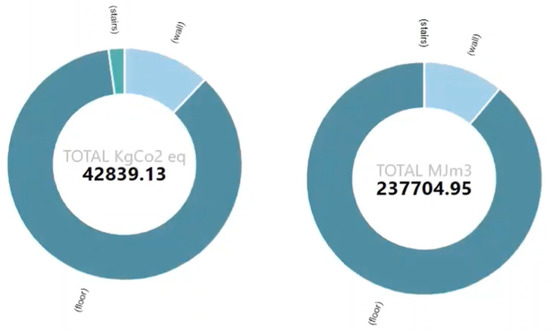
Figure 19.
The dynamic diagrams (.html) for the Embodied Carbon and Embodied Energy calculation related to precast concrete. The graphs show the overall results and the results related to the single architectural element (floor: dark blue; stairs: green; wall: light blue).
The dynamic diagrams allow for the easy creation of scenarios useful for the decision-making processes. For example, we could associate different EPDs to the architectural elements (stairs, floors, walls) of our BIM model and then we could run the script and extract the dynamic diagrams. The result is a fast visual comparison between design alternatives obtained from the script (see Figure 20). Once the graphs have been created, it is possible to save them or to share them with other stakeholders.
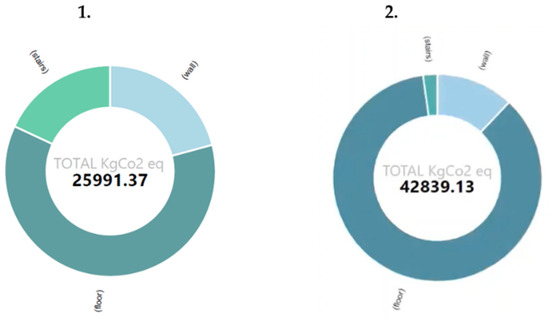
Figure 20.
Comparing the Embodied Carbon scenarios.html for the 1. Aerated Concrete, 2. Precast. The architectural elements considered are floor (dark blue), stairs (green), wall (light blue).
The following achievement will be designing a graphical interface for the Embodied Carbon and Embodied Energy methodology to be supported by pc or mobile devices. The aim is to configure a clear and readable screen that the user can question (see Figure 21). In this way, the interface became an interactive platform to easily support the decision-making process with real-time results. Here is the interface proposal under development:
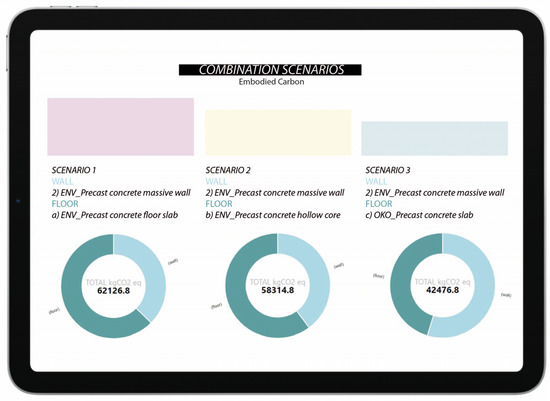
Figure 21.
A possible configuration for mobile devices.
The second way listed relates to the Revit charts. Thanks to the setting of the Sharing Parameters into Dynamo, it is possible to fill the EE and EC results directly into the Revit model. This stage produces dynamic results coming from the simulation directly into the model. By questioning the “Edit Type” and reading the “Energy Analysis” section into the architectural category selected for the simulation, it is possible to read the EC and EE results for the single element (see Figure 22).
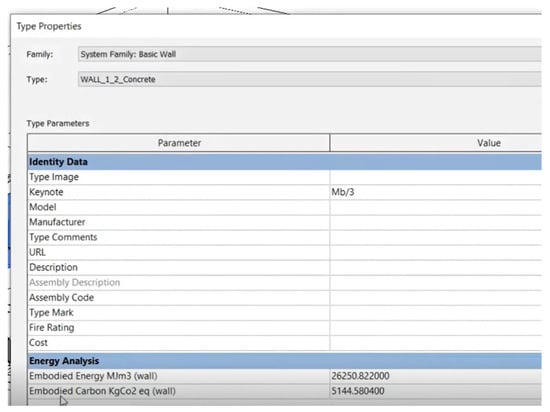
Figure 22.
The results from EE and EC simulations are listed in the “Edit Type” of the Basic Wall system family.
Listing the simulation results into the model makes it possible to easily question every architectural element involved in the simulation and export and share the results by charts with the stakeholders involved in the process. The results can be shared in two ways:
- By sharing the BIM construction model and the Dynamo script. In this way, every stakeholder can question the element and read the results of the simulations;
- By exporting with an abacus.pdf, the EE and EC results for the single architectural element.
In conclusion, the digital methodology allows easy creation of Embodied Energy and Embodied Carbon scenarios that can be read directly into the model or exported in various formats. The creation of the scenarios is easy and dynamic and does not require a high skill level in BIM, visual programming and LCA. By applying the script to the BIM model, it is in fact possible to quickly obtain the impact information related to the product; therefore, no technical skills in LCA simulations are required. This is strategic because simulations can be run during the preliminary design phases when the influence on design choices is great, and the costs of the changes are low. Usually, in fact, LCA methods are applied during the late phase of design where no consistent changes can be applied to the design choices. Therefore, the digital methodology shown is strategic for simulating solutions and improving the design quality in the decision-making processes. Moreover, this kind of simulation could respond to increasing requests in evaluation impact documents and attention regarding sustainable design choices in public tenders in Europe.
The following paragraph is dedicated to investigating the potentiality of the methodology as a game-changer in the construction process and in exploring its performances in improving quality in the design workflow. The discourse is focused on exploring its potential and highlighting the difficulties in innovating the process and the design workflow.
4. Discussion
This section intends to resume the main point of discussion of the article: the background of the research, the objective of the digital methodology, the technical and social achievements, the opportunities and the limitations of innovative evaluation methods compared with traditional ones.
This article is focused on highlighting the potential of new evaluation methods. The discourse is grounded in considering the potential of innovating digital tools in supporting the decision-making processes and the consequent systems of investment planning.
The design project is an increasingly complex task involving multidisciplinary dynamics related to the economic, social, political and environmental spheres. The increasing complexity of the landscape surrounding the design process requires articulated solutions and a net of stakeholders belonging to various fields of investigation. More and more, we see collaborations being born between institutions, private and public entities and academia. The aim is almost always to respond to a real social target [2]. The strength of those models of collaboration lies exactly in the fact that the objective of the research is not theoretical but is grounded in the issues related to contemporary social dynamics. Nowadays, due to increasing interests in sustainable policies and related environmental impact mitigation procedures, the target objects of investigation are usually focused on providing a solution toward sustainable resource consumption and materials production.
This article is, in fact, focused on providing a digital methodology suitable for decision-making processes capable of contributing to the sustainability debate. If the increasing complexity of the design process requires a gradual integration of competencies and stakeholders, it must be emphasized that innovation is helping to break down the barriers between disciplines that orbit around the architectural world. New evaluation methods, such as in this case, grounded on a digital platform and able to manage a mix of stakeholders from the preliminary stages of the design process, provide advantages from various points of view.
- For the academy, construction company and building material providers:
- (a)
- The increase in information exchange means reaching a higher quality in the design process and product;
- (b)
- The methodology allows information sharing between actors from the preliminary design stages. This represents an increase in information exchange with a consequent passage from the traditional linear process to an integrated one.
Moreover, in particular:
- 2.
- For the academy (education-driven) [9]:
- (a)
- The chance to work on real word targets;
- (b)
- An opportunity for knowledge and technology transfer;
- (c)
- Additional economic funds, access to industrial equipment and licensing or patenting income;
- (d)
- Promoting research-based on applied science.
- 3.
- For the industry (profit-driven) [7]:
- (a)
- Improving holistic methodologies and theoretical backgrounds;
- (b)
- Opening perspectives toward pure science;
- (c)
- An opportunity for knowledge and technology sharing;
- (d)
- Access to laboratories and equipment;
- (e)
- Re-skilling of employees;
- (f)
- Improved transparency towards clients and shareholders;
- (g)
- Improved (data drive) awareness of the environmental impact, which can drive systemic change.
The collaboration models and the consequent innovation platforms for evaluation methods help to overcome some issues typical of the traditional design processes, e.g., the incommunicability and the impossibility of creating impact scenarios of processes and products [32]; the difficulties in the relationship between stakeholders during the design process; the difficulties in managing information belonging to multiple and separate documents. The picture illustrates the passage from the traditional process to an integrated one (see Figure 23).
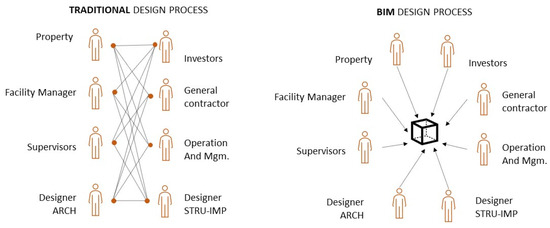
Figure 23.
Traditional design process vs. integrated [32].
The traditional process leads to various interactions that occurred at different times and in separate documents, increasing the possibility of errors and misunderstanding. Moreover, this method implies the creation of multiple and specialized documents. The integrated process instead allows a combination of specialized contributions in real-time and in a single database that connects objects and information. In particular, the dialogue between stakeholders occurred from the early stages of design with a consequent increase in design quality. By considering these premises, the evaluation method for decision making based on the use of digital tools and collaboration between stakeholders allows gains both on the side of the process and the product. In particular, an evaluation method grounded on an integrated design process, as the methodology showed, allows these main advantages:
- The increase in the awareness of the stakeholders both about the process (in terms of tools, resources) and the problems to face;
- The possibility for stakeholders to comprehend the impact (environmental, social, economic and more over) of the product thanks to the simulation scenario;
- The increase in better time management and the consequent reduction in the time spent to run the actions and to obtain design results;
- The improvement in the quality of the product thanks both to simulations and the continued control over the design process.
In particular, adopting the digital methodology explained allows gaining some tangible advantages in terms of process and resources (see Table 6):
Table 6.
Traditional flow vs. digital methodology.
The chart shows the main advantages coming from employing the digital methodology for decision making. The great achievement lies in the chance to apply the evaluation method in the early stages of design when the cost of design changes is low and the influence on design choices is high. The consequence is the improvement in design quality, especially in terms of environmental optimization to accelerate the achievement of SDGs [33].
Currently, the limitations of the methodology lie in some aspects related to the use of parametric modelling and evaluation disciplines:
- There is not at the moment a common format for EPD; moreover, the use of this declaration is currently under development;
- The methodology can be performed only via a computational script at the moment. The following achievement is to define a tailor-made plug-in for BIM models to run the simulation;
- To employ the tool’s potentiality, the user should incorporate parametric and computational software and figures able to manage the digital process in its design method. However, I would like to interpret this last point not as such a limitation but as a suggestion to reach higher levels of innovation.
In conclusion, the design gradually manifests as a complex matter since it incorporates a wave of political, social, economic and environmental issues. Responding to that complexity implies employing articulated instruments and methods. The practice of design can no longer make exclusive use of traditional procedures. Still, it has to open the gates toward the dialogue between actors and institutions, collaboration platforms, participative mechanisms and, in the end, testing the potential of digital tools.
Author Contributions
Conceptualization and methodology S.G., D.G., D.S.R.; software, S.G.; validation, S.G., D.G., D.S.R.; formal analysis and investigation S.G.; resources, S.G.; data curation, S.G., D.G.; writing—original draft preparation, S.G.; writing—review and editing, S.G., D.G., D.S.R., A.O.; visualization, S.G., D.G., D.S.R.; supervision, D.G., D.S.R., A.O.; project administration, D.S.R., A.O. All authors have read and agreed to the published version of the manuscript.
Funding
This research received no external funding.
Institutional Review Board Statement
Not applicable.
Informed Consent Statement
Not applicable.
Data Availability Statement
Publicly available datasets were analyzed in this study. This data can be found here: https://www.oekobaudat.de/no_cache/en/database/search.html (accessed on 10 August 2021).
Acknowledgments
A special thank goes to CRH that entirely financed the PhD research path. The authors also thank professor Kjartan Gudmundsson (KTH) for the support in developing the scripting section.
Conflicts of Interest
The authors declare no conflict of interest.
References
- Causarano, R. Per Un’etica del Progetto; Timia: Roma, Italy, 2017. [Google Scholar]
- De Martin, J.C. Università Futura; Codice Editore: Torino, Italy, 2017. [Google Scholar]
- Brockwell, S.; Horrocks, R. BIM, GIS and Smart Cities: Challenges and Opportunities; Autodesk University: San Rafael, CA, USA, 2020; Available online: https://www.autodesk.com/autodesk-university/article/BIM-GIS-and-Smart-Cities-Challenges-and-Opportunities-2020 (accessed on 15 August 2021).
- Organizzazione Delle Nazioni Unite, Trasformare il nostro mondo: L’Agenda 2030 per lo Sviluppo Sostenibile. 2015. Available online: https://unric.org/it/wp-content/uploads/sites/3/2019/11/Agenda-2030-Onu-italia.pdf (accessed on 15 August 2021).
- Organizzazione Delle Nazioni Unite, Obiettivi per lo Sviluppo Sostenibile. 2015. Available online: https://unric.org/it/agenda-2030/ (accessed on 15 August 2021).
- Sistema per lo Scambio delle Quote di Emissione dell’UE (ETS UE). Available online: https://ec.europa.eu/clima/eu-action/eu-emissions-trading-system-eu-ets_it (accessed on 15 August 2021).
- Rybnicek, R.; Königsgruber, R. What Makes Industry–University Collaboration Succeed? A Systematic Review of the Literature. J. Bus. Econ. 2019, 89, 221–250. [Google Scholar] [CrossRef]
- Myoken, Y. The Role of Geographical Proximity in University and Industry Collaboration: Case Study of Japanese Companies in the UK. Int. J. Technol. Transf. Commer. 2013, 12, 43. [Google Scholar] [CrossRef]
- Barnes, T.; Pashby, I.; Gibbons, A. Effective University–Industry Interaction: A Multi-Case Evaluation of Collaborative R&D Projects. Eur. Manag. J. 2002, 20, 272–285. [Google Scholar]
- Education at a Glance 2015: OECD Indicators Italy. Available online: https://read.oecd-ilibrary.org/education/education-at-a-glance-2015/italy_eag-2015-64-en#page1 (accessed on 15 August 2021).
- Etzkowitz, H.; Leydesdorff, L. The Triple Helix—University-Industry-Government Relations: A Laboratory for Knowledge Based Economic Development. EASST Rev. 1995, 14, 14–19. [Google Scholar]
- Pique, J.M.; Berbegal-Mirabent, J.; Etzkowitz, H. Triple Helix and the Evolution of Ecosystems of Innovation: The Case of Silicon Valley. Triple Helix 2018, 5, 11. [Google Scholar] [CrossRef]
- Ranga, M.; Etzkowitz, H. Triple Helix Systems: An Analytical Framework for Innovation Policy and Practice in the Knowledge Society. Ind. High. Educ. 2013, 27, 237–262. [Google Scholar] [CrossRef]
- Expanding the Horizons of Sustainable Progress; Sustainability Report; CRH: Dublin, Ireland, 2020; Available online: https://www.crh.com/media/3697/crh-2020-sustainability-report.pdf (accessed on 15 August 2021).
- Antón, L.Á.; Díaz, J. Integration of LCA and BIM for Sustainable Construction. Int. J. Civ. Environ. Eng. 2014, 8, 1378–1382. [Google Scholar]
- Lee, S.; Tae, S.; Roh, S.; Kim, T. Green Template for Life Cycle Assessment of Buildings Based on Building Information Modeling: Focus on Embodied Environmental Impact. Sustainability 2015, 7, 16498–16512. [Google Scholar] [CrossRef]
- Najjar, M.; Figueiredo, K.; Palumbo, M.; Haddad, A. Integration of BIM and LCA: Evaluating the environmental impacts of building materials at an early stage of designing a typical office building. J. Build. Eng. 2017, 14, 115–126. [Google Scholar] [CrossRef]
- Röck, M.; Hollberg, A.; Habert, G.; Passer, A. LCA and BIM: Visualization of Environmental Potentials in Building Construction at Early Design Stages. Build. Environ. 2018, 140, 153–161. [Google Scholar] [CrossRef]
- Kylili, A.; Fokaides, P.A.; Vaiciunas, J.; Seduikyte, L. Integration of building information modelling (BIM) and life cycle assessment (LCA) for sustainable constructions. J. Sustain. Archit. Civ. Eng. 2015, 13, 28–38. [Google Scholar] [CrossRef][Green Version]
- Lavagna, M. Life Cycle Assessment in Edilizia. Progettare e Costruire in una Prospettiva di Sostenibilità Ambientale; Hoepli: Milan, Italy, 2008. [Google Scholar]
- Soust-Verdaguer, B.; Llatas, C.; García-Martínez, A. Critical Review of Bim-Based LCA Method to Buildings. Energy Build. 2017, 136, 110–120. [Google Scholar] [CrossRef]
- Shin, Y.; Cho, K. BIM Application to Select Appropriate Design Alternative with Consideration of LCA and LCCA. Math. Probl. Eng. 2015, 2015, 281640. [Google Scholar] [CrossRef]
- Hollberg, A.; Kiss, B.; Röck, M.; Soust-Verdaguer, B.; Wiberg, A.H.; Lasvaux, S.; Galimshina, A.; Habert, G. Review of Visualising LCA Results in the Design Process of Buildings. Build. Environ. 2021, 190, 107530. [Google Scholar] [CrossRef]
- What’s behind the updates to the 2020 Plan of Work. Available online: https://www.ribaj.com/intelligence/updates-to-the-riba-plan-of-work-2019-dale-sinclair-gary-clark (accessed on 15 August 2021).
- Röck, M.; Hollberg, A.; Habert, G.; Passer, A. LCA and BIM: Integrated Assessment and Visualization of Building Elements’ Embodied Impacts for Design Guidance in Early Stages. Procedia CIRP 2018, 69, 218–223. [Google Scholar] [CrossRef]
- Peng, C. Calculation of a Building’s Life Cycle Carbon Emissions Based on Ecotect and Building Information Modeling. J. Clean. Prod. 2016, 112, 453–465. [Google Scholar] [CrossRef]
- Seo, S.; Tucker, S.; Newton, P. Automated Material Selection and Environmental Assessment in the Context of 3D Building Modelling. J. Green Build. 2007, 2, 51–61. [Google Scholar] [CrossRef]
- Basbagill, J.; Flager, F.; Lepech, M.; Fischer, M. Application of Life-Cycle Assessment to Early Stage Building Design for Reduced Embodied Environmental Impacts. Build. Environ. 2013, 60, 81–92. [Google Scholar] [CrossRef]
- UNI EN 15804:2019 | Dichiarazioni Ambientali di Prodotto. Available online: https://www.certifico.com/costruzioni/370-news-costruzioni/9658-uni-en-15804-2019-dichiarazioni-ambientali-di-prodotto (accessed on 15 August 2021).
- EPD—La Dichiarazione Ambientale di Prodotto. Available online: https://www.epditaly.it/epd-2/ (accessed on 12 July 2021).
- Sustainable Construction Information Portal. Available online: https://www.oekobaudat.de/no_cache/en/database/search.html (accessed on 12 July 2021).
- Novembri, G.; Rossini, F.; Fioravanti, A. Improving the integration between BIMs and agent-based simulations: The Swarm Building Modeling—SBM. In eWork and eBusiness in Architecture, Engineering and Construction; CRC Press: Boca Raton, FL, USA, 2018; pp. 123–126. [Google Scholar]
- Huan, Y.; Liang, T.; Li, H.; Zhang, C. A systematic method for assessing progress of achieving sustainable development goals: A case study of 15 countries. Sci. Total. Environ. 2021, 752, 141875. [Google Scholar] [CrossRef] [PubMed]


Publisher’s Note: MDPI stays neutral with regard to jurisdictional claims in published maps and institutional affiliations. |
© 2021 by the authors. Licensee MDPI, Basel, Switzerland. This article is an open access article distributed under the terms and conditions of the Creative Commons Attribution (CC BY) license (https://creativecommons.org/licenses/by/4.0/).