
Impact of Environmental Conditions and Management on Soil Arthropod Communities in Vineyard Ecosystems

 ,
,  , , ,
, , ,
Abstract
:1. Introduction
2. Materials and Methods
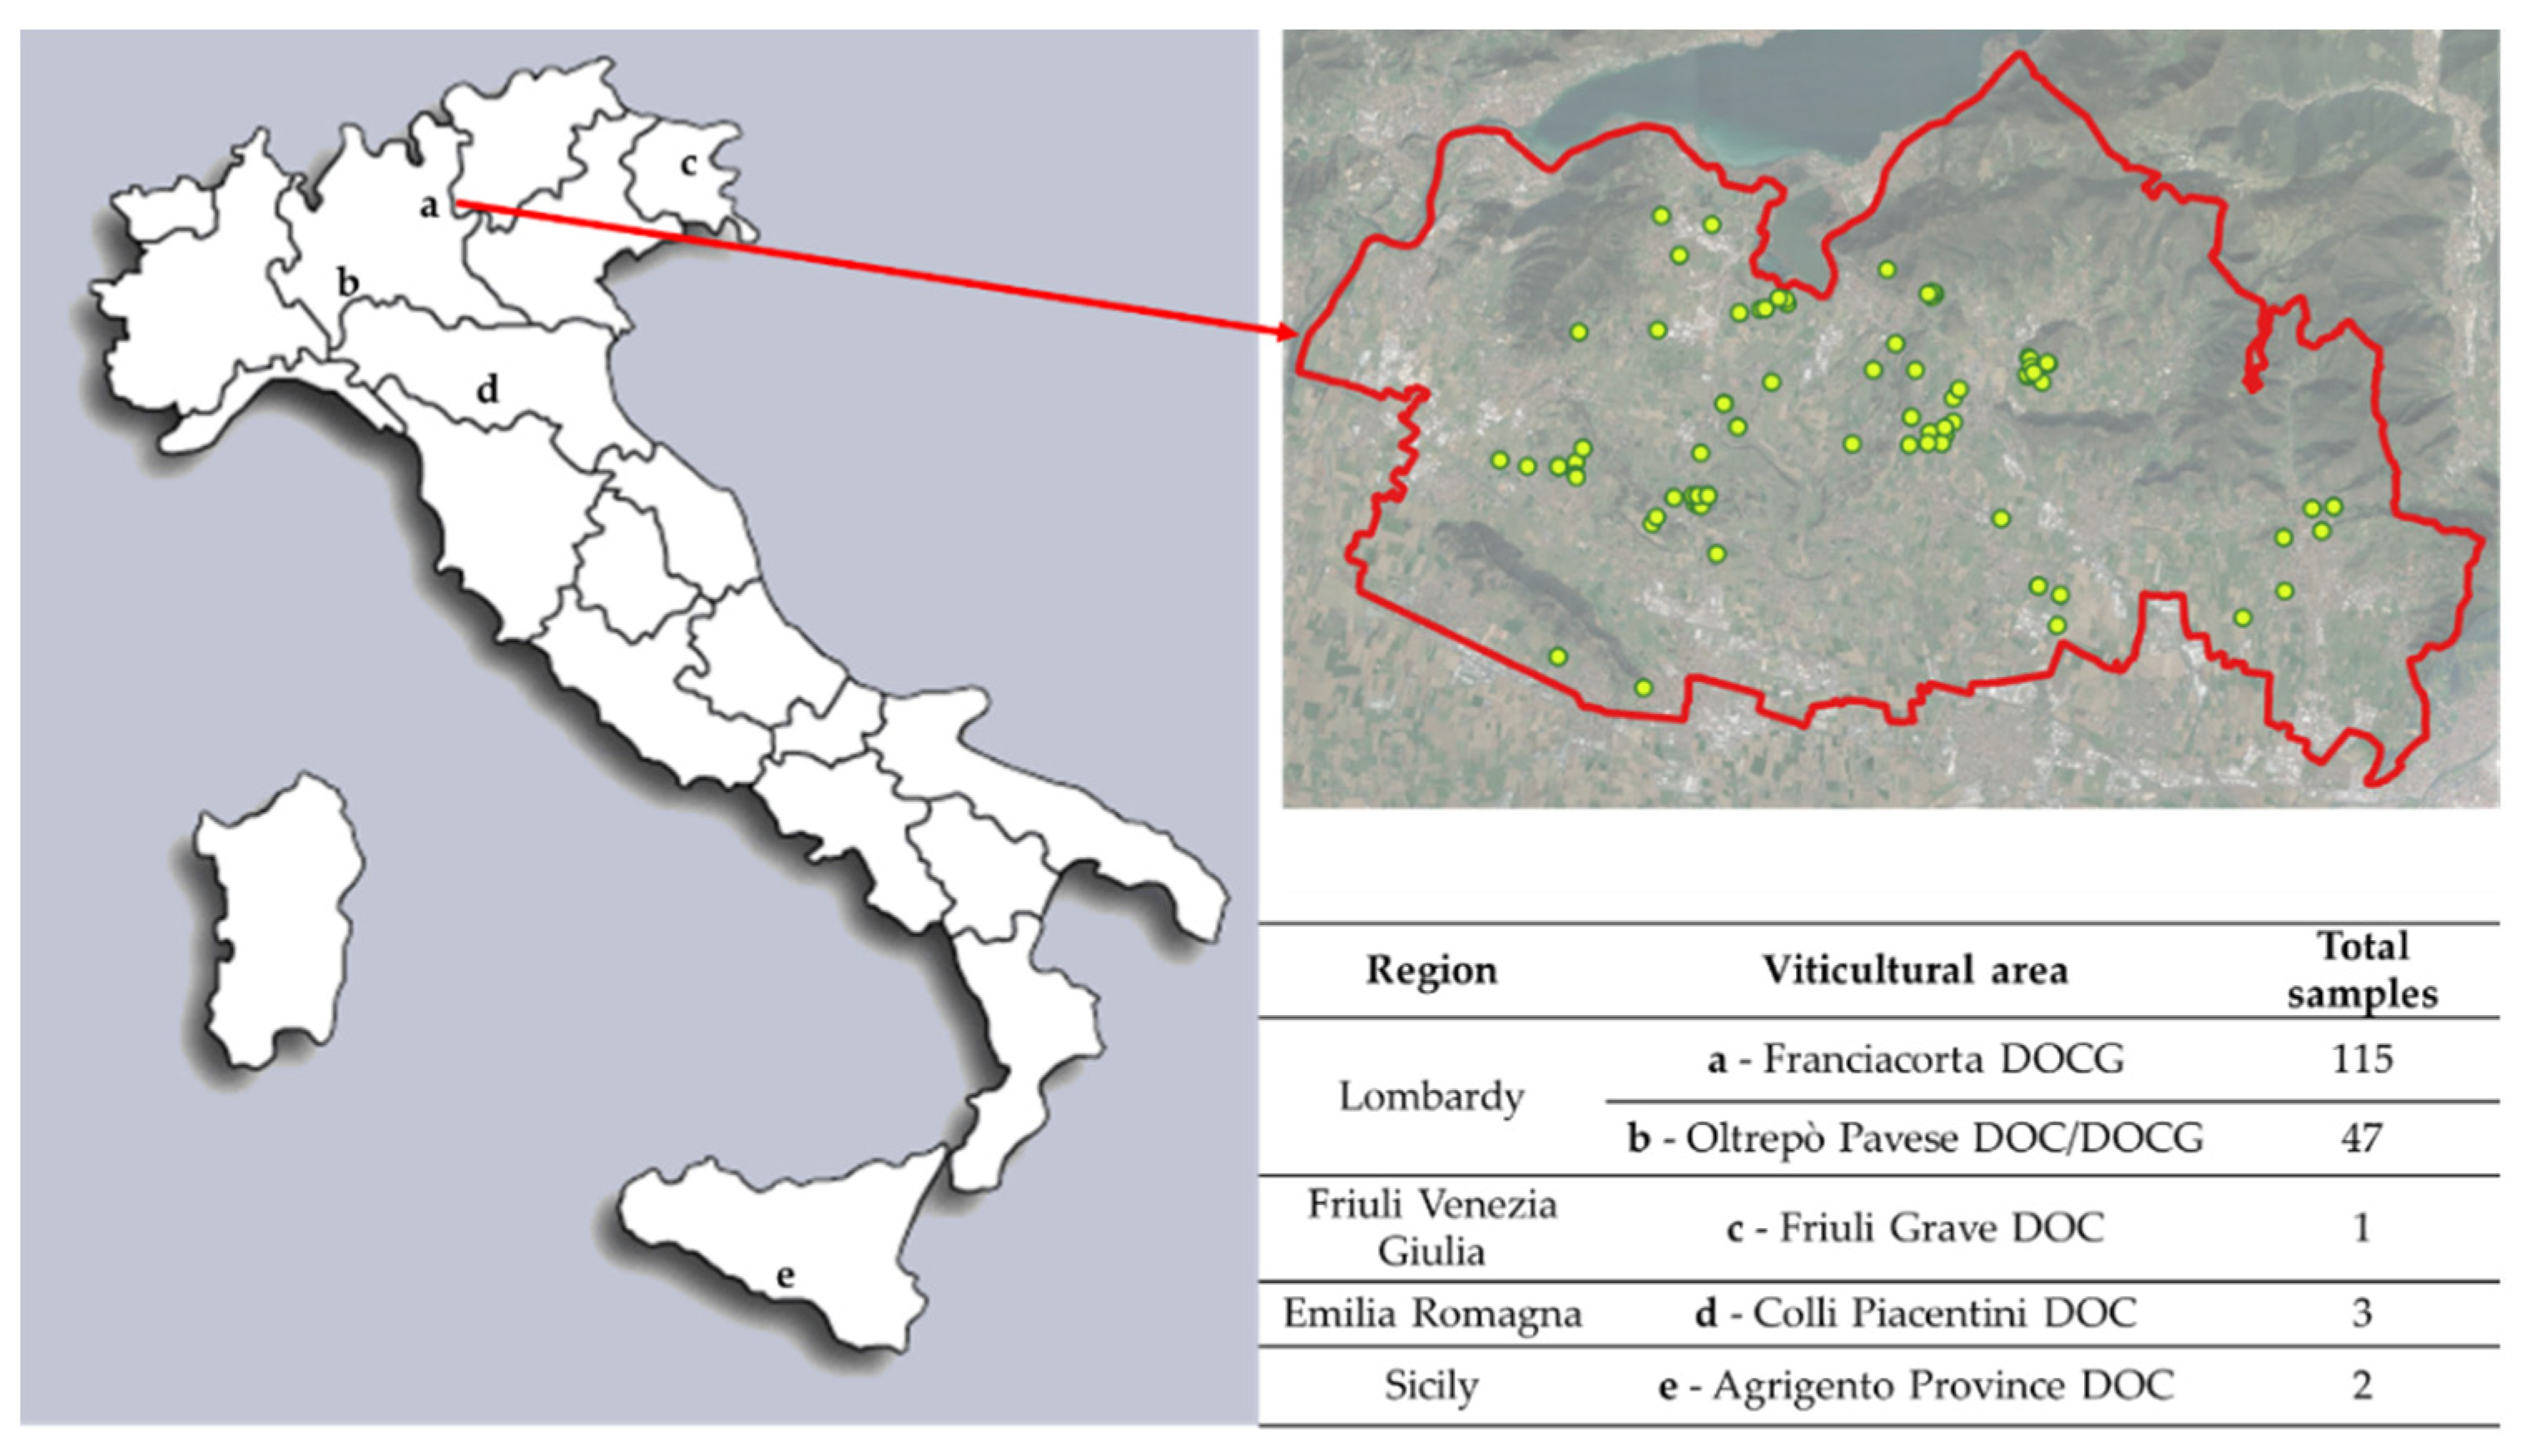
2.1. Study Sites Description
2.2. Abiotic Variables
2.3. Vineyard Age and Management Variables
2.4. Soil Biological Quality Evaluation (QBS-ar)
2.5. Data Analysis
3. Results
3.1. Descriptive Analysis
3.2. Linear Regression Analysis
3.3. Effect of Abiotic Variables
3.4. Effect of Management Variables
4. Discussion and Conclusions
Author Contributions
Funding
Acknowledgments
Conflicts of Interest
References
- Bünemann, E.K.; Bongiorno, G.; Bai, Z.; Creamer, R.E.; De Deyn, G.; de Goede, R.; Fleskens, L.; Geissen, V.; Kuyper, T.W.; Mäder, P.; et al. Soil Quality—A Critical Review. Soil Biol. Biochem. 2018, 120, 105–125. [Google Scholar] [CrossRef]
- Doran, J.W.; Zeiss, M.R. Soil Health and Sustainability: Managing the Biotic Component of Soil Quality. Appl. Soil Ecol. 2000, 15, 3–11. [Google Scholar] [CrossRef] [Green Version]
- Geisen, S.; Briones, M.J.I.; Gan, H.; Behan-Pelletier, V.M.; Friman, V.-P.; de Groot, G.A.; Hannula, S.E.; Lindo, Z.; Philippot, L.; Tiunov, A.V.; et al. A Methodological Framework to Embrace Soil Biodiversity. Soil Biol. Biochem. 2019, 136, 107536. [Google Scholar] [CrossRef]
- Bagyaraj, D.J.; Nethravathi, C.J.; Nitin, K.S. Soil biodiversity and arthropods: Role in soil fertility. In Economic and Ecological Significance of Arthropods in Diversified Ecosystems; Springer: Singapore, 2016; pp. 17–51. [Google Scholar]
- van Straalen, N.M. Evaluation of Bioindicator Systems Derived from Soil Arthropod Communities. Appl. Soil Ecol. 1998, 9, 429–437. [Google Scholar] [CrossRef]
- Büchs, W. Biotic Indicators for Biodiversity and Sustainable Agriculture—Introduction and Background. Agric. Ecosyst. Environ. 2003, 98, 1–16. [Google Scholar] [CrossRef]
- De Oliviera Filho, L.C.I.; Zeppelini, D.; Sousa, J.P.; Baretta, D.; Klauberg-Filho, O. Collembola Community Structure under Different Land Management in Subtropical Brazil. Ann. Appl. Biol. 2020, 177, 294–307. [Google Scholar] [CrossRef]
- Domínguez, A.; Jiménez, J.J.; Ortíz, C.E.; Bedano, J.C. Soil Macrofauna Diversity as a Key Element for Building Sustainable Agriculture in Argentine Pampas. Acta Oecologica 2018, 92, 102–116. [Google Scholar] [CrossRef]
- Gkisakis, V.; Volakakis, N.; Kollaros, D.; Bàrberi, P.; Kabourakis, E.M. Soil Arthropod Community in the Olive Agroecosystem: Determined by Environment and Farming Practices in Different Management Systems and Agroecological Zones. Agric. Ecosyst. Environ. 2016, 218, 178–189. [Google Scholar] [CrossRef]
- Sapkota, T.B.; Mazzoncini, M.; Bàrberi, P.; Antichi, D.; Silvestri, N. Fifteen Years of No till Increase Soil Organic Matter, Microbial Biomass and Arthropod Diversity in Cover Crop-Based Arable Cropping Systems. Agron. Sustain. Dev. 2012, 32, 853–863. [Google Scholar] [CrossRef]
- Ponce, C.; Bravo, C.; de León, D.G.; Magaña, M.; Alonso, J.C. Effects of Organic Farming on Plant and Arthropod Communities: A Case Study in Mediterranean Dryland Cereal. Agric. Ecosyst. Environ. 2011, 141, 193–201. [Google Scholar] [CrossRef]
- Diekötter, T.; Wamser, S.; Wolters, V.; Birkhofer, K. Landscape and Management Effects on Structure and Function of Soil Arthropod Communities in Winter Wheat. Agric. Ecosyst. Environ. 2010, 137, 108–112. [Google Scholar] [CrossRef]
- Sirrine, J.R.; Letourneau, D.K.; Shennan, C.; Sirrine, D.; Fouch, R.; Jackson, L.; Mages, A. Impacts of Groundcover Management Systems on Yield, Leaf Nutrients, Weeds, and Arthropods of Tart Cherry in Michigan, USA. Agric. Ecosyst. Environ. 2008, 125, 239–245. [Google Scholar] [CrossRef]
- Gunadi, B.; Edwards, C.A.; Arancon, N.Q. Changes in Trophic Structure of Soil Arthropods after the Application of Vermicomposts. Eur. J. Soil Biol. 2002, 38, 161–165. [Google Scholar] [CrossRef]
- Hadjicharalampous, E.; Kalburtji, K.L.; Mamolos, A.P. Soil Arthropods (Coleoptera, Isopoda) in Organic and Conventional Agroecosystems. Environ. Manag. 2002, 29, 683–690. [Google Scholar] [CrossRef]
- Marasas, M.E.; Sarandón, S.J.; Cicchino, A.C. Changes in Soil Arthropod Functional Group in a Wheat Crop under Conventional and No Tillage Systems in Argentina. Appl. Soil Ecol. 2001, 18, 61–68. [Google Scholar] [CrossRef]
- Büchs, W.; Harenberg, A.; Zimmermann, J.; Weiß, B. Biodiversity, the Ultimate Agri-Environmental Indicator?: Potential and Limits for the Application of Faunistic Elements as Gradual Indicators in Agroecosystems. Agric. Ecosyst. Environ. 2003, 98, 99–123. [Google Scholar] [CrossRef]
- Parisi, V. La qualità biologica del suolo. Un metodo basato sui microartropodi. Acta Nat. L’Ateneo Parmense 2001, 37, 105–114. [Google Scholar]
- Parisi, V.; Menta, C.; Gardi, C.; Jacomini, C.; Mozzanica, E. Microarthropod Communities as a Tool to Assess Soil Quality and Biodiversity: A New Approach in Italy. Agric. Ecosyst. Environ. 2005, 105, 323–333. [Google Scholar] [CrossRef]
- Menta, C.; Conti, F.D.; Pinto, S. Microarthropods Biodiversity in Natural, Seminatural and Cultivated Soils—QBS-ar Approach. Appl. Soil Ecol. 2018, 123, 740–743. [Google Scholar] [CrossRef]
- Menta, C.; Leoni, A.; Gardi, C.; Conti, F.D. Are Grasslands Important Habitats for Soil Microarthropod Conservation? Biodivers. Conserv. 2011, 20, 1073–1087. [Google Scholar] [CrossRef]
- Menta, C. Agriculture Management and Soil Fauna Monitoring: The Case of Emilia-Romagna Region (Italy). ARTOAJ 2017, 4, 555649. [Google Scholar] [CrossRef] [Green Version]
- Galli, L.; Capurro, M.; Menta, C.; Rellini, I. Is the QBS-ar Index a Good Tool to Detect the Soil Quality in Mediterranean Areas? A Cork Tree Quercus suber L. (Fagaceae) Wood as a Case of Study. Ital. J. Zool. 2014, 81, 126–135. [Google Scholar] [CrossRef]
- Blasi, S.; Menta, C.; Balducci, L.; Conti, F.D.; Petrini, E.; Piovesan, G. Soil Microarthropod Communities from Mediterranean Forest Ecosystems in Central Italy under Different Disturbances. Environ. Monit. Assess. 2013, 185, 1637–1655. [Google Scholar] [CrossRef] [Green Version]
- Mazzoncini, M.; Canali, S.; Giovannetti, M.; Castagnoli, M.; Tittarelli, F.; Antichi, D.; Nannelli, R.; Cristani, C.; Bàrberi, P. Comparison of Organic and Conventional Stockless Arable Systems: A Multidisciplinary Approach to Soil Quality Evaluation. Appl. Soil Ecol. 2010, 44, 124–132. [Google Scholar] [CrossRef]
- Zucca, C.; Canu, A.; Previtali, F. Soil Degradation by Land Use Change in an Agropastoral Area in Sardinia (Italy). CATENA 2010, 83, 46–54. [Google Scholar] [CrossRef]
- Tabaglio, V.; Gavazzi, C.; Menta, C. Physico-Chemical Indicators and Microarthropod Communities as Influenced by No-till, Conventional Tillage and Nitrogen Fertilisation after Four Years of Continuous Maize. Soil Tillage Res. 2009, 105, 135–142. [Google Scholar] [CrossRef]
- OIV. Statistical Report on World Vitiviniculture. 2020. Available online: http://www.oiv.int/en/technical-standards-and-documents/statistical-analysis/state-of-vitiviniculture (accessed on 29 July 2021).
- Karimi, B.; Cahurel, J.-Y.; Gontier, L.; Charlier, L.; Chovelon, M.; Mahé, H.; Ranjard, L. A Meta-Analysis of the Ecotoxicological Impact of Viticultural Practices on Soil Biodiversity. Environ. Chem. Lett. 2020, 18, 1947–1966. [Google Scholar] [CrossRef]
- Ghiglieno, I.; Simonetto, A.; Donna, P.; Tonni, M.; Valenti, L.; Bedussi, F.; Gilioli, G. Soil Biological Quality Assessment to Improve Decision Support in the Wine Sector. Agronomy 2019, 9, 593. [Google Scholar] [CrossRef] [Green Version]
- Fiera, C.; Ulrich, W.; Popescu, D.; Buchholz, J.; Querner, P.; Bunea, C.-I.; Strauss, P.; Bauer, T.; Kratschmer, S.; Winter, S.; et al. Tillage Intensity and Herbicide Application Influence Surface-Active Springtail (Collembola) Communities in Romanian Vineyards. Agric. Ecosyst. Environ. 2020, 300, 107006. [Google Scholar] [CrossRef]
- Gonçalves, F.; Nunes, C.; Carlos, C.; López, Á.; Oliveira, I.; Crespí, A.; Teixeira, B.; Pinto, R.; Costa, C.A.; Torres, L. Do Soil Management Practices Affect the Activity Density, Diversity, and Stability of Soil Arthropods in Vineyards? Agric. Ecosyst. Environ. 2020, 294, 106863. [Google Scholar] [CrossRef]
- Bordoni, M.; Vercesi, A.; Maerker, M.; Ganimede, C.; Reguzzi, M.C.; Capelli, E.; Wei, X.; Mazzoni, E.; Simoni, S.; Gagnarli, E.; et al. Effects of Vineyard Soil Management on the Characteristics of Soils and Roots in the Lower Oltrepò Apennines (Lombardy, Italy). Sci. Total Environ. 2019, 693, 133390. [Google Scholar] [CrossRef] [PubMed]
- Gagnarli, E.; Goggioli, D.; Tarchi, F.; Guidi, S.; Nannelli, R.; Vignozzi, N.; Valboa, G.; Lottero, M.R.; Corino, L.; Simoni, S. Case Study of Microarthropod Communities to Assess Soil Quality in Different Managed Vineyards. SOIL 2015, 1, 527–536. [Google Scholar] [CrossRef] [Green Version]
- Bruggisser, O.T.; Schmidt-Entling, M.H.; Bacher, S. Effects of Vineyard Management on Biodiversity at Three Trophic Levels. Biol. Conser. 2010, 143, 1521–1528. [Google Scholar] [CrossRef] [Green Version]
- Costantini, E.A.C.; Agnelli, A.E.; Fabiani, A.; Gagnarli, E.; Mocali, S.; Priori, S.; Simoni, S.; Valboa, G. Short-Term Recovery of Soil Physical, Chemical, Micro- and Mesobiological Functions in a New Vineyard under Organic Farming. SOIL 2015, 1, 443–457. [Google Scholar] [CrossRef] [Green Version]
- Muñoz-Sabater, J.; Dutra, E.; Agusti-Panareda, A.; Albergel, C.; Arduini, G.; Balsamo, G.; Boussetta, S.; Choulga, M.; Harrigan, S.; Hersbach, H.; et al. ERA5-Land: A State-of-the-Art Global Reanalysis Dataset for Land Applications. Earth Sys. Sci. Data 2021, 13, 4349–4389. [Google Scholar] [CrossRef]
- Schulzweida, U. CDO User Guide (1.9.8). 2019. Available online: ftp://cscftp.sadc.int/regcm-training/Day3/cdo.pdf (accessed on 29 July 2021).
- Ghiglieno, I.; Simonetto, A.; Orlando, F.; Donna, P.; Tonni, M.; Valenti, L.; Gilioli, G. Response of the Arthropod Community to Soil Characteristics and Management in the Franciacorta Viticultural Area (Lombardy, Italy). Agronomy 2020, 10, 740. [Google Scholar] [CrossRef]
- Scheffe, C.; Monger, K.; Ditzler, H.C. (Eds.) Soil science division staff. Soil survey manual. In USDA 492 Handbook 18; Government Printing Office: Washington, DC, USA, 2017; p. 125. [Google Scholar]
- Perelli, M. Le analisi del terreno. Inf. Agr. 1987, 43, 66. [Google Scholar]
- ARPA Veneto. L’interpretazione Delle Analisi del Terreno, Strumento per la Sostenibilità Ambientale. 2007. Available online: https://www.arpa.veneto.it/arpavinforma/pubblicazioni/linterpretazione-delle-analisiterreno#:~:text=Descrizione%3A%20L’analisi%20del%20terreno,’azoto%2C%20i%20microelementied%20altri (accessed on 29 July 2021).
- Regione Liguria. Guida All’interpretazione Agronomica Dell’analisi Chimica del Suolo. Available online: http://webcache.googleusercontent.com/search?q=cache:YtRFatYfaOAJ:www.agriligurianet.it/it/impresa/assistenza-tecnica-e-centri-serivizio/laboratorio-analisi-terreni-e-produzioni-vegetali/interpretazione-agronomica/item/download/1495_3cd8d092dc35cb574cbc9ce7b36d1817.html+&cd=1&hl=it&ct=clnk&gl=it (accessed on 29 July 2021).
- Menta, C.; Conti, F.D.; Pinto, S.; Bodini, A. Soil Biological Quality Index (QBS-ar): 15 Years of Application at Global Scale. Ecol. Indic. 2018, 85, 773–780. [Google Scholar] [CrossRef]
- Venables, W.N.; Ripley, B.D. Modern Applied Statistics with S: Statistics and Computing, 4th ed.; Springer: New York, NY, USA, 2002; ISBN 978-0-387-95457-8. [Google Scholar]
- Yamashita, T.; Yamashita, K.; Kamimura, R. A Stepwise AIC Method for Variable Selection in Linear Regression. Commun. Stat. Theory Methods 2007, 36, 2395–2403. [Google Scholar] [CrossRef]
- Madej, G.; Barczyk, G.; Gdawiec, M. Evaluation of Soil Biological Quality Index (QBS-ar): Its Sensitivity and Usefulness in the Post-Mining Chronosequence—Preliminary Research. Pol. J. Environ. Stud. 2011, 5, 1367–1372. [Google Scholar]
- Gardi, C.; Menta, C.; Leoni, A. Evaluation of the Environmental Impact of Agricultural Management Practices Using Soil Microarthropods. Fresenius Environ. Bull. 2008, 18, 1165–1169. [Google Scholar]
- Cossins, A. Temperature Biology of Animals; Springer: Amsterdam, The Netherlands, 1987; ISBN 978-94-010-7906-8. [Google Scholar]
- Taylor, F. Ecology and Evolution of Physiological Time in Insects. Am. Nat. 1981, 117, 1–23. [Google Scholar] [CrossRef]
- Ikemoto, T. Intrinsic Optimum Temperature for Development of Insects and Mites. Environ. Entomol. 2005, 34, 1377–1387. [Google Scholar] [CrossRef]
- Choi, W.I.; Ryoo, M.I.; Kim, J.-G. Biology of Paronychiurus Kimi(Collembola: Onychiuridae) under the Influence of Temperature, Humidity and Nutrition. Pedobiologia 2002, 46, 548–557. [Google Scholar] [CrossRef]
- Hassall, M.; VIsser, S.; Parkinson, D. Vertical Migration of Onychiurus Subtenuis (Collembola) in Relation to Rainfall and Microbial Activity. Pedobiologia 1986, 29, 175–182. [Google Scholar]
- Stillman, J.H. Acclimation Capacity Underlies Susceptibility to Climate Change. Science 2003, 301, 65. [Google Scholar] [CrossRef] [PubMed] [Green Version]
- Clark, M.S.; Thorne, M.A.; Purać, J.; Grubor-Lajšić, G.; Kube, M.; Reinhardt, R.; Worland, M.R. Surviving Extreme Polar Winters by Desiccation: Clues from Arctic Springtail (Onychiurus Arcticus) EST Libraries. BMC Genom. 2007, 8, 475. [Google Scholar] [CrossRef] [Green Version]
- Choi, W.I.; Moorhead, D.L.; Neher, D.A.; Ryoo, M.I. A Modeling Study of Soil Temperature and Moisture Effects on Population Dynamics of Paronychiurus Kimi (Collembola: Onychiuridae). Biol. Fertil. Soils 2006, 43, 69–75. [Google Scholar] [CrossRef]
- Reddy, M.V.; Venkataiah, B. Seasonal Abundance of Soil-Surface Arthropods in Relation to Some Meteorological and Edaphic Variables of the Grassland and Tree-Planted Areas in a Tropical Semi-Arid Savanna. Int. J. Biometeorol. 1990, 34, 49–59. [Google Scholar] [CrossRef]
- Tao, Y.; Wang, Z.; Ma, C.; He, H.; Xu, J.; Jin, Y.; Wang, H.; Zheng, X. Vegetation Heterogeneity Effects on Soil Macro-Arthropods in an Alpine Tundra of the Changbai Mountains, China. Plants 2019, 8, 418. [Google Scholar] [CrossRef] [Green Version]
- Briones, M.J.I. The Serendipitous Value of Soil Fauna in Ecosystem Functioning: The Unexplained Explained. Front. Environ. Sci. 2018, 6, 149. [Google Scholar] [CrossRef]
- van Capelle, C.; Schrader, S.; Brunotte, J. Tillage-Induced Changes in the Functional Diversity of Soil Biota—A Review with a Focus on German Data. Eur. J. Soil Biol. 2012, 50, 165–181. [Google Scholar] [CrossRef]
- Menta, C.; Conti, F.D.; Fondón, C.L.; Staffilani, F.; Remelli, S. Soil Arthropod Responses in Agroecosystem: Implications of Different Management and Cropping Systems. Agron. 2020, 10, 982. [Google Scholar] [CrossRef]
- Conti, F. Conservation Agriculture and Soil Fauna: Only Benefits or Also Potential Threats? A Review. EC Agric. 2015, 2, 473–482. [Google Scholar]

| Factors | Units | Mean ± SD * | Range (Minimum, Maximum) |
|---|---|---|---|
| Vineyard age | years | 13.3 ± 6.7 | 1.0–41.0 |
| MH | Pure number | 0.55 ± 0.47 | 0.00–2.34 |
| MD | Pure number | 1.50 ± 1.32 | 0.02–4.80 |
| TL | °C | 111 ± 40 | 53–184 |
| TH | °C | 38.8 ± 31.5 | 0.5–99.8 |
| medium_T_min | °C | 17.4 ± 3.6 | 10.5–24.1 |
| medium_T_max | °C | 22.1 ± 3.8 | 14.1–29.2 |
| medium_T_med | °C | 19.3 ± 3.5 | 12.9–26.5 |
| medium_M_med | m3 m−3 | 0.31 ± 0.06 | 0.19–0.42 |
| DD_hot | °DD | 0.29 ± 0.95 | 0.00–6.23 |
| DD_cold | °DD | 0.09 ± 0.36 | 0.00–3.31 |
| DD_warm | °DD | 79.4 ± 64.8 | 0.0–219.9 |
| short_T_min | °C | 16.9 ± 3.1 | 10.6–23.8 |
| short_T_max | °C | 21.7 ± 3.4 | 16.3–30.8 |
| short_T_med | °C | 19.3 ± 3.0 | 13.7–27.1 |
| short_M_med | m3 m−3 | 0.32 ± 0.05 | 0.16–0.41 |
| QBS-ar | 113 ± 46 | 11–226 |
| Factors | Categories | Freq. Dist. | Factors. | Categories | Freq. Distr. |
|---|---|---|---|---|---|
| Vineyard age | 0 < vineyard age ≤ 3 4 ≤ vineyard age < 10 11 ≤ vineyard age ≤ 20 vineyard age > 20 | 3.6% 28.6% 56.0% 11.9% | Vineyard management | conventional organic ≤ 3 3 < organic ≤ 9 organic < 9 | 19.6% 33.3% 28.6% 18.5% |
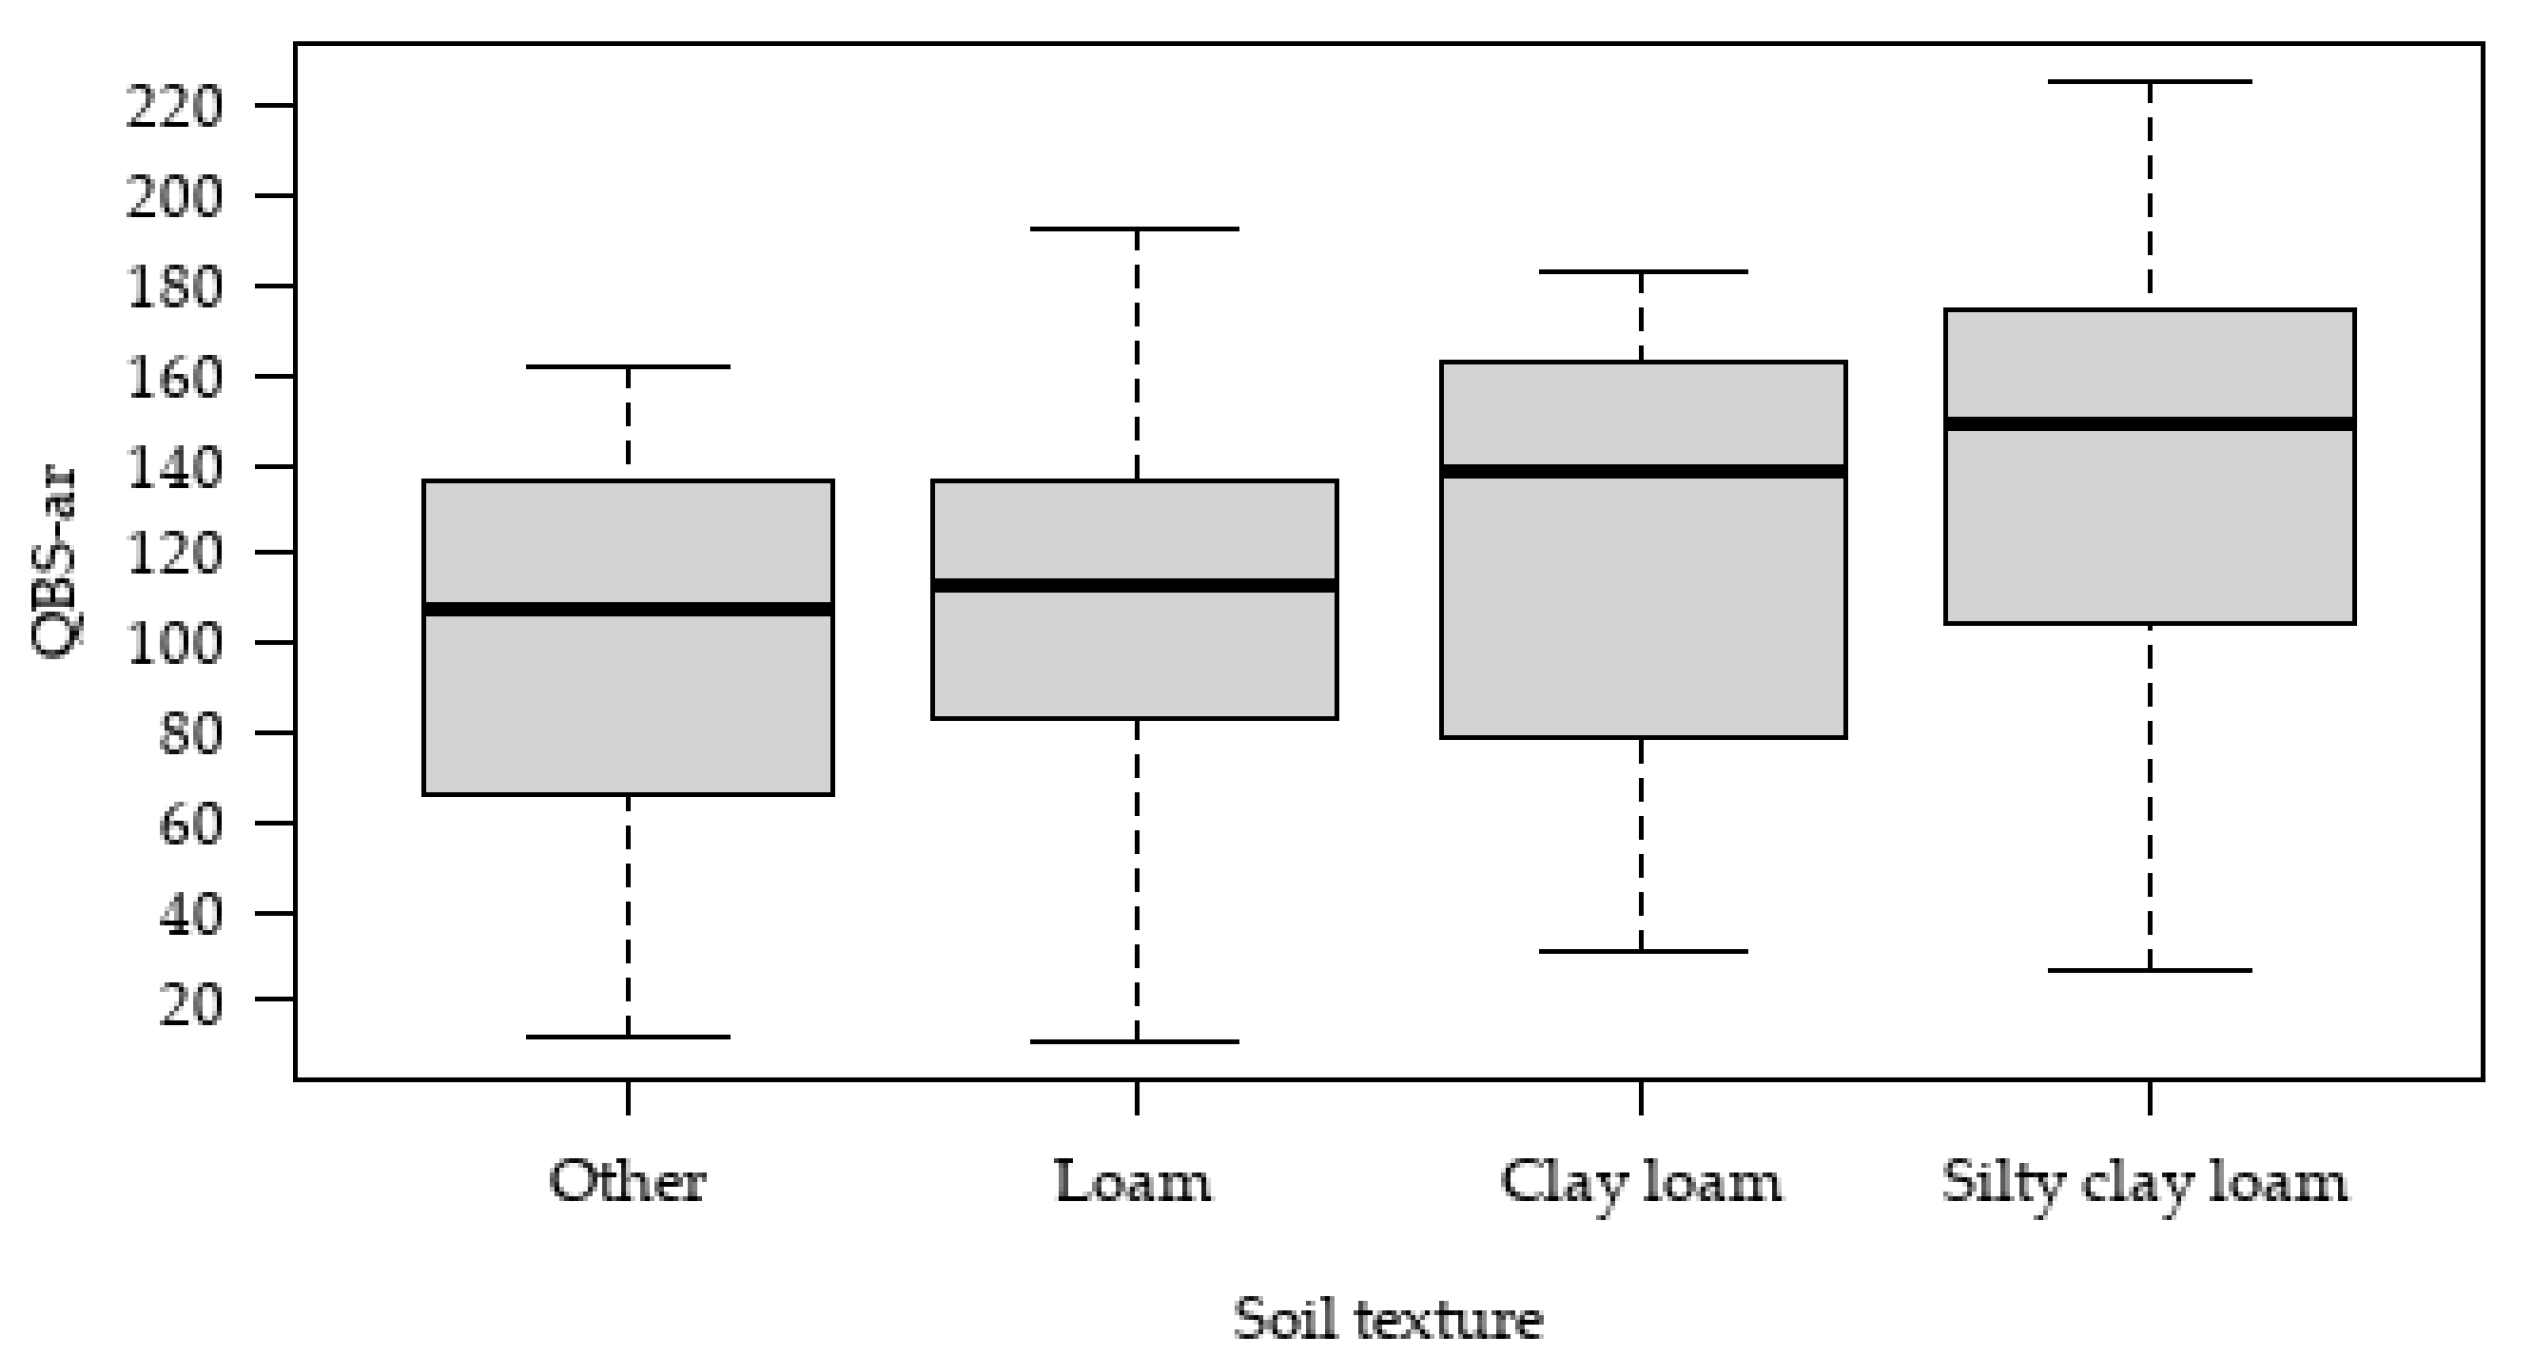
| Soil texture | clay/clay loam/silty clay silty clay loam loam silt loam sandy loam | 10.1% 20.8% 28.0% 16.1% 25.0% | P | very low < 14 * low 14 ÷ 28 * medium 28 ÷ 45 * high 45 ÷ 70 * very high > 70 * | 13.7% 29.8% 16.7% 24.4% 15.5% |
| SOM | low 8 ÷ 12 ** medium 12 ÷ 20 ** good 20 ÷ 40 ** | 16.7% 23.2% 60.1% | pH | acid 5.5 ÷ 6.0 sub-acid 6.1 ÷ 6.7 sub-alkaline 7.3 ÷ 7.9 alkaline 8.0 ÷ 8.6 | 13.7% 20.8% 25.6% 39.9% |
| Mg | very Low < 83 *** low 83 ÷ 166 *** medium 167 ÷ 249 *** good 250 ÷ 332 *** rich 333 ÷ 414 *** very rich > 414 *** | 4.8% 32.7% 22.6% 10.7% 6.0% 23.8% | K | low 48 ÷ 96 **** medium 97 ÷ 145 **** good 146 ÷ 217 **** rich 218 ÷ 289 **** very rich > 289 **** | 22.6% 23.2% 32.8% 15.5% 6.0% |
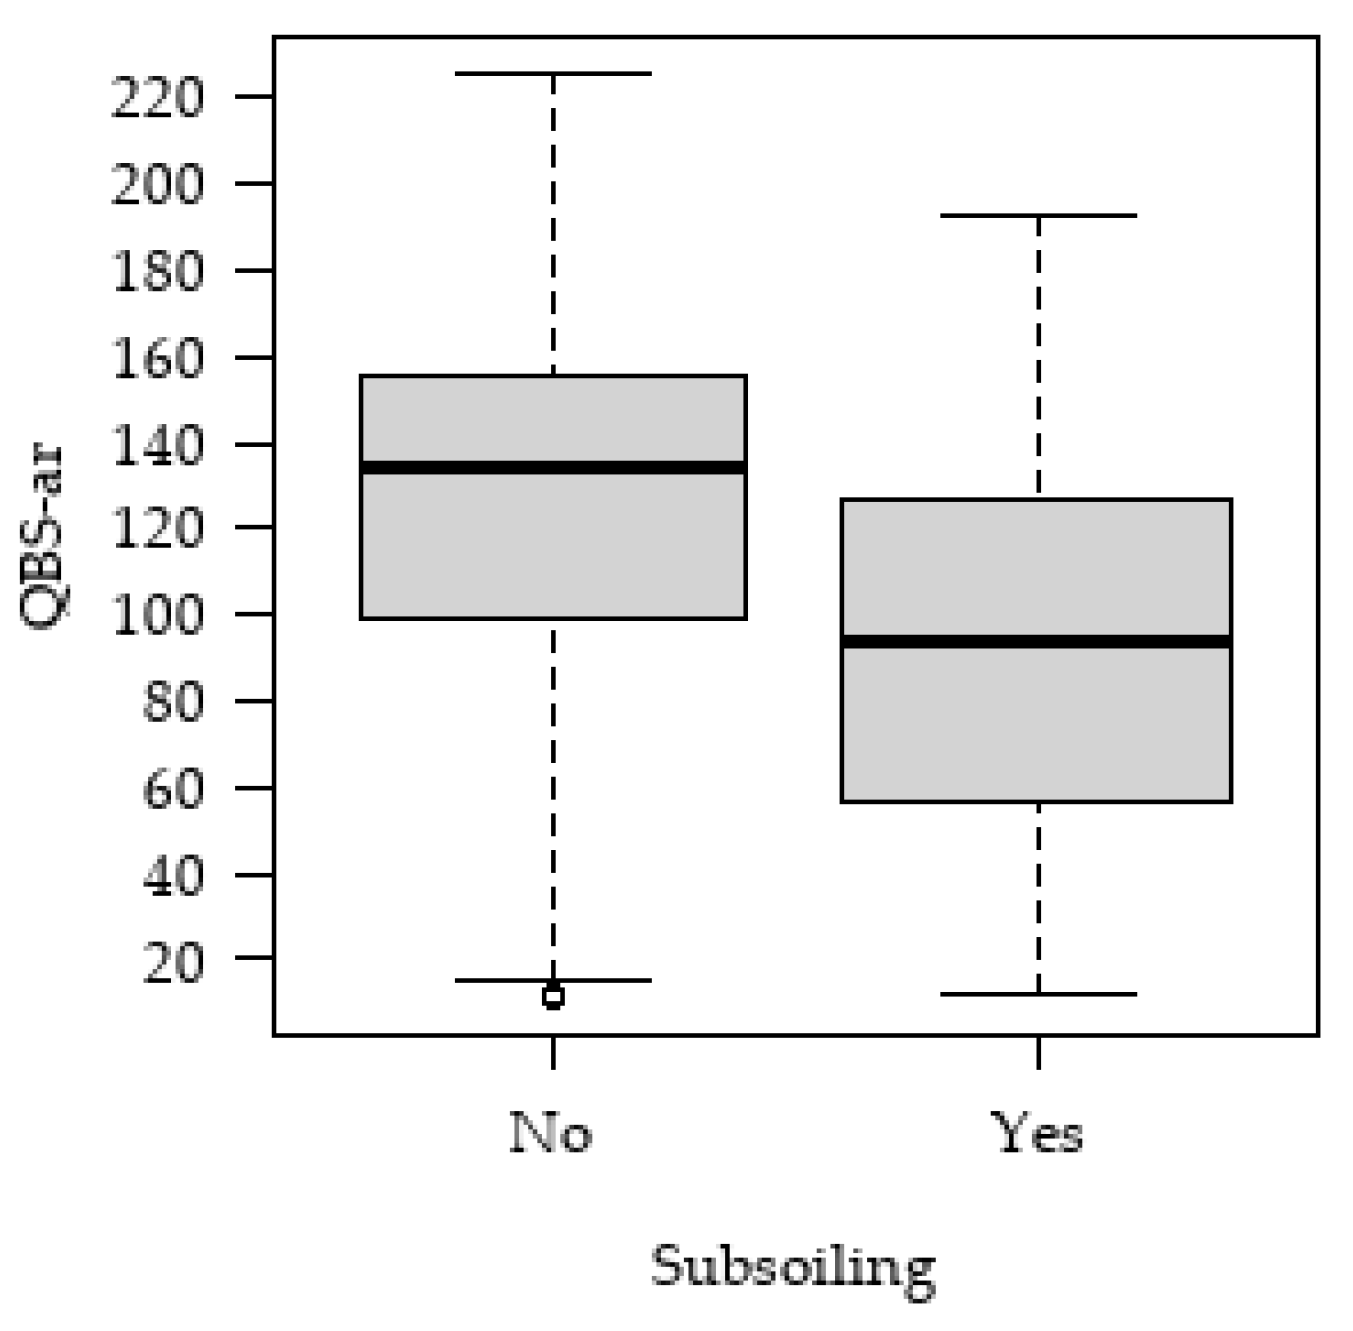
| Subsoiling | yes no | 38.7% 61.3% | Grass cover | SML SMO/SpL SpG SpO Tillage | 17.3% 5.4% 46.4% 17.0% 1.8% |
| Fertilization | yes no | 36.3% 63.7% |
| Taxa | Number of Samples Where Taxon Was Identified | Range of EMI Scores | Taxa | Number of Samples Where Taxon Was Identified | Range of EMI Scores |
|---|---|---|---|---|---|
| Mites | 157 | 20 | Isopoda | 34 | 10 |
| Other holometabolous insects | 23 | 1 | Lepidoptera (larvae) | 7 | 10 |
| Chilopoda | 78 | 10–20 | Pauropoda | 105 | 20 |
| Coleoptera | 90 | 1–20 | Symphyla | 125 | 10 |
| Coleoptera (larvae) | 85 | 10 | Opiliones | 2 | 10 |
| Collembola | 160 | 1–20 | Protura | 91 | 20 |
| Diplopoda | 52 | 10–20 | Pseudoscorpiones | 49 | 20 |
| Diplura | 91 | 20 | Psocoptera | 20 | 1 |
| Diptera | 32 | 1 | Thysanoptera | 23 | 1 |
| Diptera (larvae) | 70 | 10 | Araneae | 14 | 1–5 |
| Hemiptera | 105 | 1–10 | Palpigradi | 2 | 20 |
| Hymenoptera | 147 | 1–5 | Microcoryphia | 2 | 10 |
| Hymenoptera (larvae) | 26 | 10 |
| Factors | Coefficient Estimates | Std. Error | p-Value |
|---|---|---|---|
| Management: organic ≤ 3 | 28.793 | 11.136 | 0.011 * |
| Management: 3 < organic ≤ 9 | 23.060 | 9.361 | 0.015 * |
| Management: organic > 9 | 8.250 | 11.717 | 0.001 ** |
| Subsoiling | −13.482 | 6.446 | 0.038 * |
| Soil texture: Loam | 17.374 | 6.744 | 0.011 * |
| Soil texture: Clay Loam | 41.305 | 9.836 | <0.001 *** |
| Soil texture: Silty clay loam | 45.873 | 8.145 | <0.001 *** |
| TL | 0.273 | 0.142 | 0.057 . |
| TH | 0.992 | 0.231 | <0.001 *** |
| short_T_med | −9.470 | 1.659 | <0.001 *** |
| medium_DD_warm | 0.352 | 0.084 | <0.001 *** |
Publisher’s Note: MDPI stays neutral with regard to jurisdictional claims in published maps and institutional affiliations. |
© 2021 by the authors. Licensee MDPI, Basel, Switzerland. This article is an open access article distributed under the terms and conditions of the Creative Commons Attribution (CC BY) license (https://creativecommons.org/licenses/by/4.0/).
Share and Cite
Ghiglieno, I.; Simonetto, A.; Sperandio, G.; Ventura, M.; Gatti, F.; Donna, P.; Tonni, M.; Valenti, L.; Gilioli, G. Impact of Environmental Conditions and Management on Soil Arthropod Communities in Vineyard Ecosystems. Sustainability 2021, 13, 11999. https://doi.org/10.3390/su132111999
Ghiglieno I, Simonetto A, Sperandio G, Ventura M, Gatti F, Donna P, Tonni M, Valenti L, Gilioli G. Impact of Environmental Conditions and Management on Soil Arthropod Communities in Vineyard Ecosystems. Sustainability. 2021; 13(21):11999. https://doi.org/10.3390/su132111999
Chicago/Turabian StyleGhiglieno, Isabella, Anna Simonetto, Giorgio Sperandio, Matteo Ventura, Fabio Gatti, Pierluigi Donna, Marco Tonni, Leonardo Valenti, and Gianni Gilioli. 2021. "Impact of Environmental Conditions and Management on Soil Arthropod Communities in Vineyard Ecosystems" Sustainability 13, no. 21: 11999. https://doi.org/10.3390/su132111999
APA StyleGhiglieno, I., Simonetto, A., Sperandio, G., Ventura, M., Gatti, F., Donna, P., Tonni, M., Valenti, L., & Gilioli, G. (2021). Impact of Environmental Conditions and Management on Soil Arthropod Communities in Vineyard Ecosystems. Sustainability, 13(21), 11999. https://doi.org/10.3390/su132111999