Abstract
Einkorn wheat (Triticum monococcum L. ssp. monococcum) plays an increasingly important role in agriculture, promoted by organic farming. Although the number of comparative studies about modern and ancient types of wheats is increasing, there are still some knowledge gaps about the nutritional and health benefit differences between ancient and modern bread wheats. The aim of the present study was to compare ancient, traditional and modern wheat cultivars—including a field study and a laboratory stress experiment using vision-based digital image analysis—and to assess the feasibility of imaging techniques. Our study shows that modern winter wheat had better yield and grain quality compared to einkorn wheats, but the latter were not far behind; thus the cultivation of various species could provide a diverse and sustainable agriculture which contributes to higher agrobiodiversity. The results also demonstrate that digital image analysis could be a viable alternate method for the real-time estimation of aboveground biomass and for predicting yield and grain quality parameters. Digital area outperformed other digital variables in biomass prediction in relation to drought stress, but height and Feret’s diameter better correlated with yield and grain quality parameters. Based on these results we suggest that the combination of various vision-based methods could improve the performance estimation of modern and ancient types of wheat in a non-destructive and real-time manner.
1. Introduction
A major goal for plant breeders is to quantify genotypes’ interactions with the environment and to develop more productive, pest/disease-resistant, and less resource-intensive sustainable cultivars for low-input agriculture [1,2]. Commercial and scientific plant breeding programs usually use traditional phenotyping to evaluate several traits manually, e.g., yield, biomass, plant height and abiotic stress tolerance traits [1,3]. Conventional breeding is an often labor-intensive, relatively expensive, time-consuming and destructive method, and requires limited quantitative and repeated assessments in long-term research [4,5,6]. Consequently, in order to improve upon traditional manual breeding, there is a need to develop a novel approach and to apply expedited, accurate and repeatable techniques for phenotyping large populations, which will help increase the quality of the selection process and find the most resistant genotypes to stress by analysing phenomic data [1,3,4,7]. The development of remote sensing and imaging-based technologies provide an opportunity to phenotype various plants populations from leaf to field levels [1] and give a potential solution to specific breeding tasks [3]. The new approach to breeding involves several sensors, platforms, image processing and data management techniques, but there is also a partial lack of engineering know-how [1,8]. Although imaging-based methods are rapid, non-invasive and operate with a very high image resolution, and these properties make them a viable alternative choice to traditional phenotyping for real-time plant growth prediction and plant health assessment [5,9], limitations to imaging-based techniques still exist [5]. For example, the problems of image acquisition quality and throughput processing are yet to be solved. Light conditions and the effects of lighting intensity and angle on the images have high variability. Throughput limitations come from large amounts of raw data being generated and from the subsequent need for processing power and storage [1,10]. The costs of the equipment (e.g., sensors, UAV platforms, controlled environment chambers) are also relatively high [1,10].
In recent years, digital image analysis of plants has been applied in commercial breeding programs and in agricultural research in various ways [3,5,7,11]; therefore such methods are increasingly popular and effective for evaluating plant health in response to environmental stresses [7,12]. Several types of optical sensors (e.g., commercial RGB cameras, multispectral, hyperspectral, near-infrared, thermal cameras) exist that can be used in phenotyping to measure the reflection of electromagnetic radiation that helps analyse the spectral and morphological features of crops [1,4,13]. Despite the fact that phenotyping platforms are equipped with an array of sensors [5], image analysis and feature or trait extraction is challenging. Several choices of sensors are available, and we need to select the most cost-effective and robust one [1,14].
Vision-based (VIS-based) imaging by RGB camera has a long history with phenotyping and it is a widely used technique in agricultural research because it is the simplest and most economically viable choice, using an electromagnetic wavelength spectrum ranging from 400 nm to 750 nm [5,10]. Many studies have identified seed traits [3,15,16,17,18] or estimated the chlorophyll content and nitrogen concentration of leaves based on RGB features [9,19]. Other researchers measured specific features of plants for phenotyping using digital image processing techniques [20,21,22,23]. RGB sensors can also be used to detect and monitor changes in plant structure and to determine crop status or aboveground biomass (AGB) production [19,23,24,25,26,27,28]. AGB is a fundamental parameter for yield estimation, especially in the case of cover crops in precision agricultural management [26,28] and it can be affected by many factors, such as developmental stage, diseases, nutritional deficiencies and drought stress [19,29].
Wheat is one of the most common crops in Hungary and in the European Union (Figure 1) [30]. Today, in addition to winter wheat (Triticum aestivum L. ssp. aestivum), einkorn wheat (Triticum monococcum L. ssp. monococcum) plays an increasingly important role in breeding for sustainable agriculture. Wild ancestors and old landraces represent an underexploited genetic resource in modern wheat breeding programs [31,32,33]. Despite the lower yield of ancient wheats, they provide acceptable yield under low-input management. Their advantage also lies in their good ecological adaptation, such as tolerance to biotic and abiotic stress, and resistance to diseases [34,35,36]. The earliest grain remains of wild einkorn were found in the Fertile Crescent in the Karcadağ Mountains of South-East Turkey [33] and it spread throughout Europe from the Middle Ages to the early 20th century [36]. Einkorn completely disappeared from the Carpathian Basin during the 17th century, except for Transylvania, where its cultivation was maintained until the 20th century [37,38]. Einkorn landraces evolved through genetic isolation under local environmental conditions, whereas high-bred races were created by strong human selection [39]. As a result of ecological adaptation, einkorn is tolerant to biotic and abiotic stress, resistant to diseases and pests, and has a good nutritional value [15,34,35], with its reported protein content ranging between 13.2% and 28.5% [36]. The reintroduction of its cultivation has been promoted by organic farming because it provides low but acceptable yields on poor soils [36,40,41]. It has also been rediscovered as a healthy food; according to new research, its gliadin is not as toxic to people with gluten intolerance [33,36], although research is inconclusive as to whether ancient wheats are superior to all modern cultivars in reducing chronic diseases [42,43,44]. The mechanisms by which ancient wheats may prove healthier and more nutritious than modern bread wheat are unclear and limited numbers of genotypes have been studied [44].
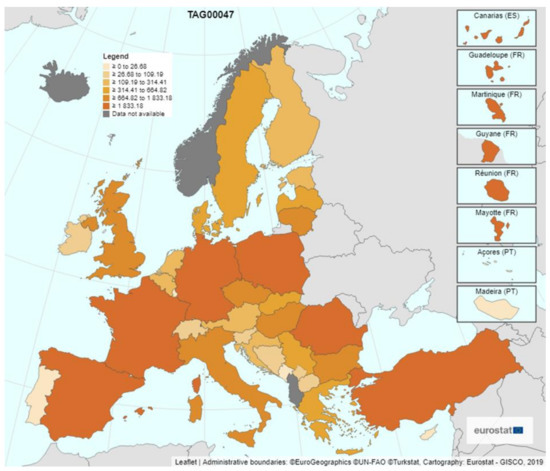
Figure 1.
Common wheat, spelt, einkorn wheat and durum wheat by area, production (1000 ha) and humidity in the European Union, 2019 [30].
Here we aimed to compare the yield and grain quality parameters of ancient, traditional and modern wheat cultivars with the acquired digital image RGB data to promote the use of genetic resources in breeding programs. The other purpose of the study was to assess the feasibility of VIS-based methods to improve performance estimation (e.g., prediction of AGB) in different wheat varieties with freely available image analysis software (ImageJ [45]) and a consumer grade DSLR digital camera.
To facilitate the breeding of new wheat cultivars, we studied two winter wheats and three einkorn wheats in a field experiment (uncontrolled conditions) and in a laboratory experiment (controlled conditions). Yield was measured in the field, grain quality parameters were measured after cultivation and harvest with a near infrared optical laboratory analyser for fast and precise assessment. In order to estimate AGB production under different stress conditions (nutrient deficiency, drought stress), wheat seedlings were grown in a spring/summer growth chamber and recorded with an RGB camera. VIS-based digital analysis was used for image processing. To combine data drawn both from controlled and uncontrolled experiments, digital data, yield and grain quality parameters were analysed side by side. Our questions are as follows: (1) Is there a difference between the modern, traditional and ancient wheat cultivars in yield and in grain quality parameters? (2) Can we estimate the aboveground biomass of cultivars with a low-cost RGB camera based on a non-destructive digital image analysis method? (3) Is there a difference between digital image parameters according to cultivar, treatment, or tracked over time? (4) Is there a correlation between yield, grain quality parameters and digital image parameters of cultivars?
2. Materials and Methods
2.1. Plant Material
We investigated two different winter wheats and three different einkorn wheat cultivars: (1) Mv Magdaléna is a registered modern Hungarian winter wheat cultivar with a hard endosperm structure and high gluten and protein content; it has excellent milling grade quality [46]. Seeds were offered by the Agricultural Institute, Centre for Agricultural Research (Martonvásár, Hungary). (2) Bánkúti 1201 is an old Hungarian winter wheat cultivar [47] with average or slightly better yield potential, hard endosperm structure and good rheological properties. It also has satisfactory climatic resistance and extremely good drought tolerance [47,48]. Seeds were provided by the Research Institute of Organic Agriculture (ÖMKi, Budapest, Hungary). (3) Mv Alkor is a registered Hungarian einkorn cultivar used in organic farming, and has medium yield, but high protein and fiber content. It has a good weed-suppressing ability, is drought tolerant and resistant to fungal diseases [46]. Seeds were offered by the Agricultural Institute, Centre for Agricultural Research (Martonvásár). (4) Schiemann einkorn is from Morocco and is registered (gene bank code: RCAT 074129) in the Hungarian gene bank, Plant Diversity Centre (NöDiK, Tápiószele; now the National Centre for Biodiversity and Gene Conservation). (5) The Bözödi einkorn landrace originates from the sub-mountainous regions of Transylvania (Romania), cultivated under traditional farming practices and it is an excellent genetic source [35]. The re-introduction of its cultivation is promoted by organic farming. Seeds were provided by the Plant Diversity Centre (NöDiK, Tápiószele) (see Table 1).

Table 1.
The studied plant material. Photos by Agricultural Institute, Centre for Agricultural Research (Mv Magdaléna), Museum and Library of Hungarian Agriculture (Bánkúti 1201), E. Csákvári (Mv Alkor, Schiemann and Bözödi).
2.2. Uncontrolled Field Experiment
The 1 m × 9 m experimental plots were randomly designated in the field in four replicates in Nagygombos (Hungary), rented by the Institute of Plant Production of Szent István University (now Hungarian University of Agriculture and Life Sciences). On 17 November 2016, the three einkorn wheats and the winter wheat Bánkúti 1201 were sown with a mechanical small plot seeder, winter wheat Mv Magdaléna was not sown due to a lack of seeds. The harvest was conducted on 21 July 2016 in the ripening stage of wheat cultivars. After harvest, (1) the yield of each wheat was measured in the field and calculated per hectare. The grains with glume were hulled with a Santec SRO VKI11 laboratory huller in a laboratory to prepare samples for measuring grain quality parameters. (2) Protein and (3) gluten content were measured in four repetitions with a Mininfra-ScanT Plus near infrared optical analyser at wavelengths ranging between 790 nm and 1064 nm. (4) The storage volume of grains was measured in a laboratory glass in four replicates. For the parameters of Mv Magdaléna, we relied on the data of the national catalogue of registered field crops.
2.3. Controlled Laboratory Stress Experiment
2.3.1. Experimental Design
The stress experiment was conducted at Szent István University, Faculty of Agricultural and Environmental Sciences, Department of Genetic and Plant Breeding in Gödöllő and at the Agricultural Institute, Centre for Agricultural Research in Martonvásár in 2017. The experiment was performed under controlled light conditions, reducing the effect of light on the image.
The plants were grown in Jiffy peat pots for 43 days in an unheated greenhouse from 16 September. After 43 days, the seedlings were planted in round pots in a 3:2:1 mixture of 2800 cm3 of garden soil, compost and sand. The pots were placed in a Conviron PGR-15 phytotron spring/summer growth chamber offering a growth area of 1.5 m2 and a growth height of 1450 mm [49].
Three different treatments were implemented in our study: control (C), nutrient deficiency (ND), and drought stress (DS) during the tillering development stage. Control pots were watered daily with tap water and supplemented once a week with Wuxal Super nutrient solution. The nutrient deficient pots were watered daily with tap water without extra nutrients. Drought stress pots were watered twice a week for 13 days and once a week for 17 days with tap water supplemented with the same nutrient solution as the control. All treatments were performed in five replicates, each cultivar was represented by 15 pots and the treatments were applied for 30 days. The night/day temperature was maintained at 10/15°C for 11 days. For an additional 19 days, the night/day temperature was kept at 13/17°C, illuminated with halogen lamps for 12 hours per day. The average air humidity was 75% during the night and 65% during the day.
2.3.2. Digital Image Recording and Processing
To measure the growth parameters of winter wheat and einkorn cultivars, the aboveground part of the plants was photographed three times (9, 18, and 26 November 2017) after being transplanted from Jiffy into the pots in the early stage of plant growth. The plants were placed in front of a white background and illuminated with halogen bulbs. Digital images were taken of the central zone of the canopy with a Canon EOS 30D DSLR digital still color camera (2009 Canon Inc., Tokyo, Japan) with 8.2 megapixel resolution. Data were recorded in unprocessed raw format; intensity data were digitalized to 12 bits. The camera was mounted on a tripod, and the distance from the camera tripod to the subject was constantly 3.2 m. The digital camera settings were as follows: exposure time 1 × 10⁻², aperture f/10, ISO 100, focal length 50 mm, white balance with 4900 K, flash turned off.
All images in the experiment were stored in CR2 (Canon RAW version 2 image file) format. The CR2 format contains minimally processed data from image sensors in a digital camera; the file contains white balance, saturation, contrast and sharpness settings, but delays processing. No destructive changes are made to the raw image file [19]. The images were processed with Adobe Photoshop CC 20.04.4 software (Adobe Systems Inc., San Jose, CA, USA). The processing was performed by the image segmentation feature of the Camera RAW 11.2 plug-in. The canopy was separated from the white background and from the other surfaces, which is important for the accurate estimation of biomass production. The processed images were saved in 16-bit TIFF uncompressed format (Figure 2).
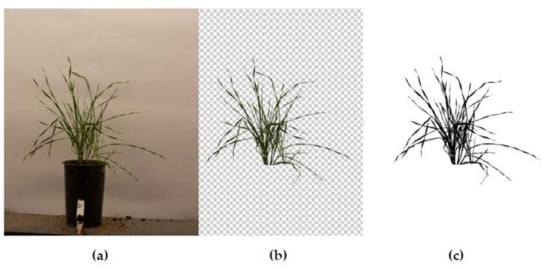
Figure 2.
The process of segmenting digital images with Adobe Photoshop CC 20.0.4: (a) original CR2 image, (b) separated plant material, (c) 16-bit TIFF image.
2.3.3. Extraction of Digital Image Parameters
The images were analysed for biomass phenotyping under controlled conditions based on the projected area of the plant in the image. Image parameters were determined with the open source software ImageJ [45]. In the RGB stack, the color threshold was adjusted according to the intermodes thresholding method. Red was selected as the threshold color in HSB color space. The method is based on the appropriate contrast between the plant and the background. The object was separated from the background pixels based on contrast (Figure 3). Pixels representing biomass are suitable for quantification and analysis. The percentage of object pixels relative to the total number of pixels in the entire area of the visual image—called the Projected Area—was then measured. The following parameters were calculated in thresholded images: (1) area: area of composite selection, ignoring pixels outside the object; values were expressed in square pixels; (2) perimeter: the length of the outer boundary of the composite selection; bounding rectangle: the smallest (3) width and (4) height enclosing the selection; (5) Feret’s diameter: the maximum distance between any two points along the selection boundary, also known as the maximum caliper [45]. The latter four parameters were expressed in pixels.
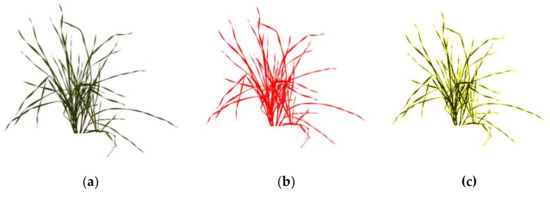
Figure 3.
The process of measuring the projected area using the open-source ImageJ software: (a) RGB stack, (b) thresholded image in HSB color space, (c) filtered object.
2.4. Data Analysis
To detect differences in yield and in grain quality parameters between the cultivars, we used the one-way ANOVA statistical method with Tukey’s honest post hoc significance test. The dependent variables were the yield and grain quality parameters and the fixed factor was the type of cultivar. The mean difference was considered significant at the p < 0.001 probability level.
To find the interaction between digital image parameters and cultivars, treatments and time, we selected the most informative dependent variable by Multivariate General Linear Model (Multivariate ANOVA/MANOVA) as a first step. The dependent variables were area, perimeter, bounding rectangle (width and height) and Feret’s diameter. The fixed factors were the five wheat cultivars (Mv Magdaléna, Bánkúti 1201, Mv Alkor, Schiemann and Bözödi), the three treatments (C, ND and DS), and the dates of RGB measurements (9, 18, 26 November 2017) with all possible interactions (marked with *) included (cultivars*treatment, cultivars*date, treatment*date, cultivars*treatment*date). In the second step, the dependence of the selected digital image parameter (dependent variable) on cultivars, treatments, dates and interactions (fixed factors) was tested by Univariate General Linear Model (Multiway/Multiple ANOVA). Variation between the main factors, according to date differences between cultivars and treatments, as well as treatment differences between cultivars was tested with Tukey’s honest post hoc test. Significance was considered at the p < 0.05 probability level.
To determine significant correlations between yield, grain quality parameters (protein and gluten content, storage volume) and digital image parameters (area, perimeter, width, height, Feret’s diameter) of cultivars, Pearson’s correlation formula was used with a two-tailed test at the p < 0.05 or p < 0.01 probability levels. Statistical analysis and production of graphs were performed using the IBM SPSS Statistics 17.0 software.
3. Results
3.1. Yield and Grain Quality Parameters of Wheat Cultivars
According to one-way ANOVA, the choice of cultivar had a strong significant effect on the yield and grain quality parameters: the strongest relationship was found between cultivars and gluten content (F = 205.978), but protein content (F = 142.210), yield (F = 127.961) and storage volume (F = 81.179) also had a significant relationship with cultivars (Table S1).
Based on Tukey’s honest post hoc test, in the case of yield, most cultivars differed significantly at the 0.001 level (Table S2). Winter wheat Mv Magdaléna had the best yield among the studied cultivars, winter wheat Bánkúti 1201 and einkorn wheat Bözödi had slightly lower yield, while einkorn wheat Mv Alkor and Schiemann had the lowest yield. Mv Magdaléna also had the best protein content, followed by Bánkúti 1201 and Schiemann, then Mv Alkor, while Bözödi had the lowest protein content. Mv Magdaléna contained the highest amount of gluten, Bánkúti 1201, Mv Alkor and Schiemann contained a similar, somewhat lower amount, and Bözödi had the lowest gluten content. The storage volumes of Mv Magdaléna and Schiemann were the highest, Bözödi was similar to Schiemann, a lower storage volume was found for Mv Alkor, and the lowest for Bánkúti 1201 (Table 2).
Table 2.
Means of yield and grain quality parameters of the studied cultivars.
3.2. Dependence of Digital Image Parameters on Cultivars, Treatments over Time
The Multivariate General Linear Model showed that all the fixed factors significantly affected all digital image parameters at the p < 0.05 level (Table S3). Based on the number of significant interactions—F value and partial η2—the strongest relationship with fixed factors was found for area. A strong or moderate relationship was observed between perimeter and recording date (F = 324.764; partial η2 = 0.783) and perimeter and treatment (F = 76.335; partial η2 = 0.459). Moderate relationships were found for height and recording date (F = 75.684; partial η2 = 0.419), height and cultivar (F = 65.318; partial η2 = 0.592), Feret’s diameter and recording date (F = 65.001; partial η2 = 0.419) and Feret’s diameter and cultivar (F = 64.6; partial η2 = 0.589). Width showed the weakest relationship with all the fixed factors.
The Univariate General Linear Model showed that all of the fixed factors and the interactions had a significant impact on area at level p < 0.001 (Table S4). The fixed factors explained 91.8% of changes in area. According to Tukey’s post hoc significance test, significant (p < 0.05) differences were found between all dates of recording and all treatments. As for the cultivars, Mv Magdaléna and Bánkúti 1201 had a significantly higher area than Mv Alkor, Schiemann and Bözödi (Tables S5–S7). Area increased with time for all cultivars, as expected. Mv Magdaléna and Bánkúti 1201 were significantly different from the other cultivars in the first two dates, but the growth of Mv Magdaléna slowed down by the third measurement and became similar to Mv Alkor, Schiemann and Bözödi (Figure 4a, Tables S8–S10). Drought had a negative impact on growth, resulting in a significantly lower area than C or ND with time (Figure 4b). The cultivars reacted to stress in a slightly different way. Mv Magdaléna and Bánkúti 1201 had a significantly bigger area affected by drought than the other cultivars (Figure 4c). ND had no impact on growth with time compared with C, nor did the cultivars react to ND significantly (Tables S11–S13).
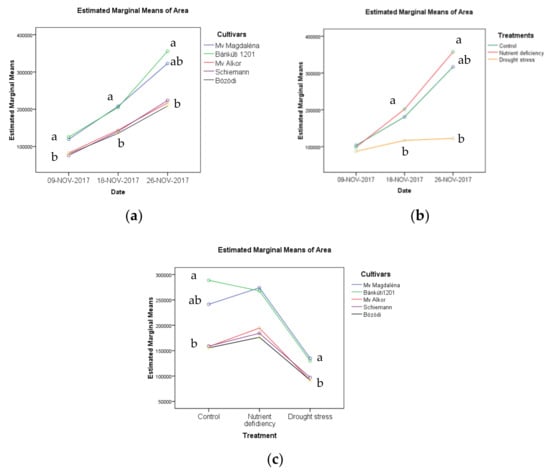
Figure 4.
The impact of (a) cultivar*date, (b) treatment*date, and (c) cultivar*treatment on the area of pot-grown wheat cultivars assessed by VIS-based digital image analysis. Significant differences were calculated according to date or treatment at p < 0.05 based on Tukey’s post hoc test and are marked with different letters. Possible interactions between dependent variables and fixed factors are marked with *.
3.3. Correlation between Yield, Grain Quality Parameters and Digital Image Parameters of Wheats
A moderate (up to r = 0.410) and highly significant (p < 0.001) positive correlation was observed between yield and the grain quality parameters. Out of the three grain quality parameters, protein and gluten contents were the most strongly correlated (r = 0.935; p < 0.001), gluten content and storage volume (r = 0.244; p < 0.001) were moderately correlated, and no correlation was observed between protein content and storage volume.
All digital image parameters showed strong (area and perimeter, height and Feret’s diameter; up to r = 0.918) or moderate highly significant (p < 0.001) positive correlations with each other. A moderate (up to r = 0.398) and highly significant (p < 0.001) positive correlation was found between yield, protein and gluten content compared to height or Feret’s diameter. Correlation was positive, but lower (up to r = 0.199) and less significant (p < 0.01) between yield, protein content and gluten content compared to area or width. No correlation was found between yield and grain quality parameters compared to perimeter (Table 3).
Table 3.
Pearson’s linear correlation between yield, grain quality parameters and digital image parameters of cultivars. r = 1: perfect positive correlation; 0.7 ≤ r < 1: strong positive correlation; 0.2 ≤ r < 0.7: moderate positive correlation; 0 < r < 0.2: weak positive correlation.
4. Discussion
4.1. Yield and Quality Performance of Different Wheat Cultivars
Although the number of comparative studies about modern, traditional and ancient types of wheats is increasing, there are still relatively few research groups working in this area [44]. This study investigated winter wheat and einkorn wheat cultivars combining a field experiment (measuring yield and grain quality parameters) with a laboratory stress experiment (studying digital features with VIS-based digital image analysis).
According to the study of Morris et al. [50] modern bread wheat differs in yield and in nutrition benefits from old types of wheats, but these differences have not been confirmed by detailed analysis [42,43,44]. Ruiz et al. [31] demonstrated that old wheat varieties show yields too low to be competitive in terms of crop productivity. Hidalgo et al. [51] reported 0.75–2.5 t/ha yield of einkorns and 3.5–6.7 t/ha yield of bread wheat. Similarly, our study shows that modern wheats have better yield production compared to old and ancient wheats, but the latter are not far behind. Despite the lower yield, they provide acceptable yield under ecologically sustainable low-input management. Modern winter wheat Mv Magdaléna had the best yield (6.1 t/ha) among the studied cultivars, old winter wheat Bánkúti 1201 and the three einkorns had acceptable yields (from 3.5 to 4.5 t/ha) for low-input and organic farming. The grain yields obtained in the present work are in line with the Hungarian study of Bencze et al. [40] where the yields of einkorn landraces were around 3 t/ha. In other European countries (e.g., in Italy) 0.84–4.5 t/ha yields were recorded for einkorn [41].
Wheat nutritional value and health benefits rather than yield could be an important driver for the reintroduction of ancient wheats [50]. According to the study of Zaharieva et al. [36] and Van Boxstael et al. [52] the nutritional value of ancient wheats is excellent. In our study, the modern wheat Mv Magdaléna achieved the highest protein content (13.4%), followed by Schiemann (12.6%), Bánkúti 1201 (12.5%), Mv Alkor (11.7%) and Bözödi (9.3%). These results correspond to the findings of Bencze et al. [40], who revealed that the grain protein content of einkorn Mv Alkor was less than 15%. In contrast Hidalgo et al. [51] reported higher total proteins (17.7–20.5%, on average +59%) in einkorn wheat than in bread wheat under standard cultivar practices and in organic farming, where the genotype and the yearly environmental variation exerted major effects on protein content. In the review of Hidalgo and Brandolini [53] T. monococcum kernels had a high protein content, on average 18.2%, but slightly lower concentrations (10–17.4%) are reported by some other authors [53]. In our study the average yield and grain quality were satisfactorily high both in bread wheat and in einkorn wheat, although the relative impacts of the genotypes, environmental factors and differences in cultivation [44] should also be investigated further.
Gluten intolerance is a widespread problem nowadays [33,36], and this is the other reason why ancient wheats are being rediscovered as a healthy food. We found that all of the studied einkorns had a significantly lower gluten content than winter wheat cultivars: Bözödi 15.4%; Mv Alkor 22.5%; Schiemann 25.8% compared to Bánkúti 1201 23.6% and Mv Magdaléna 31.8%. Therefore, we agree that einkorn gluten content has poor bread manufacturing properties; nevertheless, einkorn flour is ideal for preparation of healthy cookies and produces good-quality pasta [53,54].
4.2. The Improvement of VIS-Based Non-Destructive Estimation of Aboveground Biomass
AGB is a widely used agronomic indicator for characterising crop growth and nitrogen status and predicting grain yield [26,28]. The estimation of AGB in a non-invasive way is an important task in the development of precision farming [28]. Therefore, one of our goals was to develop a low-cost and simple method for assessing real-time AGB production and for estimating stress factors based on RGB image analysis. We calculated the number of pixels on the projecting area under nutrient deficiency and drought stress. Among the studied image parameters, digital area was the most important predictor variable, although digital perimeter also estimated plant growth and drought stress well. Previous studies showed that canopy cover estimated from the images was highly correlated with AGB [55] and was also stable in varying environmental conditions [12]. Our results confirm the findings of these studies, namely that by segmenting the images and measuring the projected area it is possible to assess the plant growth of wheats, which is related to biomass production and drought stress.
4.3. The Impact of Treatments on the Estimated Aboveground Biomass of Cultivars
In the controlled experiment, we analysed images taken with an RGB camera mounted on the tripod platform. Similarly to the other studies [5,12] we used threshold and segmentation methods in order to differentiate the plant material pixels within images. The segmentation process was relatively easily conducted due to the different hue values of plant and background material pixels. The relative amount of AGB based on the projected area (the percentage of object pixels relative to the pixels of the entire area of the image) of the plant was estimated in the RGB images.
The only treatment with a significant negative impact on growth (expressed in pixels) was drought stress, resulting in a much slower increase in AGB over time compared to control and nutrient deficiency specimens. Among the studied cultivars, the two winter wheats performed best in both growth and resistance to drought stress. Although several studies [34,35,36] found that einkorn wheats were highly resistant to environmental stresses, we, on the contrary, found that the studied einkorns responded worse to drought stress in the tillering stage than winter wheats. Mv Magdaléna and Bánkúti 1201 had significantly higher AGB production under drought stress than the three einkorn wheats: Mv Alkor, Schiemann and Bözödi. The probable reason for this is that the studied winter wheats have satisfactory climatic resistance and extremely good drought tolerance [46,47,56]. The cultivars did not react significantly to nutrient deficiency, and nutrient deficiency had no impact on AGB production compared to control for any cultivar. The reason for this can be that the experiment was conducted during the tillering stage, and abiotic stresses are known to be critical and to cause yield loss in the subsequent reproductive phases of growth, mainly in the grain filling phase [56]. Hence further studies are required regarding the reproductive stage.
4.4. Wheat Quality Estimation Based on Yield, Grain Performance and VIS-Based Data
Analysis of wheat canopy digital data can provide important indicators of growth variability and help understand yield and grain quality parameters influencing wheat quality. Several techniques have been developed to estimate yield based on plant biomass in different crops (e.g., black oat [26], spring barley [27], maize [57], poppy [58]), but to our knowledge, no study has explored the relationships between VIS-based digital features, yield and grain quality parameters, so we considered and analysed these correlations. We observed a moderate and highly significant positive correlation between the yield and the grain quality parameters. We found a moderate and highly significant correlation between the height and Feret’s diameter of cultivars extracted from the images compared to yield, protein content and gluten content. These outcomes correspond to the finding of Golbach et al. [21], Bendig et al. [27] and Iqbal et al. [58], who revealed that plant height or Feret’s diameter can be used for estimating crop structure parameters and for predicting AGB, but our findings also imply that height and Feret’s diameter are good indicators of not only the AGB production, but the yield and grain quality parameters as well. In our study digital area was less correlated and had less significance regarding yield and grain quality parameters than height or Feret’s diameter. This result suggests that estimated AGB based on digital area does not determine wheat quality performance in all cases.
Our results suggest that the use of combined information would provide better performance for estimating wheat quality than the use of a single indicator, in our case the digital area. Area performed the best as an indicator of wheat growth under experimental stress conditions, while height and Feret’s diameter predicted yield and grain quality parameters better. The results can be applicable in breeding programs, particularly related to cereals and other field crops to extract phenotypic information rapidly, and in predicting the quality of wheats, with potential uses in improving the management of precision farming.
4.5. Known Limitations of the Study
Although VIS-based imaging is a viable alternative technique for assessing the performance of different Triticum species, some potential drawbacks and limitations were al-so uncovered in this study. As with most VIS-based methods, no reliable technique to keep the quality of the images fairly uniform at different times can be offered presently, especially under varying light conditions [1]. Even though our laboratory stress experiment was performed under controlled light conditions using halogen lamps, reducing the effect of lighting on the images and making image processing easier, field conditions would present considerably harder challenges. The preferably large size of the image files may also prove to be a difficulty when using computers with limited performance for image processing.
Growth chamber experiments typically focus exclusively on potted plant growth estimation in a tightly controlled environment [5], therefore further validation is needed of our method’s applicability in practical field crop cultivation. This study was conducted during the tillering phase and did not extend to the reproductive stages of crop development due to budgetary reasons. This understandably limits the number of conclusions that can be drawn from the experimental data, as seen in the lack of significant effects of nitrogen deficiency (contrary to expectations).
Even though our results suggest that on average T. aestivum performs better than T. monococcum in terms of yield and protein content, the relative contributions of the genotype, environmental factors and cultivation differences to the resulting yield and quality cannot be precisely determined from this study. Further research is required to fill some of these gaps in our findings on VIS-based crop performance analytics.
5. Conclusions
Image-based technology may help private breeding programs and research institutes in moving from conventional phenotyping to novel approaches. The main bottleneck is achieving a reliable imaging solution that deals with image variability due to environmental uncertainty and limited analytics [1,5]. Here, we applied a VIS-based analysis method that offers a time-saving, non-destructive alternative in a controlled environment. Our goal was to assemble a low-budget system using an open-source computer software (ImageJ) and a commercial DSLR RGB camera.
In our study, the VIS-based digital image analysis demonstrated that digital area outperformed other digital variables in biomass prediction in the laboratory stress experiment, but height and Feret’s diameter outperformed area in the prediction of yield and grain quality parameters. Based on these results, we suggest that the combination of various VIS-based methods could improve the estimation of wheat performance with a non-destructive and real-time approach. We conclude that use of digital morphological parameters could be a viable choice for the quick prediction of aboveground biomass production and the detection of drought stress in wheats in several different developmental stages.
The developed method is a rapid, non-invasive, economical and easy-to-use technique for assessing the growth and health status of plants. An RGB digital camera is easy to operate and image acquisition can be done at will, while conventional laboratory instruments are relatively expensive, expert-intensive and their operation is time consuming. However, the system is limited to estimating potted plant growth in a controlled environment chamber, and each new set of images may require the thresholds to be adjusted manually [5]. VIS-based image analysis methods have shown reliable and precise prediction under controlled conditions, but further validation is necessary to ensure their application in the field. Hence standard controlled processes need to be developed to make them acceptable in proper agricultural application.
Based on our field study we further conclude that both winter wheat and einkorn wheat can be grown successfully under low-input and environmentally sustainable organic farming and still keep their yield and quality. Ancient wheats and old landraces represent not only a key reservoir of genetic diversity in crop breeding, but they also play an important role in maintaining the biodiversity of agroecosystems. The cultivation of various species could provide a more diverse and sustainable agriculture, instrumental in adapting to climate change. Further research is then strongly recommended, particularly on a wider range of genotypes of old, ancient and modern wheat cultivars, helping to conserve and protect agroecosystems in the long run.
Supplementary Materials
The following are available online at https://www.mdpi.com/article/10.3390/su132112005/s1, File S1: Table S1–S13, Statistical analysis.
Author Contributions
Conceptualization, J.B., F.G. and E.C.; methodology, J.B., F.G., E.C. and M.H.; software, A.E. and E.C.; formal analysis, E.C.; investigation, E.C., J.B. and A.E.; data curation, E.C.; writing—original draft preparation and editing, E.C. and M.H. All authors have read and agreed to the published version of the manuscript.
Funding
This research was funded by the Hungarian Ministry of Human Capacities (ÚNKP-17-3 New National Excellence Program), National Research, Development and Innovation Office (GINOP-3.1.1-VEKOP-15-2016-00001), National Science Foundation of Hungary (HU NKFI FK 127996 project) and by the LEGO Group.
Institutional Review Board Statement
Not applicable.
Informed Consent Statement
Not applicable.
Data Availability Statement
The basic data and image datasets used and analysed during the current study are available from the corresponding author on reasonable request: csakvari.edina@ecolres.hu (E. Csákvári).
Acknowledgments
The authors would like to thank the suppliers of the seeds: Agricultural Institute, Centre for Agricultural Research (MTA ATK, Martonvásár); Research Institute of Organic Agriculture (ÖMKi, Budapest); Plant Diversity Centre (NöDiK, Tápiószele). The authors are grateful to the Institute of Plant Production of Szent István University, and to Ákos Tarnawa and Szabolcs Gonda for their help in the field and laboratory experiment. We would like to acknowledge the language proofreading of Dániel Arató and Balázs Kollár. The authors are grateful to the Digital Development Center in the national framework GINOP-3.1.1-VEKOP-15-2016-00001 “Promotion and support of cooperations between educational institutions and ICT enterprises”. The four anonymous reviewer comments helped further improve the manuscript.
Conflicts of Interest
The authors declare no conflict of interest. The funders had no role in the design of the study; in the collection, analyses, or interpretation of data; in the writing of the manuscript, or in the decision to publish the results.
Research Involving Plants
Triticum aestivum L. and Triticum monococcum L. were used in this study. Seeds of ‘Mv Magdaléna’ and ‘Mv Alkor’ were kindly provided by Agricultural Institute, Centre for Agricultural Research, Martonvásár, Hungary. Seeds of ‘Bánkúti 1201’ were kindly provided by Research Institute of Organic Agriculture, Budapest, Hungary. Seeds of ‘Schiemann’ and ‘Bözödi’ were kindly provided by Plant Diversity Centre, Tápiószele, Hungary.
References
- Kim, J.Y. Roadmap to High Throughput Phenotyping for Plant Breeding. J. Biosyst. Eng. 2020, 45, 43–55. [Google Scholar] [CrossRef]
- Pieruschka, R.; Schurr, U. Plant phenotyping: Past, present, and future. Plant Phenomics 2019, 7507131. [Google Scholar] [CrossRef] [PubMed]
- Uzal, L.C.; Grinblat, G.L.; Namías, R.; Larese, M.G.; Bianchi, J.S.; Morandi, E.N.; Granitto, P.M. Seed-per-pod estimation for plant breeding using deep learning. Comput. Electron. Agric. 2018, 150, 196–204. [Google Scholar] [CrossRef]
- Busemeyer, L.; Mentrup, D.; Möller, K.; Wunder, E.; Alheit, K.; Hahn, V.; Maurer, H.P.; Reif, J.C.; Würschum, T.; Müller, J.; et al. BreedVision—A Multi-Sensor Platform for Non-Destructive Field-Based Phenotyping in Plant Breeding. Sensors 2013, 13, 2830–2847. [Google Scholar] [CrossRef]
- Walter, J.; Edwards, J.; Cai, J.; McDonald, G.; Miklavcic, S.J.; Kuchel, H. Throughput Field Imaging and Basic Image Analysis in a Wheat Breeding Programme. Front. Plant Sci. 2019, 10, 449. [Google Scholar] [CrossRef] [PubMed]
- Selvaraj, M.G.; Valderrama, M.; Guzman, D.; Valencia, M.; Ruiz, H.; Acharjee, A. Machine learning for high-throughput field phenotyping and image processing provides insight into the association of above and below-ground traits in cassava (Manihot esculenta Crantz). Plant Methods 2020, 16, 87. [Google Scholar] [CrossRef]
- Niazian, M.; Niedbała, G. Machine Learning for Plant Breeding and Biotechnology. Agriculture 2020, 10, 436. [Google Scholar] [CrossRef]
- Hickey, L.T.; Hafeez, A.N.; Robinson, H.; Jackson, S.A.; LealBertioli, S.C.M.; Tester, M.; Gao, C.; Godwin, I.D.; Hayes, B.J.; Wulff, B.B.H. Breeding crops to feed 10 billion. Nat. Biotechnol. 2019, 37, 744–754. [Google Scholar] [CrossRef]
- Yadav, S.P.; Ibaraki, Y.; Dutta Gupta, S. Estimation of the chlorophyll content of micropropagated potato plants using RGB based image analysis. Plant Cell Tiss. Organ Cult. 2010, 100, 183–188. [Google Scholar] [CrossRef]
- Omari, M.K.; Lee, J.; Faqeerzada, M.A.; Joshi, R.; Park, E.; Cho, B.K. Digital image-based plant phenotyping: A review. Korean J. Agric. Sci. 2020, 47, 119–130. [Google Scholar] [CrossRef]
- Scharr, H.; Dee, H.; French, A.P.; Tsaftaris, S.A. Special issue on computer vision and image analysis in plant phenotyping. Mach. Vis. Appl. 2016, 27, 607–609. [Google Scholar] [CrossRef][Green Version]
- Liu, J.; Pattey, E. Retrieval of leaf area index from top-of-canopy digital photography over agricultural crops. Agric. For. Meteorol. 2010, 150, 1485–1490. [Google Scholar] [CrossRef]
- Li, F.; Mistele, B.; Hu, Y.; Chen, X.; Schmidhalter, U. Reflectance estimation of canopy nitrogen content in winter wheat using optimised hyperspectral spectral indices and partial least squares regression. Eur. J. Agron. 2014, 52, 198–209. [Google Scholar] [CrossRef]
- Fahlgren, N.; Feldman, M.; Gehan, M.A.; Wilson, M.S.; Shyu, C.; Bryant, D.W.; Hill, S.T.; McEntee, C.J.; Warnasooriya, S.N.; Kumar, I.; et al. A versatile phenotyping system and analytics platform reveals diverse temporal responses to water availability in Setaria. Mol. Plant 2015, 8, 1520–1535. [Google Scholar] [CrossRef] [PubMed]
- Goriewa-Duba, K.; Duba, A.; Wachowska, U.; Wiwart, M. An Evaluation of the Variation in the Morphometric Parameters of Grain of Six Triticum Species with the Use of Digital Image Analysis. Agronomy 2018, 8, 296. [Google Scholar] [CrossRef]
- Zhang, C.; Si, Y.; Lamkey, J.; Boydston, R.A.; Garland-Campbell, K.A.; Sankaran, S. High-Throughput Phenotyping of Seed/Seedling Evaluation Using Digital Image Analysis. Agronomy 2018, 8, 63. [Google Scholar] [CrossRef]
- Dana, W.; Ivo, W. Computer image analysis of seed shape and seed color of flax cultivar description. Comput. Electron. Agric. 2008, 61, 126–135. [Google Scholar] [CrossRef]
- Gyulai, G.; Rovner, I.; Vinogradov, S.; Kerti, B.; Emődi, A.; Csákvári, E.; Kerekes, A.; Mravcsik, Z.; Gyulai, F. Digital seed morphometry of dioecious wild and crop plants—Development and usefulness of the seed diversity index. Seed Sci. Technol. 2015, 43, 3. [Google Scholar] [CrossRef]
- Wang, Y.; Wang, D.; Shi, P.; Omasa, K. Estimating rice chlorophyll content and leaf nitrogen concentration with a digital still color camera under natural light. Plant Methods 2014, 10, 36. [Google Scholar] [CrossRef] [PubMed]
- Brainard, S.H.; Bustamante, J.A.; Dawson, J.C.; Spalding, E.P.; Goldman, I.L. A Digital Image-Based Phenotyping Platform for Analyzing Root Shape Attributes in Carrot. Front. Plant Sci. 2021, 12, 1171. [Google Scholar] [CrossRef]
- Golbach, F.; Kootstra, G.; Damjanovic, S.; Otten, G.; van de Zedde, R. Validation of plant part measurements using a 3D reconstruction method suitable for high-throughput seedling phenotyping. Mach. Vis. Appl. 2016, 27, 663–680. [Google Scholar] [CrossRef]
- Hemming, J.; Rath, T. PA–Precision Agriculture: Computer-Vision-based Weed Identification under Field Conditions using Controlled Lighting. J. Agric. Eng. Res. 2001, 78, 233–243. [Google Scholar] [CrossRef]
- Golzarian, M.R.; Frick, R.A. Classification of images of wheat, ryegrass and brome grass species at early growth stages using principal component analysis. Plant Methods 2011, 7, 28. [Google Scholar] [CrossRef] [PubMed]
- Berger, B.; Parent, B.; Tester, M. High-throughput shoot imaging to study drought responses. J. Exp. Bot. 2010, 61, 3519–3528. [Google Scholar] [CrossRef]
- Fanourakis, D.; Briese, C.; Max, J.F.; Kleinen, S.; Putz, A.; Fiorani, F.; Ulbrich, A.; Schurr, U. Rapid determination of leaf area and plant height by using light curtain arrays in four species with contrasting shoot architecture. Plant Methods 2014, 10, 9. [Google Scholar] [CrossRef] [PubMed]
- Acorsi, M.G.; das Fabiani, D.A.M.; Maurício, M.; Danrley, S.A.; Laercio, S.R. Estimating Biomass of Black Oat Using UAV-Based RGB Imaging. Agronomy 2019, 9, 344. [Google Scholar] [CrossRef]
- Bendig, J.; Bolten, A.; Bennertz, S.; Broscheit, J.; Eichfuss, S.; Bareth, G. Estimating biomass of barley using crop surface models (CSMs) derived from UAV based RGB imaging. Remote Sens. 2014, 6, 10395–10412. [Google Scholar] [CrossRef]
- Lu, N.; Zhou, J.; Han, Z.; Li, D.; Cao, Q.; Yao, X.; Tian, Y.; Zhu, Y.; Cao, W.; Cheng, T. Improved estimation of aboveground biomass in wheat from RGB imagery and point cloud data acquired with a low-cost unmanned aerial vehicle system. Plant Methods 2019, 15, 17. [Google Scholar] [CrossRef] [PubMed]
- Fageria, N.K.; Baligar, V.C.; Jones, C.A. Growth and Mineral Nutrition of Field Crops, 3rd ed.; CRC Press: Boca Raton, FL, USA, 2011. [Google Scholar]
- Eurostat. 2020. Available online: https://ec.europa.eu/eurostat/web/products-datasets/-/tag00047 (accessed on 28 October 2021).
- Ruiz, M.; Zambrana, E.; Fite, R.; Sole, A.; Tenorio, J.L.; Benavente, E. Yield and Quality Performance of Traditional and Improved Bread and Durum Wheat Varieties under Two Conservation Tillage Systems. Sustainability 2019, 11, 4522. [Google Scholar] [CrossRef]
- Mefleh, M.; Conte, P.; Fadda, C.; Giunta, F.; Piga, A.; Hassoun, G.; Motzo, R. From ancient to old and modern durum wheat varieties: Interaction among cultivar traits, management, and technological quality. J. Sci. Food Agric. 2019, 99, 2059–2067. [Google Scholar] [CrossRef]
- Charmet, G. Wheat domestication: Lessons for the future. C. R. Biol. 2011, 334, 212–220. [Google Scholar] [CrossRef]
- Guzmán, C.; Caballero, L.; Alvarez, J.B. Variation in Spanish cultivated einkorn wheat (Triticum monococcum L. ssp. monococcum) as determinated by morphological traits and waxy proteins. Genet. Resour. Crop Evol. 2009, 56, 601–604. [Google Scholar] [CrossRef]
- Hajnalová, M.; Dreslerová, D. Ethnobotany of einkorn and emmer in Romania and Slovakia: Towards interpretation of archeological evidence. Památky Archeol. 2010, 101, 169–202. [Google Scholar]
- Zaharieva, M.; Monneveux, P. Cultivated einkorn wheat (Triticum monococcum L. subsp. monococcum): The long life of a founder crop of agriculture. Genet. Resour. Crop Evol. 2014, 61, 677–706. [Google Scholar] [CrossRef]
- Péntek, J.; Szabó, T.A. Az alakor (Triticum monococcum) Erdélyben. Ethnographia 1981, 92, 259–277. (In Hungarian) [Google Scholar]
- Szabó, T.A. On the borderline of natural science and ethnology. In Ethnological Papers; Kriterion Publ. House: Bucharest, Romania, 1976; pp. 36–40. [Google Scholar]
- Jacomet, S. Identification of Cereal Remains from Archeological Sites; Archaeobotany Lab, IPAS, Basel University: Basel, Switzerland, 2006; 61p. [Google Scholar]
- Bencze, S.; Makádi, M.; Aranyos, T.J.; Földi, M.; Hertelendy, P.; Mikó, P.; Bosi, S.; Negri, L.; Drexler, D. Re-Introduction of Ancient Wheat Cultivars into Organic Agriculture—Emmer and Einkorn Cultivation Experiences under Marginal Conditions. Sustainability 2020, 12, 1584. [Google Scholar] [CrossRef]
- Castagna, R.; Borghi, B.; Di Fonzo, N.; Heun, M.; Salamini, F. Yield and related traits of einkorn (T. monococcum ssp. monococcum) in different environments. Eur. J. Agron. 1995, 4, 371–378. [Google Scholar] [CrossRef]
- Dinu, M.; Whittaker, A.; Pagliai, S.; Sofi, F. Ancient wheat species and human health: Biochemical and clinical implications. J. Nutr. Biochem. 2018, 52, 1e9. [Google Scholar] [CrossRef] [PubMed]
- Ribeiro, M.; Rodroguez-Quijano, M.; Nunes, F.M.; Carillo, J.M.; Branlard, G.; Igrejas, G. New insights into wheat toxicity: Breeding does not seem to contribute to a prevalence of potential celiac disease’s immunostimulatory epitopes. Food Chem. 2016, 213, 8e18. [Google Scholar] [CrossRef]
- Shewry, P.R. Do ancient types of wheat have health benefits compared with modern bread wheat? J. Cereal Sci. 2018, 79, 469–476. [Google Scholar] [CrossRef] [PubMed]
- Ferreira, T.; Rasband, W. ImageJ User Guide-IJ1.46r. 2012. Available online: http://imagej.nih.gov/ij/docs/guide (accessed on 28 October 2021).
- MTA ATK. Martonvásári fajtakatalógus 2014–2015. In Cultivar Catalogue of Martonvásár; MTA ATK Mezőgazdasági Intézet: Martonvásár, Hungary, 2015. (In Hungarian) [Google Scholar]
- Juhász, A.; Larroque, O.R.; Tamás, L.; Hsam, S.L.; Zeller, F.J.; Békés, F.; Bedo, Z. Bánkúti 1201-an old Hungarian wheat variety with special storage protein composition. Theor. Appl. Genet. 2003, 107, 697–704. [Google Scholar] [CrossRef]
- Balla, K.; Karsai, I.; Bencze, S.; Kiss, T.; Veisz, O. Effect of heat stress on the physiological processes of wheat. Acta Agron. Hun. 2013, 61, 1–12. [Google Scholar] [CrossRef]
- Conviron PGR15. Reach-In Plant Growth. In Management System Certified to ISO 9001; Controlled Environments Ltd.: Winnipeg, Canada, 2018. [Google Scholar]
- Morris, C.E.; Sands, D.C. The breeder’s dilemma—Yield or nutrition? Nat. Biotechnol. 2006, 24, 1078–1080. [Google Scholar] [CrossRef] [PubMed]
- Hidalgo, A.; Brandolini, A.; Ratti, S. Influence of genetic and environmental factors on selected nutritional traits of Triticum monococcum. J. Agric. Food Chem. 2009, 57, 6342–6348. [Google Scholar] [CrossRef]
- Van Boxstael, F.; Aerts, H.; Linssen, S.; Latré, J.; Christiaens, A.; Haesaert, G.; Dierickx, I.; Brusselle, J.; De Keyzer, W. A comparison of the nutritional value of Einkorn, Emmer, Khorasan and modern wheat: Whole grains, processed in bread, and population-level intake implications. J. Sci. Food. Agric. 2020, 100, 4108–4118. [Google Scholar] [CrossRef] [PubMed]
- Hidalgo, A.; Brandolini, A. Nutritional properties of einkorn wheat (Triticum monococcum L.). J. Sci. Food Agric. 2014, 94, 601–612. [Google Scholar] [CrossRef] [PubMed]
- Brandolini, A.; Hidalgo, A. Einkorn (Triticum monococcum) flour and bread. In Flour and Breads and Their Fortification in Health and Disease Prevention; Preedy, V.R., Watson, R.R., Patel, V.B., Eds.; Academic Press: London, UK, 2011; pp. 79–88. [Google Scholar] [CrossRef]
- Lee, K.J.; Lee, B.W. Estimation of rice growth and nitrogen nutrition status using color digital camera image analysis. Eur. J. Agron. 2013, 48, 57–65. [Google Scholar] [CrossRef]
- Sehgal, A.; Sita, K.; Siddique, K.H.M.; Kumar, R.; Bhogireddy, S.; Varshney, R.K.; Hanumantha, R.B.; Nair, R.M.; Prasad, P.V.V.; Nayyar, H. Drought or/and Heat-Stress Effects on Seed Filling in Food Crops: Impacts on Functional Biochemistry, Seed Yields, and Nutritional Quality. Front Plant Sci. 2018, 27, 1705. [Google Scholar] [CrossRef]
- Li, W.; Niu, Z.; Huang, N.; Wang, C.; Gao, S.; Wu, C. Airborne LiDAR technique for estimating biomass components of maize: A case study in Zhangye City, Northwest China. Ecol. Indic. 2015, 57, 486–496. [Google Scholar] [CrossRef]
- Iqbal, F.; Lucieer, A.; Barry, K.; Wells, R. Poppy crop height and capsule volume estimation from a single UAS flight. Remote Sens. 2017, 9, 647. [Google Scholar] [CrossRef]


Publisher’s Note: MDPI stays neutral with regard to jurisdictional claims in published maps and institutional affiliations. |
© 2021 by the authors. Licensee MDPI, Basel, Switzerland. This article is an open access article distributed under the terms and conditions of the Creative Commons Attribution (CC BY) license (https://creativecommons.org/licenses/by/4.0/).