Abstract
This study aimed to examine the spatial structure of the tourist attraction cooperation network in the Yangtze River Delta, from the perspective of tourist flow. This study conducted spatial and social network analyses of 470 popular tourist attractions in the Yangtze River Delta region of China, accounting for the occurrence and co-occurrence of tourist attraction information in tourist travel notes. The analyzed tourist attractions show an obvious spatial agglomeration effect, including four high-density agglomeration areas and two medium-density agglomeration areas. Degree centrality, closeness centrality, and betweenness centrality were used to examine the tourism function, distribution function, and connection function of nodes in the network; nodes were divided into various types of roles according to their function. There are eight condensed subgroups, but their scales are unbalanced. In these condensed subgroups, several tourist attractions with an intermediate function can be selected as transit and stopover points on tourist routes. This study can contribute to the understanding of tourists’ spatial behavior, clarify the role and status of nodes in the cooperation network of tourist attractions based on tourism flow, and help them to formulate measures for the joint marketing of tourist attractions, and promote the development of tourism in the Yangtze River Delta region.
1. Introduction
The spatial structure of regional tourism cooperation networks among 27 cities in the Yangtze River Delta can be explored from the perspective of supply and demand [1,2,3,4]. The main supply body of regional tourism cooperation should include governments, tourism enterprises, and non-governmental tourism organizations, but in the absence of non-governmental tourism organizations in China, governments and tourism enterprises become the core body of regional tourism cooperation supply networks. Governments play a leading role in regional tourism cooperation by formulating regional tourism cooperation plans to improve the relevant infrastructure and enhance the image of regional tourism. In response, tourism enterprises jointly design tourism routes, carry out publicity and promotional activities, provide reception services and other measures, and jointly build the supply network for regional tourism cooperation. On the demand side, the multi-destination travel behaviors of tourists contribute to regional tourism cooperation demand networks. In fact, the government, tourism enterprises, and tourists are key driving forces for the formation of regional tourism cooperation networks. The government’s regulation and control power, as well as the executive power of tourism enterprises, promote the optimal combination and orderly development of destinations, and constitute the external driving force for the formation of regional tourism cooperation networks. The multi-destination travel preference of tourists can be regarded as the internal driving force of regional tourism cooperation networks. When the measures of regional tourism cooperation formulated by the government and tourism enterprises can effectively meet the needs of tourists for regional tourism cooperation, they will be beneficial to the development of regional cooperation; otherwise, they will delay the formation and evolution of regional tourism cooperation networks.
A tourist attraction is the basic unit of a regional tourism cooperation network. It is also an independent administrative area with appropriate tourist facilities and services that can meet the needs of tourists, such as sightseeing, leisure, vacation, recreation, and fitness [1,2]. When there are multiple tourist attractions to choose from in a region, tourists will select their favorite attractions based on their available time and money, indirectly leading to spatial competition or cooperation among tourist attractions [2,3,4,5]. In order not to get lost in the competition, neighboring tourist attractions will depend on each other and seek cooperation to increase their attractiveness to tourists [6]. In other words, tourist attractions cooperate to realize their interests, cope with external competition, and eventually improve their own competitiveness and that of their group. The coexistence of competition and cooperation among tourist attractions manifests itself spatially as a dynamic change in the fluctuation of tourist attractions or as synchronous growth leading to a process of elimination, cooperation, or restructuring of the tourism market in the region [7,8,9].
Previous studies have shown that tourist attraction cooperation can be defined “as a set of nodes and the set of ties representing some relationship” [10,11]. Therefore, the cooperation between tourist attractions can be considered a social relationship network, which also reflects the spatial relationship structure between tourist attractions [12,13]. As for research on the cooperation network of tourism attractions, most of the previous studies on the government’s policies or measures for the cooperation of tourism attractions are from the perspective of supply [14,15,16,17,18,19,20,21]. The cooperation network of tourist attractions is closely related to tourism flow [22,23,24,25,26,27]. On the demand side, the spatial decision-making behavior of tourists influences the form, scope, and structure of the cooperation network between tourist attractions. Despite great efforts in tourism planning and policy, government policies and actions are often criticized as diverging from tourism needs, which will negatively affect tourists’ approval and support of these policies [28,29,30,31,32]. Cooperation between different tourist attractions is a common element of government policy, but it needs the support of tourists to be effective. Therefore, tourists’ views on cooperation among tourist attractions can significantly influence the formulation of appropriate tourism policies. In addition, the “top-down” cooperation structure of tourist attractions at the government level may lack flexibility, which could lead to unfair competition among tourist attractions and negative phenomena such as local protectionism. Although cooperation between tourist attractions is very important [33,34,35,36,37,38,39,40,41,42], few studies have examined how collaborations can be formed to meet tourists’ needs, which are reflected in tourists’ spatial behavior (tourist flows). For example, some scholars have made a comparative analysis of the different forms of cooperation and the differences between tourist attractions of level 3A and above in Shanghai (as shown in travel notes and official news) and found that tourists’ perceptions of cooperation in scenic spots did not match the perspective of government policies, which may lead to government policies’ failure to achieve the expected effect. This suggests that it is necessary for the Chinese government to focus on acquiring an accurate picture of tourists’ preferences and demands [2]. Therefore, it is necessary to understand tourists’ views on cooperation between tourist attractions, which can be reflected in the spatial characteristics of tourist flows [2,3,4]. Tourists can promote the relationship between different tourist attractions through freely chosen spatial behavior and movement. To maximize satisfaction and minimize costs, tourists increasingly tend to travel to multiple destinations. This has transformed the original separation and isolation between tourist attractions into a spatial network pattern of contact and cooperation [2]. Tourists’ perceptions or feelings about cooperative tourism products between tourist attractions are important factors driving purchase decisions [31]. In recent years, the use of the Internet as the main source of data for the analysis of web texts has become increasingly prevalent in tourism literature [2,32]. The current applications and configurations are based on a good theoretical foundation and solid methods. As a result, web text analysis is increasingly used in research of various disciplines, including tourism and hospitality, especially in terms of tourism supply, destinations, political systems, tourist movements, and behavioral patterns. With the development of Internet technology, an increasing number of travelers use online travel notes to share or find information, and make travel decisions. The content of travel notes contains tourists’ perceptual memory and records travel routes and how destinations cooperated and interacted with each other in terms of demand. Asero and Gozzo studied regional tourism cooperation formed by tourist flows and confirmed that tourist flows influence the form, scale, and structure of cooperation between different tourist destinations [4]. Hong et al. examined the relationship between tourist attraction cooperation and tourism flows in China [3]. The co-occurrence frequency of tourist attractions in travel notes reflects tourists’ spatial behavior preferences and the demand of tourist attractions’ cooperation [2]. The tourist flow between tourist attractions can be regarded as a social relationship network, which reflects the spatial relationship structure between tourist attractions. The temporal and spatial characteristics as well as the network structure of tourist flow in travel notes can be explored through social network analysis.
Although cooperation among tourist attractions has attracted the attention of some scholars, research on cooperation among tourist attractions from the perspective of tourism flow is still relatively insufficient. Moreover, few studies in China focus on tourist attraction cooperation. This study aims to fill this research gap by conducting a network analysis of online travel notes on related websites, and analyzing the cooperation of tourist attractions from a comprehensive tourism flow perspective. This study aims to analyze the cooperation network of tourist attractions in the Yangtze River Delta from the perspective of tourism flow, identifying the structure of relationships and tourist flow of network structures in this region. Therefore, the research questions of this study are as follows: What are the spatial distribution rules of tourist flows between tourist attractions? Is there a spatial agglomeration effect? What role do different tourist attractions play in the tourist flow network? Are there cliques emerging within the tourist flow network? These questions also reflect the views of tourists on the cooperation between tourist attractions, which can provide valuable insights for the government and tourism enterprises to formulate appropriate policies and measures for regional tourism cooperation. To answer these questions, four sub-objectives are established.
First, this study uses spatial analysis GIS to identify the spatial aggregation of tourist movements and flows in the Yangtze River Delta, which reflects the cooperation of tourist attractions.
Second, based on the characteristics of tourist flow, this paper uses social network analysis and GIS to explore the role of different tourist attractions in the regional tourism cooperation network structure.
Third, the Concor algorithm in Ucinet is used to analyze the condensed subgroup of the tourist attraction cooperation network in the Yangtze River Delta, which provides a reference for the establishment of a cooperative alliance between tourist attractions.
Fourth, this study uses and analyzes travel notes posted by tourists on the Internet as a source of data, which provides us with a new concept and basis for the rational development of itineraries for travel agencies, as well as for the scientific determination of the most important tourist attractions and stopovers on the routes, based on the needs of tourists.
2. Materials and Methods
2.1. Study Area
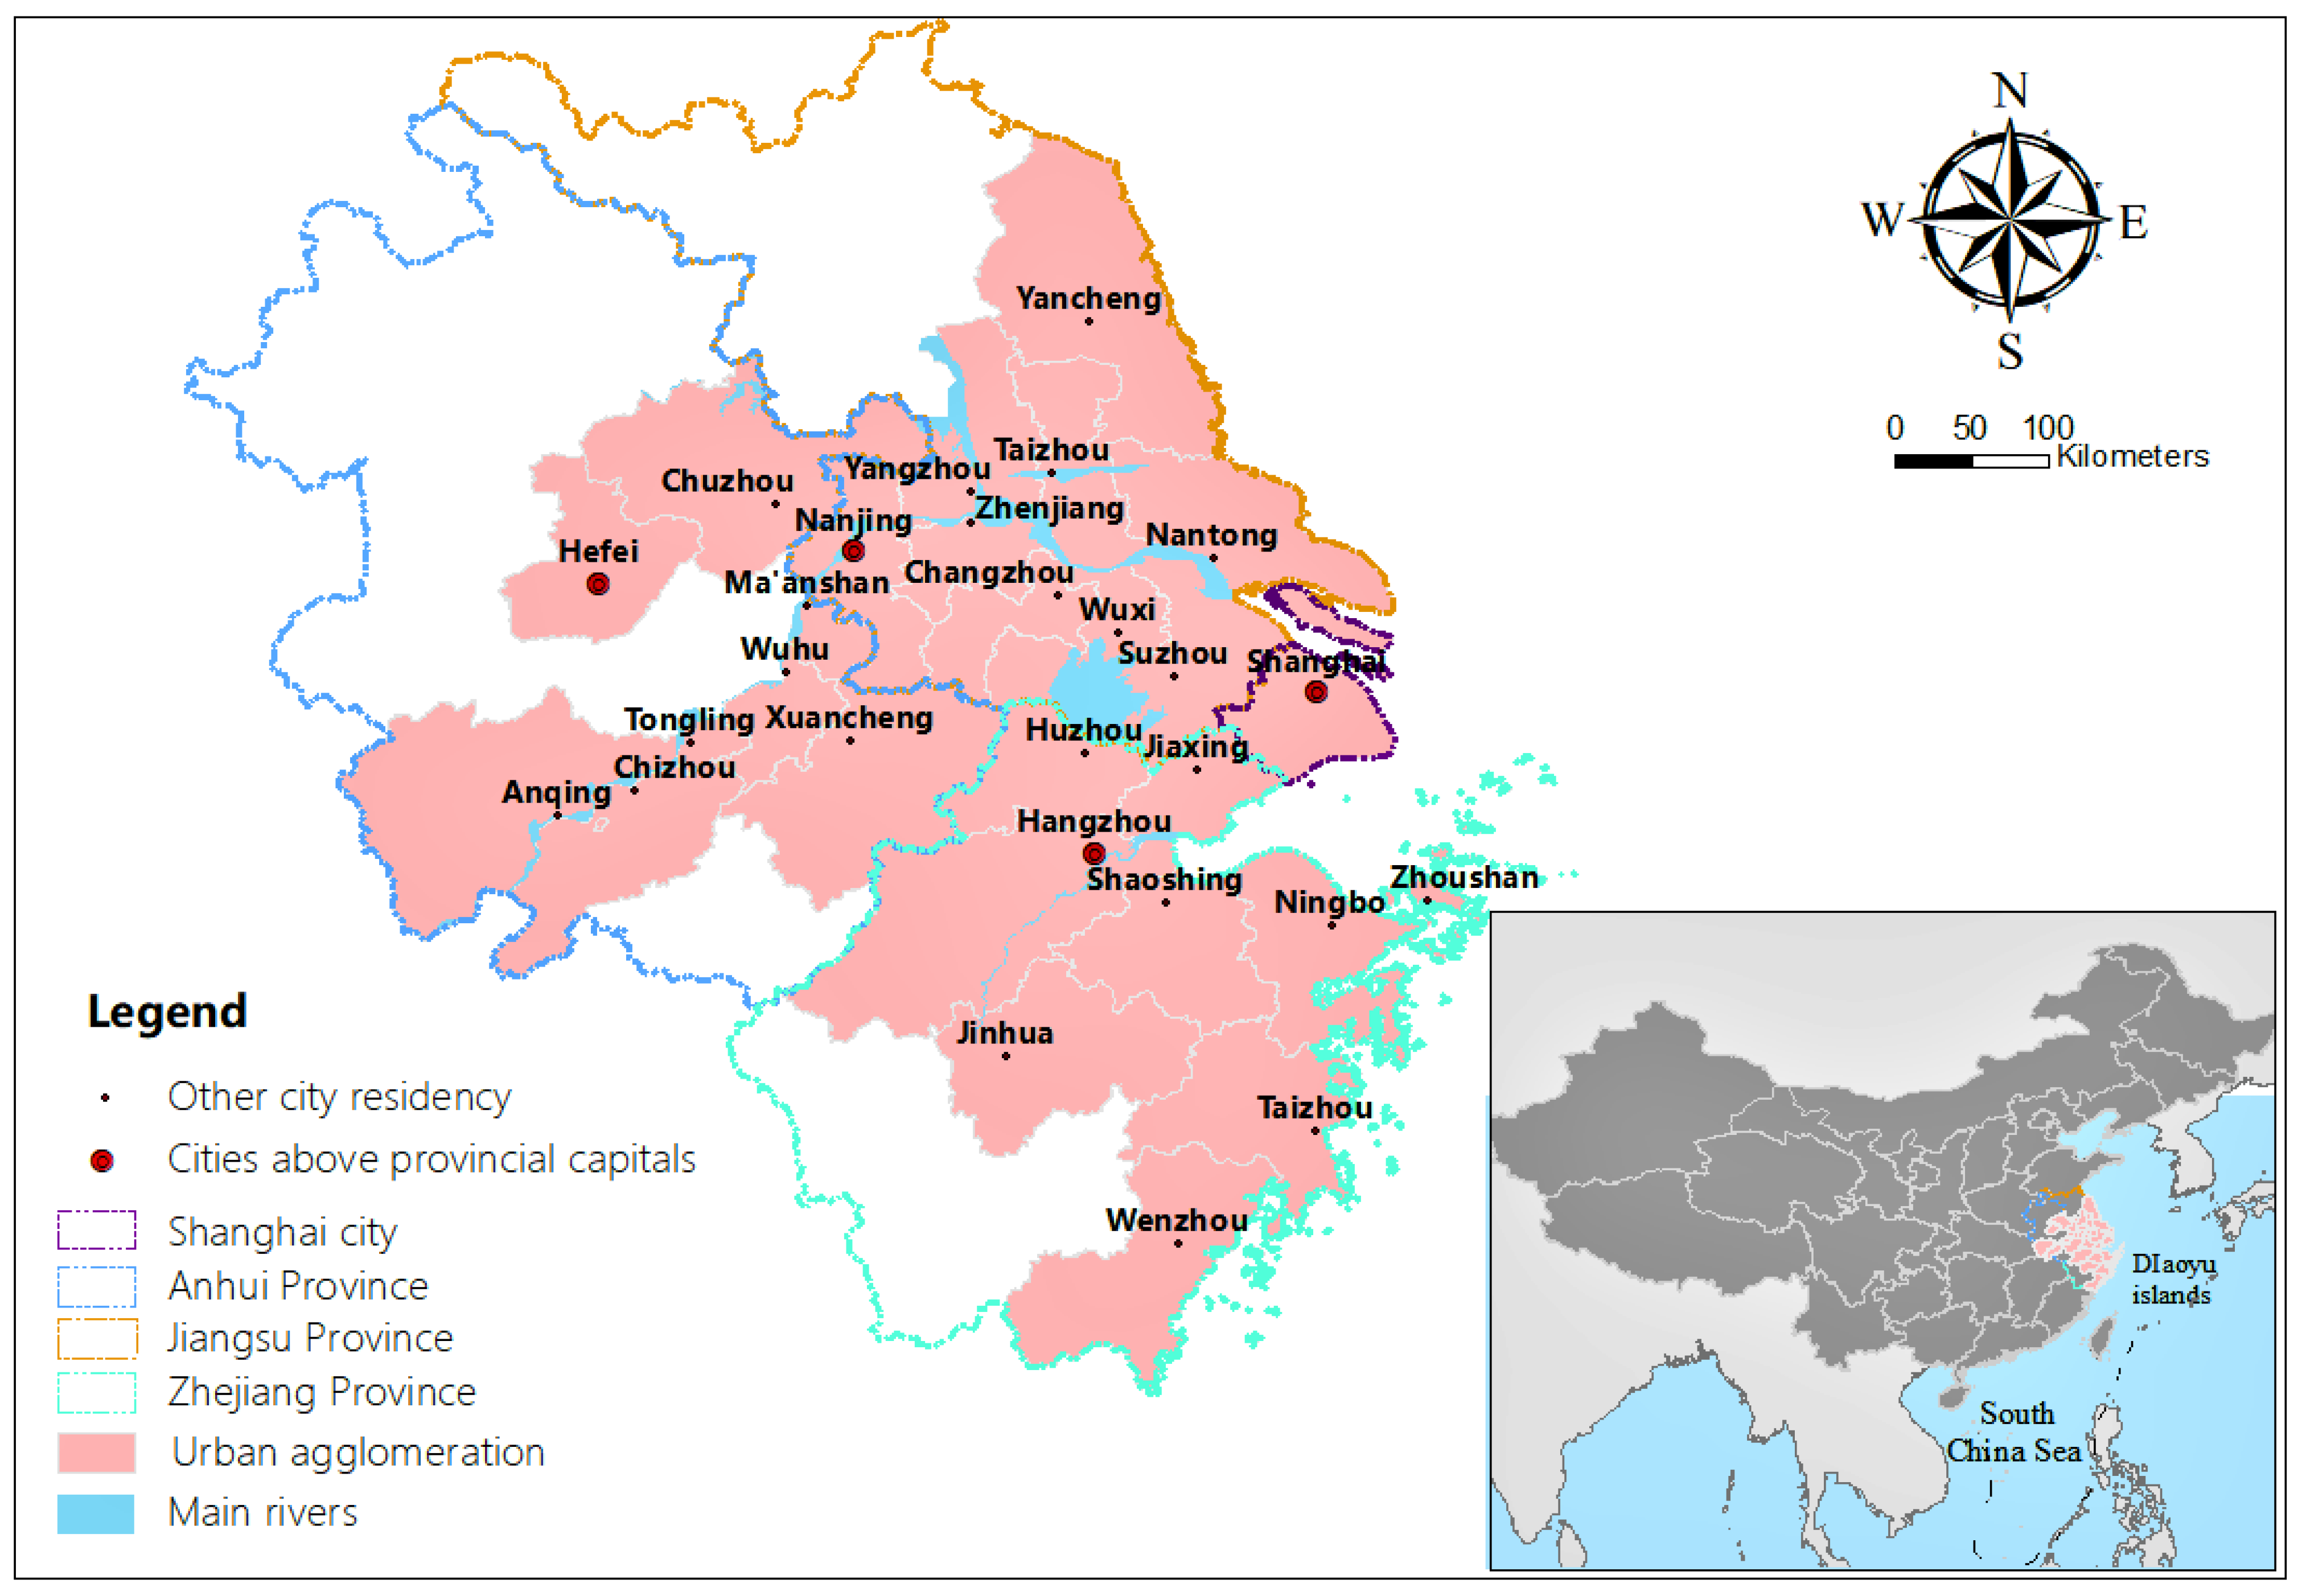
The Yangtze River Delta in China, which encompasses parts of Jiangsu, Zhejiang, Anhui, and Shanghai, is a key development area with two horizontal and three vertical urbanization patterns, covering more than 5000 tourist attractions of various sizes (Figure 1). Since 2003, the Yangtze River Delta Tourism City Summit has been held continuously, and a regional tourism cooperation agreement to advocate for the construction of a barrier-free tourism circle has been signed. By 2019, 27 cities in the Yangtze River Delta had participated in the cooperation agreement.
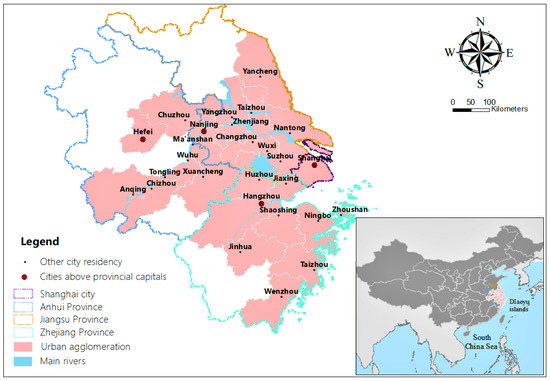
Figure 1.
The location of the study area (Yangtze River Delta, China).
2.2. Data Collection and Analysis
In this study, the cooperative network structure of tourist attractions in the Yangtze River Delta was investigated by crawling online travel notes, which can reflect the multi-destination behavior of tourists (tourist flow). The basic idea of Python web crawler is as follows: first, get the source code of the web page (right mouse click > display the source file); second, find the information matching the requirements in the source code of these web pages and connect to the database; third, each successfully matched information is stored in the database until all web pages have been retrieved. During the whole process of data crawling, according to the level of each web page, appropriate anti-crawling strategies should be implemented to ensure the continuity of data crawling. Finally, a total of 68,276 online travel notes from 27 cities in the Yangtze River Delta from 2017–2019 were collected by Ctrip, Qunar, and Tuniu using the Python language. An inclusion criterion for travel notes in this study was that they should cover at least two tourist attractions in different cities. After eliminating travel notes that included only one tourist attraction, 28,301 valid travel notes were selected. To further screen the online travel notes, first, those with text content of more than 500 words were screened out. Second, to ensure that the selected online travel notes included only narrative texts, scientific texts and tourist attraction marketing texts with only pictures that mainly introduced tourist attractions were excluded. Finally, different names representing the same tourist attraction in online travel notes were unified.
The obtained online travel notes, which covered 2312 tourist attractions in the Yangtze River Delta, were sorted into Microsoft Excel. To clearly explain the cooperation between tourist attractions, non-popular tourist attractions were removed, and tourist attractions with a frequency of more than 5% in the travel notes were selected for calculation. A total of 470 high-frequency popular tourist attractions were extracted from 27 cities in the Yangtze River Delta. These high-frequency hot spots have a state of spatial agglomeration, including 198 natural and 272 man-made tourist attractions accounting for 47.13% and 57.87%, respectively. Thus, the types of tourism resources were relatively balanced.
Using Python programming, the word frequency of tourist attractions in Microsoft Excel was converted into a 28,301 × 470 matrix, where each “row” of the matrix represented the coding sequence of each tourist (28,301, in total), and each “column” represented one of 470 tourist attractions. If tourists visited an attraction, it was marked as 1; otherwise, it was marked as 0. According to the arrangement of attractions visited by tourists, a binary undirected initial matrix of “28,301 rows × 470 columns” was created. The initial two-level matrix was converted into a multi-valued adjacency matrix of “470 rows × 470 columns”, and the attribute data were converted into relational data. The research revealed that the basic idea of creating the co-occurrence matrix is as follows: first, an identity matrix is constructed. Second, the co-occurrence of the target object is calculated by the algorithm. Third, enter the result into the corresponding matrix element. The frequency of co-occurrence of tourist attractions in travel notes reflects the preference of tourists’ spatial behavior as well as the demand and potential of cooperation of tourist attractions. Therefore, one of the objectives of this study is to help the government and tourism enterprises understand the impact of tourists’ spatial behavior on the cooperation of tourist attractions. In the co-occurrence matrix of any two tourist attractions in travelogues, the higher the co-occurrence frequency of tourist attractions is, the stronger the demand for cooperation between tourist attractions is [2]. For this type of matrix, it is convenient to use the corresponding index and column names of the target object. Therefore, this article uses the DataFrame in Python’s Pandas library to construct the matrix. The design code is as follows:
def getgcjz ():
keyw20 = pd.read_excel (‘word.xlsx’) [‘Decompose the word’].tolist ()
nrlist = open (‘tb.txt’, ’r’, encoding = ‘utf-8’).readlines ()
relationmat = pd.DataFrame (index = keyw20, columns = keyw20).fillna (0)
wordss = nrlist
for k in range (len (wordss)):
for i in keyw20:
for j in keyw20:
if i in words [k] and j in words [k]:
relationmat.loc [i,j] + = 1
relationmat.to_excel (‘Total word matrix.xlsx’)
2.3. Research Methods
2.3.1. GIS Spatial Analysis Method
A geographic information system (GIS) is a computer information system used to collect, process, analyze, and interpret geospatial data. Using ArcGIS 10.4 software, the frequency at which tourists visited tourist attractions in the Yangtze River Delta was visualized, a kernel density map was drawn, and centrality was analyzed via inverse distance weighting (IDW) [43,44,45].
Kernel density analysis: This method was used to study the spatial agglomeration characteristics of tourist flows in tourist attractions in the Yangtze River Delta and calculate their heat (visit frequency) [46,47]. The formula is as follows:
where is the bandwidth, is the kernel function, and is the distance from the estimated point to the event point. Here, the kernel density value is dimensionless. The larger the value, the more intensive the tourist flow.
The frequency of tourists’ actual visits was used as the population field. In the mapping process, the PLANAR method was applied to extrapolate estimations, and the frequency numbers were divided into seven levels via a natural segmentation method and represented by different colors. The default value was adopted for search scope and output grid size. Finally, a spatial distribution density map of the visiting frequency of tourist attractions in the Yangtze River Delta was generated.
Inverse distance weighting: The spatial distribution mode of points can be roughly divided into uniform distribution, clustering distribution, and random distribution. To study spatial point data, attention should be paid to the dispersion or agglomeration of all sample observation points in spatial distribution. Spatial interpolation is to establish interpolation functions based on a quantitative set of sampling points . Then, the geographical coordinates, , of any spatial point in a finite set of sampling points are substituted into the function formula, , to calculate its attribute value. Among them, IDW has the advantages of simple principle and convenient calculation, and is in accordance with the first law of geography [48,49]. It is widely used in the construction of the digital elevation model, meteorological and hydrological analysis, etc. Usually, the distance search strategy is used to select the interpolation reference points. The formula is as follows:
where is the weight of data points and the reciprocal of the square of the distance between interpolation points and data points, and is the attribute value of the point to be measured.
2.3.2. Social Network Analysis
Social network analysis is a new economic sociology research method that examines social networks and relationships among actors. Cooperation among tourist attractions forms a diversified and complex network structure, which has blurred regional boundaries [50]. Tourist attractions are manifested as a group of nodes and a group of ties representing a certain relationship, which is embedded in a cooperative network structure. Network structure, centrality, and condensed subgroups were selected to analyze the structural characteristics of the tourist attraction cooperation network in the Yangtze River Delta.
Centrality: Degree centrality reflects the central position of an individual tourist attraction in the overall network [51,52]. The higher the degree centrality, the more connections a tourist attraction has with other tourist attractions, and the more central the tourist attraction is. Closeness centrality reflects the uncontrolled degree of an individual tourist attraction in the overall network [53]. If the distances between a point and all other points are all very short, the point has higher closeness centrality in the network. Betweenness centrality reflects the degree of controlling the association relations with other tourist attractions [54]. The higher the betweenness centrality, the stronger the ability to control the relationships with other tourist attractions, and the tourist attraction is closer to the center of the network [55]. The formula is as follows:
where is the relative degree centrality of point , and the ratio between the absolute degree centrality of point and the maximum degree of point in the graph; is the absolute degree centrality of point , which refers to the number of other points connected with point in the network; is the number of nodes; is the relative betweenness centrality of point ; is the absolute betweenness centrality of point ; is the relative closeness centrality of point ; and is the absolute closeness centrality of point [56,57,58].
3. Results and Discussion
3.1. Kernel Density Analysis
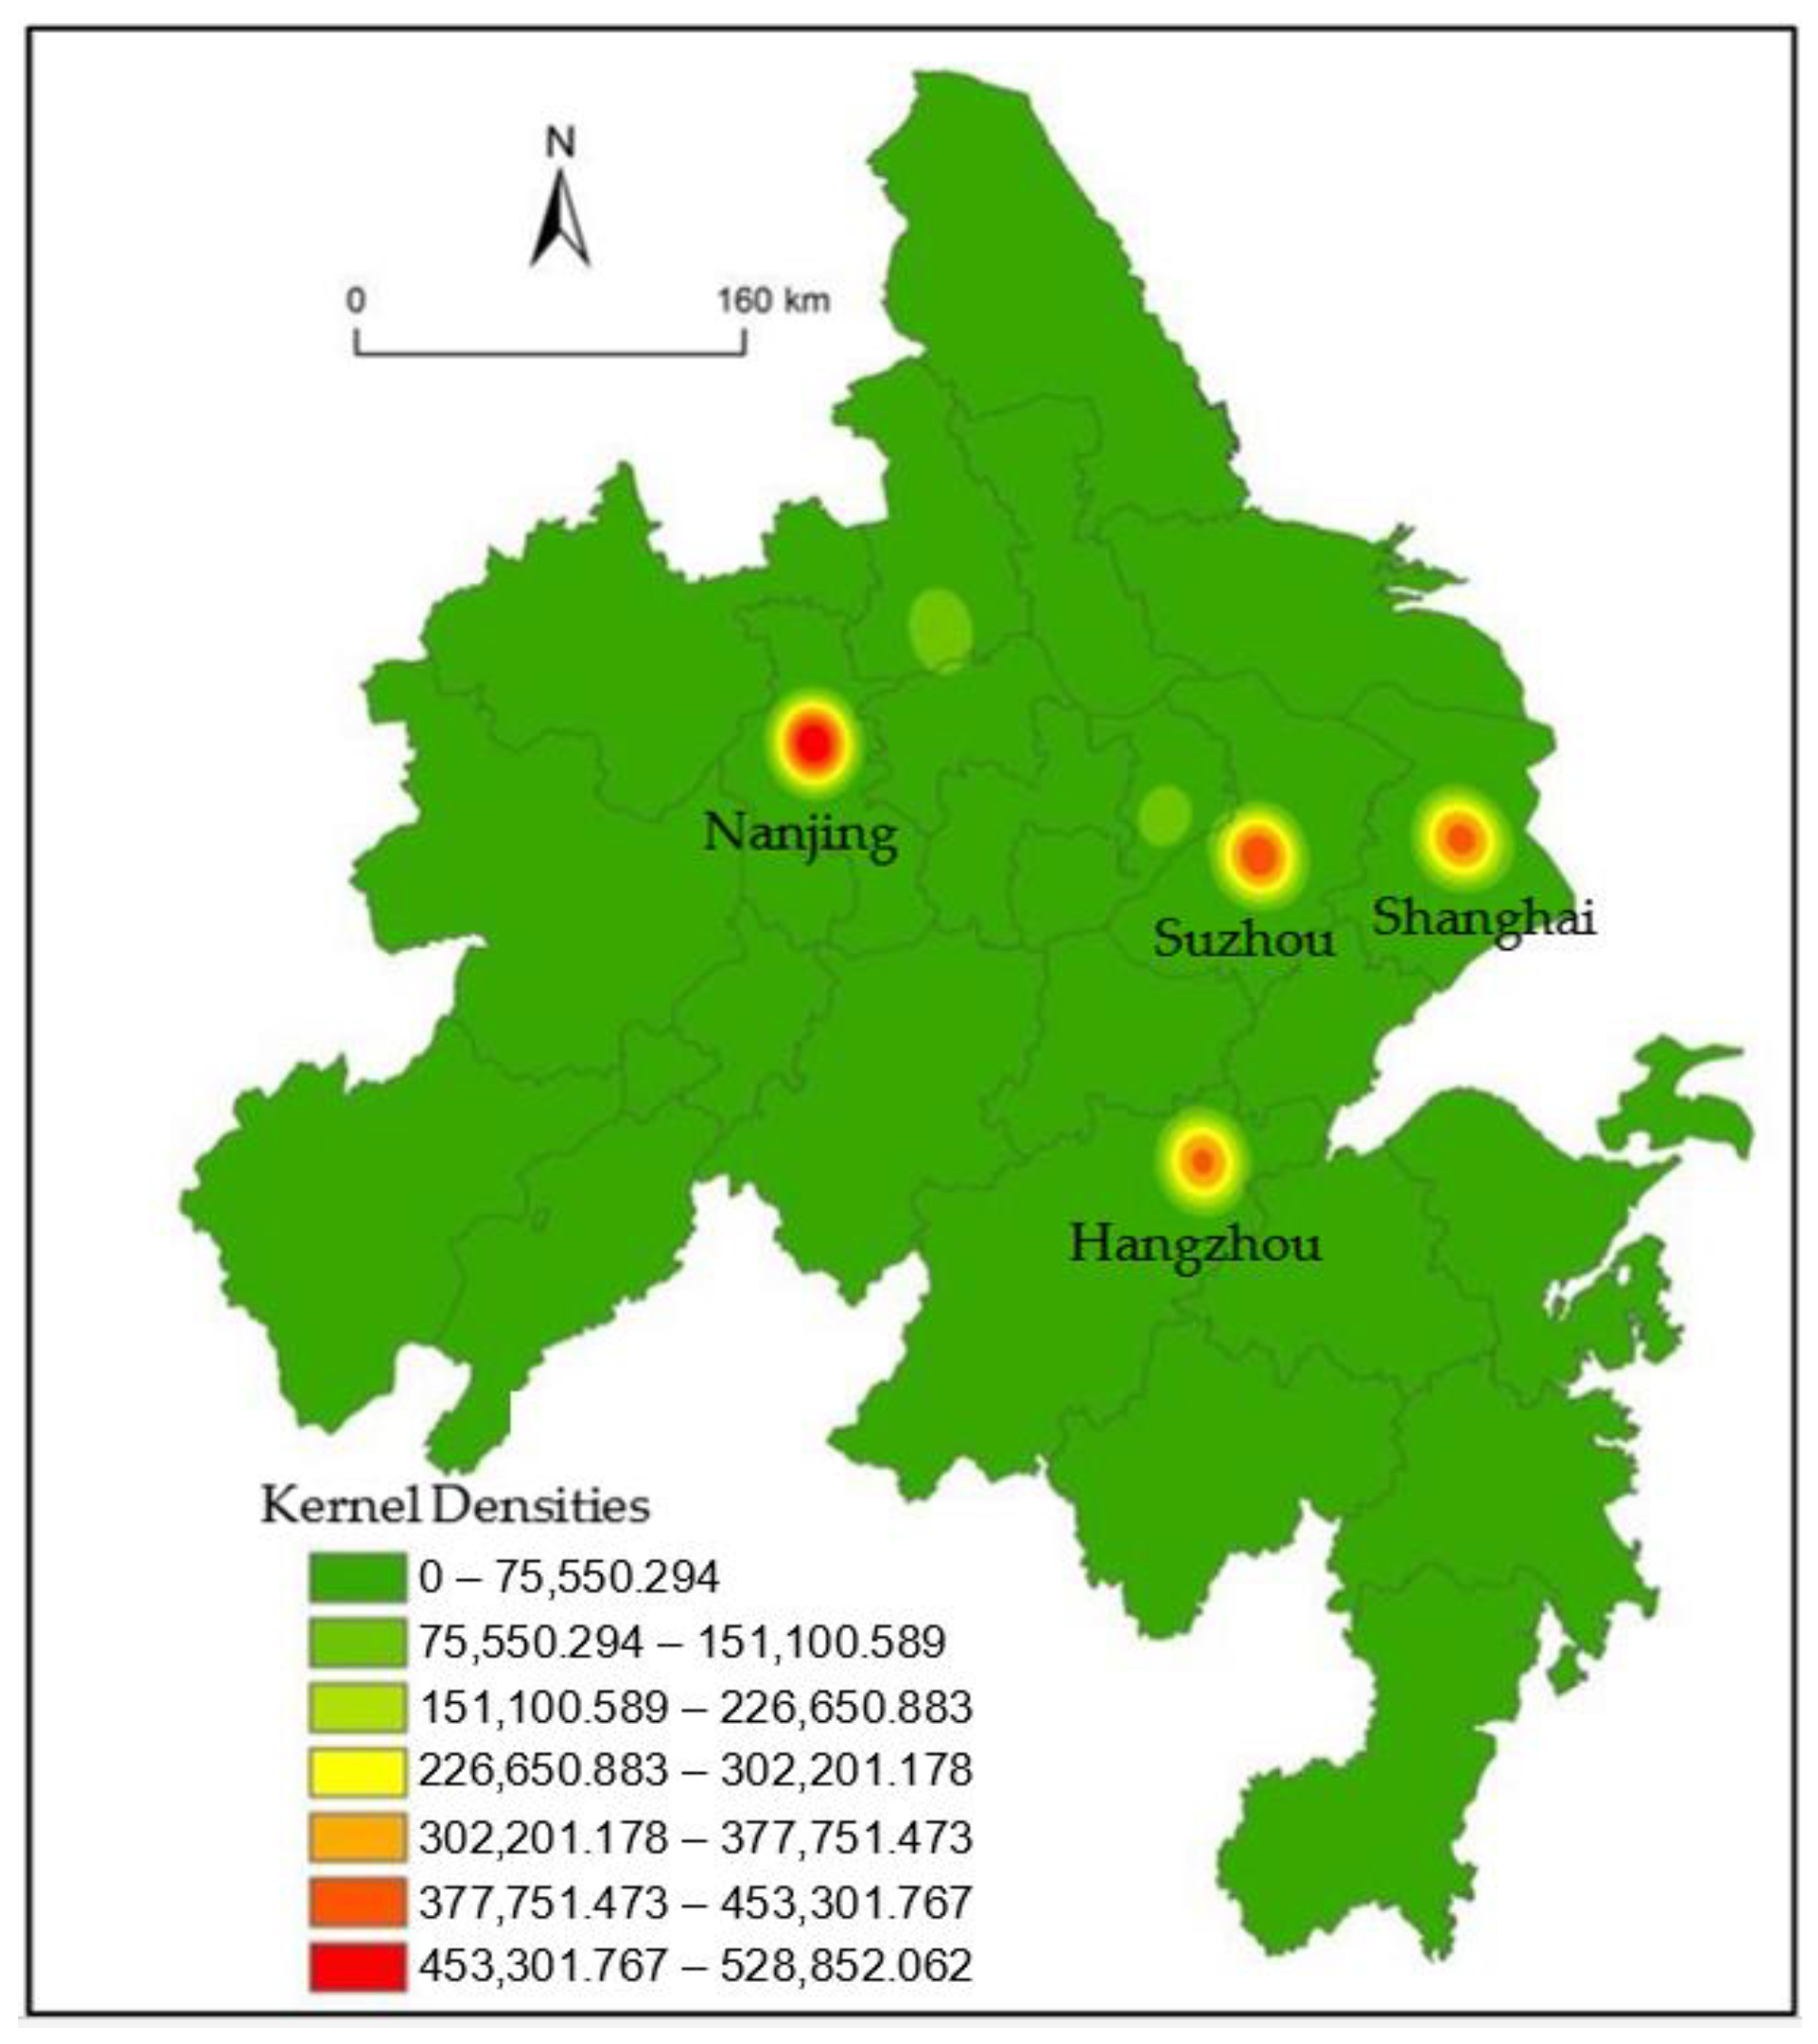
Based on the results of kernel density analysis, a spatial density map of the tourist attractions was generated, reflecting the spatial aggregation of tourist flows at 470 tourist attractions in the Yangtze River Delta (Figure 2). Regarding spatial distribution, the frequency of scenic visits in the Yangtze River Delta presents four high-density and two medium-density agglomeration areas. The high-density agglomeration areas are centered on Disneyland and the Oriental Pearl Tower in Shanghai, West Lake and the Temple of the Soul’s Retreat in Hangzhou, the Confucius Temple and Qin Huai River in Nanjing, and the Humble Administrator’s Garden and Suzhou Museum in Suzhou. One medium-density agglomeration area is centered on Geyuan Garden and Slender West Lake in Yangzhou, while another is centered on Turtle Head Isle and Nianhua Bay in Wuxi. These agglomeration areas represent the main tourist flows in the Yangtze River Delta, thus reflecting that tourists tend to travel to attractions with unique tourism resources, better facilities and services, and developed transportation. With an increase in distance from the core tourist attraction of an agglomeration area, the tourist flow will obviously weaken. In addition, owing to the lack of attractive core resources and products, many regions are unable to attract a large number of tourists, thus forming cold areas (green areas) with weak agglomeration capacity. Overall, in the Yangtze River Delta, there is an unbalanced distribution of tourism flows, the number of agglomeration areas with strong radiation capacity is limited, and most of the cold areas do not form the agglomeration effect driven by core tourist attractions.

Figure 2.
Kernel density analysis of the tourist attractions in the Yangtze River Delta.
3.2. Nodal Structure Analysis
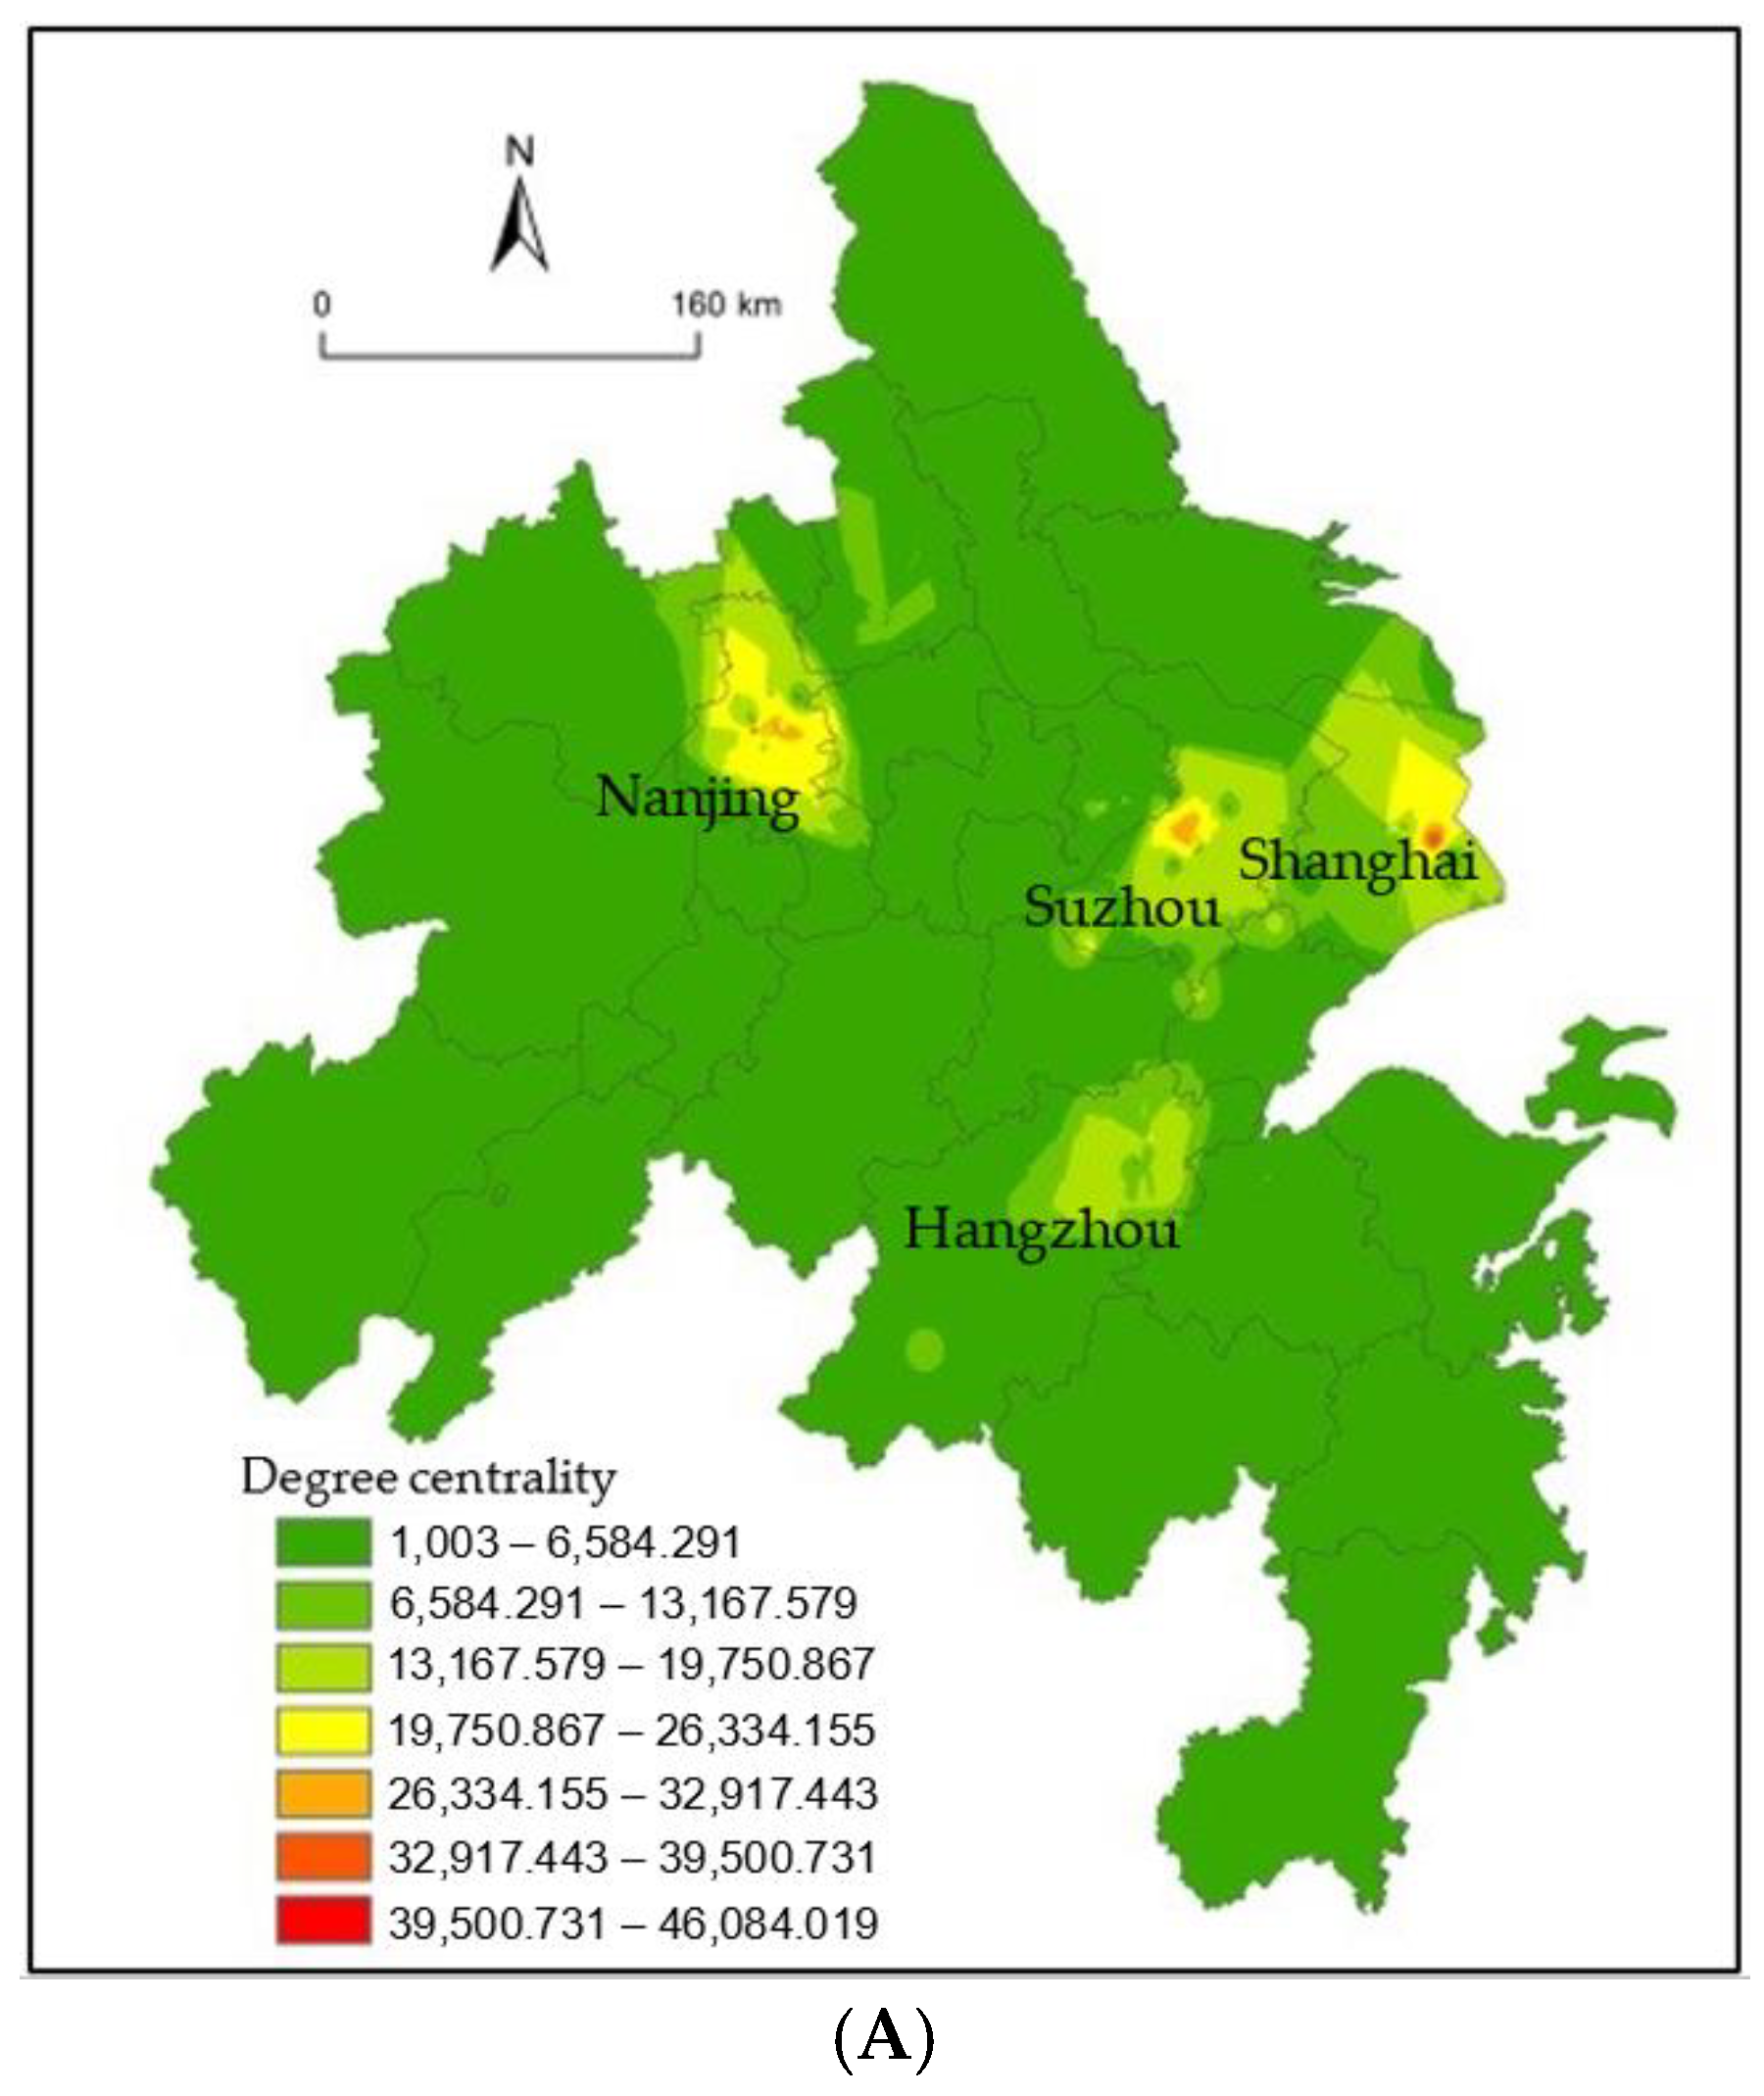
Degree centrality, closeness centrality, and betweenness centrality were used to examine the tourism function, distribution function, and connection function of nodes in the network, and nodes were divided into various types of roles according to their function. Owing to the limited space, it was not possible to display all the calculated results of 470 tourist attractions. Therefore, Netdraw and IDW were used for visual centrality analysis (Figure 3). The hierarchical color method was used to reflect the degree of mutual influence of various tourist attractions and the agglomeration relationship of high-frequency tourist attractions in the Yangtze River Delta. The centrality of each tourist attraction is visually displayed on the map.

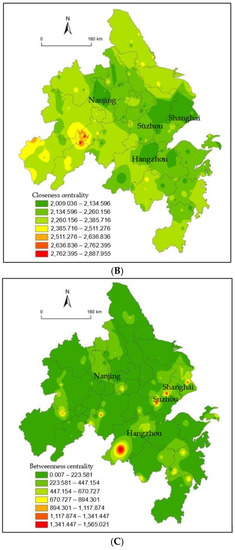
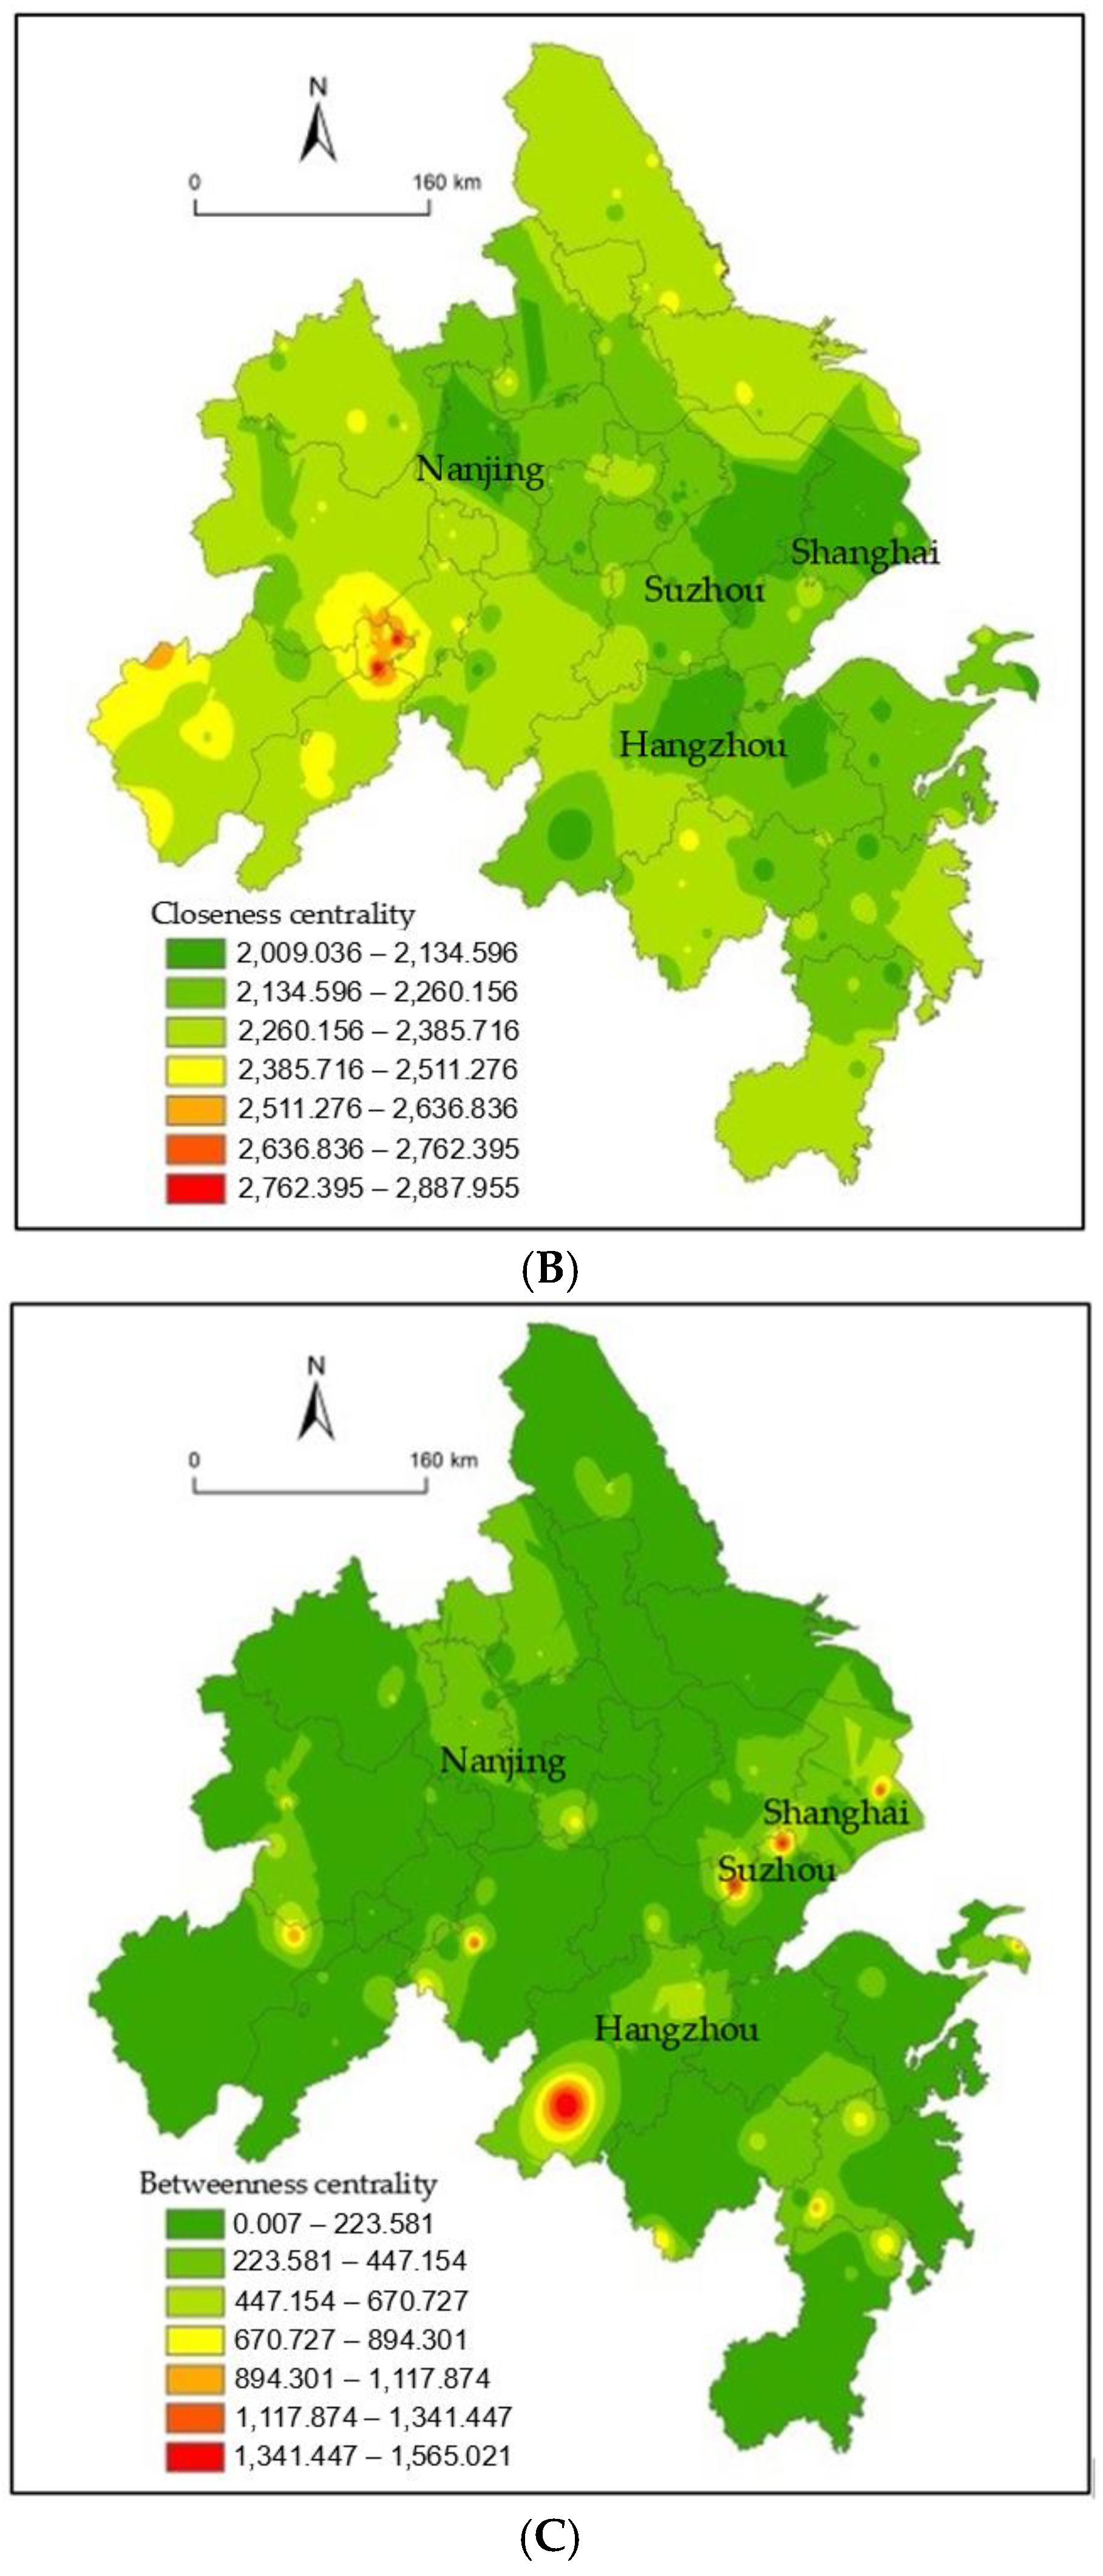
Figure 3.
(A) Degree centrality analysis result. (B) Closeness centrality analysis result. (C) Betweenness centrality analysis result 3.3. Analysis of Condensed Subgroups.
The results of degree centrality analysis (Figure 3A) show that the tourist attractions with core status in the Yangtze River Delta mainly have spatial agglomeration in Shanghai, Hangzhou, Nanjing, and Suzhou; and 86 of the top 100 tourist attractions in degree centrality are located in these four cities. Degree centrality was more than 40,000 for Disneyland, West Lake, the Humble Administrator’s Garden, Confucius Temple, Oriental Pearl, Qin Huai River, Shantang Street, and the Bund, indicating that these eight attractions have become the tourism centers and symbols of the Yangtze River Delta. Tourist attractions with higher degree centrality have higher “power” in the Yangtze River Delta tourism cooperation network, which makes them demonstrate significant influence and dominance, and drives the development of surrounding tourist attractions. However, owing to the influence of regional advantages, brand awareness, and inter-regional economic development level, some regions in the Yangtze River Delta, such as Ma’anshan, Taizhou (in Jiangsu province), and Nantong, do not have core tourist attractions with obvious driving effects. At present, this is the main issue restricting cooperation among tourist attractions in the Yangtze River Delta, to which the government should pay attention.
The closeness centrality analysis results (Figure 3B) showed that the values of the tourist attractions were relatively balanced in Yangtze River Delta, which indicated that the network has more dependent points. This is closely related to the developed transportation network and high-density tourism resources, which is the cooperation advantage of tourist attractions in the Yangtze River Delta. Closeness centrality was low for Wuzhen, Disneyland, Oriental Pearl Tower, West Lake, and Confucius Temple. These nodes are located in the connection center of the entire network, and tourists can take them as an important transfer station and distribution center. The closeness centrality values of Abacus Museum, Tongling Zoo, Yongquan, West Lake Wetland, Rainbow Waterfall of Dabie Mountain, Phoenix Flower Valley, and West LianXiang in Anhui province were higher than average, which showed that the central actor of these tourist attractions is relatively weak in the Yangtze River Delta cooperation network. This was likely due to constraints such as location, transportation, and resources.
The betweenness centrality analysis results (Figure 3C) showed a total value of 75.28 for the high-frequency tourist attractions in the Yangtze River Delta, which was relatively low. Overall, the control ability of tourist attractions nodes in the network was weak. The top 30 tourist attractions in the betweenness centrality analysis included not only the hot spots in Shanghai, Hangzhou, Suzhou, and Nanjing but also 15 tourist attractions, including Wenchang Pavilion in Yangzhou, Chaohu Lake in Hefei, Water Street in Yancheng, Moon Bay and Peach Blossom Pool in Xuancheng, Shenxianju and Tiantai Mountain in Taizhou, Fushan in Tongling, Peach Blossom Island and Putuo Island in Zhoushan, Caishiji in Ma’anshan, Mount Gozu in Jinhua, Yandang Mountain in Wenzhou, Tianmu Lake in Changzhou, and Wenfeng Tower in Nantong. This indicated that some hot spots serve as distribution centers for tourist flows and have the “intermediary” function of connecting tourist attractions, while some cold tourist attractions also show an outstanding “intermediary” function. These tourist attractions serve as the key “intermediary” in the Yangtze River Delta tourist attraction cooperation network. Therefore, most tourists choose destinations with “intermediary” characteristics as hubs, transit locations, and stopovers, which enhances the radiation capacity of core tourist attractions. Tourist attractions such as Dayang Bay and Ximu Ancient Pottery had a value of 0, which indicated that they have no intermediary effects in the network, owing to their remote geographical location, low visibility of tourist attractions, or low regional economic development.
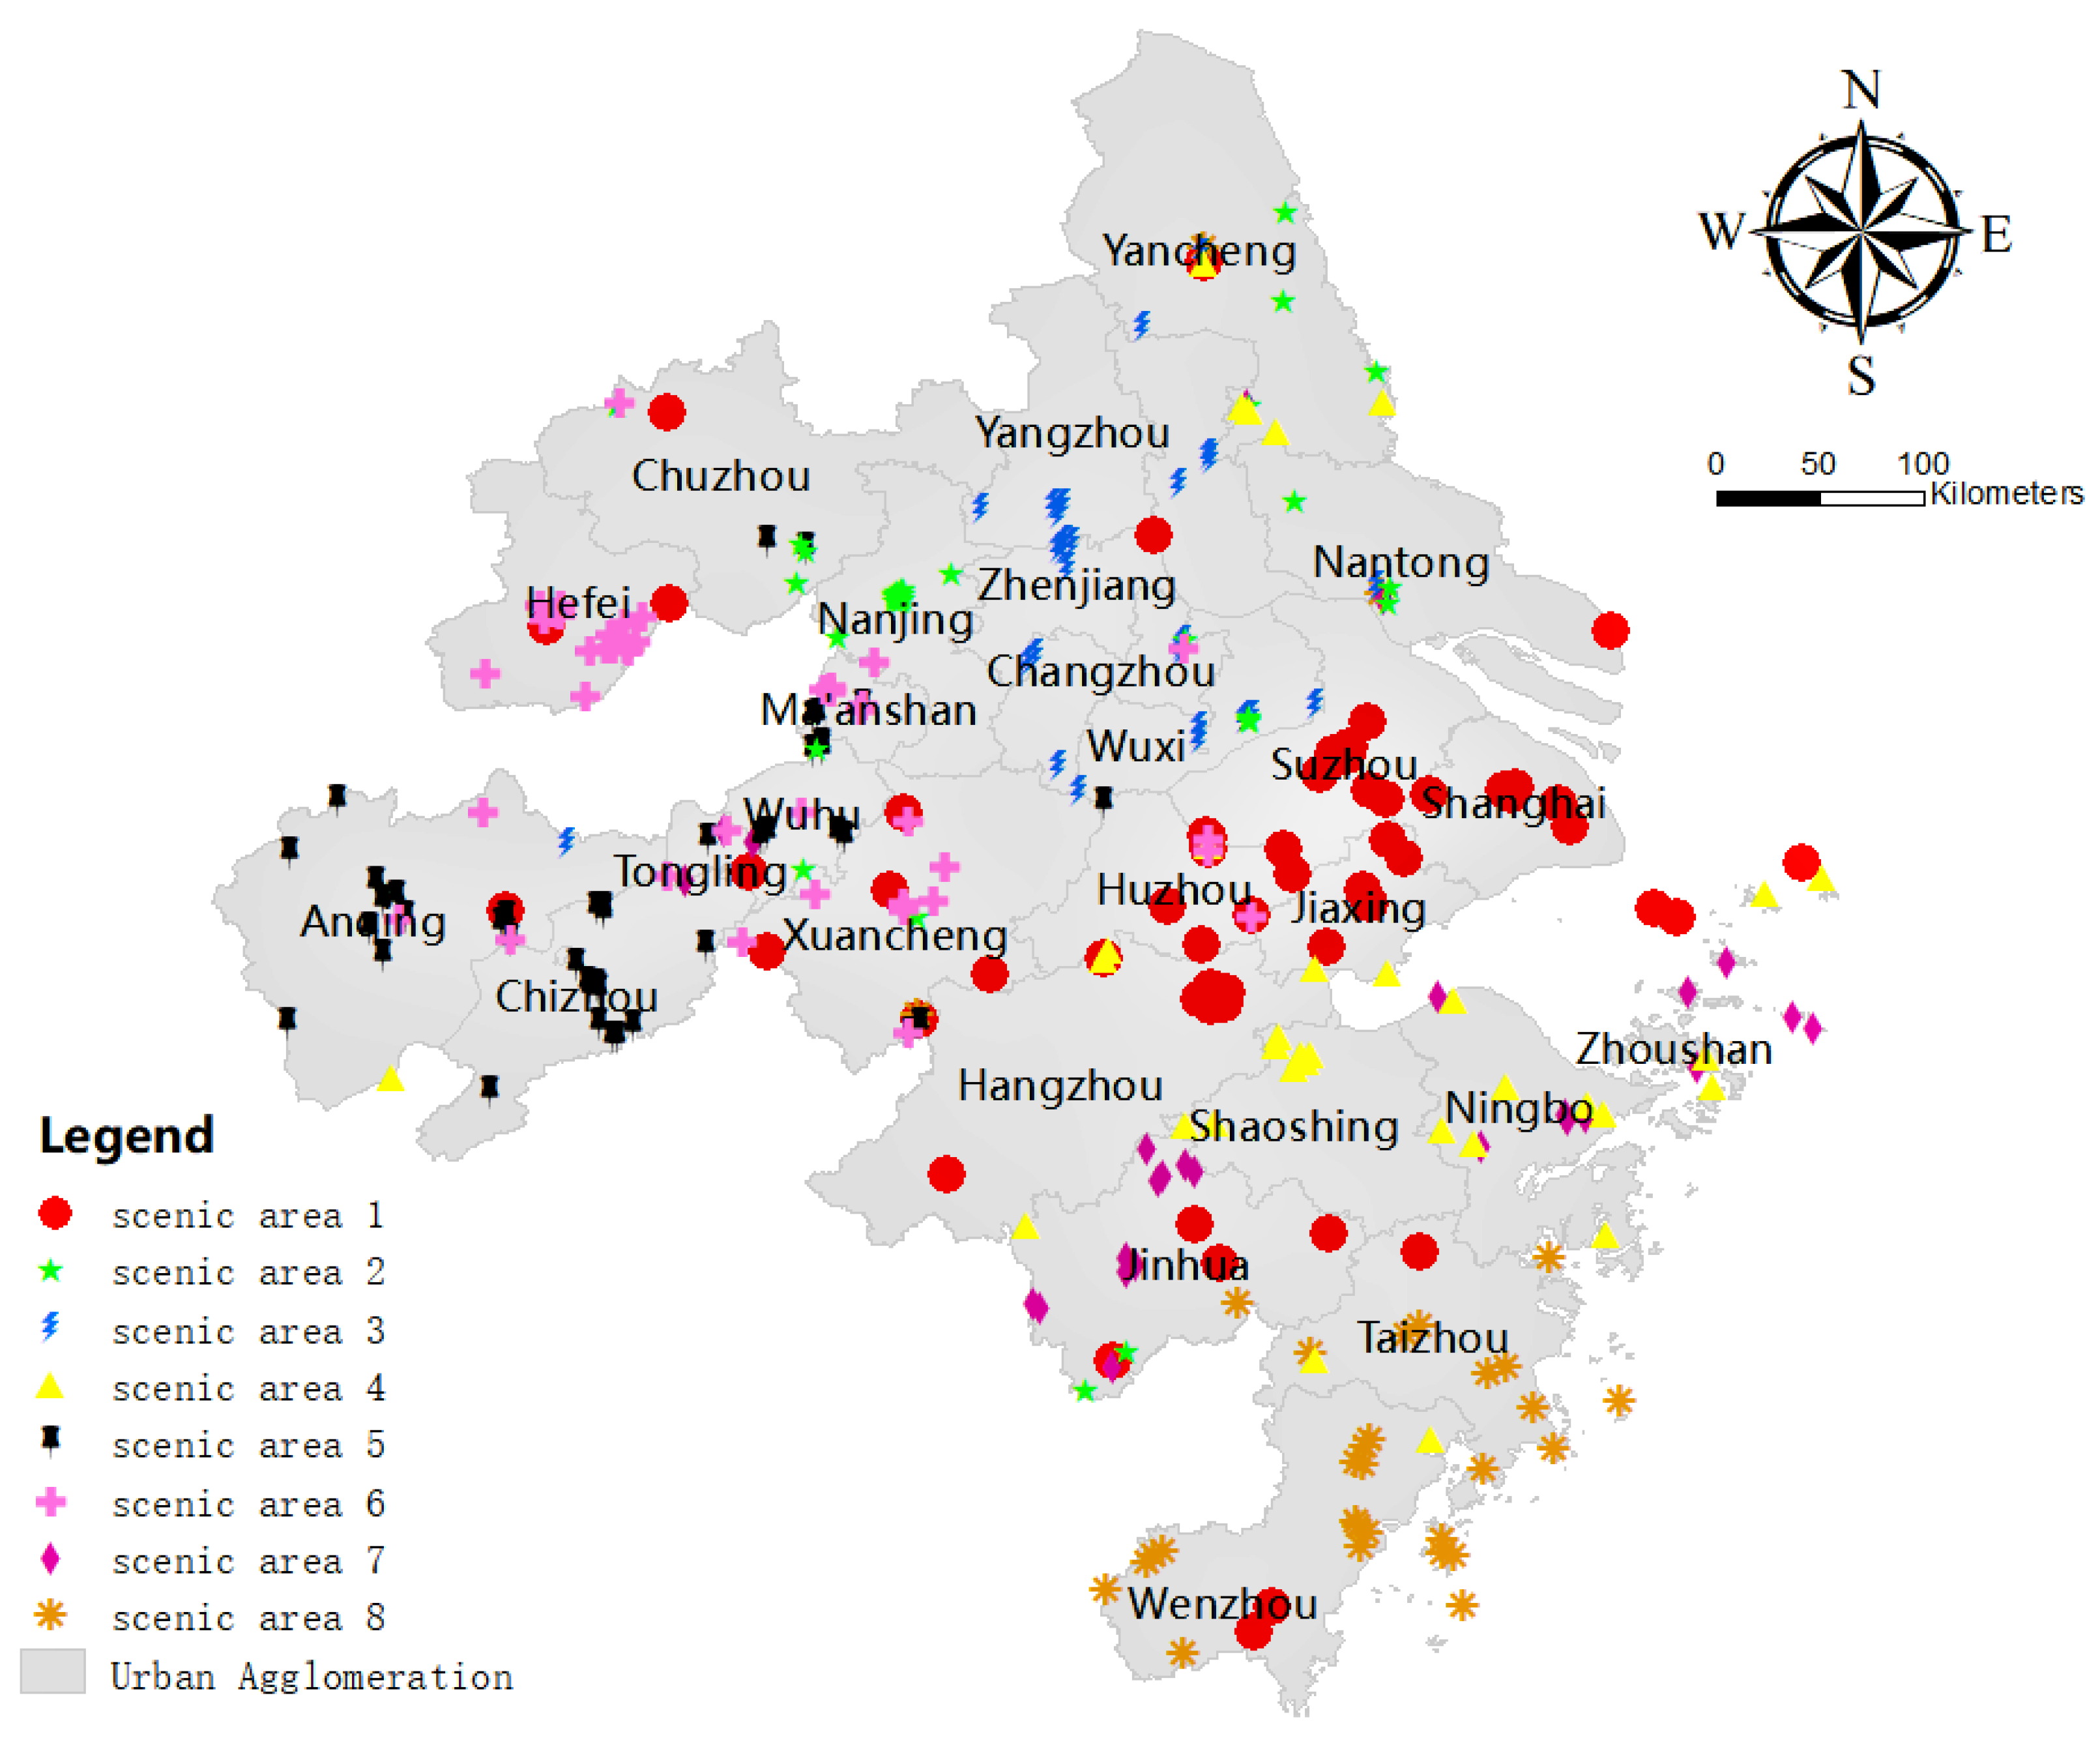
The series effect of tourism flow promotes the interaction and cooperation between a tourist attraction in the Yangtze River Delta region and other tourist attractions nearby, and finally forms a regional tourism cooperation network. The whole network will be divided into different small web consortiums, and the formation and function of the small web consortiums cannot be ignored. Before the spatial function of the regional network is fully developed, the small web consortiums are bound to become typical representatives of the whole area. Condensed subgroups can be used to reflect the phenomenon in which some tourist attractions are closely connected and clustered into a web consortium. The Concor algorithm in Ucinet 6.0 was used to analyze the condensed subgroups of the tourism cooperation network, and the network structure of 470 high-frequency tourist attractions in the Yangtze River Delta was divided into eight condensed subgroups (Figure 4). There are several condensed subgroups in the tourism cooperation network of Yangtze River Delta. On the one hand, it shows that the tourist attraction groups constituting the condensed subgroup are favored by tourists, on the other hand, it also shows that the tourist attraction groups constituting the condensed subgroups have relatively consistent tourism market. These tourist attractions in the same condensed subgroups can jointly develop tourism products or jointly promote tourism products.
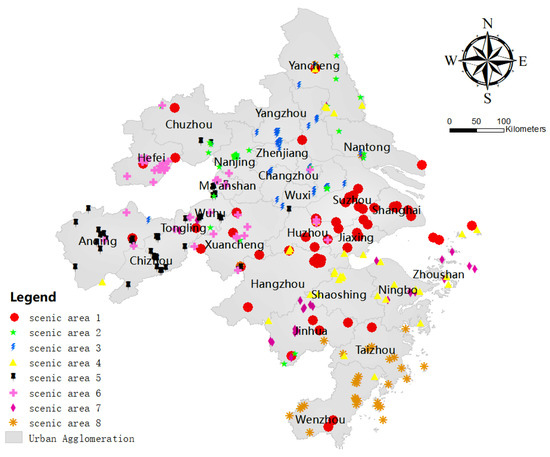
Figure 4.
The eight condensed subgroups in the Yangtze River Delta.
The condensed subgroup analysis can highlight the close connection of tourist attractions in the Yangtze River Delta and the phenomenon of small group aggregation. The object of CONCOR’s analysis is the correlation coefficient matrix, which contains Pearson’s product distance coefficient, which is used to measure the similarity between pairs of actors. In this study, when Pearson’s product distance coefficient is between 2 and 3, the 470 high-frequency popular tourist attractions can be divided into eight main condensed subgroups, as described below.
- (1)
- Super-scale condensed subgroups
This super-scale condensed subgroup comprises Disneyland, West Lake, Humble Administrator’s Garden, the Oriental Pearl Tower, the Bund with Lujiazui, Huangpu River, People’s Square, and Yu Garden as the core in Hangzhou; Thousand-Islet Lake, Song Dynasty City, Temple of the Soul’s Retreat, Peak Flying from Afar, Feng Bridge, Lion Grove, Yangcheng Lake in Suzhou, Xitang Town, and Wuzhen in Jiaxing; Mogan Mountain in Huzhou; Nanxun Ancient Town and Mountain Tip in Jinhua; Hengdian World Studio in Hengdian; Water Street in Yancheng; Moon Bay in Xuancheng; and the Peach Blossom Pool, Tiantai Mountain, and other tourist attractions in Taizhou (in Zhejiang province) serve as transit and stopover sites, connecting 117 tourist attractions in 19 cities in the Yangtze River Delta. This condensed subgroup has the largest scale, with Shanghai, Hangzhou, and Suzhou included as three super hot-spot areas, as well as a very strong radiation capacity.
- (2)
- Larger-scale condensed subgroups
The core of this condensed subgroup comprises Confucius Temple, Qin Huai River, Sun Yat-sen Mausoleum, the Presidential Office of the President, and other hot spots. Further, this condensed subgroup includes Nanjing’s Ming Tomb, Xuanwu Lake, Jinhua’s Mount Gozu, Wuxi’s Turtle Head Isle, and Langya Mountain in Chuzhou; Small Jiuhua Mountain in Nantong; Fantawild in Wuhu, China Dinosaur Land in Changzhou; and other tourist attractions as transit and stopover sites. A total of 52 tourist attractions in 11 cities in the Yangtze River Delta are connected. This condensed subgroup had a large scale and formed a super hot-spot agglomeration area in Nanjing with strong radiation capacity.
- (3)
- Larger-scale condensed subgroups
This condensed subgroup includes Nianhua Bay, Geyuan Garden, Slender West Lake, and other hot spots as its core, while Tianmu Lake in Changzhou, Wenchang Pavilion in Yangzhou, Daming Temple and Mountain Jiao in Zhenjiang, Yuntai Mountain and Fushan in Tongling, Wenfeng Tower of Nantong, and other tourist attractions serve as transit and stopover sites. This condensed subgroup includes 64 tourist attractions across 8 cities in the Yangtze River Delta, and has formed two generally hot-spot clusters in Wuxi, Yangzhou, with relatively strong radiation capacity.
- (4)
- Larger-scale condensed subgroups
The core of this condensed subgroup comprises Shenyuan Garden, Lu Xun’s Hometown, AnChang Acient Town, Tianyi Pavilion, Putuo Mountain, and other tourist attractions, while Shenxianju in Taizhou (in Zhejiang province); Taohua Island in Zhoushan; Dongji Islands and the Former Residence of Premier Zhou Enlai in Shaoshing; Bazi Bridge and Hemudu in Ningbo; and Yandang Mountain in Wenzhou and other tourist attractions are transit and stopover sites, thus connecting 49 tourist attractions in 12 cities in the Yangtze River Delta.
- (5)
- General-scale condensed subgroups
This condensed subgroup is centered on Jiuhua Mountain, Xinghua Village, Qiupu River, Guniujiang, and Tianzhu Mountain and Tongling Museum in Ma’anshan, Yingjiang Temple in Anqing, Maren Mountain in Wuhu, and other tourist attractions are transits and stopover sites, connecting 59 tourist attractions in 8 cities in the Yangtze River Delta. The condensed subgroup has a large scale; however, the hot spots are not obvious enough, which forms a certain radiating and driving effect on the surrounding tourist attractions. The main tourist attraction nodes in this cluster have a strong connection function, specifically to the attraction in Chizhou has a great potential for improvement.
- (6)
- General-scale condensed subgroups
The core of this condensed subgroup is Chaohu Lake, Lord Bao Park, and the Former Residence of Li Hongzhang in Hefei and Zhaji Acient Town in Xuancheng. Sanhe Acient Town and Xiaoyaojin Park in Hefei, Caishiji and Libai’s Churchyard in Ma’anshan, Six Feet Lane in Anqing, and Datong Acient Town and Tianjing Lake in Tongling are transits and stopover sites. These tourist attractions connect 51 attractions in 7 cities in the Yangtze River Delta. The condensed subgroup is large scale, and the hot spots are not obvious enough, which forms a certain radiating and driving ability for the surrounding tourist attractions. The connection function of the main tourist attraction nodes in its interior is prominent, specifically to the attraction in Hefei has a great potential for improvement.
- (7)
- Small-scale condensed subgroups
The core of this condensed subgroup comprises of the 37 tourist attractions in 6 cities, with Nantang Old Street, Tianyi Square, Moon Lake Park, Ningbo Drum Tower, and other tourist attractions. Jiufeng Mountain in Jinhua, Shenjiamen Fishing Port in Zhoushan, and Daishan Island and other tourist attractions are transit and stopover sites. This condensed subgroup is small in scale, and lacks hot spots, and there is no obvious radiating driving effect on the surrounding tourist attractions.
- (8)
- Small-scale condensed subgroups
The core of this condensed subgroup comprises of the 35 tourist attractions in 6 cities, including the Nanxi River and Jiangxin Island in Wenzhou, Ziyang Street in Taizhou, and the Jiangnan Great Wall. The Fangyan in Jinhua, Xianyan in Wenzhou, Tianning Temple in Nantong, and Dayang Bay in Yancheng are the transit and stopover sites. This condensed subgroup is small in scale, and lacks hot spots, and there is no obvious radiating driving effect on the surrounding tourist attractions.
4. Conclusions
4.1. Findings
From the perspective of tourist demand, and based on web text data, this study used social network analysis and GIS spatial analysis to examine the tourist attraction cooperation network structure in the Yangtze River Delta. The results show that a spatial agglomeration effect developed in the Yangtze River Delta region, and the central function, intermediary function, and connection function of different tourist attractions were significantly different. The condensed subgroup analysis highlights the close connection of tourist attractions in the Yangtze River Delta and the phenomenon of small group aggregation. The Chinese government and tourism enterprises should strengthen the understanding of the spatial structure characteristics of tourism flows, clarify the role and status of nodes in the cooperation network of tourist attractions based on tourism flow, and take joint marketing measures with tourist attractions in the condensed subgroups to promote the development of tourism in the Yangtze River Delta region. The specific research results are discussed below:
First, in terms of spatial distribution, there are six cluster areas that specifically include Shanghai Disneyland and Oriental Pearl as the core of the ultra-hot cluster area, within the city limits of Hangzhou, with West Lake, Temple of the Soul’s Retreat as the core of the super-hot cluster area, Nanjing city area with Confucius Temple and Qin Huai River as the core of the super-hot cluster area, Suzhou city within the scope of the Humble Administrator’s Garden, Suzhou Museum as the core of the super-hot cluster area, Yangzhou city within the scope of the Geyuan Garden and Slender West Lake as the generally hot cluster, and Wuxi city within the scope of the Turtle Head Isle and Nianhua Bay as the generally hot cluster.
Second, the core tourist attractions with high degree centrality in the cooperation network are mostly clustered in Shanghai, Hangzhou, Suzhou, and Nanjing, forming the agglomeration effect, while Ma’anshan, Taizhou (in Jiangsu province), and Nantong have not formed the core tourist attractions with obvious driving effects. Owing to the developed transportation network and high-density tourism resources, the distribution of tourist attractions near the center degree in the tourist attraction cooperation network of the Yangtze River Delta is relatively balanced, and there is more dependence among tourist attractions. From the Yangtze River Delta center, the top ten tourist attractions (Thousand Island Lake, Wenchang Pavilion, Chaohu Lake, Xitang Town, Wuzhen, Disneyland, Water Street, Moon Bay, Shenxianju, and Fushan), in addition to hot spots, have a stronger intermediary function. Some cold spots also showed a greater intermediary function, and can be used as a route for transit and stopovers.
Third, 470 high-frequency tourist attractions in the Yangtze River Delta were divided into eight condensed subgroups. In particular, these included a super-scale condensed subgroup composed of hot spots in Shanghai, Hangzhou, and Suzhou as the core, and other condensed subgroups with cores that comprised Nanjing’s hot spots; Yangzhou and Wuxi’s hot spots; Shaoshing and Zhoushan’s hot spots; Jiuhua Mountain, Xinghua Village, Qiupu River, Guniujiang in Chizhou, and Tinzhu Mountain in Anqing; a Chaohu Lake, the Former Residence of Li Hongzhang, Lord Bao Park in Hefei, and Zhaji Acient Town in Xuancheng; Ningbo’s hot spots; Nanxi River and Jiangxin Island in Wenzhou; and Ziyang Street and the Jiangnan Great Wall in Taizhou. In these condensed subgroups, there are several tourist attractions with an intermediary function that can be selected as transit and stopover sites on tourist routes. However, while the formation of these condensed subgroups depends on the location and the transportation and facilities of each tourist attraction, tourists’ multi-destination travel behavior (tourist flow) objectively contributes to their formation. This provides us with a new conceptualization and basis for the rational development of travel routes for travel agencies, as well as the scientific setting of core tourist attractions and stopovers on routes based on tourists’ needs. This study can contribute to a better understanding of the influence of tourists’ spatial behavior on the cooperation of tourist attractions, which can have a significant impact on the government and enterprises to formulate appropriate strategies for the cooperation of tourist attractions. Tourists are on the demand side of tourist attraction cooperation. They can link different destinations through their freely chosen spatial behavior and movement, which is of great significance in understanding how tourist attraction cooperation is structured and to identify the underlying mechanisms of tourist attraction cooperation. Moreover, when tourists move between two or more tourist attractions, it is possible to build mutual trust, respect, and other interactive relationships between these tourist attractions through communication, thus creating a mutually beneficial cooperative relationship. This study also contributes to the exploration of a new mixed-method approach in tourism research.
4.2. Limitations
It should be noted that no research method is perfect. Although the online text data of the network used in this study has many advantages, its sample representativeness, technical difficulties, and network population bias attributes also have shortcomings compared with traditional research methods. In the future, we could consider collecting more extensive texts from more websites or new platforms to increase the representativeness of samples, or combine them with traditional research methods to corroborate each other and enhance the accuracy of research conclusions. Although the Yangtze River Delta region is regarded as a demonstration area for regional tourism cooperation, these research findings are not suitable for generalization to different regions of China or the world.
The spatial and temporal distribution characteristics of tourist attractions and their cooperation mechanism comprise a huge, complex system. Further research is needed to optimize the spatial structure of tourist destination cooperation, tourist route design, and tourism marketing. Future studies can also consider the order in which tourists visit destinations and form directed network data, to conduct directional research on tourist routes. Corresponding research can also be conducted for specific groups, such as self-driving tour groups. In addition, tourist characteristics can also be classified to explore the characteristics of tourist route networks of different types of tourists, to conduct comparative analyses. The cooperation of tourist attractions in the Yangtze River Delta can be further studied by combining GIS spatial data and the spatial measurement method.
Author Contributions
Y.W. contributed to all aspects of this work; H.C. wrote the main manuscript text; X.W. analyzed the data. All authors reviewed the manuscript. All authors have read and agreed to the published version of the manuscript.
Funding
This research study was supported by the National Social Science Foundation of China (to Y.W.), grant no. 19BGL145.
Institutional Review Board Statement
Not applicable.
Informed Consent Statement
Not applicable.
Acknowledgments
The authors would like to acknowledge all experts’ contributions in the building of the model and the formulation of the strategies in this study. All individuals included in this section have consented to the acknowledgement.
Conflicts of Interest
The authors declare no conflict of interest.
References
- Baggio, R. Collaboration and cooperation in a tourism destination: A network science approach. Curr. Issues Tour. 2011, 14, 183–189. [Google Scholar] [CrossRef]
- Yang, Y. Understanding tourist attraction cooperation: An application of network analysis to the case of Shanghai, China. J. Destin. Mark. Manag. 2018, 8, 396–411. [Google Scholar] [CrossRef]
- Wäsche, H.; Dickson, G.; Woll, A. Quality in regional sports tourism: A network approach to strategic quality management. J. Sport Tour. 2013, 18, 81–97. [Google Scholar] [CrossRef]
- Fernandes, G. Cooperation and competitiveness in tourism sustainability. Positioning of tourist actors in the Serra da Estrela Natural Park in Portugal. In International Conference on Tourism, Technology and Systems; Springer: Singapore, 2020; pp. 52–65. [Google Scholar]
- Putri, D.A.; Susilowati, M.; Semedi, J.M. Tourist attraction and tourist motivation in the Patuha Mountain Area, West Java. Indones J. Geogr. 2021, 53, 95–102. [Google Scholar]
- Leask, A. Progress in visitor attraction research: Towards more effective management. Tour. Manag. 2010, 31, 155–166. [Google Scholar] [CrossRef]
- Leask, A. Visitor attraction management: A critical review of research 2009–2014. Tour. Manag. 2016, 57, 334–361. [Google Scholar] [CrossRef]
- Sun, J.H. Research on cooperation strategy between government, tourist attraction and travel agency under the background of low carbon. Value Eng. 2019, 38, 18–23. [Google Scholar]
- Nugroho, S.P.; Kurniawati, N.; Sinangjoyo, N.J.; Islami, M.E.N. Potential gastronomy tourist attraction in the area of Alun-Alun Utara Yogyakarta. Tech. Soc. Sci. J. 2021, 22, 630–640. [Google Scholar]
- Napitupulu, J.; Pramono, R.; Saragih, E.L. Determinants of tourist attraction of the heritage tourism. J. Environ. Manag. Tour. 2021, 12, 507–514. [Google Scholar]
- Sthapit, A. Cooperation and collaboration for sustainable tourism: Key to recovery and growth in post-pandemic era. J. Hosp. Tour. Manag. 2021, 2, 5–6. [Google Scholar]
- Baggio, R.; Scott, N.; Cooper, C. Network science: A review focused on tourism. Ann. Tour. Res. 2010, 37, 802–827. [Google Scholar] [CrossRef]
- Jesus, C.; Franco, M. Cooperation networks in tourism: A study of hotels and rural tourism establishments in an inland region of Portugal. J. Hosp. Tour. Manag. 2016, 29, 165–175. [Google Scholar] [CrossRef]
- Park, B.A. Study on the tourist network in Chinese inbound tourist by using social network analysis. J. Hotel. Resort 2017, 16, 135–150. [Google Scholar]
- Zhang, H.; Qin, S.U.; Zhang, Y. Progress in the application of social network analysis in international tourism research. Prog. Geogr. 2019, 38, 520–532. [Google Scholar]
- Kim, K.H.; Lee, Y.T. An analysis of policy paradigm changes in medical tourism policy: Application of policy change model and policy network model. J. Tour. Enhanc. 2021, 9, 39–64. [Google Scholar] [CrossRef]
- Lambert, P.D. Cross-Border Tourism-Policy Coordination in the Pacific Northwest Economic Region. In Canada’s Fluid Borders: Trade, Investment, Travel, Migration; University of Ottawa Press: Ottawa, ON, Canada, 2021; pp. 114–142. 2021. [Google Scholar]
- Panasiuk, A.; Wszendyby-Skulska, E. Social aspects of tourism policy in the European Union. The example of Poland and Slovakia. Economies 2021, 9, 16. [Google Scholar] [CrossRef]
- Wang, K.Y.; Yu, J.; Ning, C.Y. Sustainable Coastal Tourism Policy Selection and Local Resident Satisfaction Assessment. In Proceedings of the 2021 International Conference on Enterprise Management and Economic Development (ICEMED 2021), Nanjing, China, 14–16 May 2021. [Google Scholar]
- Nakamura, A.; Takahashi, H. An exploratory study on policy evaluation of tourism by using agent-based model. In Agents and Multi-Agent Systems: Technologies and Applications; Springer: Singapore, 2021; pp. 231–241. [Google Scholar]
- Azazz, A.; Elshaer, I.A.; Ghanem, M. Developing a measurement scale of opposition in tourism public-private partnerships projects. Sustainability 2021, 13, 5053. [Google Scholar] [CrossRef]
- Frolova, E.; Kabanova, E. Tourist attraction development factors of Russia’s municipalities. Public Adm. Issues 2017, 3, 112–128. [Google Scholar]
- Bramwell, B. Governance, the state and sustainable tourism: A political economy approach. J. Sustain. Tour. 2011, 19, 459–477. [Google Scholar] [CrossRef]
- Mohamed, A.; Akasha, A.; Tham, J.; Albattat, A.R. Tourism marketing and perceived risks impact on attracting Libyan local tourists. Int J. Sci. Technol. Res. 2020, 9, 336–346. [Google Scholar]
- Chen, W.; Qu, H.; Chi, K. Partner selection in China interorganizational patent cooperation network based on link prediction approaches. Sustainability 2021, 13, 1003. [Google Scholar] [CrossRef]
- Hong, T.; Ma, T.; Huan, T.C. Network behavior as driving forces for tourism flows. J. Bus. Res. 2015, 68, 146–156. [Google Scholar] [CrossRef]
- Scott, N.; Baggio, R.; Cooper, C. Network analysis and tourism from theory to practice. In Aspects of Tourism; Channel View Publications: Bristol, UK, 2008. [Google Scholar]
- Silva, D.; Hoffmann, V.E.; Costa, H.A. Trust in tourism cooperation networks: Analysis of its role and linked elements in Parnaíba, Piauí, Brazil. Rev. Bras. Pesqui. Tur. 2020, 14, 9–29. [Google Scholar]
- Jamal, T.B.; Getz, D. Collaboration theory and community tourism planning. Ann. Tour. Res. 1995, 22, 186–204. [Google Scholar] [CrossRef]
- Asero, V.; Gozzo, S.; Tomaselli, V. Building tourism networks through tourist mobility. J. Travel Res. 2016, 55, 751–763. [Google Scholar] [CrossRef]
- Tahmasebi, A.; Zavarnia, M. Network analysis of organizational cooperation in tourism destination management. J. Soc. Stud. Tour. 2020, 8, 277–296. [Google Scholar]
- Gretzel, U.; Yoo, K.H.; Purifoy, M. Online Travel Review Study: Role and Impact of Online Travel Reviews. Laboratory for Intelligent Systems in Tourism, Texas A&M University. Available online: www.tripadvisor.com/pdfs/OnlineTravelReviewReport.pdf (accessed on 21 January 2017).
- Czernek-Marszaek, K.; Marszaek, P. Social embeddedness as a trigger of business tourism cooperation. Argum. Oeconomica 2020, 2019, 341–386. [Google Scholar] [CrossRef]
- Yin, J.; Bi, Y.; Ji, Y. Structure and formation mechanism of China-ASEAN tourism cooperation. Sustainability 2020, 12, 5440. [Google Scholar] [CrossRef]
- Gan, C.; Voda, M.; Wang, K.; Chen, L.; Ye, J. Spatial network structure of the tourism economy in urban agglomeration: A social network analysis. J. Hosp. Tour. Manag. 2021, 47, 124–133. [Google Scholar] [CrossRef]
- Chaderopa, C. Crossborder cooperation in transboundary conservation-development initiatives in southern Africa: The role of borders of the mind. Tour. Manag. 2013, 39, 50–61. [Google Scholar] [CrossRef]
- Schaffer, V.; Lawley, M. An analysis of the networks evolving from an artificial reef development. Curr. Issues Tour. 2012, 15, 497–503. [Google Scholar] [CrossRef]
- Kondrateva, S. Cross-border cooperation programs as tool of the regional tourism development: Case of the Republic of Karelia. Pskov Reg. Stud. J. 2020, 44, 109. [Google Scholar] [CrossRef]
- Kang, C.Y. Internationalization strategy of tourism industry and selective double structure of cooperation in the Kim Jong-un regime. J. Northeast Asian Stud. 2020, 25, 101–125. [Google Scholar] [CrossRef]
- Czernek-Marszaek, K. Social embeddedness and its benefits for cooperation in a tourism destination. J. Destin. Mark. Manag. 2020, 15, 100401. [Google Scholar] [CrossRef]
- Kropinova, E. Transnational and cross-border cooperation for sustainable tourism development in the Baltic Sea Region. Sustainability 2021, 13, 2111. [Google Scholar] [CrossRef]
- Czernek-Marszaek, K. The over embeddedness impact on tourism cooperation. Ann. Tour. Res. 2020, 81, 102852. [Google Scholar] [CrossRef]
- Yang, J.; Yang, R.; Chen, M.H.; Su, C.H.J.; Zhi, Y.; Xi, J. Effects of rural revitalization on rural tourism. J. Hosp. Tour. Manag. 2021, 47, 35–45. [Google Scholar] [CrossRef]
- Jin, S.; Yang, J.; Wang, E.; Liu, J. The influence of high-speed rail on ice–snow tourism in northeastern China. Tour. Manag. 2020, 78, 104070. [Google Scholar] [CrossRef]
- Yang, J.; Bao, Y.; Zhang, Y.; Li, X.; Ge, Q. Impact of accessibility on housing prices in Dalian city of China based on a geographically weighted regression model. Chin. Geogr. Sci. 2018, 28, 505–515. [Google Scholar] [CrossRef] [Green Version]
- Xia, Y.; Ding, Q.; Jing, N.; Tang, Y.; Jiang, A.; Shu, J. An enhanced fault detection method for centrifugal chillers using kernel density estimation based kernel entropy component analysis. Int. J. Refriger 2021, 129, 290–300. [Google Scholar] [CrossRef]
- Asta, D.M. Kernel density estimation on symmetric spaces of non-compact type. J. Multivar. Anal. 2021, 181, 104676. [Google Scholar] [CrossRef]
- Tan, J.; Xie, X.; Zuo, J.; Xing, X.; Liu, B.; Xia, Q.; Zhang, Y. Coupling random forest and inverse distance weighting to generate climate surfaces of precipitation and temperature with multiple-covariates. J. Hydrol. 2021, 598, 126270. [Google Scholar] [CrossRef]
- Wang, H.K.; Chien, C.F. An inverse-distance weighting genetic algorithm for optimizing the wafer exposure pattern for enhancing overall wafer effectiveness. Appl. Soft Comput. 2020, 94, 106430. [Google Scholar] [CrossRef]
- Liu, B.; Songshan, S.H.; Fu, H. An application of network analysis on tourist attractions: The case of Xinjiang, China. Tour. Manag. 2017, 58, 132–141. [Google Scholar] [CrossRef]
- Britt, B.C.; Hayes, J.L.; Musaev, A.; Sheinidashtegol, P.; Parrott, S.; Albright, D.L. Using targeted betweenness centrality to identify bridges to neglected users in the Twitter conversation on veteran suicide. Soc. Netw. Anal. Min. 2021, 11, 1–15. [Google Scholar] [CrossRef]
- Ye, Q.; Xu, X. Determining factors of cities’ centrality in the interregional innovation networks of China’s biomedical industry. Scientometrics 2021, 126, 2801–2819. [Google Scholar] [CrossRef]
- Benckendorff, P. Themes and trends in Australian and New Zealand tourism research: A social network analysis of citations in two leading journals (1994–2007). J. Hosp. Tour. Manag. 2009, 16, 1–15. [Google Scholar] [CrossRef] [Green Version]
- Brandes, U.; Freeman, L.C.; Wagner, D. Social networks. In Handbook of Graph Drawing and Visualization; Tamassia, N., Ed.; CRC Press: Boca Raton, FL, USA, 2014; pp. 803–807. [Google Scholar]
- Meshkova, N.; Sergievskaya, N. Development of the competitive advantages of the enterprise based on the network cooperation. E3S Web Conf. 2020, 220, 01021. [Google Scholar] [CrossRef]
- Borgatti, S.P.; Everett, M.G.; Freeman, L.C. Ucinet for Windows: Software for Social Network Analysis; Analytic Technologies: Harvard, MA, USA, 2002. [Google Scholar]
- Bell, D.C.; Atkinson, J.S.; Carlson, J.W. Centrality measures for disease transmission networks. Soc. Netw. 1999, 21, 1–21. [Google Scholar] [CrossRef]
- Coviello, N.E. Integrating qualitative and quantitative techniques in network analysis. Qual. Market. Resl. 2005, 8, 39–60. [Google Scholar] [CrossRef]
Publisher’s Note: MDPI stays neutral with regard to jurisdictional claims in published maps and institutional affiliations. |
© 2021 by the authors. Licensee MDPI, Basel, Switzerland. This article is an open access article distributed under the terms and conditions of the Creative Commons Attribution (CC BY) license (https://creativecommons.org/licenses/by/4.0/).