1. Introduction
Wine, as an experiential and hedonic product, is commonly associated with personal enjoyment, relaxation, socialisation and hospitality [
1]. As wine continues to play an important part in people’s lifestyles, an increased interest in visiting the places of production has been witnessed, resulting in a rapid growth in the popularity of wine regions around the world [
2]. All this influences the consumption of wine, and because of that, a lot of studies in this field have been carried out; however, fewer studies have been conducted in Slovenia. A quantitative survey was made to understand the Slovenian wine-buying behaviour phenomenon better. Data were collected through a survey questionnaire, where participants were asked which characteristics are important when they are deciding what kind of wine to purchase.
Little research has been conducted on the Slovenian wine market. The reason may lay in the fact that it is a young field of research that scientists are just recognising as important for the development of wine culture and marketing. Only a few previous research studies have been identified that applied the CETSCALE in Slovenia. The research that has been carried out, for example, was a study about the influence of consumer regiocentrism on the perceived value of wine [
3] and a study about the dimensions of the perceived value for wine from the perspective of Slovenian wine consumers [
4]. Bizjak et al. [
3,
4], in their two studies, found out that the perceived value of wine consists of three dimensions: Emotional–social, quality–price and terroir. A study by Vida et al. [
5] sought to gain an understanding of the role of factors underlying consumer choice of domestic vs. foreign products and to explore the relationship between consumer brand awareness, ethnocentric attitudes, demographic factors and actual behaviour in purchasing goods. Another study by Reardon [
6] demonstrated that the level of economic development operates as a moderating variable for the relationship between ethnocentricity and formation of attitude toward the brand. The study of Kolar et al. [
7] carried out research in the economic direction.
The label on the wine bottle plays an important role, and that is why wine producers are creating unique and compelling labels, unusual bottle shapes and colours to distinguish their products from their competitors. Packaging wine products consists of a number of components. Some of them are historical and traditional, such as the bottle shape and colour, the type of closure and the label presentation (design, logo and information provided), while others offer a wide variety of new styles in closures (cork, technical composite or screw top), bottle size, shape and colour. There is no question that these characteristics influence consumers and help them choose between wines on a retail shelf [
8,
9,
10,
11,
12,
13].
The front label is the first line of communication to entice the consumer; it is, therefore, extremely important that the characteristics appearing on the label are visually attractive to stand out on the retail shelf. Consumers shop with their eyes, and most wine producers accept that [
8,
14]. Because some of a wine’s attributes, such as quality or sensory characteristics (taste), can only be assessed during consumption, other attributes are more important in this way, such as brand name, awards, production procedures and cellaring advice, which are found on the wine’s front or back label, and may assist consumers when deciding to purchase [
13,
15].
Front labels contain (with some exceptions) the most essential and legally required information about the product: The winery’s name, grape variety, grape origin, vintage year and alcohol content [
12]. The back label often describes the sensory characteristics of the wine, the winemaker’s notes and compatible meals for the specific style of wine. Consumers consider the design and wine package to be directly correlated to the quality of the product [
8]. The graphic design of a wine package undoubtedly influences the perception of products and wines [
16,
17]. In one study [
14], they found that the colours, image/picture and logo used in wine packaging are ranked higher by females as important considerations when deciding on a wine purchase.
Consumers’ knowledge has long been studied to understand the decision-making behaviour process of buying products, and wine is no exception. Various studies concluded that there are two types of knowledge. The first one was how much an individual thinks they know about a product, which is labelled as subjective knowledge, and what an individual actually knows, which is labelled as objective knowledge [
18,
19]. Another study found that consumers’ product evaluations depend on consumers’ familiarity with the product. When consumers are not familiar with a country’s product, they will use the country’s image as a “halo” in product evaluation [
20]. This “halo effect” presumes that the consumers infer the product’s quality from his or her stereotyped beliefs about the COO (country of origin) [
21]. Some research has been undertaken to prove whether the COO affects product evaluation. It has been accepted that COO refers to “consumers’ overall view of products from a particular country, based primarily on their prior perceptions of that country’s strengths and weaknesses in production and marketing” [
22]. Numerous studies have indicated that the COO has a significant influence on consumer perception and decision making [
23,
24,
25]. The literature also revealed that the COO may incorporate variables such as traditions, political status, economic liberalisation and general country perceptions. Studies have shown that the COO influences consumers’ product evaluations by signalling product quality when they are unable to detect the true quality of a country’s product [
26]. In particular, the COO can be an indicator of quality when it is difficult to assess by other objective means [
27]. Wall et al. [
28] found that COO information is more important in product quality assessment than price and brand information.
One of the factors influencing our purchase may be ethnocentrism. It is a nearly universal syndrome of discriminatory attitudes and behaviours [
29,
30]. The attitudes include seeing one’s own group (the in-group) as virtuous and superior and one’s own standards of value as universal, while those of out-groups as contemptible and inferior. Behaviours associated with ethnocentrism include cooperative relations within the group and the absence of cooperative relations with out-groups [
30]. The term “consumer ethnocentrism” is adapted from the general concept of ethnocentrism introduced more than 80 years ago [
29]. In general, the concept of ethnocentrism represents the universal proclivity of people to view their own group as the centre of the universe, to interpret other social units from the perspective of their own group and to reject persons who are culturally dissimilar while blindly accepting those who are culturally like themselves [
31,
32]. The symbols and values of one’s own ethnic or national group become objects of pride and attachment, whereas symbols of other groups may become objects of contempt [
30].
Shimp and Sharma [
33] developed the CETSCALE to measure the construct of consumer ethnocentrism. It is an instrument to measure consumers’ ethnocentric tendencies related to purchasing foreign- versus home-made products. It consists of 17 items which measure attitudes toward foreign-made products and purchase intentions. More ethnocentrism scales are available [
34,
35], but they do not have a lot in common with the study of consumer behaviour and marketing.
In a study of American consumers, they showed that ethnocentric tendencies are significantly negatively correlated with attitudes toward foreign products, and significantly positively correlated with attitudes toward domestic products. They used the term consumer ethnocentrism (CE) to describe consumers’ beliefs about the appropriateness and morality of purchasing foreign-made products, which (from the perspective of ethnocentric consumers) is wrong, because it hurts the domestic economy, causes the loss of jobs and is unpatriotic. CE as a construct to study consumer behaviour has since been studied extensively [
5,
36,
37,
38]. Regarding the Slovene population [
39,
40], it was shown that consumers have concern for their country, and they have a preference for domestic products, brands and institutions [
5]. Ethnocentrism is an important factor in human behaviour. Depending on the degree of ethnocentrism, we will buy certain products, or not. Consumer ethnocentrism in Slovenia was measured with CETSCALE, but we only took statements that were suitable for our research. In our research, we linked ethnocentrism to wine tourism and found out the correlations between them. Slovenia is a wine country, and we were interested in how respondents decide to buy wine.
Wine marketing is highly competitive and challenging. This led to wine marketers recommending that the industry revisit their current segmentation strategies and begin to find new populations of wine consumers [
41,
42]. It has been noted that successful marketing involves seeing the business from the customers’ point of view [
43]. Many studies have acknowledged that consumers have significantly different perceptions about products made in different countries, and that these general perceptions have important effects on consumers’ evaluation of the products manufactured in a particular country [
44]. Today’s wine consumers are causing the wine industry to rethink the traditional stereotype of a wine drinker, not only because wine drinkers are a younger cohort, but also because they bring a unique set of tastes and lifestyle choices [
45,
46].
2. Materials and Methods
The aim of the study was to understand the respondents’ opinions, perceptions, behaviours and attitudes in correlation with ethnocentrism and wine in Slovenia.
2.1. Sampling Method
A convenience sampling method was chosen for this research. Respondents were selected based on a non-probability sampling method. A mail survey was sent out to the addresses of family and friends, and we asked them to send it to their friends. The survey was also published in several Facebook groups about wine and winemaking. The sample was a snowballing sample. To ensure we received a large sample of respondents who expressed their own opinions about wine purchasing, explained their purchase criteria and choice behaviour, a quantitative online survey was the chosen research method.
Data were collected using an Internet survey in March and April 2020, which was conducted in the Slovenian language. Participants were at least 18 years old and had bought wine at least once within the previous year. Non-wine consumers had to mark that they did not drink wine, and they only answered questions about buying wine (for a present, for example). The participants in this study were those who drink wine and those who do not, but still buy it.
2.2. Questionnaire
The questionnaire used set out to gather data regarding wine tourists’ behaviour, motivations and wine interest. The questionnaire consisted of 24 questions and 108 variables and used closed-ended and five-point Likert-type scale questions. They were also asked to indicate their degree of importance on a five-point scale (1 = completely disagree, 5 = completely agree), and what characteristics are important when buying wine. Questions were included to explore purchasing behaviour related to ethnocentrism. The questions were written according to the following criteria: relevant, clear, brief, inoffensive, unbiased and specific. The questionnaire encompassed open- and closed-ended questions to measure the tourists’ behaviour and establish their profile. The questionnaire consisted of three sections to collect consumption and purchasing behaviours. In the first part, we asked the respondents about the attitudes related to wine, about the characteristics that are important to them when buying wine in the middle part, and in the last part of the questionnaire, the questions were related to wine and ethnocentrism. Before data collection procedures began, the questionnaire was pilot tested with college research for one month before the survey took place to assess the content validity and clarity of the questions, with modifications made accordingly. At the end of the questionnaire there were several demographic variables related to gender, age, education and income.
The format for the questions about ethnocentrism followed the research studies of Shimp and Sharma [
33], with the questions according to CETSCALE. It measured consumers’ ethnocentric tendencies related to purchasing foreign- versus home-made products. Thirteen of those tendencies were used, those that were suitable for our research. Participants were also asked to indicate their degree of agreement on a five-point Likert-type scale (1 = completely disagree, 5 = completely agree). Other formats for the questions were taken from the studies of Brunner and Siegrist [
47].
2.3. Data Analysis
A total of 458 usable questionnaires were collected, and the data were analysed using the Statistical Package for the Social Sciences (SPSS), version 25. We used frequencies and percentages to represent descriptive variables, and average, standard deviation, and median to represent ordinal and numerical variables. For numerical variables, we also checked the normality of the distribution with the Kolmogorov–Smirnov and Shapiro–Wilk tests. Due to the violation of the assumption of distribution normality for most variables, we used the nonparametric Spearman correlation coefficient to answer the research questions.
The final size sample of the study was n = 458, which resulted in a 43% response rate. In the study, 167 men (36.4%) and 291 women (63.5%) participated. The average age of the respondents was 36.3 years, and the average education of the respondents was college or university. Regarding income, the majority of respondents were in the EUR 901-1200 group, which was 24%. The average monthly gross salary in Slovenia is EUR 2021.21 and the inimum wage for 2021 is EUR 1024.24 [
48].
2.4. Research Questions
The three major research questions were formulated based on the literature review conducted earlier:
Research question 1: How is ethnocentrism related to the importance of the country of origin when buying wine?
Research question 2: How is the motive of entertainment related to the importance of geographical identifiers?
Research question 3: How is the motive of entertainment related to the importance of health identifiers?
3. Results
Table 1 shows the demographic profile of the respondents by gender, education, income and age. The number of male respondents (36.4%) was lower than that of female respondents (63.5%), and these results were similar to data collected from other surveys conducted [
45,
49,
50].
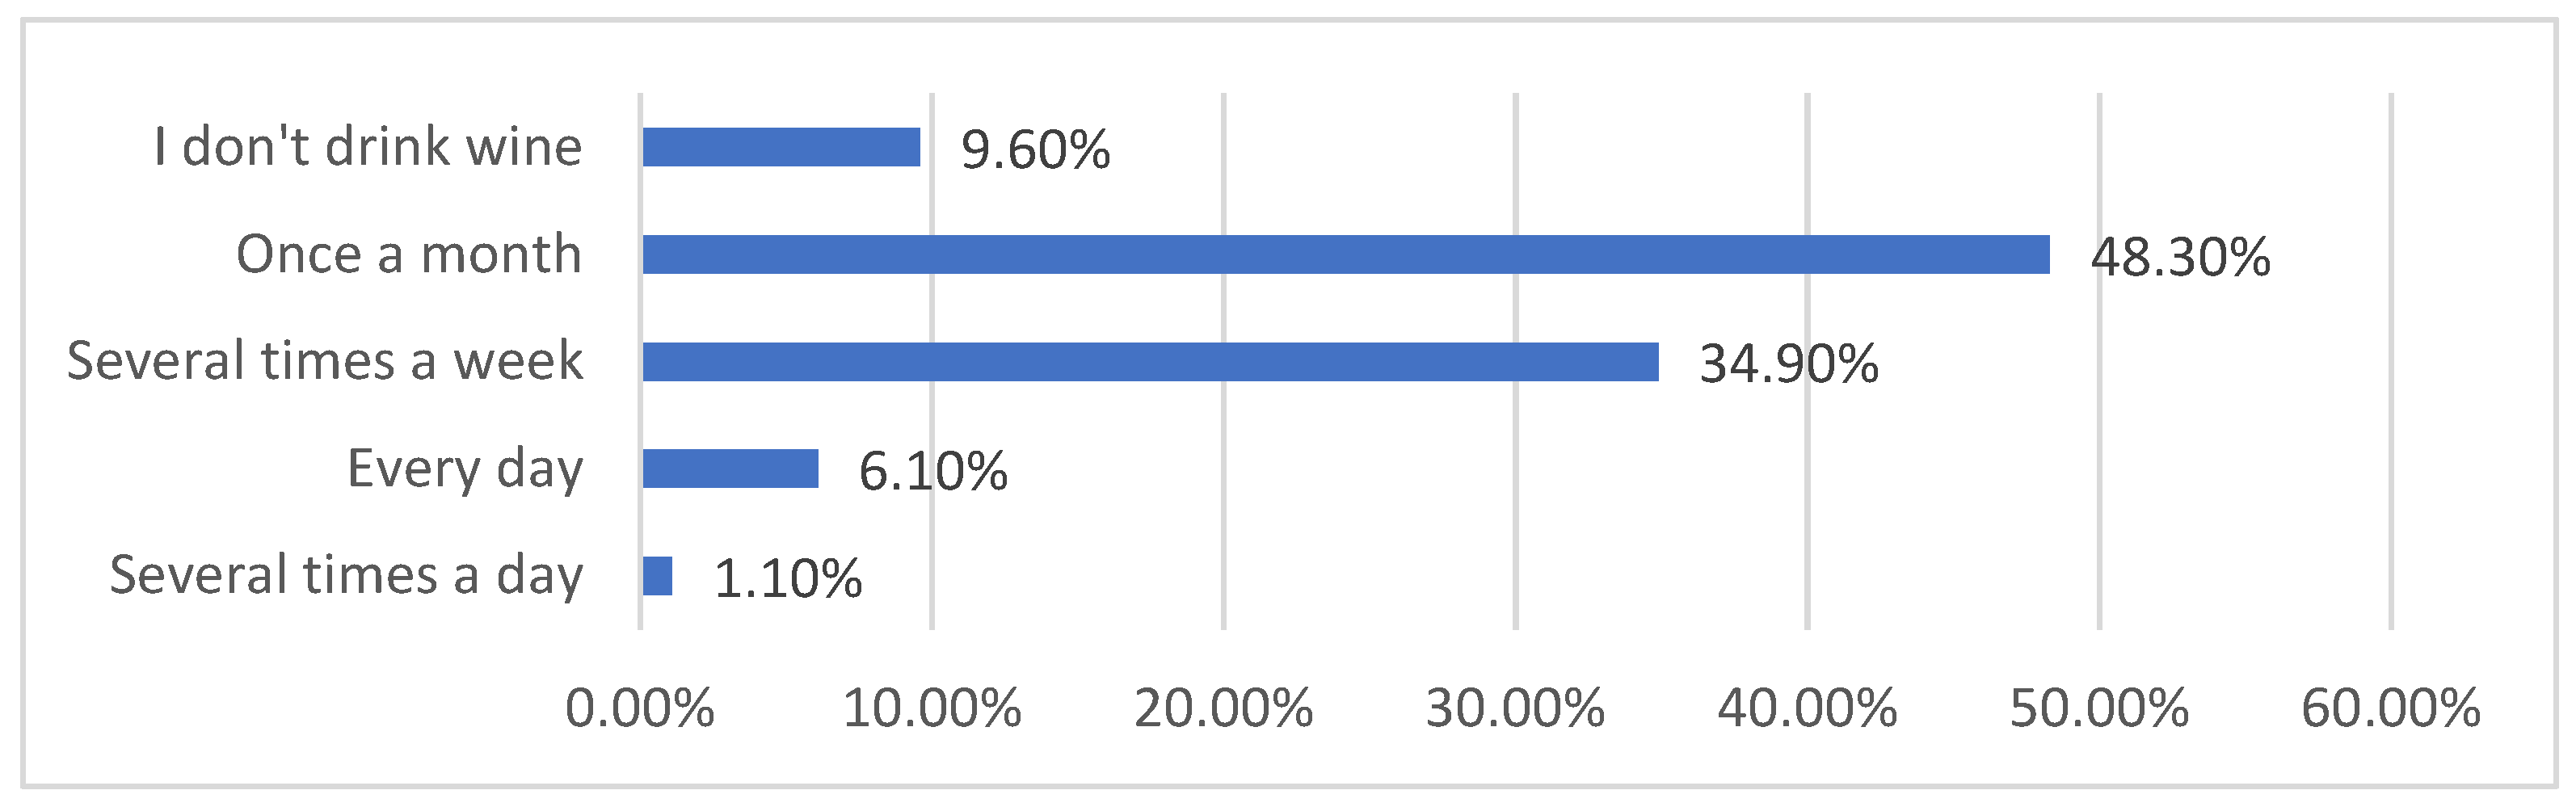
Participants were asked about their frequency of drinking wine (
Figure 1). The most common responses were once a month (221 participants, 48.3%) and a couple of times a week (160 participants, 34.9%).
The main question of our research was which factors and characteristics are the most important when buying a bottle of wine. Respondents had the opportunity to choose from 30 listed characteristics (
Table 2).
For purpose of our study, we took a 5-point Likert-type scale (where 5 = strongly agree, 1 = strongly disagree). The highest agreement with the statement and thus, the most important characteristics chosen, were “Taste” with an average of 4.66, then “smell” at 4.01 and “Recommendations from friends” with a 3.94 average. The lowest average score, and thus, the lowest agreement, were for characteristics “Advertising, commercials” at 2.47, “bottle colour” at 2.81 and bottle shape with a “2.90” average. Based on the results, we concluded that people do not find the shape of the bottle important. To a customer, it does not matter if the bottle is a Burgundy, Bordeaux or Alsace bottle. It is also evident from the results that the advertisements do not have as much power (average answer 2.47) as a friend’s recommendation (3.94) when buying wine. Regardless of all the information provided by the wine label, taste (4.66) and smell (4.01) are still the most important characteristics, and the most convincing.
Ethnocentrism is reflected, among other things, in the area from which the respondents prefer wine. Participants were asked if they would be more likely to choose foreign or domestic wines. A total of 421 people (91.9%) answered that they would choose a domestic origin of wine, and only 37 people (8.1%) would choose a foreign origin of wine. From the results, we can understand the high affiliation to the domestic product and the importance of the origin of the product. Participants were asked to choose from three Slovenian wine regions. As we can see from
Figure 2, only 71 people (16.9%) chose the Posavje Wine Region. Next, 117 people (27.8%) chose the Podravska Wine Region, and half of the asked participants, 233 (55.3%), chose the Primorska Wine Region. This raises the question of why the Primorska region is so successful. One of the reasons could be good marketing. Winemakers from that area are working on promotion and are aware of its importance. The result is reflected in the visibility of their wines and the perception of people who choose a wine from that area. A total of 37 respondents (8.1%) did not answer, because they had answered in the previous question that they did not drink wine.
Participants were asked from which country would they buy wine if they had to choose a foreign one. As we can see from
Figure 3, more than half of the participants (68.5%/313 people) chose France. The next country was Spain, with (24.9%/114 people), and the third answer was “another country” with 82 participants (17.9%). The high response for France did not surprise us, as the country is known as one of the best wine producers.
For the purpose of our study, we redesigned and adjusted the 17-part CETSCALE to make it suitable for our research. Shimp and Sharma (1987) took as their study format a 7-point Likert-type scale (7 = strongly agree, 1 = strongly disagree). We took a 5-point Likert-type scale, 5 = strongly agree, 1 = strongly disagree).
As can be seen from
Table 3, respondents showed a very different degree of agreement with the different claims that were tied to ethnocentrism. The final sample of size of the study was n = 458. Under »missing« are those who did not know, or they did not want to answer. The highest agreement, and thus, the strongest ethnocentrism was detected in statement number 5: We have to buy Slovenian wines to support the Slovenian economy and Slovenian winemakers. The average answer from 1 to 5 was 4.02. In statement number 10: Foreigners should be banned from selling their products in our market, we found the least agreement with the statement, where the average value of the answer was 1.91. If we look at how many statements were above grade 3, we can see that there were 6 out of 12. We can conclude that, for the group of people who answered our questionnaire, ethnocentric, domestic products and the part of being »a true Slovenian« are partly important.
The survey was also interested in the reasons why respondents drink wine. A study by Brunner and Siegrist [
47], who combined different approaches for segmenting a market, namely, segmentation based on involvement, motive/lifestyle and purchasing, is similar to ours. In their study, 6 segments with distinct wine consumption patterns were identified, namely: The price-conscious wine consumer; the involved, knowledgeable wine consumer; the image-oriented wine consumer; the indifferent wine consumer; the basic wine consumer; and the enjoyment-oriented, social wine consumer.
Statements were taken from their research [
47] and the individual variable was calculated. The main statement was: »I drink wine…« and then the statements were arranged into seven units representing the individual variables.
Under the variable “Self-expression”, there were these statements: Because I want to be accepted in society, to be different from the others, for self-fulfillment, I want to give the impression of good social status, because I want to be respected, because it gives the appearance that I have succeeded in life, because it gives the appearance of a responsible person and because, with the knowledge of wine, I make an impression on others. Under the variable “Sociability”, there were these statements: That I am sociable, because it helps with socialising, because it creates a pleasant atmosphere, when I want to share something important, when I want to create memories, when I want to relive memories and because it connects generations. Under the variable “Health”, there were these statements: Because I think it’s healthy, because it speeds up digestion, because it is a natural drink, for thirst, because it is a “light” drink. Under the variable “Food” there were these statements: To improve the taste of food, because a glass of wine belongs to a pleasant meal and because it creates a special atmosphere at the meal. Under the variable “Pleasure” there were these statements: For pleasure, because I like the taste of the wine and only at important events, otherwise I don’t like it at all. Under the variable “Tradition” there were these statements: Because it is a ritual, because it is a tradition in the family and because of my cultural background. Under the variable “Fun” there were these statements: For fun, while celebrating the occasion, to feel good, and lastly, because wine is a pleasure and a pleasant part of my life. Respondents rated the statements based on the Likert scale: how much they agreed with each statement on a scale of 1 to 5, where 1 was do not agree at all and 5 was completely agree. The final sample of size of the study was n = 458. Under »missing« were those 44 who do not drink wine; and there were also those who did not know or did not want to answer (
Table 4).
We calculated those 7 variables. As can be seen from
Table 5, “Pleasure” is the most strongly represented with the median 4.00, the next one is “Food” with 3.67 and “Fun” with a 3.50 median value. The lowest is “Self-expression” with 1.29, and the next one is “Tradition” with a 2.00 median value.
4. Discussion
Firstly, we checked the normality of the distribution of the numerical variables. As can be seen from
Table 6, the results of the Kolmogorov–Smirnov and Shapiro–Wilk tests are statistically significant for all numerical variables except ethnocentrism. For these variables, the distribution deviated from normal, so we will use nonparametric methods to answer the research questions.
The three major research questions were:
Research question 1: How is ethnocentrism related to the importance of the country of origin when buying wine?
Ethnocentric tendencies are significantly positively correlated with attitudes toward domestic products. It means they support domestic production, which also includes the geographical area of production. From
Table 2 of characteristics, what is important when buying wine, we have selected geographical indicators. These are: Country of origin, Wine region, Autochthonous Slovenian wine, PGI code and PDO code. As can be seen from
Table 7, the Spearman’s correlation coefficient between ethnocentrism and country of origin importance is 0.340, representing a positive and medium-strong correlation between the variables. This is also statistically significant (
p < 0.001), so we can say that ethnocentrism is related positively to the importance of the country of origin.
Research question 2: How is the motive of entertainment related to the importance of geographical identifiers?
Under the variable “Fun” there were these statements: For fun, while celebrating the occasion, to feel good, and lastly, because wine is a pleasure and a pleasant part of my life. We were interested in whether the entertainment motive and geographical indicators have any connection when buying wine. Spearman’s correlation coefficient was positive, but very small. From 0–0,1 is negligible connectivity, and p is not less than 0.05. We can conclude that this correlation is not statistically significant, but we cannot say it exists. If we look at wine regions, there is no connection at all. Entertainment is not related to any of these geographic indicators. We can conclude that, when people are buying wine for fun or to celebrate occasions, geography does not play any role when selecting wine to buy. Therefore, when it comes to entertainment, ethnocentrism is no longer as important as in other purchases (
Table 8).
Research question 3: How is the motive of entertainment related to the importance of health identifiers?
We were interested in whether the entertainment motive and geographical indicators have any connection when buying wine. We took health identifiers: “Content of sugar in wine”, “added additives in wine production” and “Environmental Certificate on wine”.
As shown in
Table 9, Spearman’s correlation coefficient between the entertainment motive and the importance of the sugar content in the wine is −0.037, representing a negative and negligible correlation between the variables. However, this is not statistically significant (
p = 0.456), so we cannot claim that the entertainment motive is related to the importance of the sugar content in wine. We can, therefore, conclude that, when people are selecting wine for fun or to celebrate occasions, they do not look at health indicators. The content of sugar, added additives and certificates do not have any important part in it.
The results of this study were compared to the general population from other studies. Studies about consumer ethnocentrism in connection with domestic and foreign smart phone brands were made by Sun et al. [
51]. They found out that consumer ethnocentrism has a positive effect on brand equity for domestic brands but does not have a negative effect on brand equity for foreign brands. Compared to our research, these are slightly different results. One of the reasons can be in the different cultures and different mindsets of the people who were included in both surveys. Depending on the result, consumers are more negatively tuned in Slovenia in connection with domestic brands. In Bryła’s [
52] study, the impact of the Consumers in the Schwartz store was measured. He was interested in the willingness to pay a price for domestic food products, and in differences by gender. He claims that the willingness to pay (WTP) a higher price for domestic products is affected by the tradition and universalism values. He found out that consumers who respect tradition, follow customs and care for the environment are more likely to pay a higher price for food from their home country. The results of this research are similar to ours. We can conclude that tradition has a strong impact when buying food. It would be interesting to see how oriented in the case of ethnocentrism people from the survey of Bryła would be.
It needs to be pointed out that this study makes several significant theoretical contributions to the existing body of literature regarding wine-purchasing behaviour. First, this research adds new knowledge about wine consumers not seen in past research by including ethnocentrism when analysing wine consumers and their intent to buy wine. The results of the study are also recommendations for winemakers on what qualities wine buyers focus on while they are choosing wine. The concept of consumer ethnocentrism and its measurement via the CETSCALE helps to understand consumer behaviour. Our survey is important for politics and decision makers in the country. Now they have information that the origin of products is important to customers. Now they know it is important to encourage domestic production and not to import so many foreign-originating foods to the country.
Communicating is an essential part of the wine industry, and it requires a professional, digitalised and state-of-the-art approach, with contemporary information. It is suggested that wine producers and marketers be aware of various segments of wine consumers with diverse needs that need to be addressed. Customers search for different things in a bottle of wine, and the new information provided by this research enables them to gain a competitive advantage through the results, which is the main contribution of the research. Such data are significant because they can empower winemakers, stores and others who trade with wines. In our research, it was confirmed that ethnocentrism is related positively to the importance of the country of origin when buying wine. It was also established that entertainment is not related to any of the geographic indicators: Country of origin, Wine region, Autochthonous Slovenian wine, PGI code or PDO code. It is essential to point out that an additional value of this research is also in the fact that winemakers would have to order and pay to obtain information about customers and their habits, while this paper offers the research data free of charge.
This research is important because it relives the purchase patterns of wine buyers. The sample was Slovenia, but we believe that the results can be applied to other countries too. The research is also important for the company’s retailer and all types of stores, from small boutiques to supermarkets, as it reveals what is important to the Slovenian customer and what they consider when deciding to buy. The study brings important new information for winemakers, as it reveals which components on a bottle of wine are important to the consumer. Because of this research, they may be able to choose a different bottle shape next time, change the look of the label to perhaps a different graphic, highlight the area of the vineyard and the origin, and therefore, be more successful in selling than if they did not have this information. Wine labels and bottle shapes enable efficient and targeted communication of wine producers and influence the perception of a particular wine brand on the market.


