Abstract
Suburbanization is a phase of the development of cities that consists in the growth of the suburban zone at the expense of the city center, which becomes gradually depopulated. The phenomenon of uncontrolled suburbanization (urban sprawl) causes infrastructural (including transport), environmental, social, economic, and legal problems. This paper presents the results of a study of the phenomenon of suburbanization conducted on the basis of vector data using two methods: one based on the use of a grid of primary square fields, and one based on the use of concentric zones/rings. The analyses were conducted in the surroundings of the Tricity agglomeration, which is located in the northern part of Poland on the Gulf of Gdansk, and covered the period from 2000 to 2018. Using a grid of primary fields, the areas of the greatest increase and decrease in the developed areas, irrespective of administrative boundaries, were determined for the selected periods, and the areas of the constant positive and negative balance of the buildings were identified. Using concentric rings, the process of the shifting of the new development zones was traced. The paper also refers to the route of the Pomeranian Metropolitan Railway (PKM), which was commissioned in 2015, and its potential impact on suburbanization in the Tricity area. The results made it possible to trace the suburbanization process in time and space and to learn the advantages and disadvantages of the use of vector data in spatial studies.
1. Introduction
For many years, suburbanization, meaning one of the phases of urban development that involves the depopulation of city centers and the development of suburban zones, has been a global phenomenon, as evidenced by studies not only from the United States and Europe [1,2,3] but also from Asia [4,5,6], Africa [7,8,9], and South America [10,11]. The studies range from single case studies to global comparative studies [12,13]. A unique form of this process is urban sprawl—the process of the development of rural areas outside the compact urban zone that is used more intensively, characterized by the scattering of housing, services, and jobs, and associated with an overdeveloped and non-functional road network [14]. Zuziak [15] emphasizes that sprawl is a form of settlement characterized by an amorphous nature of the urban fabric, the blurring of the identity of the space, a high land-use rate, a high energy consumption, and an increase in the social costs of the transport and infrastructure. The problems associated with this phenomenon affect practically all areas of life: social, infrastructural (especially transport), economic, legal, and environmental issues alike. The causes and the course of this process vary in different countries [16,17]. In contrast to Western Europe, where the phenomenon of suburbanization was already in place in the 1960s, in the post-communist countries of Central and Eastern Europe (CEE) this process began after the political transformation that took place at the end of the 20th and the beginning of the 21st centuries. As Sagan [18] summarized, the uniqueness of communist urbanization was due to the fact that it took place in industrialized societies that eliminated private ownership of the means of production in favor of a state monopoly, with simultaneous central planning of the economic processes. The high degree of state ownership of land, the imposition of the ways in which land was allowed to be used, and the top-down control of the pace and manner of urbanization led to many adverse changes in the landscape. The planning decisions made at higher levels of government usually did not take into account the local natural and socio-economic situation. It was only the increasing share of private property in the second half of the 1990s that caused the phenomenon of suburbanization to intensify and, despite the recognition of its negative effects, this process continues. The restoration of the real value of land rents resulted in a number of development projects carried out on the outskirts of urban centers where real estate prices were much lower than in the very centers of the cities [19]. The costs of the transformation of urban centers from the communist to the capitalist form have taken a toll on the population, whose incomes in many cases have not risen to the point where they can meet such challenges; consequently, intra-urban and suburban migration processes have intensified. The changes in the political system, accompanied by increasing globalization and technological progress, have resulted in changes in the employment and lifestyles of the residents that are reflected in the spatial development.
Examples of studies that cover the CEE area and address different aspects of suburbanization include works on the Czech Republic [20], Germany [21], Croatia [22], Romania [23], Hungary [24], Greece [3], and Slovakia [25]. The Polish literature, too, contains many valuable publications: both reviews [26,27,28,29,30] and case studies [31,32,33,34,35]. The privatization of the state-owned housing stock that took place in Poland resulted in the formation of a housing market and the emergence of areas with more or less desirable locations [18]. In the entire territory of Poland, this process has similar characteristics: the suburban zone is the final place of residence or a stage in the migration from rural to urban areas. As the development progressed, these zones became more differentiated functionally (in addition to the residential buildings, service, commercial, and production buildings were constructed) and socially (new, usually gated, estates consisting of single-family houses or terraced houses for more affluent people were built next to houses inhabited by members of poorer social groups). The rate of suburbanization depends largely on the spatial policy of communes and municipalities (according to the Eurostat—Local Administrative Units) surrounding the central cities, which consists in the allocation by those communes and municipalities of more and more land for residential development inside and around the agglomeration [36]. Poland’s accession to the European Union in May 2004 created for the communes, municipalities, and institutions the possibility to obtain funds for investment, which resulted in a development of infrastructure that had not been possible in the years preceding the accession. The growing interlinking of metropolitan areas with good highway networks provides an additional incentive for urban sprawl. The complexity of the manifestations of urban development makes it difficult to precisely measure its scale. The development of GIS tools enables more extensive studies of the changes to land use in time and space. Particularly noteworthy in the context of this topic are studies that utilize GIS tools, including the works of Adamiak, Jażdżewska, and Nalej [29], Lityński [30], and Mantey and Sudra [37]. Due to the environmental, socio-economic, and infrastructural problems mentioned in the introduction, which result from uncontrolled spreading, this phenomenon is increasingly being studied not only around large agglomerations but also around smaller cities and towns. The process of suburbanization is progressing at a different pace, with buildings encroaching on new land, usually previously used for agricultural purposes.
The Tricity (the combined cities of Gdańsk, Sopot, and Gdynia), selected as an example to be studied, is located in the north of Poland, on the Gulf of Gdańsk. The seaside location of the Tricity limits the construction of buildings to the east and north-east directions; consequently, for several decades, the increased development pressure has been directed towards the north-west, west, and south. The main factors that influenced this process are the lower prices of land and housing as people move away from the central parts of cities, changes in the way of working (including an increase in remote working), and the desire to “escape from the hustle and bustle of the city.” Local governments of communes and municipalities neighboring the Tricity favor the reclassification of agricultural land into building plots due to the expected increased revenue for their budgets resulting from the increase in the built-up area and population. The growing distance of new developments from city centers generates service costs for both the municipalities or communes and their residents. Observing the process of suburbanization, one can notice a growing problem with the provision by communes and municipalities of adequate infrastructure to maintain a good standard of living for the residents (access roads, sidewalks, public transport, road lighting, etc.) and a quality standard of the environment (for example sewers, supervision of building heating systems, reduction in barriers for animal migration, and the decrease in the share of impervious areas). To a large extent, this is associated with the different rates of coverage of communes and municipalities by local land-use plans and, consequently, the increase in the number of issued land-development conditions decisions. Since the 1980s, analyses of the changes taking place in the areas around the Tricity (especially in terms of development, but also spatial planning defined more broadly [33]) have been conducted. Some of the studies referred to features of the natural environment and were carried out using geocomplexes as natural units; examples include the studies conducted by Przewoźniak [38] as well as Kopeć and Korwel-Lejkowska [39]. Others were based on an analysis of demographic and infrastructural features, such as the development of the transport network, indicators related to the migration of the population, the quality of people’s lives, and the expenditures in commune and municipal budgets [40,41,42], and, due to the possibility to obtain statistical data, they referred mainly to administrative units.
This paper presents the results of analyses conducted to examine the spatial aspect of the process of suburbanization in the surroundings of the Tricity, with a presentation of the differences between its stages from 2000 to 2018. This paper is a continuation of research conducted by the author between 1985 and 2012. As indicated by the studies [36], before the year 2000 the pace of the transformation taking place around the Tricity was slow and mainly concerned the demolition of buildings left after the liquidated State Farms (PGR) and of older, low-standard holiday and farm buildings. An auxiliary objective of these analyses was to carry out a preliminary assessment of the importance of the Pomeranian Metropolitan Railway (PKM), which was put into operation in 2015, for directing the process of suburbanization. The new line connects Gdańsk-Wrzeszcz and Gdynia with Żukowo and Kartuzy and provides a potential stimulus for suburbanization [43]. More sophisticated spatial measures were not applied in this case, as the data for new buildings constructed between 2012 and 2018 would reliably show only to a small degree the actual impact of the PKM on this process (it is necessary to compare data from 2015, 2016, and 2017 and also more recent data to allow for more in-depth studies in this area).
It was assumed that the statistical data was not a sufficient measure of suburbanization in the spatial aspect; therefore, a proposal was presented to study this phenomenon by analyzing the actual presence of individual buildings, which makes it possible to capture the changes in space that are independent of the administrative division. The study was conducted using two methods: analyses of the distribution of buildings in a grid of primary fields and analyses of the distribution of buildings using concentric zones (rings) around the central points of cities. The first method makes it possible to obtain a complete picture of the distribution of the intensity of the analyzed phenomenon in space, while the second makes it possible to trace the process of the increase in the distance of buildings from city centers. Analyses conducted with the use of a grid of primary fields make it possible to divide the space into regular smaller polygons (grids), which is not possible with the use of an administrative or cadastral division, due to the different surface areas of the divisions; it is a method used by many researchers, for example [44,45]. The use of geometric fields of equal area and shape enables full comparability of the presented phenomena at a given level of aggregation [46]. This approach is commonly used in environmental analyses, although it is important to note that it results in a secondary geometrization of the space model. The analyses conducted using concentric rings divide the space into a series of zones distant from the assumed central point and can be used, among other things, to determine the gradient of the intensity of the development [10,47,48]. In this study, this approach was applied to the examination of newly constructed buildings in different time periods. This made it possible to capture the shifting of the development intensification zones. Both the ring width and the grid size were selected depending on the scale of the study and the research needs. As a result of the analyses, the advantages and disadvantages of the use of vector data in suburbanization studies were indicated.
2. Materials and Methods
2.1. Study Area
The Tricity is located in the northern part of Poland, on the Gulf of Gdańsk (Figure 1). The western part of the study area is located on a post-glacial upland, 237 m above sea level, while the eastern part is a narrow coastal plain. The edge of the upland is characterized by a fairly steep slope and the associated significant dynamics of the slope processes. The upland is cut by valley formations, the widest of which is the Reda-Łeba Postglacial Valley, running in the northern part of the study area. A separate geomorphological unit is Żuławy Gdańskie, i.e., a part of the Vistula delta, which constitutes the south-eastern part of the study area.
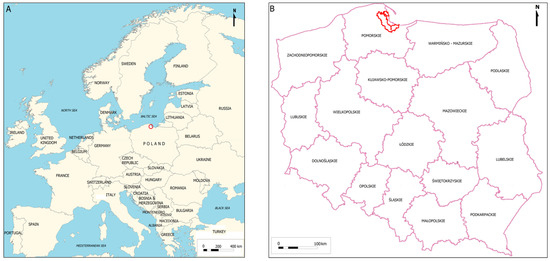
Figure 1.
The study area’s location in Europe (A) and Poland (B). Source: prepared by the author.
Gdańsk is the sixth most populous city in Poland (471,500 inhabitants, while the entire metropolitan area is home to over 1,600,000 inhabitants [49]). The average population density in the metropolitan area in 2019 was 192.1 persons/km2 [50]. Gdańsk, the capital city of the Pomeranian Province, is an important administrative center, a transport hub (Lech Wałęsa airport, a seaport, and a good railway and road connection—via the A1 motorway—with the south of Poland), and an economic, cultural, and scientific center in the region. Gdańsk and Gdynia are home to companies from the shipbuilding (and related shipping agencies, ship owners, brokers, transport, and forwarding companies), petrochemical, energy, electronics, metal, building materials, food, clothing, and retail industries. The Żuławy part of the study area, due to very good soil conditions, is mostly used for agriculture, while on the upland the agricultural functions are combined with forestry and—increasingly—with tourism (Kashubian Lake District). The research was conducted in a zone that is a part of the Tricity Metropolitan Area and that has witnessed increasing suburbanization since the 1980s. In order to make it possible to relate the results of the analyses to the author’s earlier studies [36], the delimitation of the study area was adopted as follows: to the west, north, and south, the borders of the study area were drawn along a natural or seminatural boundary, which constitutes a barrier to urbanization. To the east, the border leads along the Tricity’s inner-city central service strip, as an area of dense development (Figure 2). Such a delimitation results from the fact that the suburbanization zone does not coincide with any administrative border but is quite strongly connected with the features of the natural environment. Moreover, the external boundary of the metropolitan area as an administrative entity is dynamic and depends primarily on the political will of the authorities of the communes, municipalities, and districts and is then verified by the actual economic calculations that affect the decisions of the commune and municipal governments regarding membership in the metropolitan area [51].
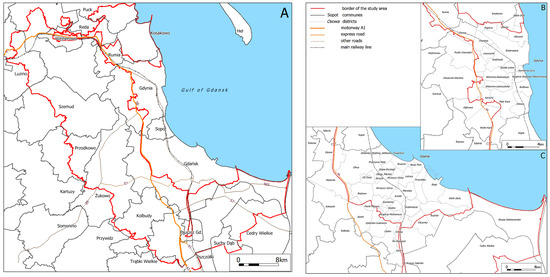
Figure 2.
Location of the study area in relation to smaller administrative units: communes/municipalities (A) and residential districts of Gdynia (B) and Gdańsk (C). Source: prepared by the author.
2.2. Research Procedure and Data Sources
The recommended in-office research method includes a comparative vector data analysis concerning the presence of individual buildings, conducted using the GIS MapInfo Professional software. The scale of detail adopted for the analysis is 1:10,000 because topographic maps in this scale show built-up areas with detailed outlines of buildings. It makes it possible to calculate their footprint, defined in accordance with the PN-ISO 9836:1997 standard [52] as the area of land occupied by the building in its finished state (Section 5.1.2 excluding the provision of Section 5.1.2.2: “The footprint area shall not include: (...) the area occupied by detached ancillary structures (for instance greenhouses, gazebos, or sheds).” Due to the fact that the land under the utility buildings is not biologically active and the construction of such buildings affects the landscape, they were included in the analyzed structures.
Such data can be obtained from topographic maps in the Polish Projected Coordinate System—PUWG-1992 (land-cover status from the beginning of the 21st century—the year 2000 was assumed as the reference year). Data from 2012 and 2018, in the form of ready vector data, were obtained from the Database of Topographic Objects in the scale of 1:10,000 (BDOT10k), made available by the Central Office of Geodesy and Cartography. The data include additional attributes, such as the functions of buildings, which enable a broader analysis. By superimposing and cropping the vector layers in relation to each other, additional layers containing objects that were created or eliminated in the adopted time intervals were obtained.
The analyses were conducted both for the actual distribution of buildings and in the primary fields and zones (rings) that were 5 km wide and concentrically surrounded the city centers. In the first stage of the analyses, a primary square field of 0.25 km2 was adopted as the reference unit. The use of primary fields made it possible to visualize—by means of cartograms—the intensity of the changes of development in space: the percentage share of the footprint area of the buildings in the assumed years and the size of the footprint of the building structures that came into being or disappeared in the assumed time intervals. The balance of the changes in the footprint area of the buildings in such intervals was also made into a total increase and decrease in the footprint area in each primary field.
In the second stage of the analyses, changes were presented in the share of footprint areas (%) in concentric zones (rings) distant from the city centers, in intervals of 5 km. A radius of 5 km was assumed as the approximate average distance between the main transport route from Gdańsk to Gdynia (road 468 and railway line 202) and the border of the study area. The following railway stations were adopted as the central points from which the 5 km zones were delimited: Gdansk Główny, Gdynia Główna, Pruszcz Gdański, Reda, Rumia, and Wejherowo. They are kind of nodal points for the functioning of the cities in the agglomeration. Areas of bodies of water and forests were excluded from the areas of the resultant zones. The balance of the buildings in the rings formed in this manner, located 5, 10, 15, and 20 km from the assumed central points, was calculated as the difference between the share of the footprint area in the first and last years of a given period (%), divided by the share of the footprint area in the last year of that period (%), and multiplied by 100.
Such an approach was recommended in the author’s publication to illustrate overdevelopment in areas remote from the central service strip of the Tricity [36], and in this paper, it is extended with the latest data from the BDOT10k for 2018.
For a preliminary assessment of the impact of the commissioning of the PKM on the construction of new buildings, buffers located 1 and 2 km away from the new railway line and its stops were used. These were assumed to be the walking distances for the daily commute to work/school. The number of new buildings within the boundaries of the buffers was indicated, and the results were compared to all the newly constructed buildings.
3. Results
This section presents the results of an analysis of the intensity of changes in the developed area. In parallel to the construction of new buildings, older buildings were demolished; hence, both directions of transformation are presented in three time intervals that resulted from the aforementioned data availability.
3.1. Analysis of Changes in the Share of Built-Up Areas Using a Primary Field Grid
In the first 12 years of the 21st century, a compact new built-up zone was created from Różyny in the south, through Pruszcz Gdański, Straszyn, the southern districts of Gdańsk and Rębiechowo, and further west and north, where two zones of emerging development are present: through Banino to Żukowo and through Osowa and Chwazczyno to Gdynia and Bojano. In the northern part of the studied area, an increase in the built-up area took place in the central part of the Kosakowo commune, bounded by Bolszewo and Reda (in the Reda valley) and also—similarly to the first study period—in the south and southwest of Wejherowo. On a larger scale, new buildings were constructed in the vicinity of Łężyce and Rumia-Szmelta [36]. A total of 28,222 buildings were constructed during that period.
Between 2000 and 2012, a decrease in the built-up area was recorded as a result of:
- the decommissioning of older, substandard holiday buildings (in the surroundings of the Łapińskie, Wysoka, Kamień, and Marchowo lakes);
- the liquidation of farm buildings (for example in the Pruszcz Gdański and Kolbudy communes);
- the removal of some buildings of the breeding and seed company in Bąkowo;
- the decommissioning of farm buildings, warehouses and workshops, and old residential buildings (for instance along road no. 91 from Orunia Dolna to the Olszynka district of Gdańsk and Przejazdowo);
- the liquidation of recreational buildings due to the establishment of a protection zone of a water intake [53] (at the Straszyński reservoir, on the border of the Kolbudy and Pruszcz Gdański communes).
A total of 7539 buildings were decommissioned.
In some cases, the development of buildings took place in the areas which, after the political changes since the mid-80s, recorded a decrease in buildings [36]. Those areas include: the strip along road no. 501 on the Sobieszewska Island (an increase in the number of new single-family houses and holiday buildings); the south-western part of Gdańsk (multi-family housing estates); the south-western part of Pruszcz Gdański (a warehousing and industrial zone); Kowale; the Karczemki, Kokoszki, and Osowa districts of Gdańsk (housing estates built by developers and large-scale commercial and warehousing facilities along the S7 road); and the Pogórze district of Gdynia.
Successively, from 2013 to 2018, despite a shorter period of analysis (6 years), 15,216 buildings were constructed, and 5187 buildings were deleted. The areas with the largest number of buildings (above 5% of the share of built-up areas within the primary field) include, first of all, the south-eastern part of Reda (shopping center); Gdynia-Wiczlino (multi-family housing); Gdańsk-Osowa (multi-family and commercial buildings); Tuchom and Nowy Tuchom (production and warehouse buildings along national road 20); Banino (single-family detached and terraced housing); Rębiechowo (new buildings at the airport); Kokoszki (production and warehouse buildings); and the Jasień and Migowo housing estates in Gdańsk (Figure 3B).
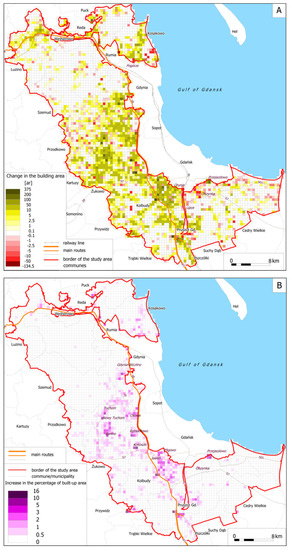
Figure 3.
Change in the developed area between 2013 and 2018 [ar] (A) and increase in the percentage of built-up area at interval of time 2013–2018 [%] (B). Source: prepared by the author based on BDOT10k data.
The changes described above can be seen in the balance sheet, which shows in each basic square field the area of both the buildings that have been decommissioned and those that have been built (Figure 3A). On its basis, the areas where growth or loss of built-up area prevailed in the assumed periods (2000–2012 and 2013–2018) were indicated. Of note is the significant loss of the built-up area in Gdańsk-Olszynka and Przejazdowo.
The reason for the changes in this area is the strongly developed industrial function in the vicinity, the presence of railway and high-voltage power grid lines, and the changes within the allotment gardens. A negative balance of the built-up area since 1985 has also been observed in the approx. 500 m wide strip extending in the north–south direction east of the Gdańsk Orunia-Gdańsk Lipce railway line, a small area north of the city of Pruszcz Gdański, an area north of the Straszyński reservoir (on the border of the Kolbudy and Pruszcz Gdański communes), and an area in Pogórze (decommissioning of non-residential buildings). A steady positive balance of the built-up area was recorded in the vicinity of Gdańsk, Gdynia, Pruszcz Gdański, Wejherowo, and Żukowo. An example of the application of the analyses in the primary fields is shown in Figure 3 (because not all figures were included due to the size of the paper).
In contrast to the analyses based on statistical data for entire municipalities or communes, the analyses conducted in the primary fields show the location of sprawl processes in space. It is particularly important in the border zones of neighboring municipalities and communes and indicates the need for their cooperation to provide infrastructure for the residents. This, of course, has implications for both spatial planning and local government budgets.
In the years 2013–2018, instances of a particular increase in built-up areas near the borders of municipalities or communes were recorded: in the Pruszcz Gdański municipality and commune (warehousing zone in the south-western part of the city and residential buildings near its eastern and western borders); between Gdańsk and Kolbudy (the area around Kowale); near Gdańsk and the Pruszcz Gdański rural commune (Borkowo, the “Cztery Pory Roku” housing estate); between Gdańsk and Żukowo (the area around Rębiechowo and next to Gdańsk-Osowa and Chwaszczyno); and between Gdynia and Żukowo (the area between Gdynia-Dąbrowa and Chwaszczyno). In economic and social terms, this may also translate into an excessive burden on the infrastructure of one municipality or commune due to its use by the residents of a neighboring unit. Pruszcz Gdański is a good example of this problem: terraced and single-family houses have been built there for several years in the rural commune near the eastern border of the city. The new residents of Rokitnica send their children to a school in Pruszcz Gdański, half a kilometre away, instead of to the “district” school in Wiślina, more than 4 km away. Some new residents of the commune are even surprised when it turns out that they no longer live in the city, but in the rural commune (the author’s own observation). One can say that such a procedure is economically justified—it saves time and commuting costs, and the school located in the city is better equipped (it has a swimming pool) and offers a higher level of education than the rural school. Unfortunately, this has a negative impact on other children and their families: the groups are too large, and the children attend classes in shifts.
3.2. Analysis of Changes in the Proportion of Built-Up Land Using Concentric Zones
Actual data on the existing building structures with their exact location make it possible to study the changes in built-up areas in different reference fields. This section of the paper presents the results of the analyses of such changes in concentric zones extending 5, 10, 15, and 20 km away from the adopted city centers (Figure 4). To enable the comparison of the changes over time, the distribution of the increase in building development in the years 1985–2000 was added (Figure 4A).
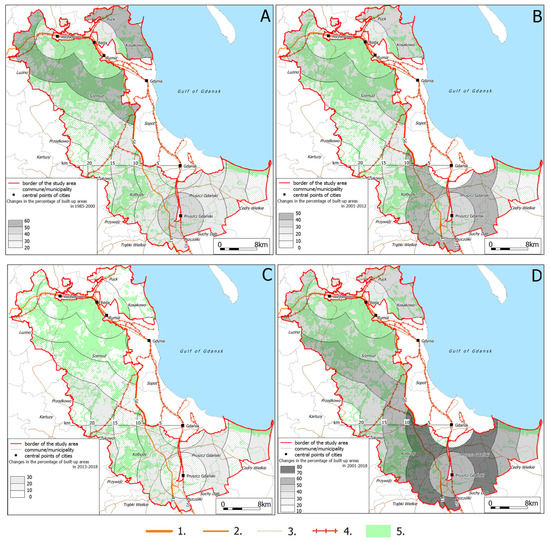
Figure 4.
Changes in the share of built-up areas (%) in zones distant from city centers (in 5 km increments) in the following years: (A) 1985–2000, (B) 2001–2012, (C) 2013–2018, (D) 2001–2018. 1—the A1 motorway; 2—express road S6; 3—other main roads; 4—active railway lines; 5—forests. Sources: (A) [36]; (B–D) prepared by the author based on BDOT10k data.
Between 2001 and 2012, the largest increase in the built-up area—in the range of 40–50%—took place in the zone located 5–10 km away from Gdańsk and Pruszcz Gdański. Such a shift of the built-up zone to more remote areas is characteristic of progressive suburbanization. The new developments included:
- the new districts of Gdańsk (Kiełpino, Kiełpinek, Kokoszki, Jasień, a part of Piecki-Migowo, Szadółki, Zakoniczyn, and new housing estates: “Świętokrzyskie”, “Kolorowe”, “Cztery Pory Roku”, “Trzy Kolory”, and “Miłe Domy”);
- the villages located between the administrative border of Gdańsk and the Tricity’s ring road S6: Kowale and Borkowo; and
- the areas located outside the Tricity’s beltway: in Otomino, Lublewo, Jankowo Gdańskie, Prędzieszyn, Bielkówko, and Jagatowo, as well as areas along national road no. 91 from Łęgowo to Różyny.
This zone also included villages located in the Żuławy region, such as Przejazdowo and Grabiny-Zameczek [36]. Within 10–15 km from the centers of Gdańsk and Gdynia, and up to 5 km from the centers of Rumia, Reda, and Wejherowo, the increase in the built-up areas ranged from 20 to 30%. The value of the balance in the “Small Tricity” was mainly affected by the built-up areas in Bolszewo and Gościcino to the west of Wejherowo, which is linked to the presence of forests, waters, and extensive areas of grassland in the Reda postglacial valley. The part of the Żuławy region located near the banks of the Vistula and the areas west of the Tuchomskie Lake, characterized by a large share of small water bodies and wetlands, and scattered buildings, had the share of built-up area on the level of 10 to 20%. In the central districts of Gdańsk and Gdynia, due to the small possibility to increase the density of the buildings, the increase in the built-up area did not exceed 10%.
Over the next 6 years (2013–2018), a higher share of new construction (20–30%) was again observed in the zone located 5–10 km from Pruszcz Gdański and Gdańsk, followed by the zone located 15–20 km from the assumed central points. This is an area of more intensive construction, with mainly single-family houses. Such a shift of the newly constructed buildings is characteristic of progressive suburbanization. It can be concluded that in the zone located 10–15 km from Gdańsk, the density of development increased, which attracted the attention of people seeking an escape from the city to more distant areas (80% of the newly constructed buildings are single-family dwellings). Considering the entire period since the beginning of the 21st century (Figure 4D), it can be noted that the largest number of new buildings were constructed in the zone located 5–10 km from Pruszcz Gdański and Gdańsk, followed by the zone located 10–15 km from all the central points of the cities and within the city of Pruszcz Gdański (due to the expansion of the warehouse zone in the southern part of the city and new multi-family buildings near the city borders). The excessive encroachment of the built-up areas of the Tricity agglomeration into areas distant from the assumed central points of the agglomeration’s cities is summarized in Figure 4 and Table 1.

Table 1.
Balance of built-up areas for zones (rings) with distance from city centers in 5 km increments.
Considering the long-term changes (for comparison in 1985–2012 and 1985–2018), we obtain values of the balance as high as over 100%, which confirms the conclusions drawn from the maps for shorter time intervals. From 1985 to 2012, the increase in the built-up area was the most intense in the zone located 5–10 km from Gdynia, Rumia, Reda, and Wejherowo and in the zone up to 10 km from Pruszcz Gdański, which is continued in the zone between 5 and 10 km south of Gdańsk. The value of the balance of the built-up area was high (70–80%) within 15 km of the center and then fell below 40%. The central districts of Gdańsk and Gdynia covered by the study were characterized by a similar low-share value of the balance of the built-up area (30–40%). The reason for this is the limited possibility to increase the density of the buildings. Looking at the changes between 1985–2018, it can be seen that the largest increase occurred in the southern part of the studied area: in the aforementioned zone up to 10 km from Pruszcz Gdański, including the zone from 5 to 10 km south of Gdańsk. The high values of the built-up area in the zones located 5–10 km from the central points of the cities indicate a particular intensification of suburbanization processes there.
The use of the BDOT10k data makes it possible to determine the functions of buildings that were constructed or demolished in the analyzed time periods. For example, in the aforementioned zone located 15–20 km from the central points, 3137 buildings have been added since 2012, of which 79.5% were single-family residential buildings and less than 14% were farm buildings. The remaining (less than 7%) were commercial and service buildings, industrial buildings, warehouses, and others.
3.3. Analysis of the Increase in Developed Areas in Relation to the New Pomeranian Metropolitan Rail Line
A preliminary assessment of the importance of the Pomeranian Metropolitan Railway (PKM), commissioned in 2015, for directing the suburbanization process in the spatial aspect was carried out by analyzing the buildings constructed from 2012 to 2018 at the distance of 1 and 2 km from the line and from the PKM stops (Figure 5).
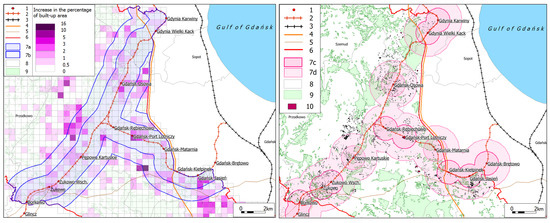
Figure 5.
Increase in the share of buildings in 2012–2018 in relation to the new line of the Pomeranian Metropolitan Railway (PKM). 1—PKM stops; 2—new PKM line; 3—other active railway lines; 4—express road S6; 5—other main roads; 6—border of the study area; 7—buffers located 1 km away from the new railway line (7a), 2 km away from the new railway line (7b), 1 km away from the new railway stops (7c), 2 km away from the new railway stops (7d); 8—borders of commune/municipality; 9—forests; 10—buildings constructed between 2012 and 2018.
In the analyzed period, the newly developed area accounted for 0.29 km2 in the zone located up to 1 km from the PKM line and 0.33 km2 in the zone 1–2 km from the PKM line. Together, it constituted just over 25% of the entire newly developed area in the study area, and nearly 72% of the buildings were single-family homes. Taking into account the distance from the train stops—which is a more reliable measure considering the walking distance to the stops—in zones located up to 1 km, 915 new buildings were constructed with the total surface area of 0.19 km2. Respectively, in zones located 1–2 km from the stops, 1466 buildings were constructed with the total area of 0.25 km2. The largest number of new buildings were constructed in the vicinity of the following stops: Żukowo and Żukowo Wschodnie (247), Gdańsk-Osowa (209), Pępowo Kartuskie (129), and Gdańsk-Jasień (86). The spatial distribution of the newly constructed buildings from 2012 to 2018 within the borders of the analyzed study area does not show a strong relationship with the course of the PKM line, but it does show concentrations around certain PKM stops.
4. Discussion
The methods presented herein make it possible to show in detail the changes in the suburbanization process of any area, indicating the stages of its development and the zones of greatest concentration. Due to the availability of comparable data, the analyzed period was divided into two parts, but a comparison was also carried out with earlier studies that presented the earlier period of political and economic changes that took place in Poland. Between 1985 and 2000, the process of new construction was slow as it was only in the second half of the 1990s that an increasing share of private property could be observed (the restoration of the real value of land rent after the political transformation resulted in an increase in investments on the outskirts of cities where real estate prices were significantly lower). In addition, the state policy in the early 1990s supported the construction of residential housing through so-called building tax credits. At that time, the technical condition of some of the former State Farm buildings deteriorated and they were liquidated, and there was a slow increase in the number of new residential buildings, mainly in the western parts of Gdańsk and Gdynia. The emerging housing estates did not form a larger zone at that stage, nor were they located at significant distances away from the previously built-up center [36]. The years 2001–2012 were a period in which infrastructure development was a significant incentive to move housing developments to areas farther from city centers (since 1 May 2004, Poland’s accession to the European Union has enabled municipalities to access previously unattainable funds and to expand and modernize their infrastructure, including roads). The simultaneous increase in the wealth of the residents translated into the development of second houses: holiday or year-round houses located in rural areas, away from the hustle and bustle of the city, and multi-family housing in new housing developments. As a result, a compact new built-up zone was created from Różyny in the south, through Pruszcz Gdański, Straszyn, the southern districts of Gdańsk, and Rębiechowo and further: through Banino to Żukowo and through Osowa and Chwaszczyno to Gdynia and Bojano. These buildings often encroach on land unsuitable for development for environmental reasons (land with non-bearing soils or at risk of flooding) [36]. This period is also marked by the development of shopping centers and warehousing and logistics zones located at major road transport hubs (for example Gdańsk-Szadółki and Pruszcz Gdański). The last 6 analyzed years indicate that construction of both multi- and single-family residential housing (including summer houses) and the construction of shopping centers (for instance in Rumia) as well as warehousing and logistics centers (for example in Gdańsk-Rębiechowo) are proceeding. In all periods, more buildings were constructed than were decommissioned. Since the mid-1980s, the average number of newly constructed buildings per year has been increasing: between 1985 and 2000 it was 1,27 buildings/year, from 2001 to 2012 it was an average of 2,35 buildings/year, and between 2013 and 2018 as many as 2,54 buildings/year. Suburbanization covers areas distant from city centers, especially 5–10 km away, and tracing this process over the years makes it possible to observe a shift of the zone of the most intensive development growth to areas located at a greater distance from the assumed central points.
The development of the transport system is cited as one of the factors that stimulate the processes of transforming the space around cities, including the suburbanization processes [1,2]. It is also underlined in the case of small cities, not only agglomerations [54]. On the one hand, the development of the transport network contributes to population mobility, including daily commuting [55]. On the other hand, a lack of public transport could create negative pressure on the environment. The question is: is the construction of new transport lines causing suburbanization or are they being built as a result of suburbanization? Both processes probably run parallel and depend on the situation. Examples show that earlier inconvenient places have become accessible through extensive road networks leading to population decentralization from the traditional urban center to suburbia [56]. Different methods of measuring and monitoring the transportation impact on suburbanization have been tested [17,57]. A special type of transportation system is the railway, which can only compete with individual means of transportation when it has a properly developed infrastructure, especially in terms of the train-stop accessibility [58]. As reported by Li and Wang [59]: “the population of the city agglomeration area added rail lines and nodes when it grows to a certain degree, convenient rail transportation in turn will attract more people into the region, which leads to the excessive population agglomeration.” (p. 145). In the area in question, the most important new transport system component is the Pomeranian Metropolitan Railway, commissioned in 2015, operating on the following routes: Gdańsk Główny-Gdańsk Port Lotniczy-Gdynia Główna, Kartuzy-Gdańsk Główny, and Kościerzyna-Gdańsk Główny/Gdynia Główna. The data provided by the carrier show that during the period under review there was an increase in the number of passengers on all sections (a total of 2 million in 2016 and as many as 4 million as of 27 December 2018 [60]). Examples of development projects located along the new railway line [43] were carried out partly outside the area considered in this study (for example Wróbla Staw and Central Park within the boundaries of the Gdańsk-Morena district), but some of them are within its borders (for instance, Jasień and Kiełpinek). While it is a fact that new warehousing and office space is being created in the vicinity of the Gdańsk Airport junction and new housing estates are being planned along the PKM route, a comparison of the data on the number of passengers and the share of the stops in the total passenger traffic seem an inadequate measure of the phenomenon in question. For example, the highest traffic recorded on the section from Gdańsk Wrzeszcz to the airport is not related to suburbanization, but to the operation of the airport itself. Similarly, more and more people are using the park & drive system offered at the stops, so they do not live in the immediate vicinity of the PKM. The benefits and problems resulting from the functioning of the PKM are also described by other authors [58,61]. Nevertheless, it is to be hoped that, as Masik [43] stated: “The line running through the Żukowo and Kartuzy municipalities, as it happens within Gdańsk, also has a chance to channel the hitherto inclinations of private investors to develop land in a dispersed manner, which may result in the future development of settlements in the vicinity of railway stops.” However, Statistics Poland data, on building permits issued, are insufficient to monitor this process, as these data are generalized for the entire county, and the issuance of a permit does not always result in the rapid construction of a house. Similarly, the number of development conditions decisions issued constitutes data generalized at the level of the municipalities. Hence, the conclusion is that studies should be supplemented with data on the actual locations of the buildings.
When analyzing the distribution and functions of new buildings, it is also worth referring to the trends highlighted in the European literature concerning the foreign ownership of real estate [3,17] observed in Mediterranean countries and the issue of administrative change [62]. In the first case, despite the seaside location of the Tricity agglomeration, due to its climate conditions it has not yet become a very desirable location, and an increase in foreign buyers of real estate has not been observed. In the analyzed period, the owners of new houses were often people who had accumulated capital while working abroad but were Polish citizens (own observation). On the other hand, a different trend can be observed: more and more people whose financial status has improved decide to build a house outside the city and rent an apartment in the city to people from abroad, either in the form of accommodation for the summer or as year-round accommodation for workers from, for example, Ukraine and Belarus. This trend is difficult to measure because not all people register as residents and therefore are not included in any statistics.
With reference to the phenomenon of the change of the status of a unit from rural to urban or the change of the administrative boundaries, which is mentioned in the literature and is present, for example, in Hungary [62], it should be emphasized that in the analyzed area no such change has occurred since 2000. Among the municipalities that gained the status of a city after 2012, there are no units adjacent to the Tricity. The movement of a population to units with rural status does not usually entail attempts to incorporate that unit into a city. What is more, families moving to suburban areas often leave at least one member registered in the city to benefit, for example, from access to schools (regionalization of education). In parallel, more and more people from abroad come to Polish cities and settle legally or illegally as school or university students or as workers. These people are not always registered as residents, which results in an underestimation of the data in many areas of life, for example in public transport [36].
5. Conclusions
In the conclusion of the analysis of the changes in the share of developed areas, it should be pointed out that a grid of primary fields was used to determine the areas of the greatest increase and decrease in developed areas in the years 2000–2012 and 2013–2018 occurring irrespective of administrative borders. A constant positive balance of the developed area was observed in the vicinity of Gdańsk, Gdynia, Pruszcz Gdański, Wejherowo and Żukowo, while a constant negative balance since 2000 was observed in Gdańsk-Olszynka and Przejazdowo, and to a lesser extent in the areas along the railway line in Gdańsk-Orunia and Gdańsk-Lipce. The emergence of development zones at the administrative borders between the city of Gdańsk and the Pruszcz Gdański municipality, between Gdańsk and Kolbudy, near the border of Gdańsk and the rural commune of Pruszcz Gdański, between Gdańsk and Żukowo, and next to the border of Gdynia and Żukowo should be an indication for the authorities of these entities to pursue a wise and coherent policy to reduce the possibility of socio-economic and transport problems and conflicts. The use of concentric rings in the analysis of the changes in the share of built-up areas, made it possible to trace the process of the shifting of the zones of the new developments’ highest intensification. Considering the entire period from the beginning of the 21st century, most new buildings were constructed in the zone located 5–10 km from Pruszcz Gdański and Gdańsk and then in the band located 10–15 km away from all the central points of the cities and within the city of Pruszcz Gdański. Such a shift of the newly constructed buildings is characteristic of progressive suburbanization.
The spatial distribution of the newly constructed buildings from 2012 to 2018 within the borders of the analyzed study area did not show a strong relationship with the course of the PKM line, but it did show its concentrations around certain PKM stops. The role of the PKM in the Tricity public transportation system should increase and this process should be monitored.
The progressive interlinking of metropolitan areas with a good highway network is an additional stimulus for urban sprawl; so, increasing the role of public transport and the efficient use of space should be priorities for authorities at all levels of government.
The adopted approach makes it possible to analyze changes irrespective of administrative unit boundaries and to present more detailed results, which can be generalized at the level of municipalities/communes or villages. Moreover, it is possible to illustrate the actual status of development, which is not possible for analyses based on data on the number of issued land-development conditions, decisions, or building permits. Not all such permits and decisions result in the start of construction, let alone its completion. Often, for financial or personal reasons, the plot remains undeveloped for many years, despite the building permit issued for the building. The use of data on the actual location of buildings makes it possible, for example, to:
- analyze the changes in the number and surface area of buildings related directly to their location, for example in terms of their location in areas subject to natural hazards, in relation to protected areas, their location within areas covered by local land-use plans, etc.;
- analyze the built-up area in the primary fields (of any size and shape—depending on the purpose of the study) or zones; in such situations, the percentage of the area occupied by buildings is primarily used; and
- generate central points of buildings in the GIS software for analyses based on distances between structures.
An additional advantage of data on buildings obtained from digital databases is the possibility to analyze their functions. The use of this research approach is also supported by the increasingly frequent problem of incompleteness or the limited reliability of statistical data [63]. The advantage of the use of the BDOT10k vector data is their comparability for the entire territory of Poland. The disadvantages of this approach are the possibility of errors in the database, which requires special attention and knowledge of the land and dependence on the timing of database updates. The current availability of ready-made databases and their more frequent updates enables faster and wider application and increases the advantages of the chosen method. It seems that the approach where analyses based on statistical data are combined with analyses of data from the BDOT10k is appropriate, as it makes it possible to the fullest extent not only to compare the indicators calculated for different administrative units, but also to answer the questions of where and why the observed phenomena and problems occur.
The results of the research can find practical application in planning the spatial development of the Tricity agglomeration and as guidelines for the preparation of planning documents in individual municipalities. The obtained data should constitute the basis for planning cooperation at the borders of communes. The results of the conducted analyses may also be helpful in verifying and supplementing transport networks, which in the long run will improve the quality of life of the inhabitants.
Funding
This research received no external funding.
Institutional Review Board Statement
Not applicable.
Informed Consent Statement
Not applicable.
Data Availability Statement
The data presented in this study are available on request from the author. Primary data was obtained from the Database of Topographic Objects in the scale of 1:10,000 (BDOT10k), made available by the Central Office of Geodesy and Cartography.
Conflicts of Interest
The author declares no conflict of interest.
References
- Antrop, M. Landscape change and the urbanization process in Europe. Landsc. Urban Plan. 2004, 67, 9–26. [Google Scholar] [CrossRef]
- Harris, R. Suburbanization and Suburbanism. In International Encyclopedia of the Social & Behavioral Science; Wright, J.D., Ed.; Elsevier: Oxford, UK, 2015; Volume 23, pp. 660–666. [Google Scholar]
- Rontos, K.; Mavroudis, C.; Salvati, L. Suburbanisation and Urban Growth: Revisiting the Life Cycle Hypothesis. 2011. Available online: http://www.grupposervizioambiente.it/aisre/pendrive2012/pendrive/Paper/Salvati_suburbanization_athens_ERSA.pdf (accessed on 14 February 2019).
- Xi, Y.; Thinh, N.X.; Li, C. Spatio-temporal variation analysis of landscape pattern response to land use change from 1985 to 2015 in Xuzhou City, China. Sustainability 2018, 10, 4287. [Google Scholar] [CrossRef]
- Wang, H.; Shi, Y.; Zhang, A.; Cao, Y.; Liu, H. Does suburbanization cause ecological deterioration? An empirical analysis of Shanghai, China. Sustainability 2017, 9, 124. [Google Scholar] [CrossRef]
- Zhou, Y.; Logan, J.R. Growth on the Edge: The New Chinese Metropolis. In Urban China in Transition; Logan, J.R., Ed.; Wiley: Hoboken, NJ, USA, 2008. [Google Scholar]
- Mabin, A. Suburbanisation, segregation, and government of territorial transformations. Transform. Crit. Perspect. S. Afr. 2005, 57, 41–63. [Google Scholar]
- Todes, A. New African Suburbanisation? Exploring the Growth of the Northern Corridor of eThekwini/KwaDakuza. Afr. Stud. 2014, 73, 245–270. [Google Scholar] [CrossRef]
- Simon, D.; McGregor, D.; Nsiah-Gyabaah, K. The changing urban-rural interface of African cities: Definitional issues and an application to Kumasi, Ghana. Environ. Urban. 2004, 16, 235–247. [Google Scholar]
- Wu, S.; Sumari, N.S.; Dong, T.; Xu, G.; Liu, Y. Characterizing Urban Expansion Combining Concentric-Ring and Grid-Based Analysis for Latin American Cities. Land 2021, 10, 444. [Google Scholar] [CrossRef]
- Inostroza, L.; Baur, R.; Csaplovics, E. Urban sprawl and fragmentation in Latin America: A dynamic quantification and characterization of spatial patterns. J. Environ. Manag. 2013, 115, 87–97. [Google Scholar]
- Dong, T.; Jiao, L.; Xu, G.; Yang, L.; Liu, J. Towards sustainability? Analyzing changing urban form patterns in the United States, Europe, and China. Sci. Total Environ. 2019, 671, 632–643. [Google Scholar] [CrossRef]
- Guneralp, B.; Reba, M.; Hales, B.U.; Wentz, E.A.; Seto, K.C. Trends in urban land expansion, density, and land transitions from 1970 to 2010: A global synthesis. Environ. Res. Lett. 2020, 15, 044015. [Google Scholar] [CrossRef]
- Duany, A.; Plater-Zyberk, E.; Speck, J. Suburban Nation: The Rise of Sprawl and the Decline of the American Dream; North Point Press: New York, NY, USA, 2000. [Google Scholar]
- Zuziak, Z.K. Strefa podmiejska w architekturze miasta w stronę nowej architektoniki regionu miejskiego. In Problem Suburbanizacji; Lorens, P., Ed.; Biblioteka Urbanisty: Warszawa, Poland, 2005; Volume 7, pp. 17–32. [Google Scholar]
- Galster, G.; Hanson, R.; Ratcliffe, M.; Wolman, H.; Coleman, S.; Freihag, J. Wrestling Sprawl to the Ground: Defining and Measuring an Elusive Concept. Hous. Policy Debate 2001, 12, 681–717. [Google Scholar] [CrossRef]
- Fuladlu, K.; Riza, M.; Ilkan, M. Monitoring Urban Sprawl Using Time-Series Data: Famagusta Region of Northern Cyprus. SAGE Open 2021, 11, 1–13. [Google Scholar] [CrossRef]
- Sagan, I. Miasto—Scena Konfliktów i Współpracy; Wydawnictwo Uniwersytetu Gdańskiego: Gdańsk, Poland, 2000. [Google Scholar]
- Sagan, I.; Czepczyński, M.; Szmytkowska, M.; Masik, G.; Rzyski, S. Równoważenie procesów suburbanizacji w Metropolii Trójmiasta. In Studia nad Obszarem Metropolitalnym Trójmiasta; Pankau, F., Ed.; Urząd Marszałkowski Województwa Pomorskiego: Gdańsk, Poland, 2006; pp. 123–189. [Google Scholar]
- Biolek, J.; Andrasko, I.; Malý, J.; Zrustova, P. Interrelated aspects of residential suburbanization and collective quality of life: A case study in Czech suburbs. Acta Geogr. Slov. 2017, 57, 65–75. [Google Scholar] [CrossRef]
- Burdack, J.; Hesse, M. Suburbanisation, Suburbia and “Zwischenstadt”: Perspectives of Research and Policy. In Territorial Cohesion, German Annual of Spatial Research and Policy; Springer: Berlin/Heidelberg, Germany, 2007; pp. 81–100. [Google Scholar]
- Jogun, T.; Pavlek, K.; Belic, T.; Buhin, S.; Malesic, N. Land cover changes in northern Croatia from 1981 to 2011. Hrvat. Geogr. Glas. 2017, 79, 33–59. [Google Scholar]
- Mihai, B.; Nistor, C.; Simion, G. Post-socialist urban growth of Bucharest, Romania—A change detection analysis on Landsat imagery (1984–2010). Acta Geogr. Slov. 2015, 55, 223–234. [Google Scholar]
- Bagyura, M. The impact of suburbanisation on power relations in settlements of Budapest Agglomeration. Geogr. Pannon. 2020, 24, 13–24. [Google Scholar] [CrossRef]
- Repaska, G.; Vilinova, K.; Solcova, L. Trends in development of residential areas in suburban zone of the city of Nitra (Slovakia). Eur. Ctry. 2017, 2, 287–301. [Google Scholar] [CrossRef]
- Gałka, J.; Warych-Juras, A. Suburbanization and migration in Polish metropolitan areas during political transition. Acta Geogr. Slov. Geogr. Zb. 2018, 58, 63–72. [Google Scholar] [CrossRef]
- Smutek, J. Wpływ Suburbanizacji na Budżety Gmin w Strefie Oddziaływania Wielkich Miast w Polsce, Praca Doktorska Wykonana w Katedrze Badań Miast i Regionów. Ph.D. Thesis, Univesity of Szczecin, Szczecin, Poland, 2016. [Google Scholar]
- Staszewska, S. Przekształcenia urbanistyczne osiedli wiejskich strefy podmiejskiej dużego miasta. Barom. Reg. 2012, 4, 53–68. [Google Scholar]
- Adamiak, M.; Jażdżewska, I.; Nalej, M. Analysis of Built-Up Areas of Small Polish Cities with the Use of Deep Learning and Geographically Weighted Regression. Geosciences 2021, 11, 223. [Google Scholar] [CrossRef]
- Lityński, P. The Intensity of Urban Sprawl in Poland. ISPRS Int. J. Geo-Inf. 2021, 10, 95. [Google Scholar]
- Degórska, B. Problemy planowania struktur przyrodniczych Obszaru Metropolitalnego Warszawy związane z żywiołową urbanizacją przestrzeni, Mazowsze. Stud. Reg. 2012, 10, 89–106. [Google Scholar]
- Kożan, A.; Balcerek, K. An Attempt to Formulate Research Methods for the Urban Sprawl Phenomenon as Exemplified by the Wrocław Agglomeration. In Uncontrolled Urban Sprawl as a Growing Problem of Urban Agglomerations in Poland; Kozłowski, S., Ed.; Sustainable Development Studies Committee “Man and Environment” of the Polish Academy of Sciences: Białystok/Lublin/Warszawa, Poland, 2006; Volume 2, pp. 243–258. [Google Scholar]
- Lorens, P. Scenariusze rozwoju przestrzennego obszaru metropolitalnego Trójmiasta. Rozw. Reg. Polit. Reg. 2015, 29, 71–92. [Google Scholar]
- Musiaka, L.; Sudra, P.; Sporna, T. Spatial chaos as a result of war damage and post-war tyransformations: Example of small town of Węgorzewo. Land 2021, 10, 541. [Google Scholar] [CrossRef]
- Poniży, L. Presja urbanizacyjna i jej wpływ na zmiany przestrzennej struktury użytkowania ziemi na wybranych obszarach podmiejskich Poznania. Prob. Ekol. Kraj. 2008, 22, 335–342. [Google Scholar]
- Korwel-Lejkowska, B. Wpływ Rozprzestrzeniania się Miast na Środowisko Przyrodnicze w Otoczeniu Aglomeracji Trójmiejskiej; Wydawnictwo Uniwersytetu Gdańskiego: Gdańsk, Poland, 2020; p. 196. [Google Scholar]
- Mantey, D.; Sudra, P. Types of suburbs in post-socialist Poland and their potential for creating public spaces. Cities 2019, 88, 209–221. [Google Scholar] [CrossRef]
- Przewoźniak, M. Przyrodnicze uwarunkowania przestrzennego rozwoju aglomeracji gdańskiej. Zeszyty Naukowe Wydziału Biologii i Nauk o Ziemi Geografia 1985, 13, 79–91. [Google Scholar]
- Kopeć, A.; Korwel-Lejkowska, B. Analysis of the Suitability for Development in Regards to the Landscape Units of Lands Designated for Housing in the Local Plan of the Rural Commune of Pruszcz Gdański. TEKA Kom. Ochr. Kształtowania Sr. Przyr. (OL PAN) 2013, 10, 170–184. [Google Scholar]
- Masik, G. Wpływ Polityki Lokalnej na Warunki i Jakość Życia, Przykład Strefy Suburbanizacji Trójmiasta; Wydawnictwo Naukowe Scholar: Warszawa, Poland, 2010; p. 288. [Google Scholar]
- Sołtys, J. Żywiołowe procesy urbanizacji w strefie podmiejskiej aglomeracji gdańskiej. In Uncontrolled Urban Sprawl as a Growing Problem of Urban Agglomerations in Poland; Kozłowski, S., Ed.; Sustainable Development Studies, Committee “Man and Environment” of the Polish Academy of Sciences: Białystok/Lublin/Warszawa, Poland, 2006; Volume 2, pp. 225–241. [Google Scholar]
- Szmytkowska, M.; Masik, G. Społeczne aspekty suburbanizacji w obszarze metropolitalnym Trójmiasta. In Problem Suburbanizacji; Lorens, P., Ed.; Biblioteka Urbanisty: Warszawa, Poland, 2005; Volume 7, pp. 71–80. [Google Scholar]
- Masik, G. Demographic and spatial suburbanization in the Gdańsk-Gdynia-Sopot Metropolitan Area. Studia Obsz. Wiej. 2018, 50, 155–170. [Google Scholar] [CrossRef]
- Kroh, P.; Pawlik, L. Recent advances on geomorphology of the Gorce Mountains, the Outer Western Carpathians: State-of-the-art and future perspectives. Geogr. Pol. 2021, 94, 47–67. [Google Scholar] [CrossRef]
- Lowicki, D. Ocena krajobrazu na potrzeby planowania przestrzennego w Aglomeracji Poznańskiej. Prob. Ekolog. Krajobr. 2014, 38, 125–134. [Google Scholar]
- Balon, J.; Krąż, P. Ocena Jakości Krajobrazu—Dobór Prawidłowych Jednostek Krajobrazowych. In Identyfikacja i Waloryzacja Krajobrazów—Wdrażanie Europejskiej Konwencji Krajobrazowej, Referaty Konferencyjne; GDOŚ: Warszawa, Poland, 2013; pp. 58–63. [Google Scholar]
- Seto, K.C.; Fragkias, M. Quantifying spatiotemporal patterns of urban land-use change in four cities of China with time series landscape metrics. Landsc. Ecol. 2005, 20, 871–888. [Google Scholar] [CrossRef]
- Guérois, M.; Pumain, D. Built-up encroachment and the urban field: A comparison of forty European cities. Environ. Plan. Econ. Space 2008, 40, 2186–2203. [Google Scholar] [CrossRef]
- Obszar Metropolitalny Gdańsk–Sopot–Gdynia. Available online: www.metropoliagdansk.pl (accessed on 1 September 2021).
- Statistical Office in Gdańsk. Available online: https://gdansk.stat.gov.pl/vademecum/vademecum_pomorskie/portret_obszaru_metropolitalnego/obszar_metropolitalny_gda%C5%84sk-gdynia-sopot.pdf (accessed on 1 September 2021).
- Turzyński, M. Analiza delimitacji gdańskiego obszaru metropolitalnego i jego stref. Rozw. Reg. Polit. Reg. 2015, 29, 93–108. [Google Scholar]
- PN-ISO 9836: 1997. Właściwości Użytkowe w Budownictwie—Określanie i Obliczanie Wskaźników Powierzchniowych i Kubaturowych. Performance Standards in Building-Definition and Calculation of Area and Space Indicators. Available online: http://rzeczoznawca-zachodniopomorskie.pl/pliki/PN_ISO_9836_1997.pdf (accessed on 7 March 2021).
- Rozporządzenie NR 1/2006 Dyrektora Regionalnego Zarządu Gospodarki Wodnej w Gdańsku z dn. 21 Lutego 2006 r. w Sprawie Ustanowienia Strefy Ochronnej Ujęcia Wody Powierzchniowej “Straszyn” z Rzeki Raduni, Gmina Kolbudy, woj. Pomorskie. Polska. Available online: http://www.rzgw.gda.pl/cms/site.files/file/rozporzadzenia/rozporzadzenia2006/R06nr1.pdf (accessed on 7 March 2021).
- Valtenbergs, V.; González, A.; Piziks, R. Selecting indicators for sustainable development of small towns: The case of Valmiera Municipality. Proc. Comput. Sci. 2013, 26, 21–32. [Google Scholar] [CrossRef]
- Hlavacek, P.; Kopacek, M.; Horackova, L. Impact of suburbanisation on sustainable development of settlements in suburban spaces: Smart and new solutions. Sustainability 2019, 11, 7182. [Google Scholar] [CrossRef]
- Behan, K.; Maoh, H.; Kanaroglou, P. Smart growth strategies, transportation and urban sprawl: Simulated futures for Hamilton, Ontario. Can. Geogr. 2008, 52, 291–308. [Google Scholar] [CrossRef]
- Ewing, R.H.; Pendall, R.; Chen, D. Measuring Sprawland Its Transportation Impacts. Transp. Res. Rec. J. Transp. Res. Board 2003, 1831, 175–183. [Google Scholar] [CrossRef]
- Połom, M.; Tarkowski, M.; Puzdrakiewicz, K. Urban Transformation in the Context of Rail Transport Development: The Case of a Newly Built Railway Line in Gdańsk (Poland). J. Adv. Transp. 2018, 2018, 1218041. [Google Scholar] [CrossRef]
- Li, X.; Wang, Y. The relationship between the urban rail transit network and the population distribution in Shanghai. In Proceedings of the 4th International Conference on Humanities and Social Science Research (ICHSSR 2018), Wuxi, China, 25–27 April 2018; International Academic Exchange Center of Jiangnan University: Wuxi, China, 2018. [Google Scholar] [CrossRef]
- Kolejny Rekordowy Rok PKM—Przeszło 4 Mln Pasażerów. Available online: https://www.rynek-kolejowy.pl/mobile/kolejny-rekordowy-rok-pkm--przeszlo-4-mln-pasazerow-89991.html (accessed on 26 July 2021).
- Kopeć, K. Pomeranian Metropolitan Railways—The functioning and directions of development. AUTOBUSY Tech. Eksploat. Syst. Transp. 2018, 19, 6. [Google Scholar] [CrossRef]
- Konecka-Szydłowska, B.; Trócsányi, A.; Pirisi, G. Urbanisation in a formal way? The different characteristics of the ‘newest towns’ in Poland and Hungary. Reg. Stat. 2018, 8, 1–19. [Google Scholar] [CrossRef]
- Michalski, T. Problemy Monitoringu Przestrzennego Sytuacji Społecznej, 1st ed.; Wydawnictwo Bernardinum: Gdańsk, Poland; Pelplin, Poland, 2020; p. 143. [Google Scholar]


Publisher’s Note: MDPI stays neutral with regard to jurisdictional claims in published maps and institutional affiliations. |
© 2021 by the author. Licensee MDPI, Basel, Switzerland. This article is an open access article distributed under the terms and conditions of the Creative Commons Attribution (CC BY) license (https://creativecommons.org/licenses/by/4.0/).