
A Field Study on Thermal Comfort and Cooling Load Demand Optimization in a Tropical Climate

 , , ,
, , ,  and
and 
Abstract
:1. Introduction
- Investigating the thermal quality of a GBI Platinum-certified office building in Malaysia through both objective and subjective measurements;
- Comparing PMV (Fanger’s PMV-PPD model) with TSV;
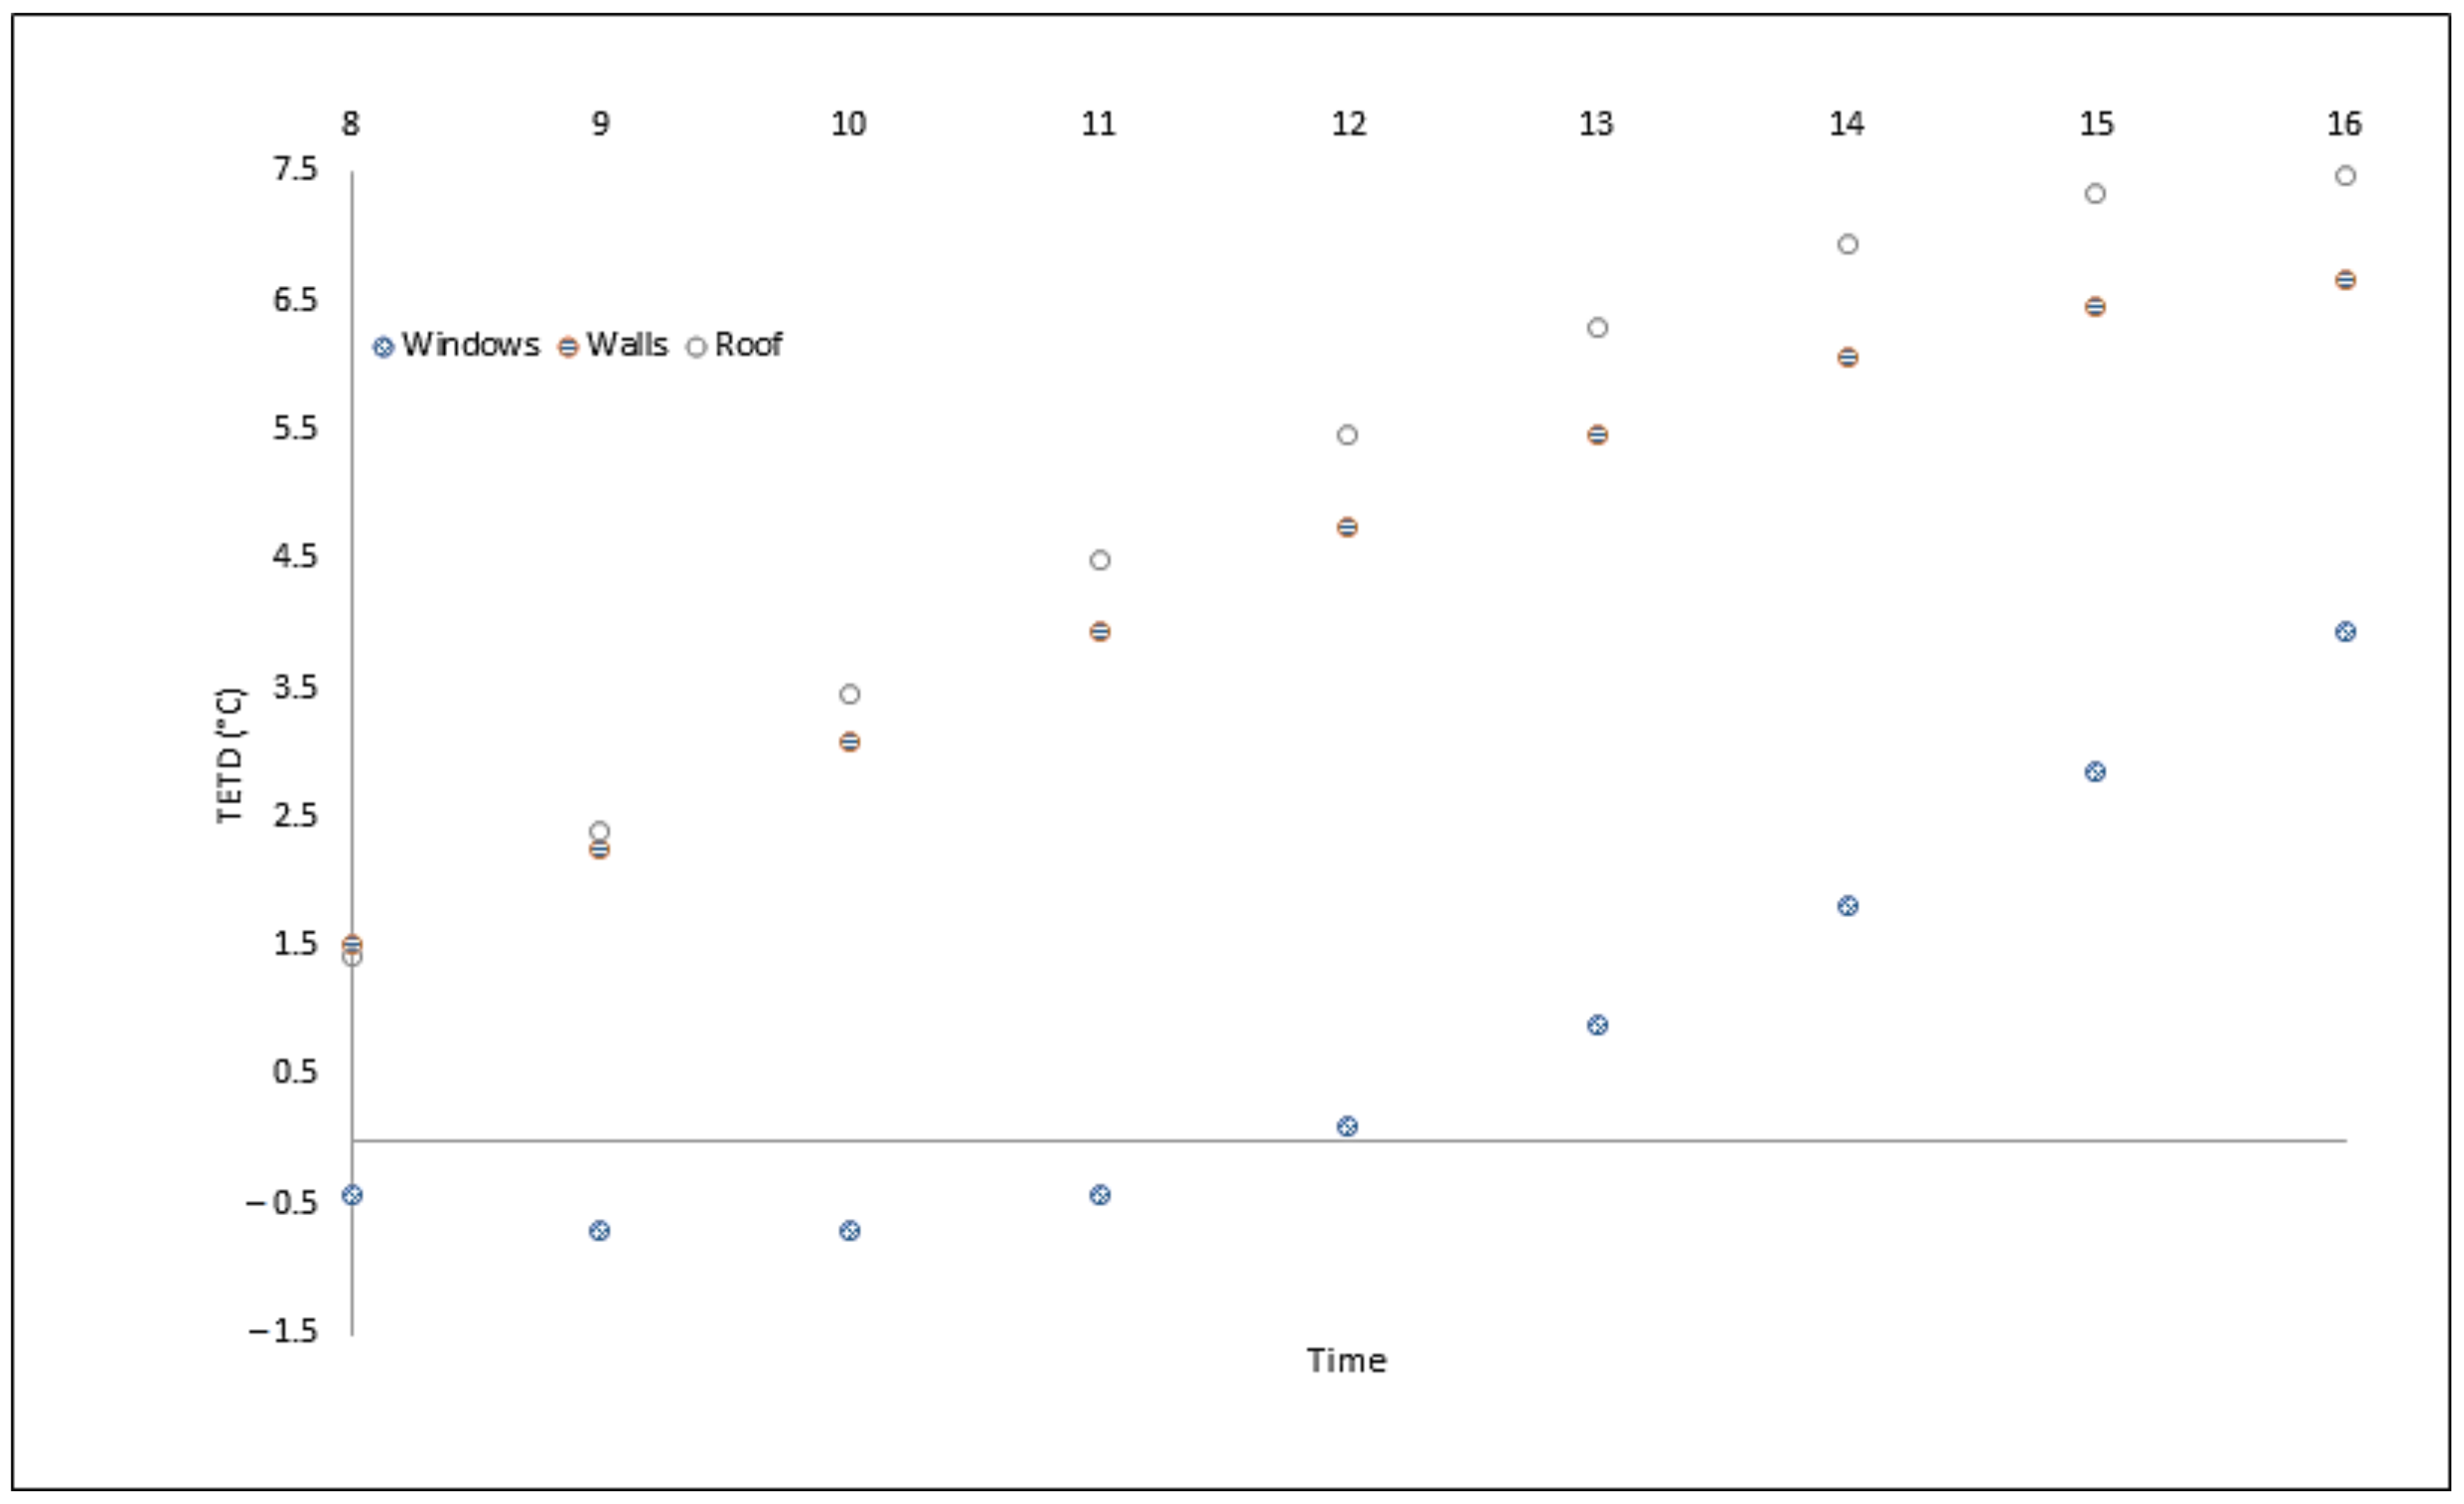
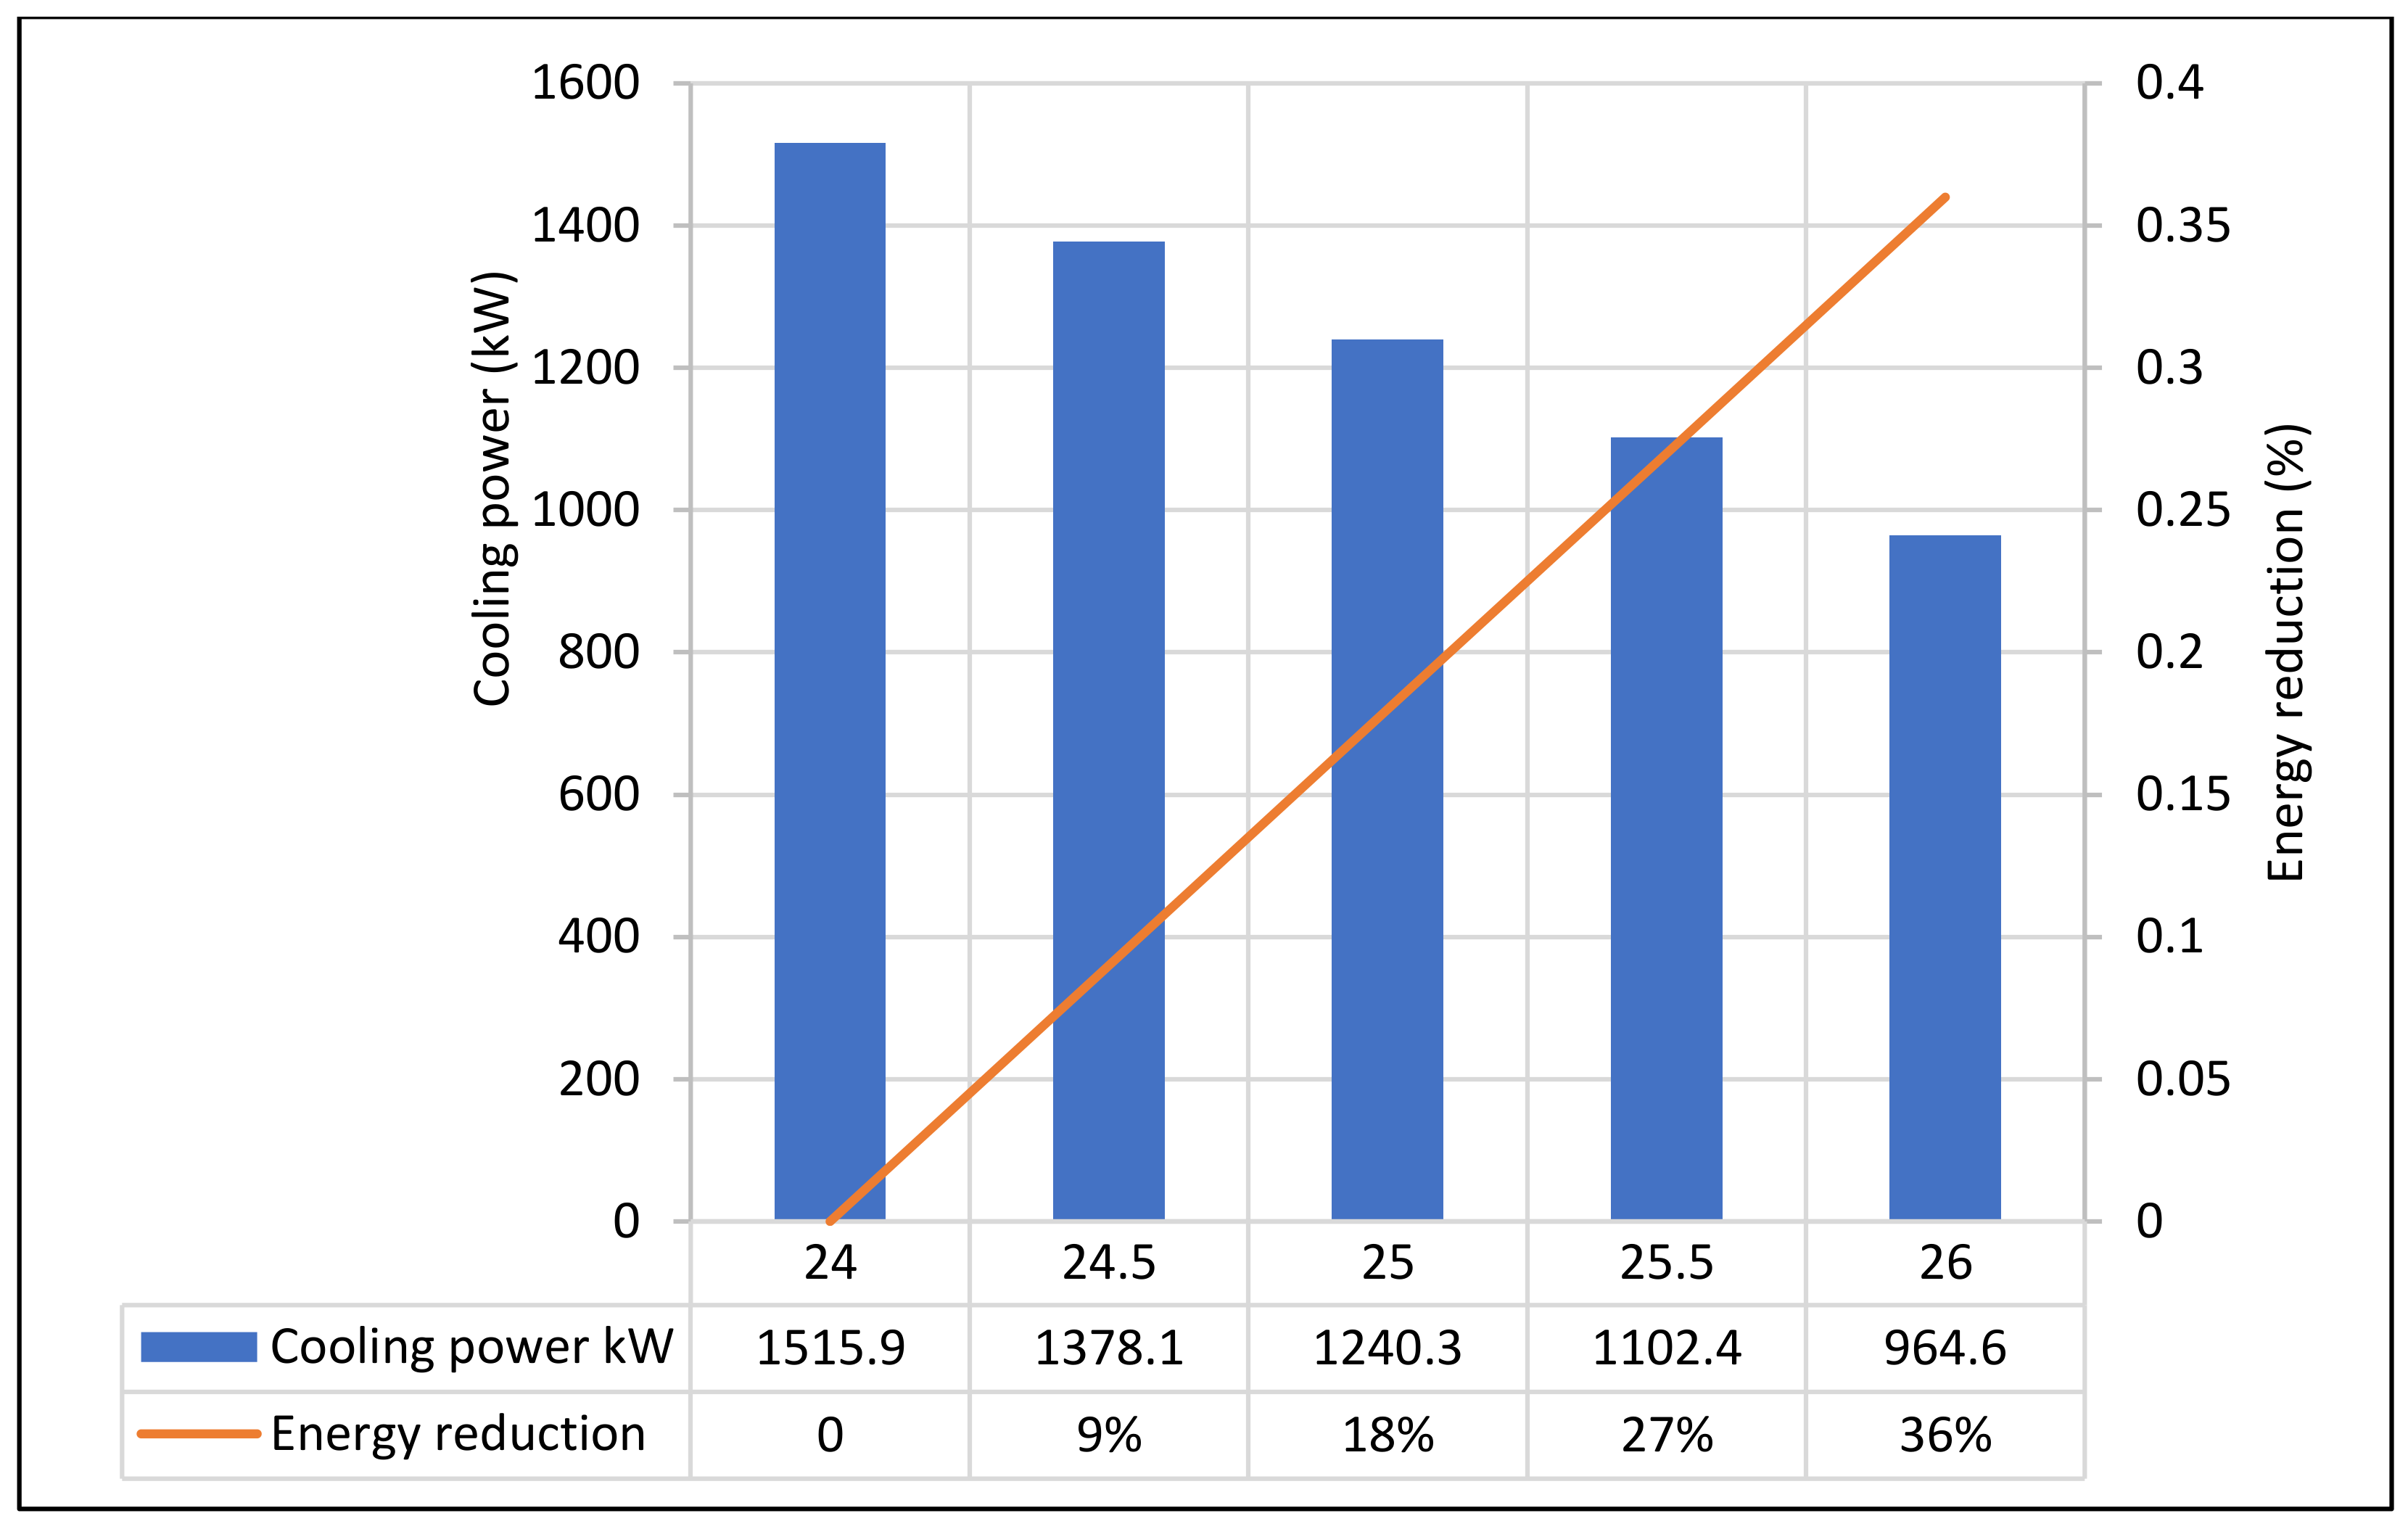
- Calculating the amount of cooling energy demand with the TETD method for various neutral indoor set-point temperatures;
- Determining the optimum indoor air temperature based on occupant comfort and cooling energy demand.
Green Building Index
2. Materials and Methods
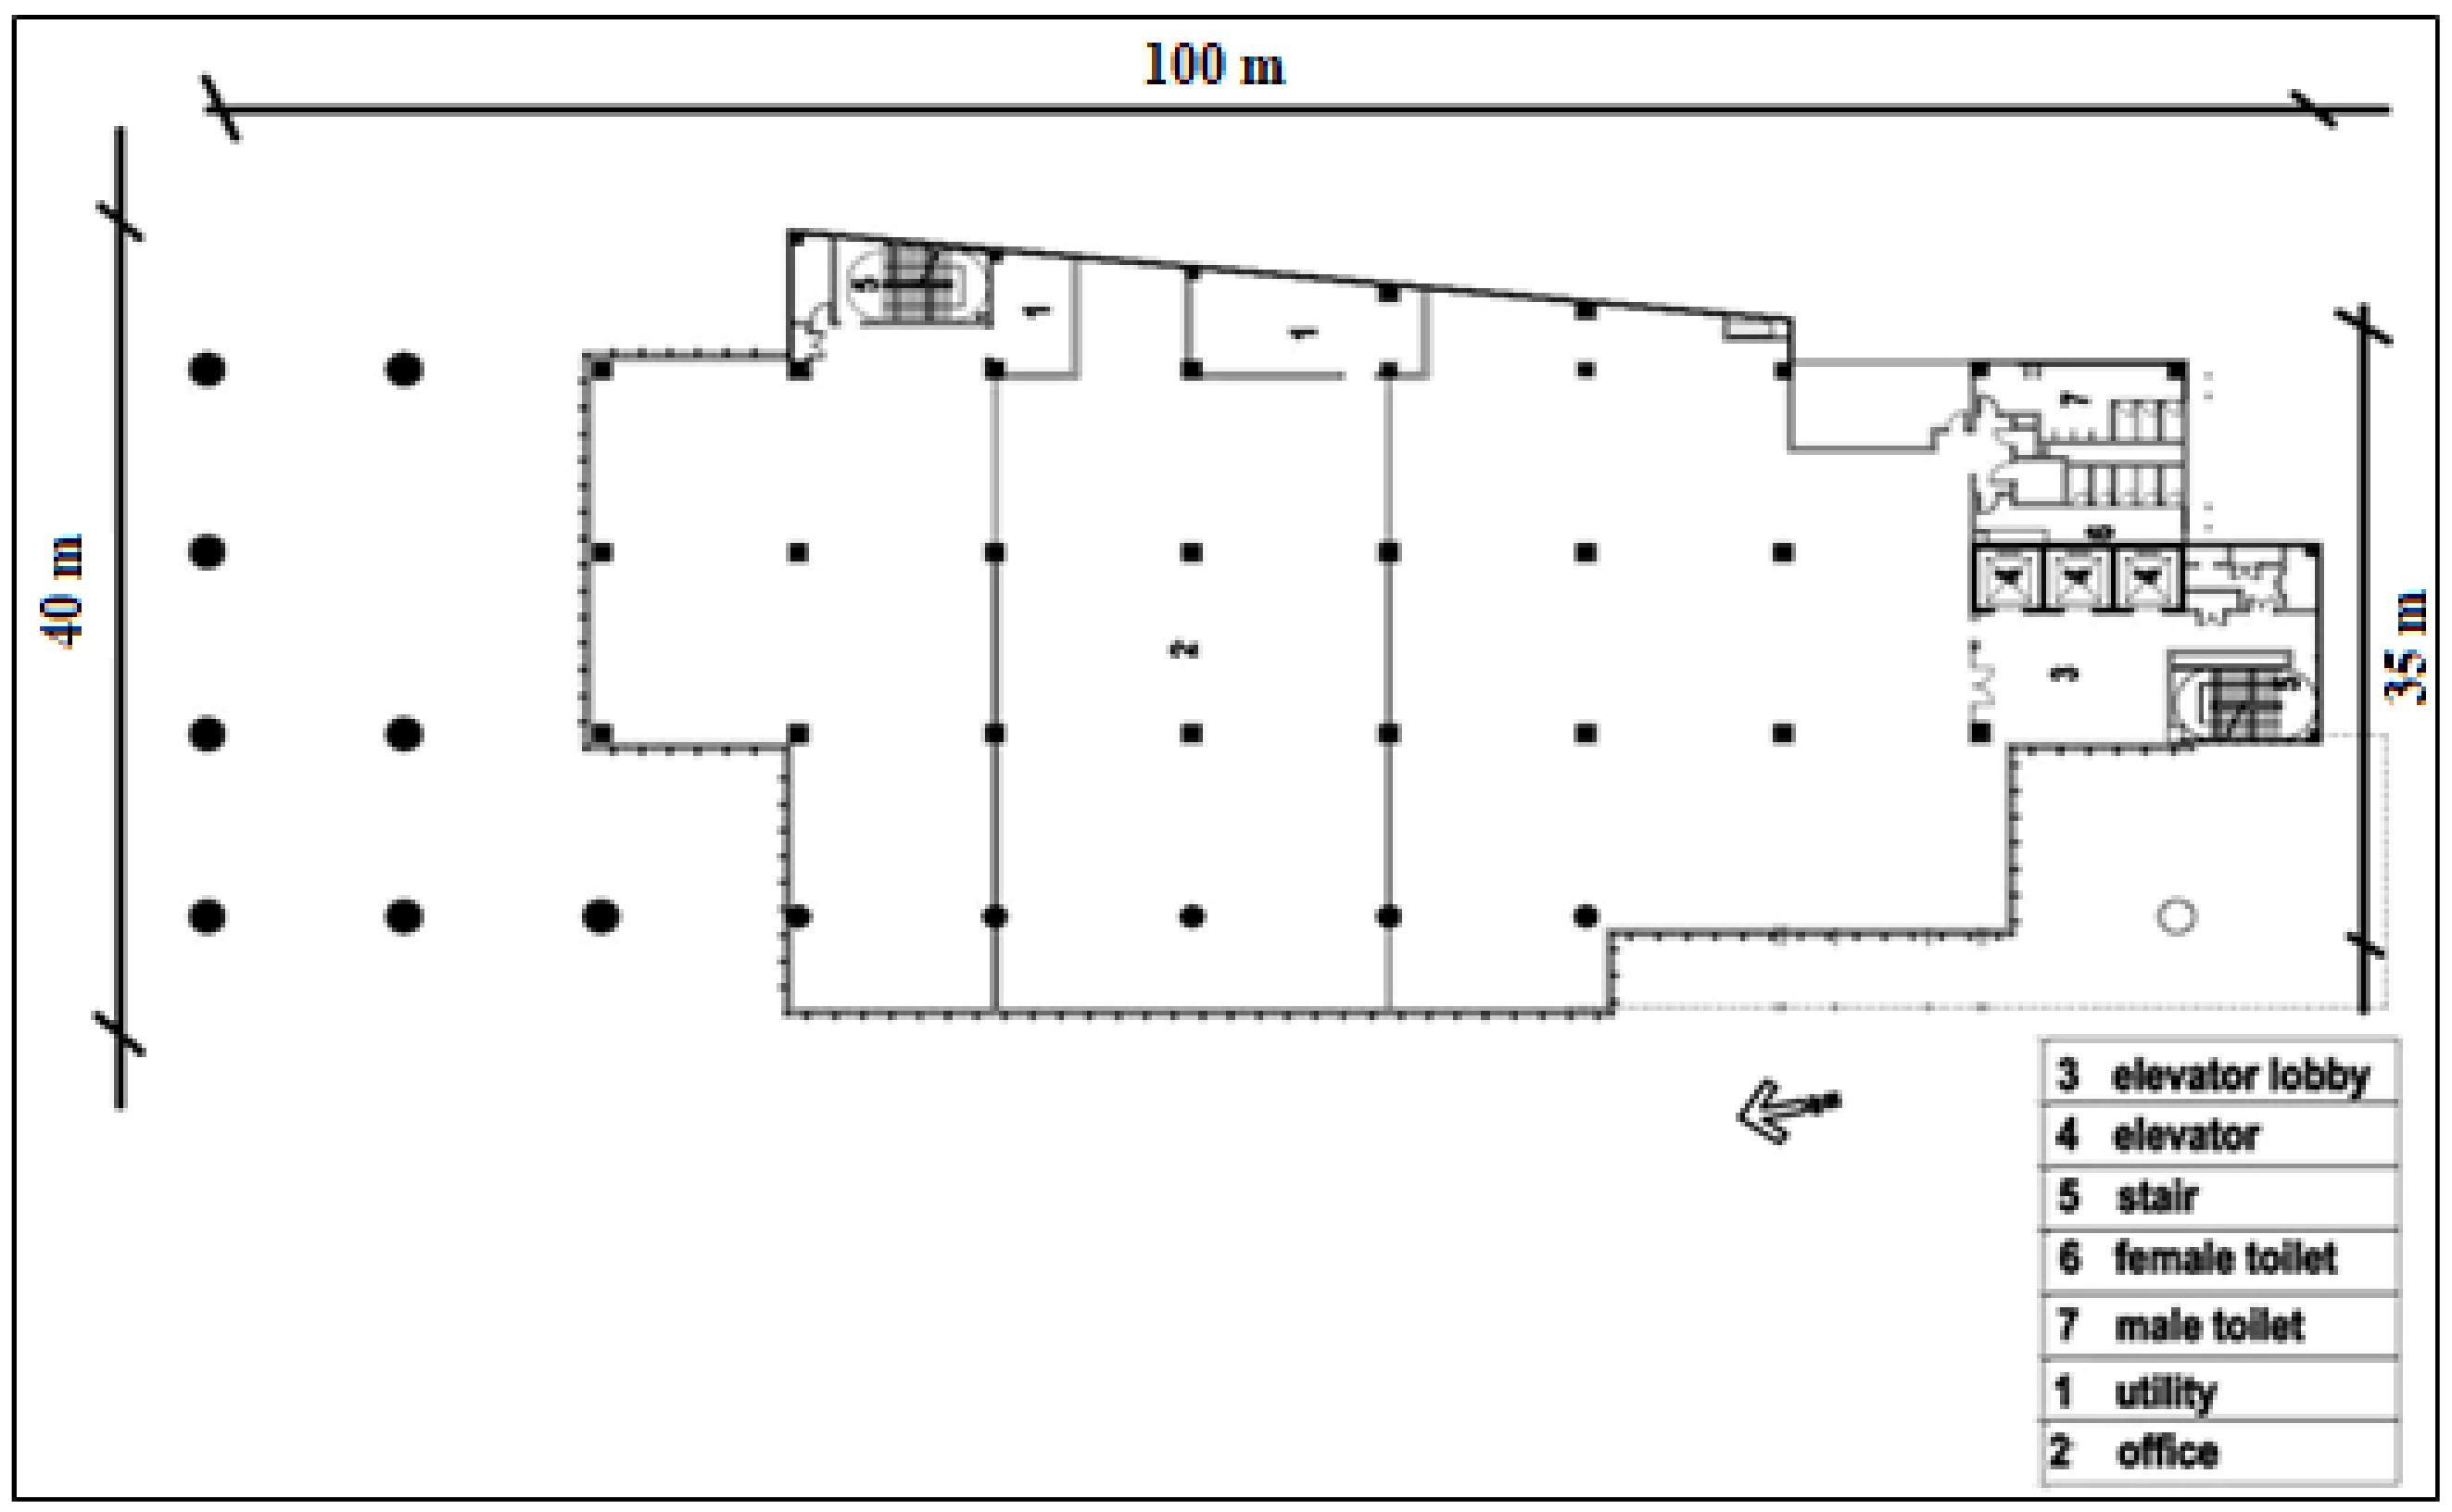
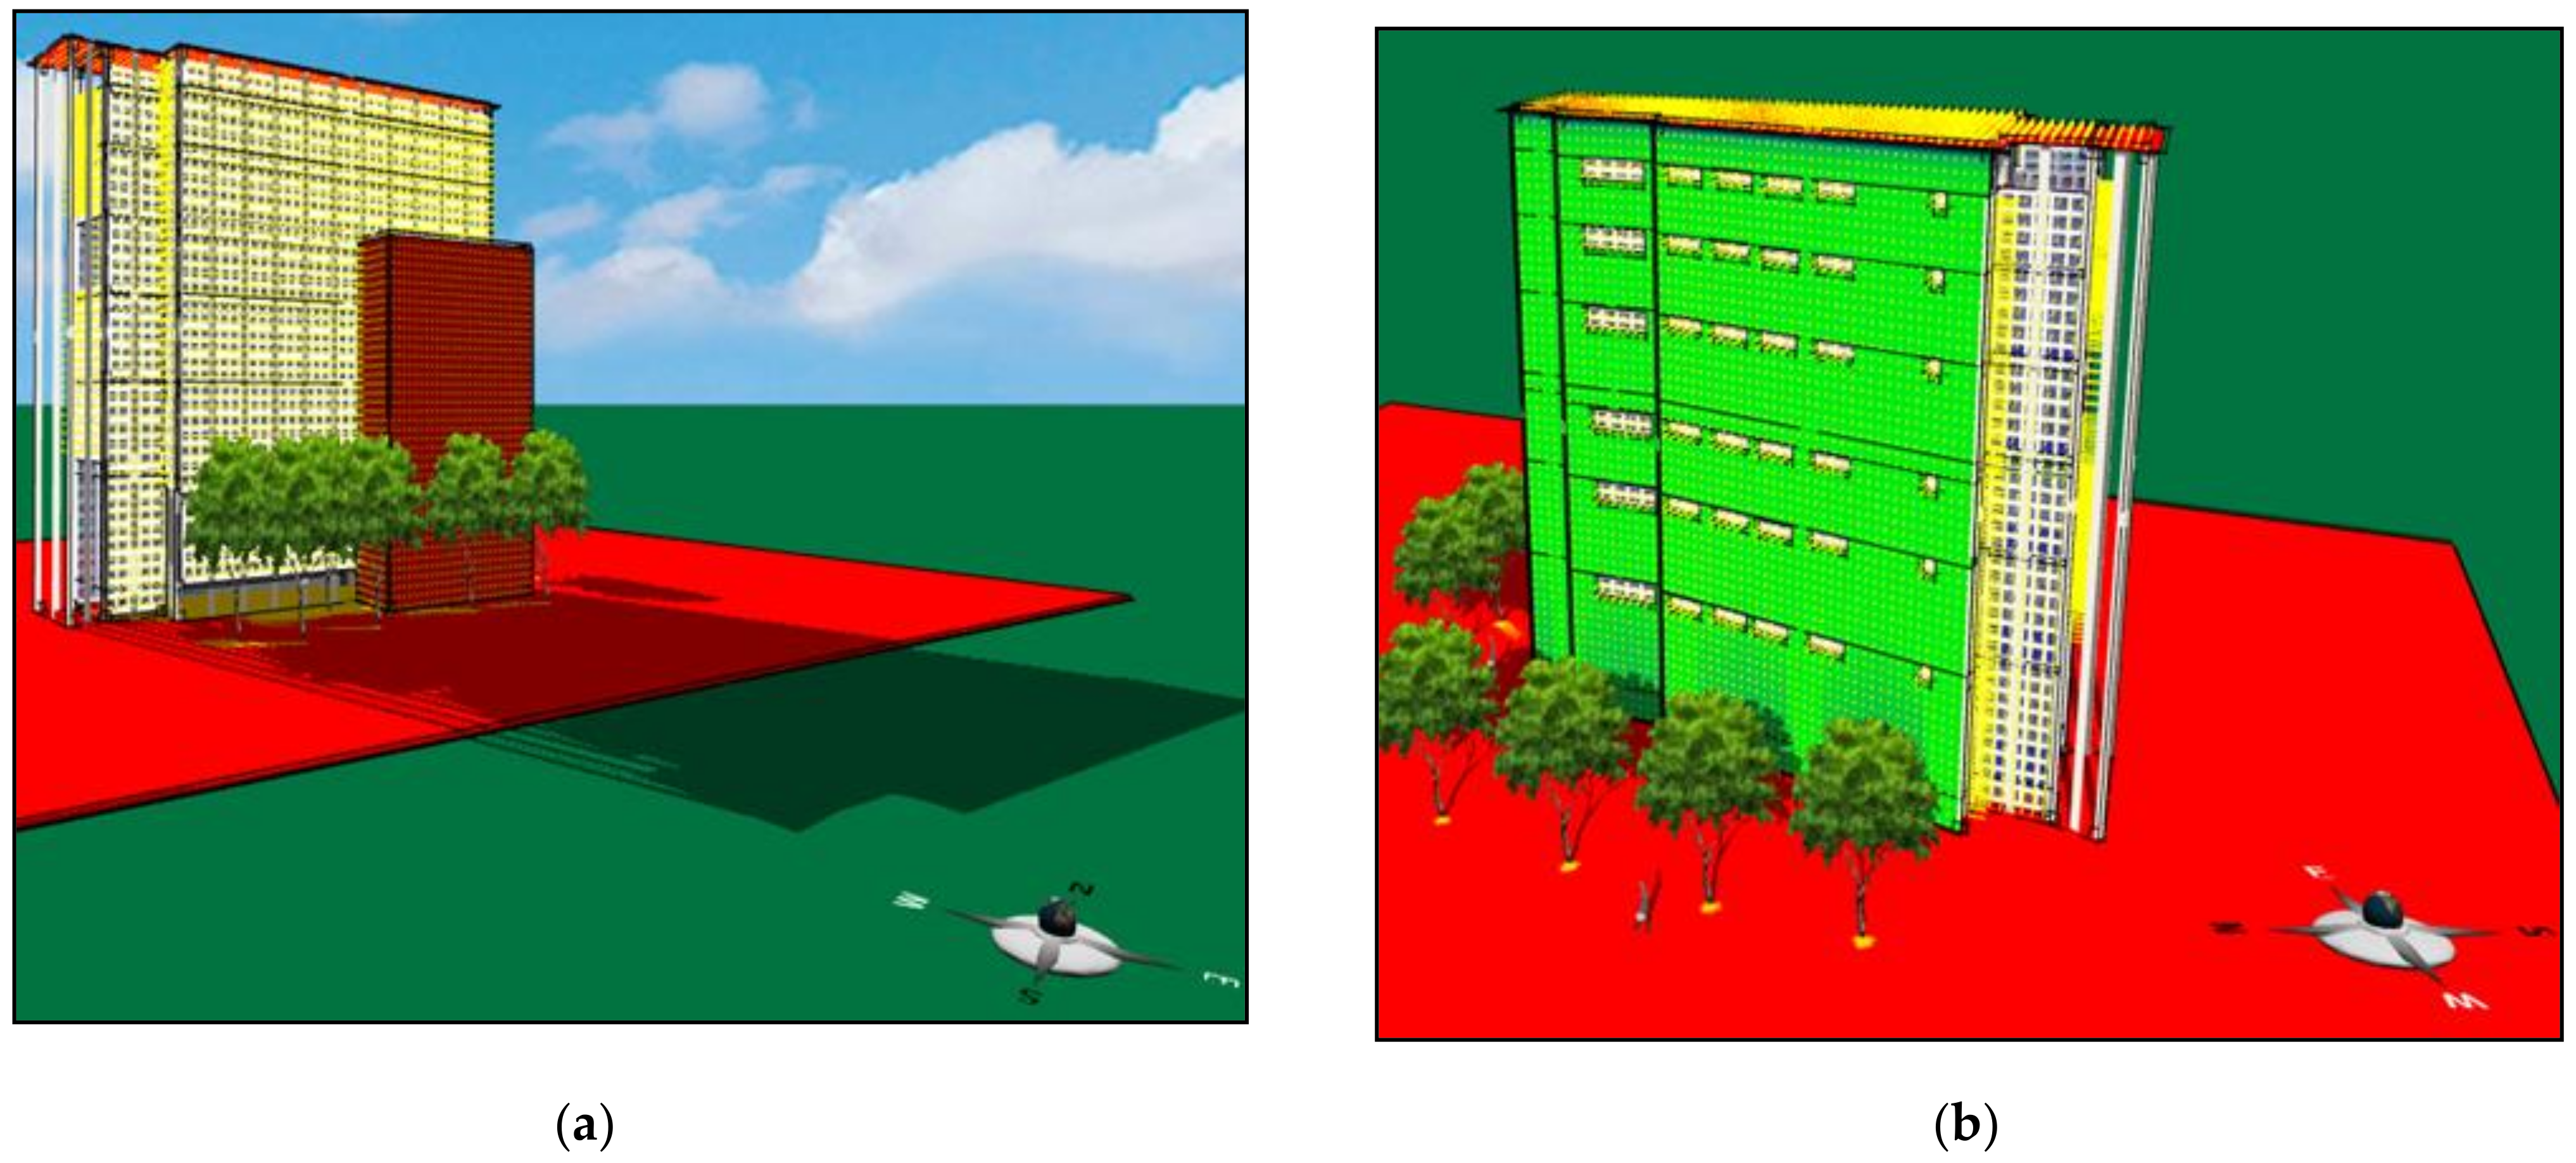
2.1. Office Building Characteristics
2.2. Thermal Quality Monitoring
2.2.1. Full-Scale Measurement
2.2.2. Occupant’s Survey
2.3. Fanger’s PMV-PPD
2.4. Cooling Power Calculation
2.4.1. Governing Equations for Cooling Load (Q)
2.4.2. Governing Equations for Total Heat Transfer Coefficient (U-Value), Time Lag (φ), and Decrement Factor (f)
2.5. Data Analysis
- Full-scale measurement: a daily average chart was depicted. The minimum, maximum and average and variance of each variable were identified. Charts were drafted in a line and box–whisker plot with Microsoft Excel. Explanatory information obtained in this step was used as input for Fanger’s PMV-PPD model and energy usage calculation.
- Statistical analysis: statistical package for social science (SPSS)-IBM SPSS statistics 24- was employed to perform descriptive, frequency, one-way ANOVA, and regression.
- Cooling load design: the heat transfer through the building envelope was simulated using Energy 3D. The transient heat transfer equations were applied in Python to calculate time lag and decrement factor.
3. Results and Discussion
3.1. Objective Measurement
3.1.1. Air Temperature
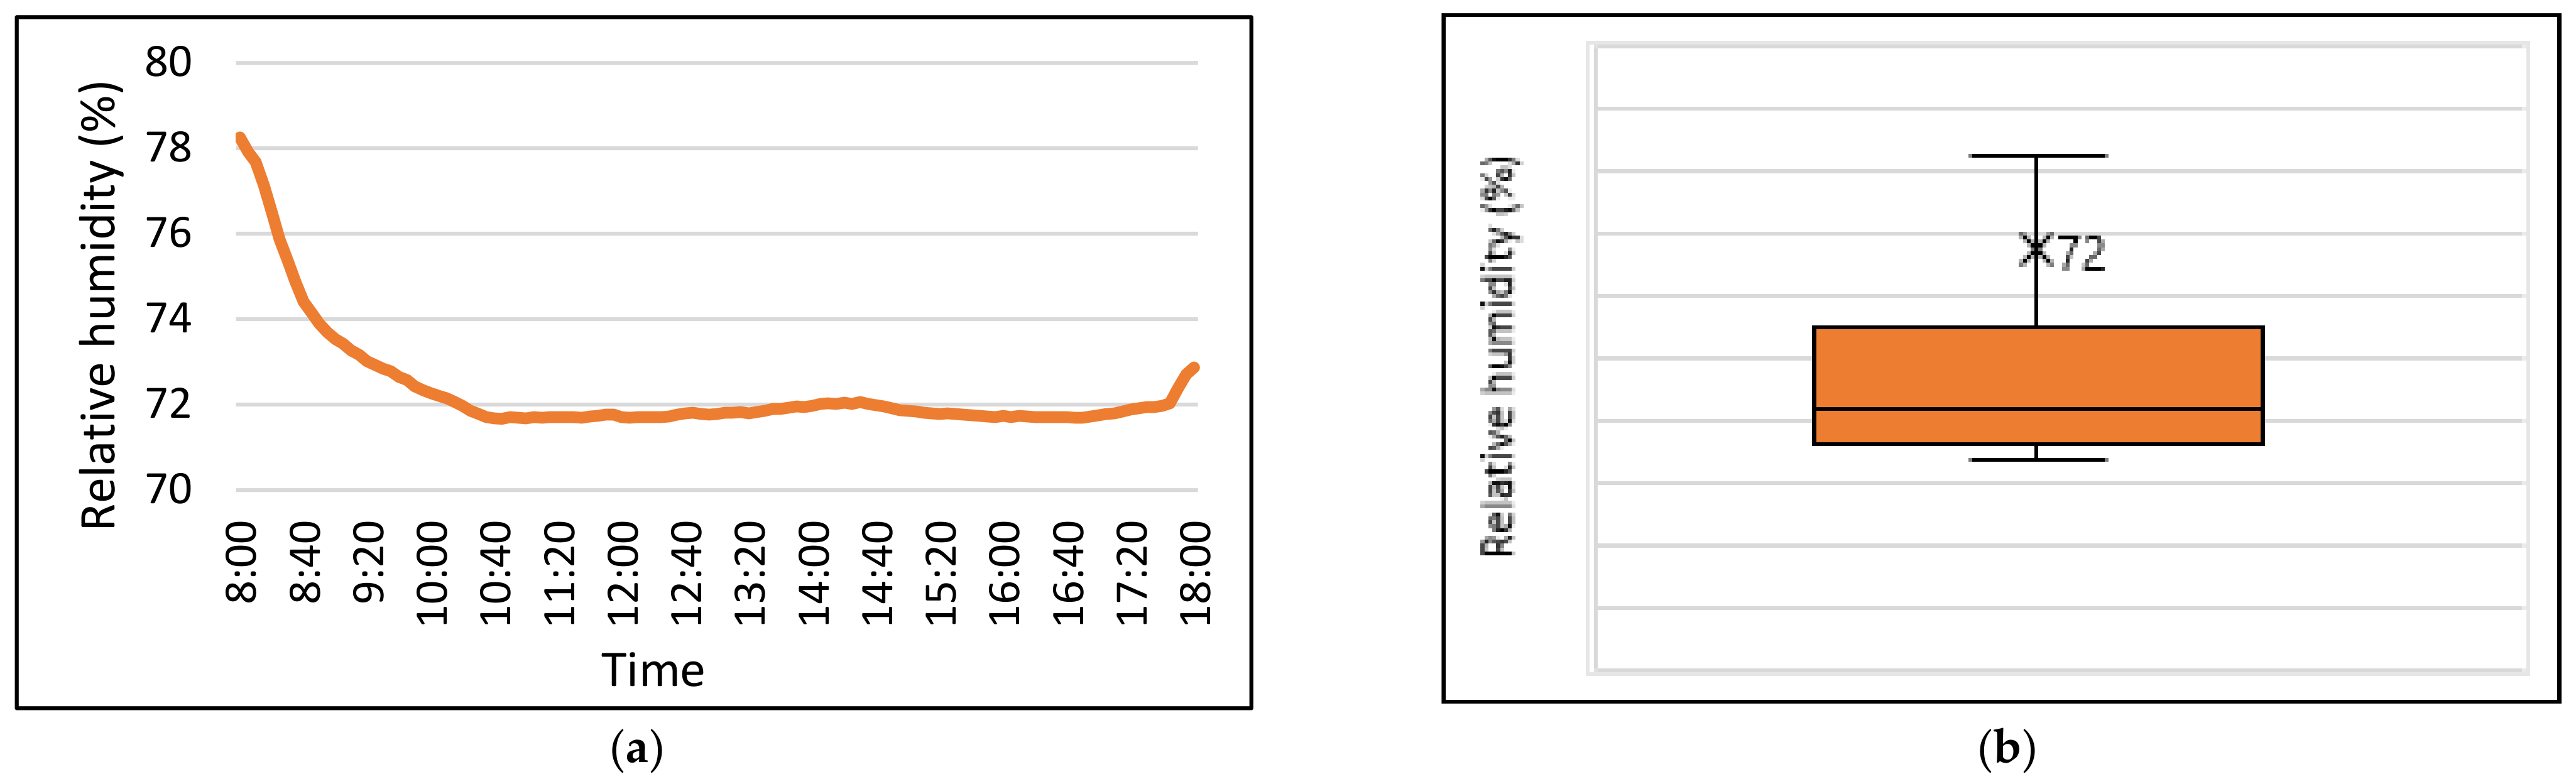
3.1.2. Relative Humidity
3.1.3. Air Velocity
3.2. Subjective Measurement
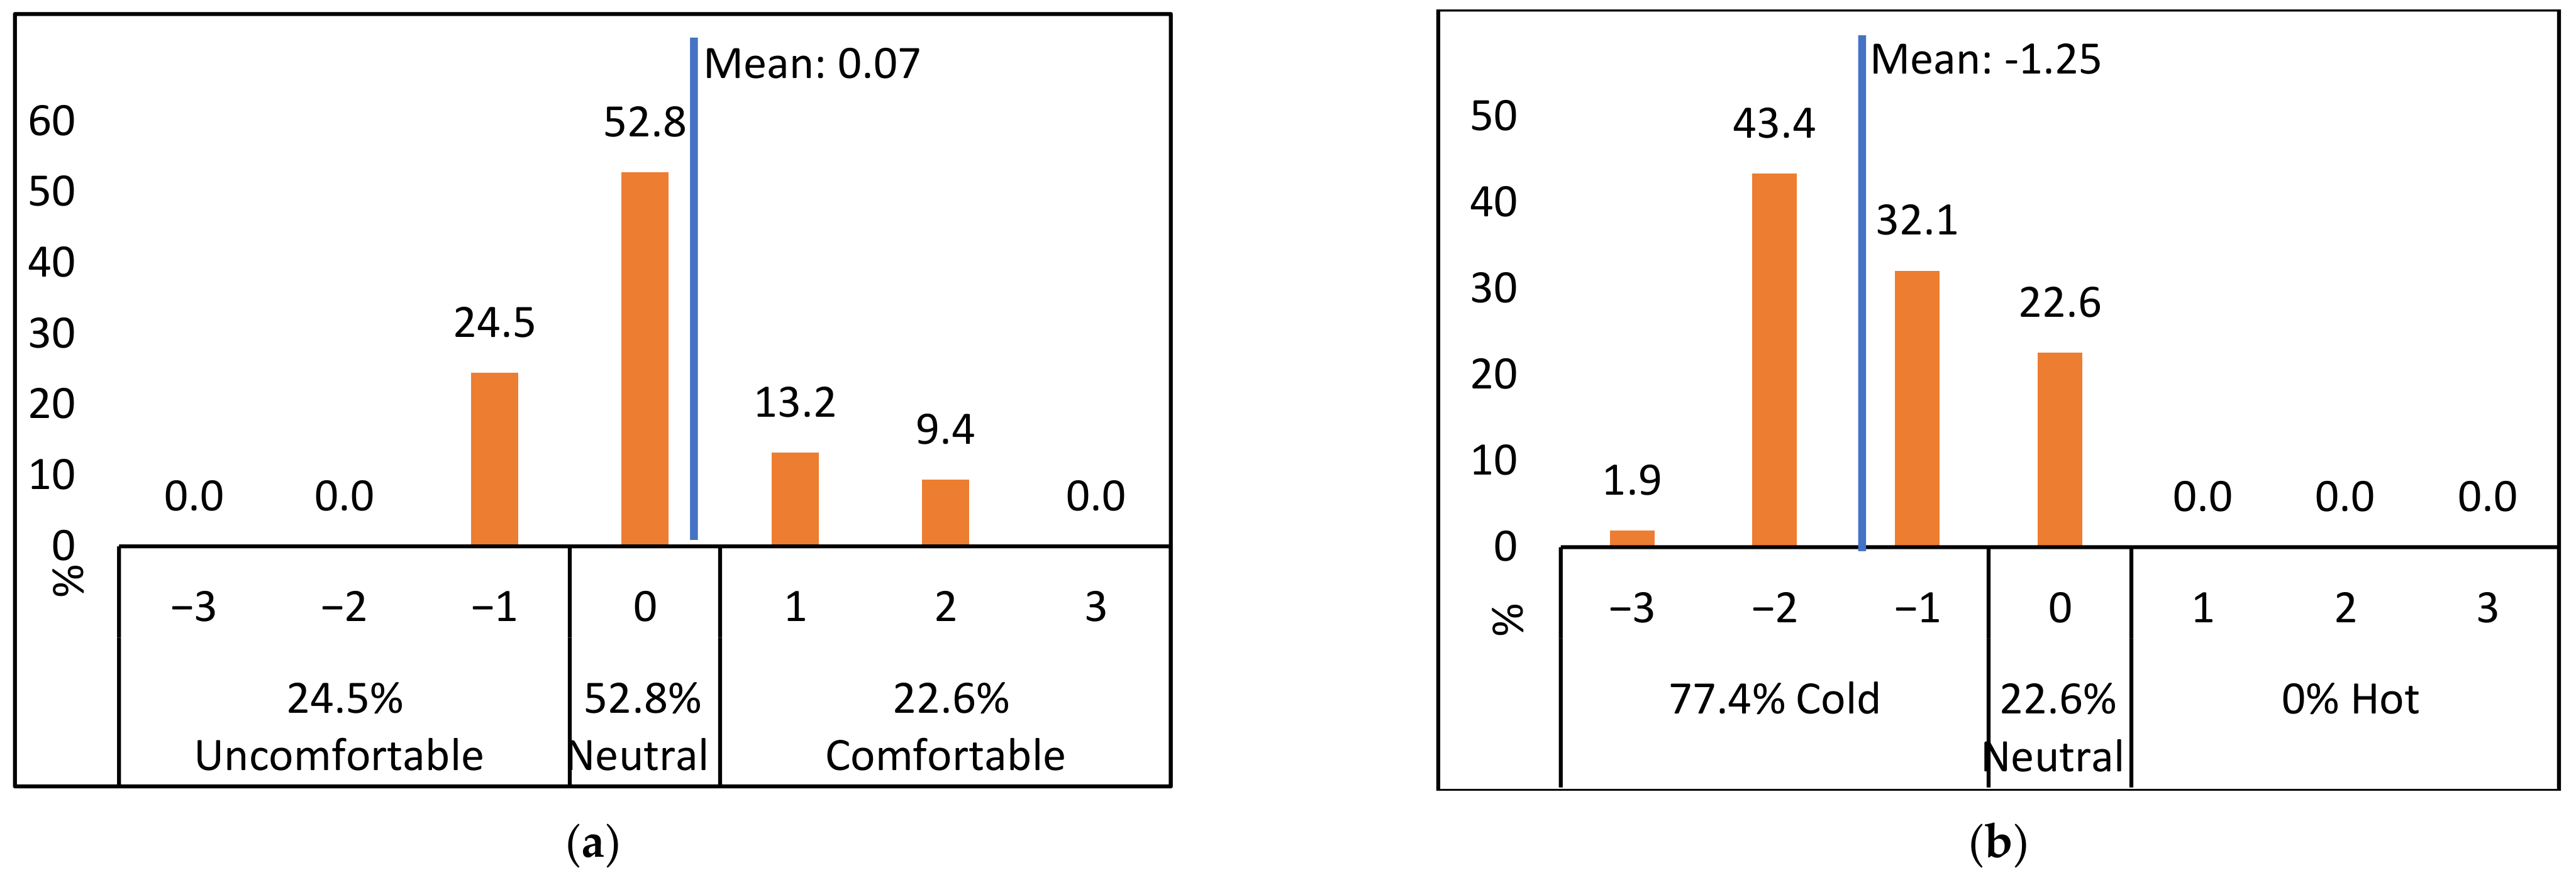
3.2.1. Thermal Sensation Analysis
3.2.2. Thermal Analysis Based on Occupant Characteristics
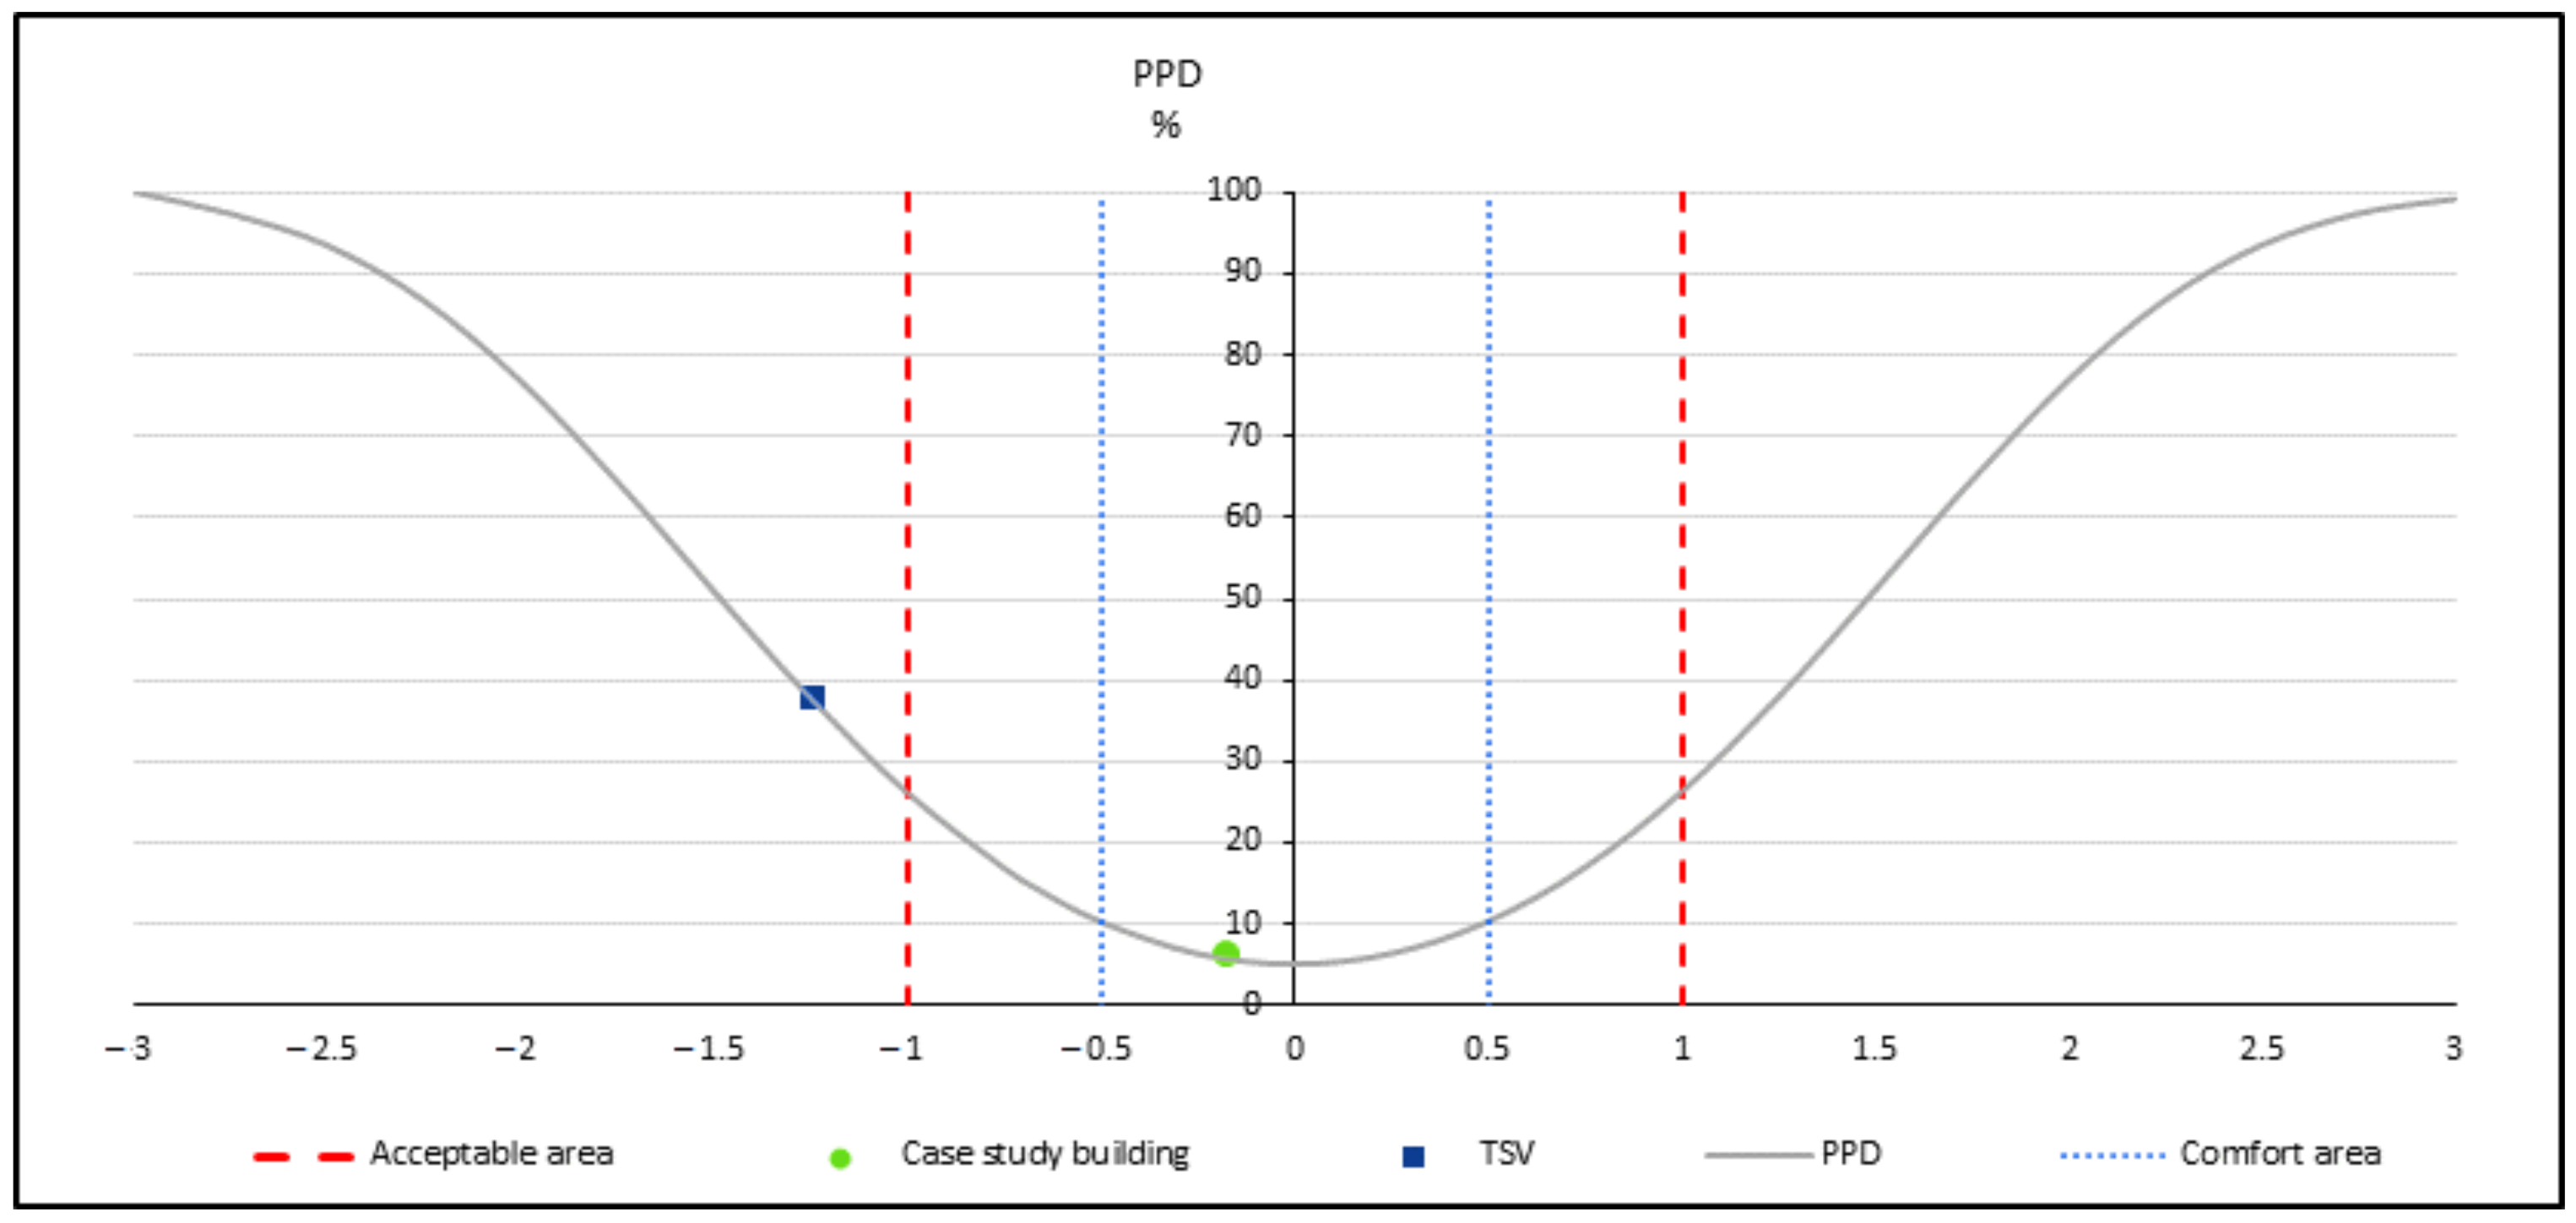
3.2.3. PMV and TSV
3.3. Temperature (Topt) Optimization
4. Conclusions
Author Contributions
Funding
Institutional Review Board Statement
Informed Consent Statement
Data Availability Statement
Conflicts of Interest
References
- Che, W.W.; Tso, C.Y.; Sun, L.; Ip, D.Y.K.; Lee, H.; Chao, C.Y.H.; Lau, A.K.H. Energy consumption, indoor thermal comfort and air quality in a commercial office with retrofitted heat, ventilation and air conditioning (HVAC) system. Energy Build. 2019, 201, 202–215. [Google Scholar] [CrossRef]
- Kwong, Q.J.; Adam, N.M.; Sahari, B.B. Thermal comfort assessment and potential for energy efficiency enhancement in modern tropical buildings: A review. Energy Build. 2014, 68, 547–557. [Google Scholar] [CrossRef]
- Liang, H.-H.; Chen, C.-P.; Hwuang, R.-L.; Shih, W.-M.; Lo, S.-C.; Liao, H.-Y. Satisfaction of occupants toward indoor environment quality of certified green office buildings in Taiwan. Build. Environ. 2014, 72, 232–242. [Google Scholar] [CrossRef]
- Catalina, T.; Iordache, V. IEQ assessment on schools in the design stage. Build. Environ. 2012, 49, 129–140. [Google Scholar] [CrossRef]
- Corgnati, S.P.; Ansaldi, R.; Filippi, M. Thermal comfort in Italian classrooms under free running conditions during mid seasons: Assessment through objective and subjective approaches. Build. Environ. 2009, 44, 785–792. [Google Scholar] [CrossRef]
- Aflaki, A.; Mahyuddin, N.; Mahmoud, Z.A.-C.; Baharum, M.R. A review on natural ventilation applications through building façade components and ventilation openings in tropical climates. Energy Build. 2015, 101, 153–162. [Google Scholar] [CrossRef]
- Moosavi, L.; Mahyuddin, N.; Ab Ghafar, N.; Azzam Ismail, M. Thermal performance of atria: An overview of natural ventilation effective designs. Renew. Sustain. Energy Rev. 2014, 34, 654–670. [Google Scholar] [CrossRef] [Green Version]
- Papadopoulos, A.M.; Oxizidis, S.; Papandritsas, G. Energy, economic and environmental performance of heating systems in Greek buildings. Energy Build. 2008, 40, 224–230. [Google Scholar] [CrossRef]
- Hoyt, T.; Lee, K.H.; Zhang, H.; Arens, E.; Webster, T. Energy Savings from Extended Air Temperature Setpoints and Reductions in Room Air Mixing; Center for the Built Environment, UC Berkeley: Berkeley, CA, USA, 2005. [Google Scholar]
- PTM. Pusat Tenaga Malaysia. Available online: https://www.greentechmalaysia.my/about/green-energy-office/ (accessed on 21 September 2020).
- MS 1525. Energy Efficiency and Use of Renewable Energy for Non-Residential Buildings-Code of Practice; Malaysian Standard: Kuala Lumpur, Malaysia, 2019. [Google Scholar]
- Hwang, R.-L.; Lin, T.-P.; Kuo, N.-J. Field experiments on thermal comfort in campus classrooms in Taiwan. Energy Build. 2006, 38, 53–62. [Google Scholar] [CrossRef]
- ISO 7730. Ergonomics of the thermal environment—Analytical determination and interpretation of thermal comfort using calculation of the PMV and PPD indices and local thermal comfort criteria. Management 2005, 3, e615. [Google Scholar]
- EN 16798-1:2019. Energy Performance of Buildings—Ventilation for Buildings—Part 1: Indoor Environmental Input Parameters for Design and Assessment of Energy Performance of Buildings Addressing Indoor Air Quality, Thermal Environment, Lighting and Acoustics—Module M1-6; European Standardization Organizations: Brussels, Belgium, 2019. [Google Scholar]
- ASHRAE Standard 55. Standard 55, Thermal Environmental Conditions for Human Occupancy; ASHRAE Inc.: Atlanta, GA, USA, 2017. [Google Scholar]
- Fanger, P.O. Thermal Comfort. Analysis and Applications in Environmental Engineering; Danish Technical Press: Copenhagen, Denmark, 1970. [Google Scholar]
- Nicol, F. Adaptive thermal comfort standards in the hot–humid tropics. Energy Build. 2004, 36, 628–637. [Google Scholar] [CrossRef]
- ISO. International Standard 7730, Moderate Thermal Environments: Determination of PMV and PPD Indices and Specification of the Conditions for Thermal Comfort; ISO: Geneva, Switzerland, 1994. [Google Scholar]
- Damiati, S.A.; Zaki, S.A.; Rijal, H.B.; Wonorahardjo, S. Field study on adaptive thermal comfort in office buildings in Malaysia, Indonesia, Singapore, and Japan during hot and humid season. Build. Environ. 2016, 109, 208–223. [Google Scholar] [CrossRef]
- Singh, M.K.; Mahapatra, S.; Atreya, S.K. Adaptive thermal comfort model for different climatic zones of North-East India. Appl. Energy 2011, 88, 2420–2428. [Google Scholar] [CrossRef]
- Zhang, Y.; Wang, J.; Chen, H.; Zhang, J.; Meng, Q. Thermal comfort in naturally ventilated buildings in hot-humid area of China. Build. Environ. 2010, 45, 2562–2570. [Google Scholar] [CrossRef]
- Rupp, R.F.; Vásquez, N.G.; Lamberts, R. A review of human thermal comfort in the built environment. Energy Build. 2015, 105, 178–205. [Google Scholar] [CrossRef]
- Maykot, J.K.; Rupp, R.F.; Ghisi, E. Assessment of gender on requirements for thermal comfort in office buildings located in the Brazilian humid subtropical climate. Energy Build. 2018, 158, 1170–1183. [Google Scholar] [CrossRef]
- Lovins, A. Air-Conditioning Comfort: Behavioral and Cultural Issues; E Source, Inc.: Boulder, CO, USA, 1992. [Google Scholar]
- Jamaludin, N.; Mohammed, N.I.; Khamidi, M.F.; Wahab, S.N.A. Thermal Comfort of Residential Building in Malaysia at Different Micro-climates. Procedia-Soc. Behav. Sci. 2015, 170, 613–623. [Google Scholar] [CrossRef] [Green Version]
- Asadi, I.; Hussein, I.; Palanisamy, K. Analysis on thermal comfort of air-conditioned buildings in Malaysia: Case study of Universiti Tenaga Nasional. In Applied Mechanics and Materials; Trans Tech Publications Ltd.: Bäch, Switzerland, 2014; pp. 1665–1669. [Google Scholar]
- Yau, Y.H.; Chew, B.T.; Saifullah, A.Z.A. A Field Study on Thermal Comfort of Occupants and Acceptable Neutral Temperature at the National Museum in Malaysia. Indoor Built Environ. 2011, 22, 433–444. [Google Scholar] [CrossRef]
- Ahmad, S.; Szokolay, S. The performance of a partially air conditioned apartment building in Kuala Lumpur. In Proceedings of the 24th International Conference on Passive and Low Energy Architecture, PLEA 2007, Singapore, 22–24 November 2007; pp. 225–231. [Google Scholar]
- Mahlia, T.M.I.; Taufiq, B.N.; Ismail; Masjuki, H.H. Correlation between thermal conductivity and the thickness of selected insulation materials for building wall. Energy Build. 2007, 39, 182–187. [Google Scholar] [CrossRef]
- Esfandiari, M.; Mohamed Zaid, S.; Ismail, M.A.; Reza Hafezi, M.; Asadi, I.; Mohammadi, S.; Vaisi, S.; Aflaki, A. Occupants’ Satisfaction toward Indoor Environment Quality of Platinum Green-Certified Office Buildings in Tropical Climate. Energies 2021, 14, 2264. [Google Scholar] [CrossRef]
- Federspiel, C.C.; Bridges, B.; Langkilde, G. Statistical analysis of unsolicited thermal sensation complaints in commercial buildings/Discussion. ASHRAE Trans. 1998, 104, 912. [Google Scholar]
- Bansal, K.; Chowdhury, S.; Gopal, M.R. Development of CLTD values for buildings located in Kolkata, India. Appl. Therm. Eng. 2008, 28, 1127–1137. [Google Scholar] [CrossRef]
- Yumrutaş, R.; Kaşka, Ö.; Yıldırım, E. Estimation of total equivalent temperature difference values for multilayer walls and flat roofs by using periodic solution. Build. Environ. 2007, 42, 1878–1885. [Google Scholar] [CrossRef]
- Dlimi, M.; Iken, O.; Agounoun, R.; Zoubir, A.; Kadiri, I.; Sbai, K. Energy performance and thickness optimization of hemp wool insulation and air cavity layers integrated in Moroccan building walls’. Sustain. Prod. Consum. 2019, 20, 273–288. [Google Scholar] [CrossRef]
- Mazzeo, D.; Oliveti, G.; Arcuri, N. Influence of internal and external boundary conditions on the decrement factor and time lag heat flux of building walls in steady periodic regime. Appl. Energy 2016, 164, 509–531. [Google Scholar] [CrossRef]
- Ozel, M. Thermal, economical and environmental analysis of insulated building walls in a cold climate. Energy Convers. Manag. 2013, 76, 674–684. [Google Scholar] [CrossRef]
- GBI. GBI AssesSment Criteria for NON-RESIDENTIAL NEW CONSTRUCTION (NRNC); GBI: Kuala Lumpur, Malaysia, 2009. [Google Scholar]
- Kothari, C.R. Research Methodology: Methods and Techniques; New Age International: New Delhi, India, 2008. [Google Scholar]
- Zhang, C.; Pomianowski, M.; Heiselberg, P.K.; Yu, T. A review of integrated radiant heating/cooling with ventilation systems—Thermal comfort and indoor air quality. Energy Build. 2020, 223, 110094. [Google Scholar] [CrossRef]
- Marcel, L.; Katharina, S.; Wilfried, R.E. Indoor heat stress: An assessment of human bioclimate using the UTCI in different buildings in Berlin. ERDE J. Geogr. Soc. Berl. 2014, 144, 260–273. [Google Scholar] [CrossRef]
- Kántor, N.; Unger, J. The most problematic variable in the course of human-biometeorological comfort assessment—The mean radiant temperature. Cent. Eur. J. Geosci. 2011, 3, 90–100. [Google Scholar] [CrossRef] [Green Version]
- Matzarakis, A.; Amelung, B. Physiological equivalent temperature as indicator for impacts of climate change on thermal comfort of humans. In Seasonal Forecasts, Climatic Change and Human Health; Springer: Berlin/Heidelberg, Germany, 2008; pp. 161–172. [Google Scholar]
- ISO 16000-1. Indoor Air–Part 1: General Aspects of Sampling Strategy; International Organization for Standardization: Geneva, Switzerland, 2007. [Google Scholar]
- Ilesanmi, O.A. Post-occupancy evaluation and residents’ satisfaction with public housing in Lagos, Nigeria. J. Build. Apprais. 2010, 6, 153–169. [Google Scholar] [CrossRef] [Green Version]
- Seppänen, O.A.; Fisk, W. Some Quantitative Relations between Indoor Environmental Quality and Work Performance or Health. HVACR Res. 2006, 12, 957–973. [Google Scholar] [CrossRef] [Green Version]
- Preiser, W.F.E.; Vischer, J.C. Assessing Building Performance; Routledge: London, UK, 2006. [Google Scholar]
- Cochran, W.G. Sampling Techniques; Wiley: Hoboken, NJ, USA, 1977. [Google Scholar]
- Asadi, I.; Shafigh, P.; Mahyuddin, N.B.; Akbari, H. Determination of optimum insulation and cement plaster thickness for bungalow buildings through a simulation-statistical approach using response surface methodology. J. Des. Built Environ. 2019, 19, 48–63. [Google Scholar] [CrossRef]
- Mirrahimi, S.; Mohamed, M.F.; Haw, L.C.; Ibrahim, N.L.N.; Yusoff, W.F.M.; Aflaki, A. The effect of building envelope on the thermal comfort and energy saving for high-rise buildings in hot–humid climate. Renew. Sustain. Energy Rev. 2016, 53, 1508–1519. [Google Scholar] [CrossRef]
- METEONORM v. 7. Global Meteorological Database for Applied Climatology; Meteotest: Bern, Switzerland, 2017. [Google Scholar]
- Yumrutaş, R.; Ünsal, M.; Kanoğlu, M. Periodic solution of transient heat flow through multilayer walls and flat roofs by complex finite Fourier transform technique. Build. Environ. 2005, 40, 1117–1125. [Google Scholar] [CrossRef]
- Oktay, H.; Yumrutaş, R.; Işik, M.Z. Comparison of Cltd and Tetd Cooling Load Calculation Methods for Different Building Envelopes. Mugla J. Sci. Technol. 2020, 6, 18–26. [Google Scholar] [CrossRef]
- ISO 13786. Thermal Performance of Building Components–Dynamic Thermal Characteristics–Calculation Methods; European Committee for Standardization: Brussels, Belgium, 1999. [Google Scholar]
- ISO 6946. Building Components and Building Elements—Thermal Resistance and Thermal Transmittance—Calculation Method; Committee for Standardization: London, UK, 2007. [Google Scholar]
- Wolkoff, P.; Azuma, K.; Carrer, P. Health, work performance, and risk of infection in office-like environments: The role of indoor temperature, air humidity, and ventilation. Int. J. Hyg. Environ. Health 2021, 233, 113709. [Google Scholar] [CrossRef]
- Yin, H.; Zhong, Y.; Wang, H.; Hu, J.; Xia, S.; Xiao, Y.; Nie, S.; Xie, M. Short-term exposure to high relative humidity increases blood urea and influences colonic urea-nitrogen metabolism by altering the gut microbiota. J. Adv. Res. 2021. [Google Scholar] [CrossRef]
- Lechner, N. Heating, Cooling, Lighting: Sustainable Design Methods for Architects; John Wiley & Sons: Hoboken, NJ, USA, 2014. [Google Scholar]
- Khovalyg, D.; Kazanci, O.B.; Halvorsen, H.; Gundlach, I.; Bahnfleth, W.P.; Toftum, J.; Olesen, B.W. Critical review of standards for indoor thermal environment and air quality. Energy Build. 2020, 213, 109819. [Google Scholar] [CrossRef]
- Kiki, G.; Kouchadé, C.; Houngan, A.; Zannou-Tchoko, S.J.; André, P. Evaluation of thermal comfort in an office building in the humid tropical climate of Benin. Build. Environ. 2020, 185, 107277. [Google Scholar] [CrossRef]
- Alotaibi, B.S.; Lo, S.; Southwood, E.; Coley, D. Evaluating the suitability of standard thermal comfort approaches for hospital patients in air-conditioned environments in hot climates. Build. Environ. 2020, 169, 106561. [Google Scholar] [CrossRef]
- Wang, H.; Sun, L.; Guan, H.; Hu, S. Thermal environment investigation and analysis on thermal adaptation of workers in a rubber factory. Energy Build. 2018, 158, 1625–1631. [Google Scholar] [CrossRef]
- Wu, T.; Cao, B.; Zhu, Y. A field study on thermal comfort and air-conditioning energy use in an office building in Guangzhou. Energy Build. 2018, 168, 428–437. [Google Scholar] [CrossRef]
- Maiti, R. PMV model is insufficient to capture subjective thermal response from Indians. Int. J. Ind. Ergon. 2014, 44, 349–361. [Google Scholar] [CrossRef]
- Yau, Y.; Chew, B. A review on predicted mean vote and adaptive thermal comfort models. Build. Serv. Eng. Res. Technol. 2014, 35, 23–35. [Google Scholar] [CrossRef]
- Croome, D.; Gan, G.; Awbi, H. Thermal comfort and air quality in offices. Indoor Air 1993, 93, 37–42. [Google Scholar]
- Howell, W.C.; Kennedy, P.A. Field validation of the Fanger thermal comfort model. Hum. Factors 1979, 21, 229–239. [Google Scholar] [CrossRef]
- Mohammadi, S.; de Vries, B.; Rafiee, A.; Esfandiari, M.; Dias, E. An exploratory study on the impact of physical and geospatial characteristics of the urban built environment on the buildings annual electricity usage. J. Build. Eng. 2021, 40, 102359. [Google Scholar] [CrossRef]
- Doherty, T.; Arens, E.A. Evaluation of the physiological bases of thermal comfort models. ASHRAE Trans. 1988, 94, 1371–1385. [Google Scholar]
- Koelblen, B.; Psikuta, A.; Bogdan, A.; Annaheim, S.; Rossi, R.M. Thermal sensation models: A systematic comparison. Indoor Air 2017, 27, 680–689. [Google Scholar] [CrossRef]
- Peeters, L.; de Dear, R.; Hensen, J.; D’haeseleer, W. Thermal comfort in residential buildings: Comfort values and scales for building energy simulation. Appl. Energy 2009, 86, 772–780. [Google Scholar] [CrossRef] [Green Version]
- Holmes, M.J.; Hacker, J.N. Climate change, thermal comfort and energy: Meeting the design challenges of the 21st century. Energy Build. 2007, 39, 802–814. [Google Scholar] [CrossRef]
- ASHRAE. ASHRAE Handbook—Fundamentals; American Society of Heating, Refrigerating and Air-Conditioning Engineers—ASHRAE: Atlanta, GA, USA, 2009. [Google Scholar]
- Walikewitz, N.; Jänicke, B.; Langner, M.; Meier, F.; Endlicher, W. The difference between the mean radiant temperature and the air temperature within indoor environments: A case study during summer conditions. Build. Environ. 2015, 84, 151–161. [Google Scholar] [CrossRef]
- Li, D.; Menassa, C.C.; Kamat, V.R.; Byon, E. HEAT-Human Embodied Autonomous Thermostat. Build. Environ. 2020, 178, 106879. [Google Scholar] [CrossRef]
- Aynsley, R. Low energy architecture for humid tropical climates. In Proceedings of the World Renewable Energy Congress, Kuala Lumpur, Malaysia, 8–11 June 1999; pp. 333–339. [Google Scholar]
- De Dear, R.J.; Brager, G.S. Thermal comfort in naturally ventilated buildings: Revisions to ASHRAE Standard 55. Energy Build. 2002, 34, 549–561. [Google Scholar] [CrossRef] [Green Version]
- Karyono, T.H. Report on thermal comfort and building energy studies in Jakarta—Indonesia. Build. Environ. 2000, 35, 77–90. [Google Scholar] [CrossRef]


| Characteristics | Details |
|---|---|
| Occupant possession | 2014 |
| No. story | 9 |
| Gross floor area | 33,798 m2 |
| Net floor area | 14,087 m2 |
| Structure | Steel reinforced concrete (SRC) |
| Façade finishing | Double glass curtain wall |
| Access to public transport | Bus |
| Air conditioning system | Underfloor Air Distribution (UAFD) |
| Underfloor vents | Yes |
| Floor/roof radiant cooling | No |
| Adjustable vents | Yes |
| Operable windows | No |
| Lighting type | Fluorescent, Personal LED |
| Window blind, roller shade, fixed shading system | Yes |
| Window to wall ratio (WWR) | About 55% |
| Exterior shades | No |
| Interior separators | Medium-density fibreboard (MDF), and Glass |
| Atrium | No |
| Courtyard | Yes |
| Occupants’ capacity | 250 |
| Employees/occupants | 60–100 |
| Year of GBI certificate | 2014 |
| IEQ Variable | Environmental Logger | Range and Accuracy |
|---|---|---|
| Air temperature | HOBO-U12-012 a (Manufactured by Onest, data logger) | between −20 to 70 °C, accuracy ±0.35 °C from 0 to 50 °C |
| Relative humidity | between 5% and 95% RH with an accuracy of ±2.5% | |
| Air velocity | T-DCI-F900-S-O a (Connected to HOBO-U12-012 as an external sensor, manufactured by Onest) | Accuracy greater than 10% of the reading or ±0.05 m/s or 1% full scale |
| Category | Question |
|---|---|
| Background information | Age, Sex, Years of working in the building, Type of the working office, Sitting near a window |
| Thermal comfort | Overall Thermal comfort Temperature cold-hot Temperature stable-various Air dry-humid |
| Case Study Building | |||
|---|---|---|---|
| N | % | ||
| Sex | Female | 25 | 47 |
| Male | 28 | 53 | |
| Age | Under 30 | 26 | 49 |
| 30 and above | 27 | 51 | |
| Work experience in building | Less than a year | 20 | 38 |
| A year or more | 33 | 62 | |
| Type of the work office | Normally occupied by 1 | 8 | 15 |
| Shared with 1 other | 0 | 0 | |
| Shared with 2–4 others | 22 | 41 | |
| Shared with 5–8 others | 15 | 29 | |
| Shared with more than 8 others | 8 | 15 | |
| Do you sit next to a window? | Yes | 18 | 34 |
| No | 35 | 66 | |
| Indoor Air Temperature | Outdoor Air Temperature |
|---|---|
| Correlation Coefficient | 0.905 ** |
| p value | 0.000 |
| R2 | 0.967 |
| Building | p Value |
|---|---|
| Case study building | 0.000 * |
| Age | Gender | Type of Office | Near Window | Work Experience in Building | |||||||||
|---|---|---|---|---|---|---|---|---|---|---|---|---|---|
| Under 30 | Above 30 | Male | Female | Private | 2–4 | 5–8 | N > 8 | Yes | No | N < 1 Year | N > 1 Year | ||
| % | 49% | 51% | 53% | 47% | 15% | 41% | 29% | 15% | 34% | 66% | 37% | 63% | |
| Overall thermal | t | −0.613 | −2.334 | F = 3.153 | −0.118 | −0.486 | |||||||
| df | 51 | 51 | 52 | 51 | 51 | ||||||||
| Sig | 0.883 | 0.073 | 0.033 * | 0.150 | 0.08 | ||||||||
| Thermal sensation | t | 0.534 | 0.703 | F = 0.670 | −0.491 | 0.032 | |||||||
| df | 51 | 51 | 52 | 51 | 51 | ||||||||
| Sig | 0.347 | 0.515 | 0.574 | 0.002 * | 0.450 | ||||||||
| Humidity | t | −2.103 | 2.032 | F = 1.891 | 1.099 | 0.935 | |||||||
| df | 51 | 51 | 52 | 51 | 51 | ||||||||
| Sig | 0.213 | 0.544 | 0.143 | 0.517 | 0.616 | ||||||||
| Stability | t | −0.502 | −1.130 | F = 0.125 | 0.485 | 0.226 | |||||||
| df | 51 | 51 | 52 | 51 | 51 | ||||||||
| Sig | 0.481 | 0.059 | 0.945 | 0.592 | 0.359 | ||||||||
| Ta (°C) | Tr (°C) | Rh (%) | Va (m/s) | Me (met) | Cl (Clo) | PMV | TSV | Thermal Sensation | |
|---|---|---|---|---|---|---|---|---|---|
| Case study Building | 23.8 | 23.8 | 72.35 | 0.05 | 1.1 | 0.57 | −0.17 | −1.25 | Neutral |
| Models | Ta (°C) | Tr (°C) | Rh (%) | Va (m/s) | Me (met) | Cl (Clo) | PMV | PPD (%) | Thermal Sensation |
|---|---|---|---|---|---|---|---|---|---|
| Model 0 | 24 | 24 | 72.35 | 0.05 | 1.1 | 0.57 | −0.11 | 6 | Neutral |
| Model 1 | 24.5 | 24.5 | 72.35 | 0.05 | 1.1 | 0.57 | 0.06 | 5 | Neutral |
| Model 2 | 25 | 25 | 72.35 | 0.05 | 1.1 | 0.57 | 0.23 | 6 | Neutral |
| Model 3 | 25.5 | 25.5 | 72.35 | 0.05 | 1.1 | 0.57 | 0.39 | 8 | Neutral |
| Model 4 | 26 | 26 | 72.35 | 0.05 | 1.1 | 0.57 | 0.56 | 12 | Neutral |
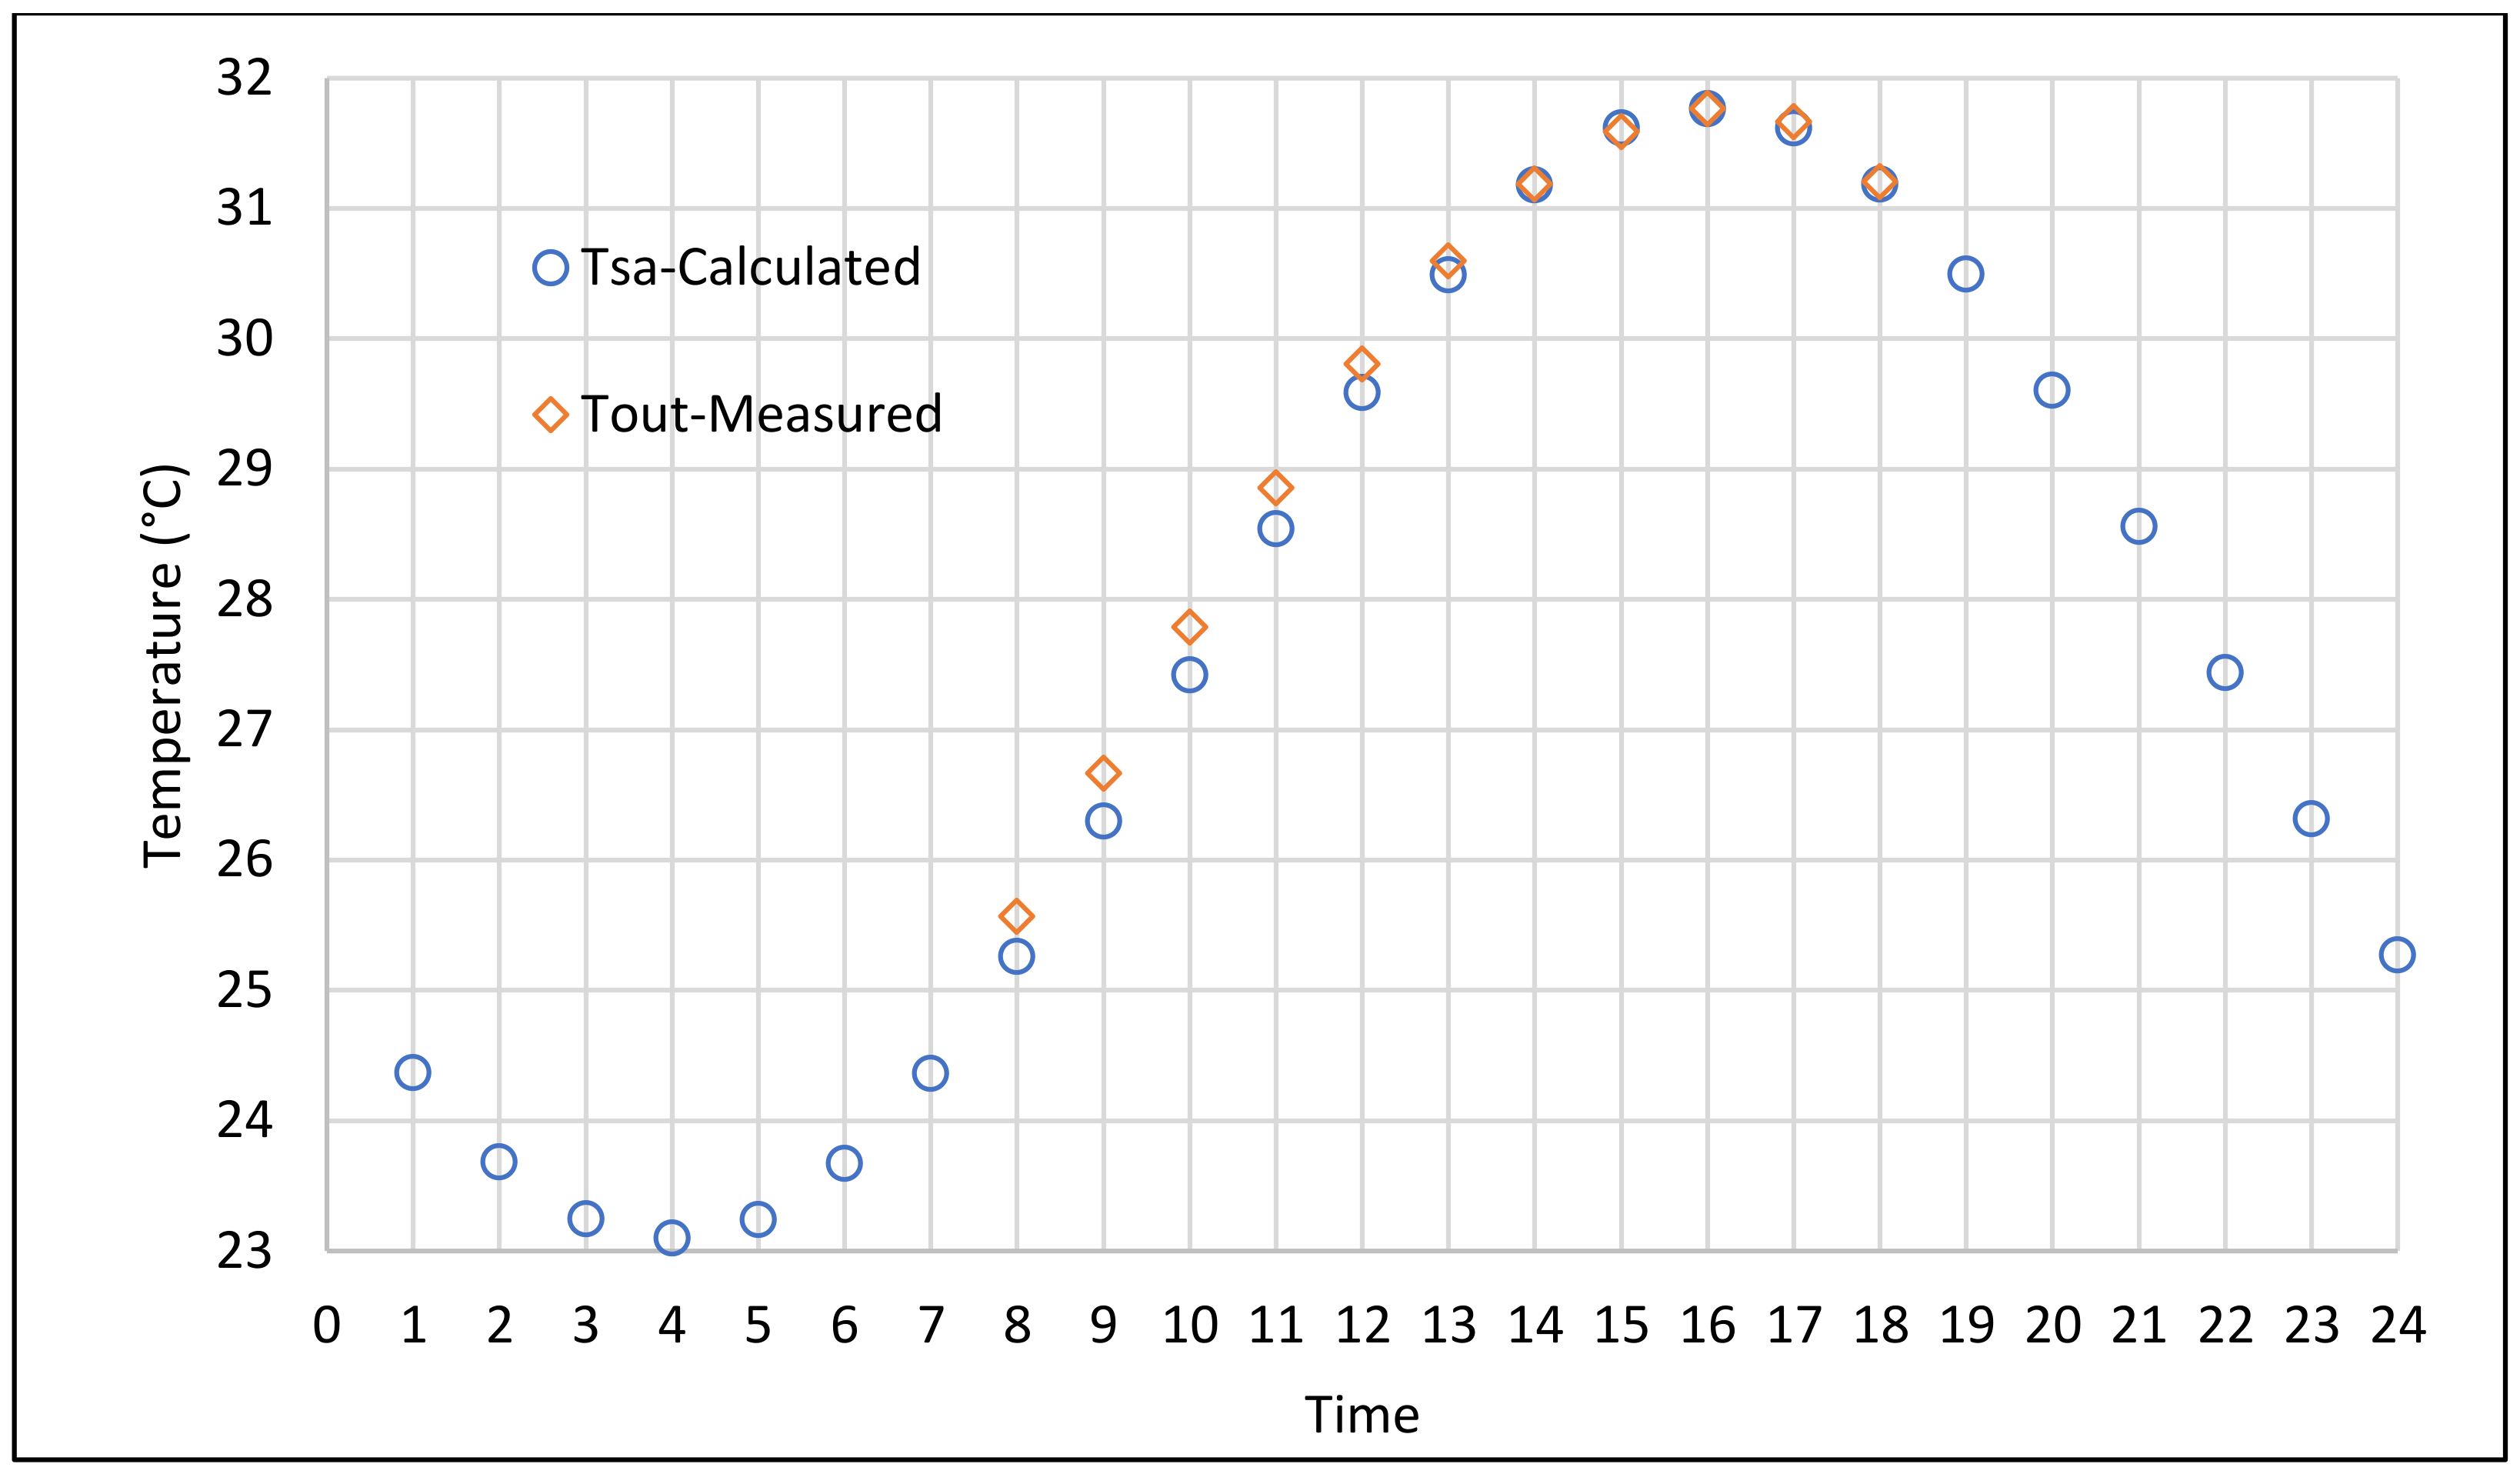
| Time | Tsa Calculated | Tout Measured | Correlation | |
|---|---|---|---|---|
| Pearson Correlation | Sig. (Two-Tailed) | |||
| 8 | 25.25 | 25.57 | 1.000 ** | 0.000 |
| 9 | 26.30 | 26.67 | ||
| 10 | 27.42 | 27.79 | ||
| 11 | 28.54 | 28.86 | ||
| 12 | 29.59 | 29.81 | ||
| 13 | 30.49 | 30.60 | ||
| 14 | 31.18 | 31.19 | ||
| 15 | 31.61 | 31.59 | ||
| 16 | 31.77 | 31.77 | ||
| 17 | 31.62 | 31.67 | ||
| 18 | 31.18 | 31.21 | ||
Publisher’s Note: MDPI stays neutral with regard to jurisdictional claims in published maps and institutional affiliations. |
© 2021 by the authors. Licensee MDPI, Basel, Switzerland. This article is an open access article distributed under the terms and conditions of the Creative Commons Attribution (CC BY) license (https://creativecommons.org/licenses/by/4.0/).
Share and Cite
Esfandiari, M.; Zaid, S.M.; Ismail, M.A.; Hafezi, M.R.; Asadi, I.; Mohammadi, S. A Field Study on Thermal Comfort and Cooling Load Demand Optimization in a Tropical Climate. Sustainability 2021, 13, 12425. https://doi.org/10.3390/su132212425
Esfandiari M, Zaid SM, Ismail MA, Hafezi MR, Asadi I, Mohammadi S. A Field Study on Thermal Comfort and Cooling Load Demand Optimization in a Tropical Climate. Sustainability. 2021; 13(22):12425. https://doi.org/10.3390/su132212425
Chicago/Turabian StyleEsfandiari, Masoud, Suzaini Mohamed Zaid, Muhammad Azzam Ismail, Mohammad Reza Hafezi, Iman Asadi, and Saleh Mohammadi. 2021. "A Field Study on Thermal Comfort and Cooling Load Demand Optimization in a Tropical Climate" Sustainability 13, no. 22: 12425. https://doi.org/10.3390/su132212425
APA StyleEsfandiari, M., Zaid, S. M., Ismail, M. A., Hafezi, M. R., Asadi, I., & Mohammadi, S. (2021). A Field Study on Thermal Comfort and Cooling Load Demand Optimization in a Tropical Climate. Sustainability, 13(22), 12425. https://doi.org/10.3390/su132212425