1. Introduction
The sustainable and healthy development of cities is an important manifestation of economic development and social progress. With the rapid development of urbanization, cities are facing increasingly serious uncertainty problems. The United Nations predicted that by the end of 2050, more than 66% of the population will live in cities [
1]. The World Bank assessed the risk status of 633 large cities worldwide in 2013 and found that 450 countries were exposed to the risk of at least one disaster [
2]. The 2018 Lloyd Urban Risk Index Report noted that 279 cities worldwide (including 36 Chinese cities) faced the risk of 22 threats, revealing that most natural disaster risks accounted for 63.4% of the total risk-related gross domestic product (GDP), while human risks, such as network crime, interstate conflicts, or market collapse, accounted for 36.6% of the total risk-related GDP [
3].
As the centers of political, economic, and cultural activities, cities provide a large number of employment opportunities. They are characterized by concentrated populations, dense buildings, and interconnected infrastructures, which make them function properly and more livable, but also increase their vulnerability to disasters. Urban systems are constantly exposed to disturbances and damage stemming from natural and man-made factors highly prevalent in modern society, such as extreme climate disasters, geological disasters, major infectious diseases, terrorist attacks, information technology risks, population aging, and backward infrastructure. The COVID-19 outbreak tremendously impacted the health of cities worldwide, exposing many of the problems and shortcomings of cities in terms of managing risk and further highlighting the importance of enhancing the resilience of urban systems. In the face of the growing security needs of people and the increasing uncertainties in cities, scientists, politicians, and urban managers have carried out relevant research and adopted emergency countermeasures, and building resilient cities is the most important aspect.
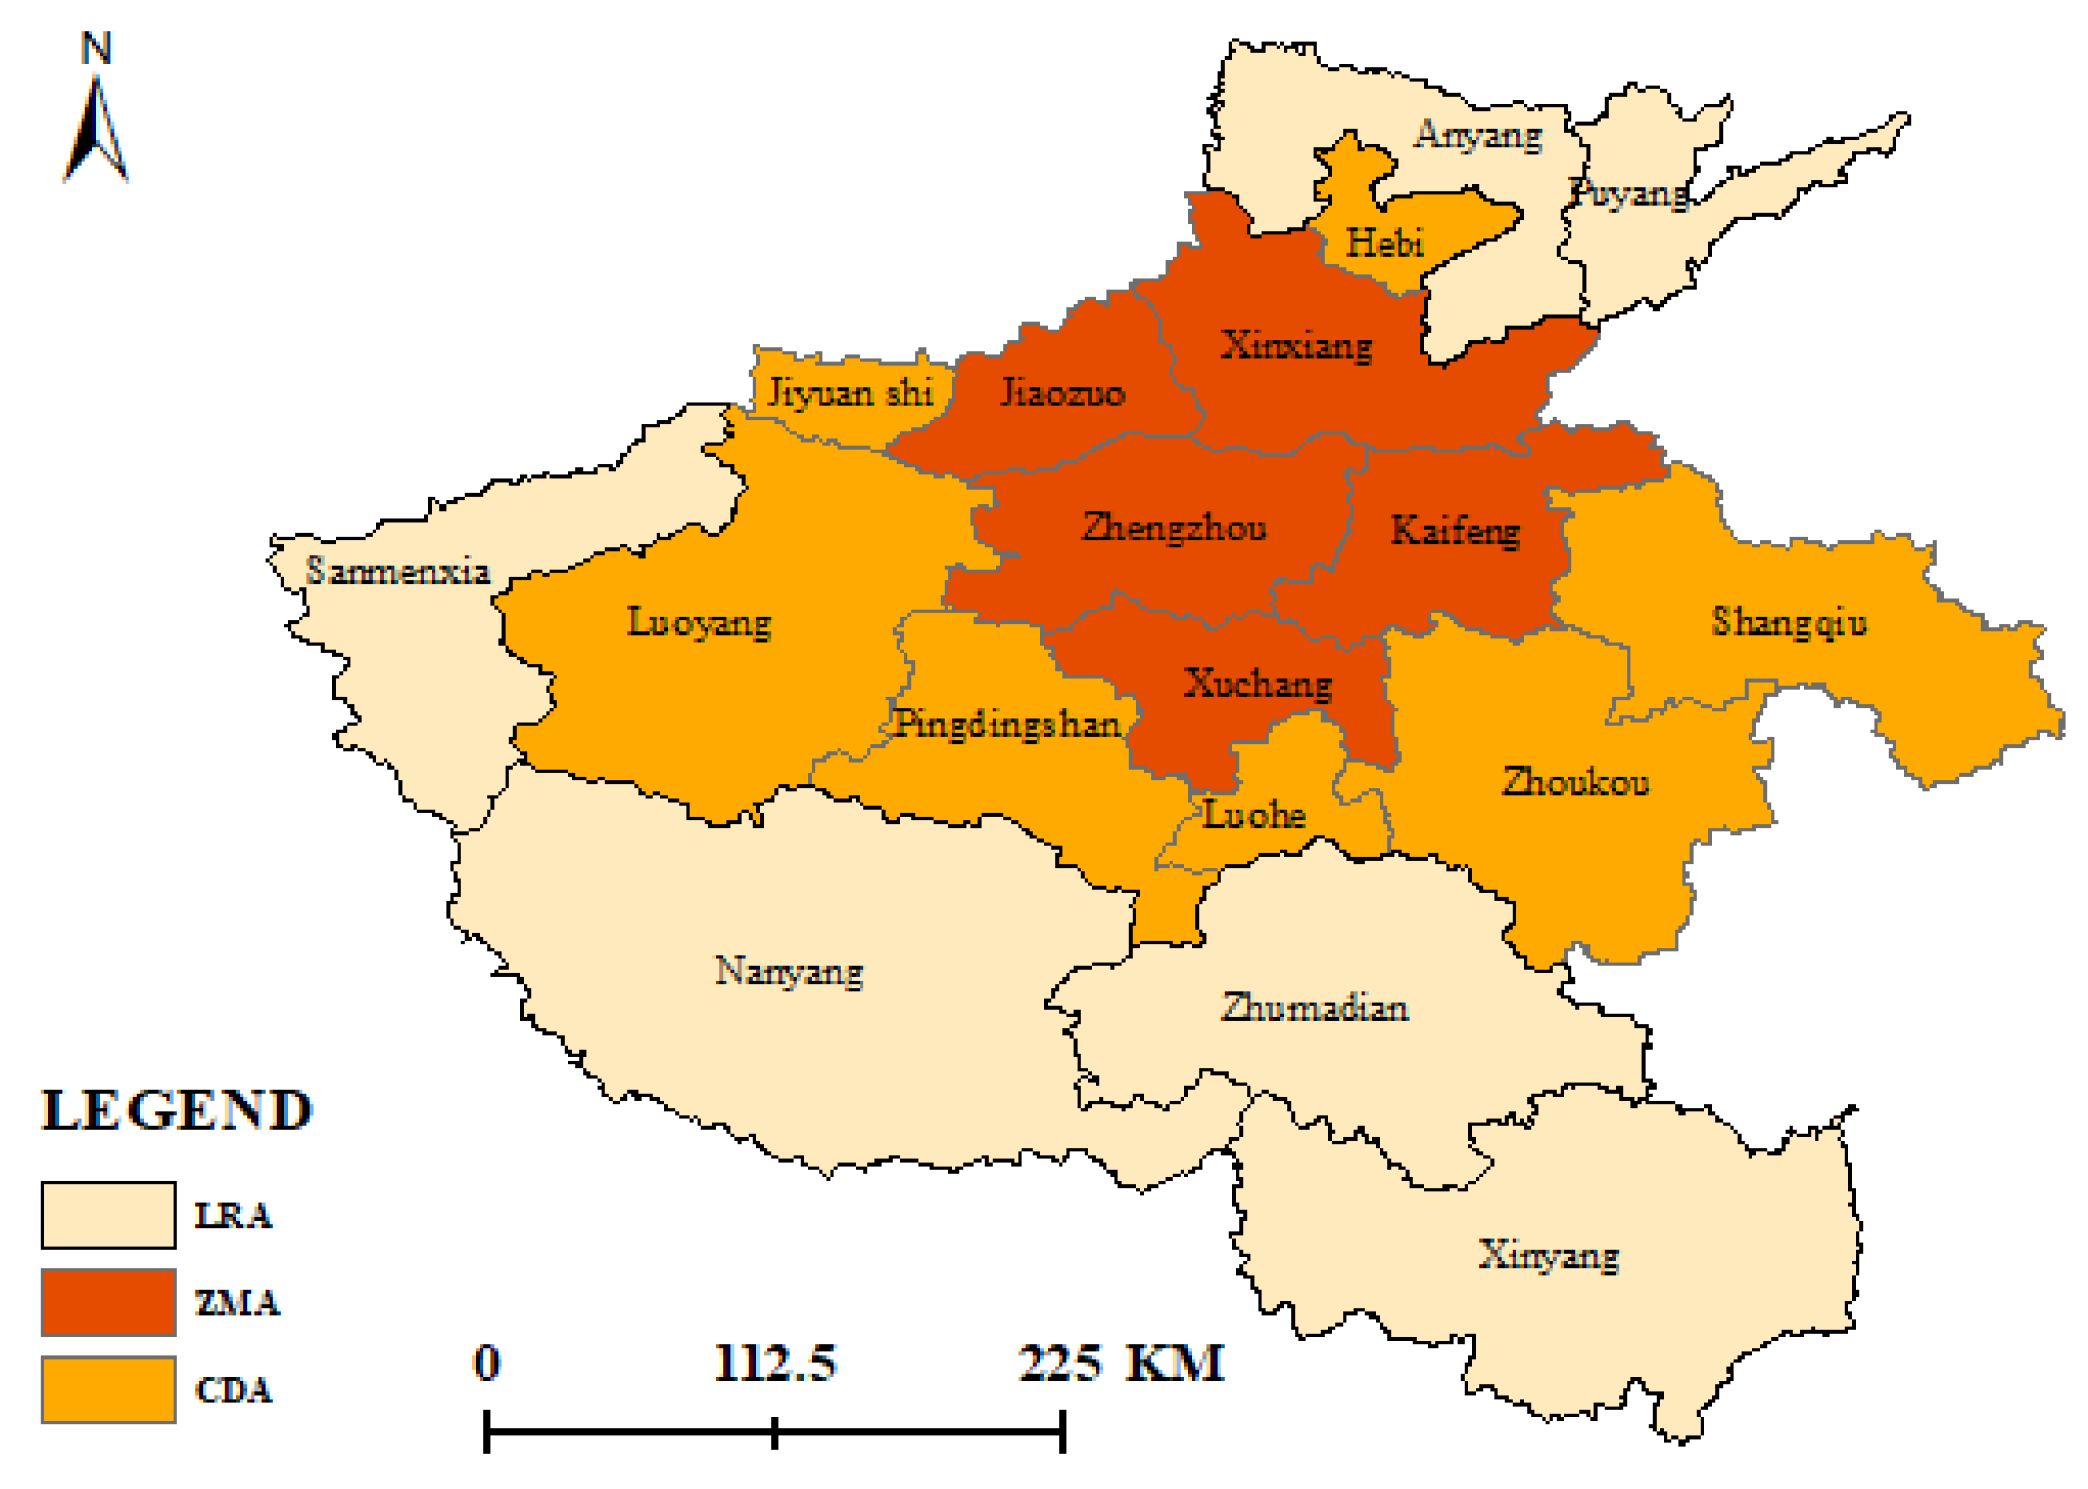
This paper analyzes the spatial pattern of urban resilience and its influencing factors in a specific region by using the entropy method, Thiel index, and ESDA from the level of endogenous development capacity of cities and their optimization of the spatial pattern of regional development. Given the current situation of Henan Province, wherein “the overall resilience is continuously growing and evolving, the ecological resilience and engineering resilience have shortcomings, and the local effect and spatial spillover effect of openness on urban resilience are negative”, we propose measures to continuously promote the development of new urbanization; improve the mechanism of regional collaborative development; enhance market activity; optimize the environment of science, education, and innovation; and promote the optimization and upgrading of industrial structure to provide experience and reference for the construction of resilient cities.
2. Resilience
Linguistically speaking, the word resilience originates from the Latin word “resil-io”, which means to return to its original state. The concept of resilience was first introduced in 1973 by C. S. Holling, a professor of ecology at the University of Florida; in his landmark book
Resilience and Stability of Ecological Systems, he proposed the concept of “ecosystem resilience” [
4], which means “The persistence of natural systems in response to changes in ecosystems caused by natural or man-made causes”. In the 1980s, the application of resilience theory was extended to the field of disaster management, leading disaster scholars to shift their focus from vulnerability to resilience. In the 1980s, the application of resilience theory was extended to the field of disaster management, leading scholars in the field of disasters to shift their focus from vulnerability to resilience. In 1996, C. S. Holling further identified the difference between “ecological resilience” and the traditional concept of “engineering resilience” in the book
Engineering Resilience Versus Ecological Resilience, and pointed out that the two different definitions of resilience stemmed from the differences in the concepts of “stability” and “equilibrium”. At the end of the 1990s, scholars gradually expanded the study of resilience from natural ecology to human ecology. The city as a major component and activity subject of human ecology, the idea of resilience has been naturally applied to urban research, laying the foundation for the formation of resilient city theory.
The development of resilience theory has undergone three conceptual changes: engineering resilience [
5], ecological resilience [
6], and socio-ecological resilience [
7], each of which has enriched the conceptual content of resilience. Resilient cities were first proposed by the International Council in 2002, and they were introduced into urban disaster research, which promoted a research wave in the field of urban resilience. The Second World Conference on Disaster Reduction in 2005 included resilience in the policy area of sustainable urban development [
8]. Subsequently, international research organizations and scholars conducted extensive and in-depth studies on the multisectoral, regional, and comprehensive characteristics of urban resilience, such as the Global 100 Resilient Cities project launched by the Rockefeller Foundation in 2013, which aims to improve the comprehensive resilience of cities by addressing uncertainties in social, economic, institutional, and infrastructure areas [
9]. In 2016, the Third United Nations Conference on Housing and Sustainable Urban Development (UNCHSUD) released the New Urban Agenda, which advocated the ecology and resilience of cities as core agenda elements, setting a new global standard for the sustainable development of resilient cities [
10]. In recent years, China has successfully established administrative departments and research centers, such as the Ministry of Emergency Management and the Resilient City Research Center of Zhejiang University. In the newest round of city master plans of Beijing and Shanghai, relevant expressions, such as strengthening the ability of a city to cope with disasters and improving the city resilience, have been included. In addition, the concept of resilient cities was first put forward in the Proposal of the Central Committee of the Communist Party of China on Formulating the Fourteenth Five-Year Plan for National Economic and Social Development and Vision Goals for the Year 2035. Therefore, urban resilience has become a hot research topic in current international urban planning, sustainable urban development, and urban risk prevention. Through combing and summarizing the domestic and foreign resilience research literature, it is found that from the existing research, the related research on urban resilience mainly focuses on the three aspects of connotation characteristics, theoretical deduction, and indicator system.
In terms of connotation features: due to the unique perceptions of the concept of the resilience of different disciplines or institutions, the concept of urban resilience also varies: according to disaster science researchers [
11], e.g., Jha et al. [
12], Godschalk et al. [
13], and Bozza et al. [
14], from the perspective of disaster science that urban resilience is a system, a given community or society can effectively resist, absorb, and bear the impact of disasters, and the main characteristics, structure, and key functions can be restored. Shen et al. [
15], Meerow et al. [
16], Shao et al. [
17], and UN-Habitat [
18] proposed that, from the perspective of urban planning, urban resilience refers to the ability to realize the normal operation of public safety, social order, and economic construction through reasonable preparation, buffering, and uncertainty disturbance mitigation. In terms of intrinsic dimensions [
19], existing studies on urban resilience have covered multiple dimensions, such as economic [
20,
21], ecological [
22,
23], engineering [
24,
25], and social dimensions [
26]. From the perspective of the evolution of resilient cities, due to the complexity, openness, and comprehensiveness of the urban system [
27], the construction of urban resilience involves all aspects of a given city, which is a dynamic and complex urban network involving interactions between human and environmental systems. Patricia Romero-Lankao et al. focus on the influences that enhance urban resilience from the perspective of urban actors and how different definitions of these concepts intersect, complement, or contradict each other [
28].
In terms of theoretical deduction: at present, the research perspectives and themes of the theoretical framework of urban resilience are diversified and scattered. Relevant research can mainly be summarized from three perspectives, namely, disaster response, urban governance, and complex adaptive systems, as represented by Cutter [
29], etc., who proposed the local disaster resilience framework (disaster resilience of a place (DROP)), thereby paying attention to the city when managing the risk of resource availability and redundancy and representative facilities and characteristics. Ayyoob Sharifi et al. studied nine blocks representing three different urban forms (traditional, semi-planned, and planned) in Iran and analyzed the resilience of different blocks in response to three stress sources (earthquakes, extreme heat, and floods) [
30]. The urban governance framework focuses on addressing the connection and coordination between urban emergency management and urban planning. Many scholars and international organizations have proposed frameworks such as the resilient city planning framework (RCPF) [
31] and city resilience index (CRI) [
32], aiming at the current situation and system of urban resilience to improve urban resilience through planning, design, and management. Grazia Brunetta et al. [
33] proposed that measuring urban resilience mainly faces both conceptual and methodological barriers, and Stella Manika et al. [
34] argued that the optimal location of enterprises is conducive to improving urban resilience and economic strength. The complex adaptive system framework emphasizes that urban risk prevention and control strategies are proposed in stages, and the core is based on feedback-loop system theory, such as the human–environment system (HES) [
35] and resilience, adaptation, and transformation assessment (RATA) frameworks [
36]. Nyström et al. [
35] believed that the system’s structure, functions, and interrelationships change over time. They proposed a framework for human–environment coupled system sustainability (the HES framework), which linked human–environment systems with resilience research and enhanced the resilience of urban systems through connectivity, dynamic mechanisms, and mutual feedback.
In terms of indicator systems: the evaluation index systems of urban resilience have generally been constructed from three aspects through empirical research, including the basic components and characteristics of urban resilience and the sequence of the stages and processes of urban resilience. In terms of the basic components of urban resilience, Sun et al. [
37], Zhang et al. [
38], and Songj et al. [
39] constructed an index system based on the economy, society, ecology, and municipal infrastructure via geographic-information-system (GIS)-based spatial analysis, the superposition function method, analytic hierarchy process (AHP), and factor analysis method. The urban resilience of the Yangtze River Delta and Guangzhou, China, was evaluated. Nadro et al. [
40] proposed a composite index construction method to evaluate the resilience of 50 cities in Spain from four aspects: social, economic, ecological, and organizational aspects. In the index evaluation system based on the characteristics of urban resilience, Heeksr et al. [
41] considered the fairness of resilience evaluation as the key point and proposed to evaluate whether the system could provide equal rights and opportunities of resource utilization with two categories of index systems: functional and enabling characteristics. Li Tongyue [
42] applied the robustness, redundancy, resourcefulness, and rapidity (4R) framework of Bruno to construct an evaluation system for the response of a city to rain and flood damage. Parsons and Morley [
43] evaluated the characteristics of coping ability and adaptability, corresponding to the different stages at which resilience plays a role. Based on the process sequence of the various resilience stages as the core, according to the disaster-prevention stage, disaster-absorption stage, and system-recovery stage, Chen Changkun et al. [
44] established an evaluation system of urban resilience within the context of rain and flood disasters, starting from three attributes of urban resistance, resilience, and adaptability.Bruno et al. [
45] reported that the resiliency state of urban communities after an earthquake could be represented by the change in infrastructure functionality over time.
In summary, current scholars have achieved fruitful results in resilient cities. However, due to the late start of resilient cities, existing researchers tend to explore the concepts and theories of urban resilience. There are few comprehensive evaluations, the evaluation methods are not systematic enough, and there are fewer discussions on the factors affecting resilient cities. In terms of evaluation objects, most scholars have conducted more resilient city evaluations on cities and regions with high economic levels, and relatively little attention has been paid to the research on resilient cities in inland provinces. Therefore, compared to the above existing research, the main contributions of this paper include the following: (1) this study is the first to comprehensively and systematically consider the spatial and temporal distributions of urban resilience characteristics and their influencing factors in Henan Province, China. (2) In terms of research methods, the combination of the improved entropy method with the addition of time variables and the spatial Durbin model (SDM) constitutes a major innovation in current urban resilience research techniques. (3) In terms of the research depth, many scholars have focused on comprehensive urban resilience evaluation or the analysis of spatial–temporal evolution characteristics. In this paper, the spatial pattern of urban resilience in a specific region and its influencing factors are analyzed from the perspective of the urban endogenous development capacity and optimization of the spatial pattern of overall regional development. (4) In terms of research objects, Henan Province, as a major province in China’s inland economy and the core province of China’s strategy to revitalize the Central Plains, is a typical representative of China’s inland cities. The research on the quality development of its new urbanization and the improvement of urban resilience level has certain typicality and reference value. Given these considerations, this paper adopts 18 cities in Henan Province from 2009 to 2018 as the research object, and the entropy method, Theil index, and exploratory spatial data analysis (ESDA) are employed to evaluate and analyze regional differentiation patterns in space and time. Moreover, the influencing factors of the resilience of Henan Province cities are explored through the SDM to strengthen their capacity to mitigate disasters and enhance the resilience of cities in the Central Plains of China. The analysis and findings of this study have important methodological significance for applying the resilient city theory in practice.
4. Results
Based on the above research and analysis, this paper draws the following conclusions:
First, through the comprehensive measurement of urban resilience, it can be seen that in 10 years, the resilience of cities in Henan Province has shown an upward trend. Compared with the end of the period, the overall resilience level has increased in the initial year, but the absolute value was relatively small. In terms of the three major regions in Henan Province, the urban resilience level of the Zhengzhou metropolitan area was much higher than the average level of the province’s core development areas and linkage radiation areas. The core development areas were consistent with the province’s resilience development trend, and the linkage radiation areas were the lowest.
Secondly, the resilience of urban resilience subsystems in Henan Province shows a wave-like trend, and the overall resilience level and the resilience level of each subsystem have increased, and the growth rate was more obvious. Comparing the four major subsystems, the economic resilience level was the highest in the examined years, the trend was consistent with the overall resilience level, and the engineering resilience was the lowest. On the whole, social resilience has increased the most, while ecological resilience and engineering resilience have increased, but the overall magnitude was not large.
Third, according to the Thayer index and decomposition results, the degree of internal imbalance in the overall resilience of the whole city shows a curvilinear downward trend within the year of examination, with a significant reduction in the overall difference between the initial year and the end year, and the largest decrease in the Thayer index in 2017, with a 74% decrease compared to 2016.
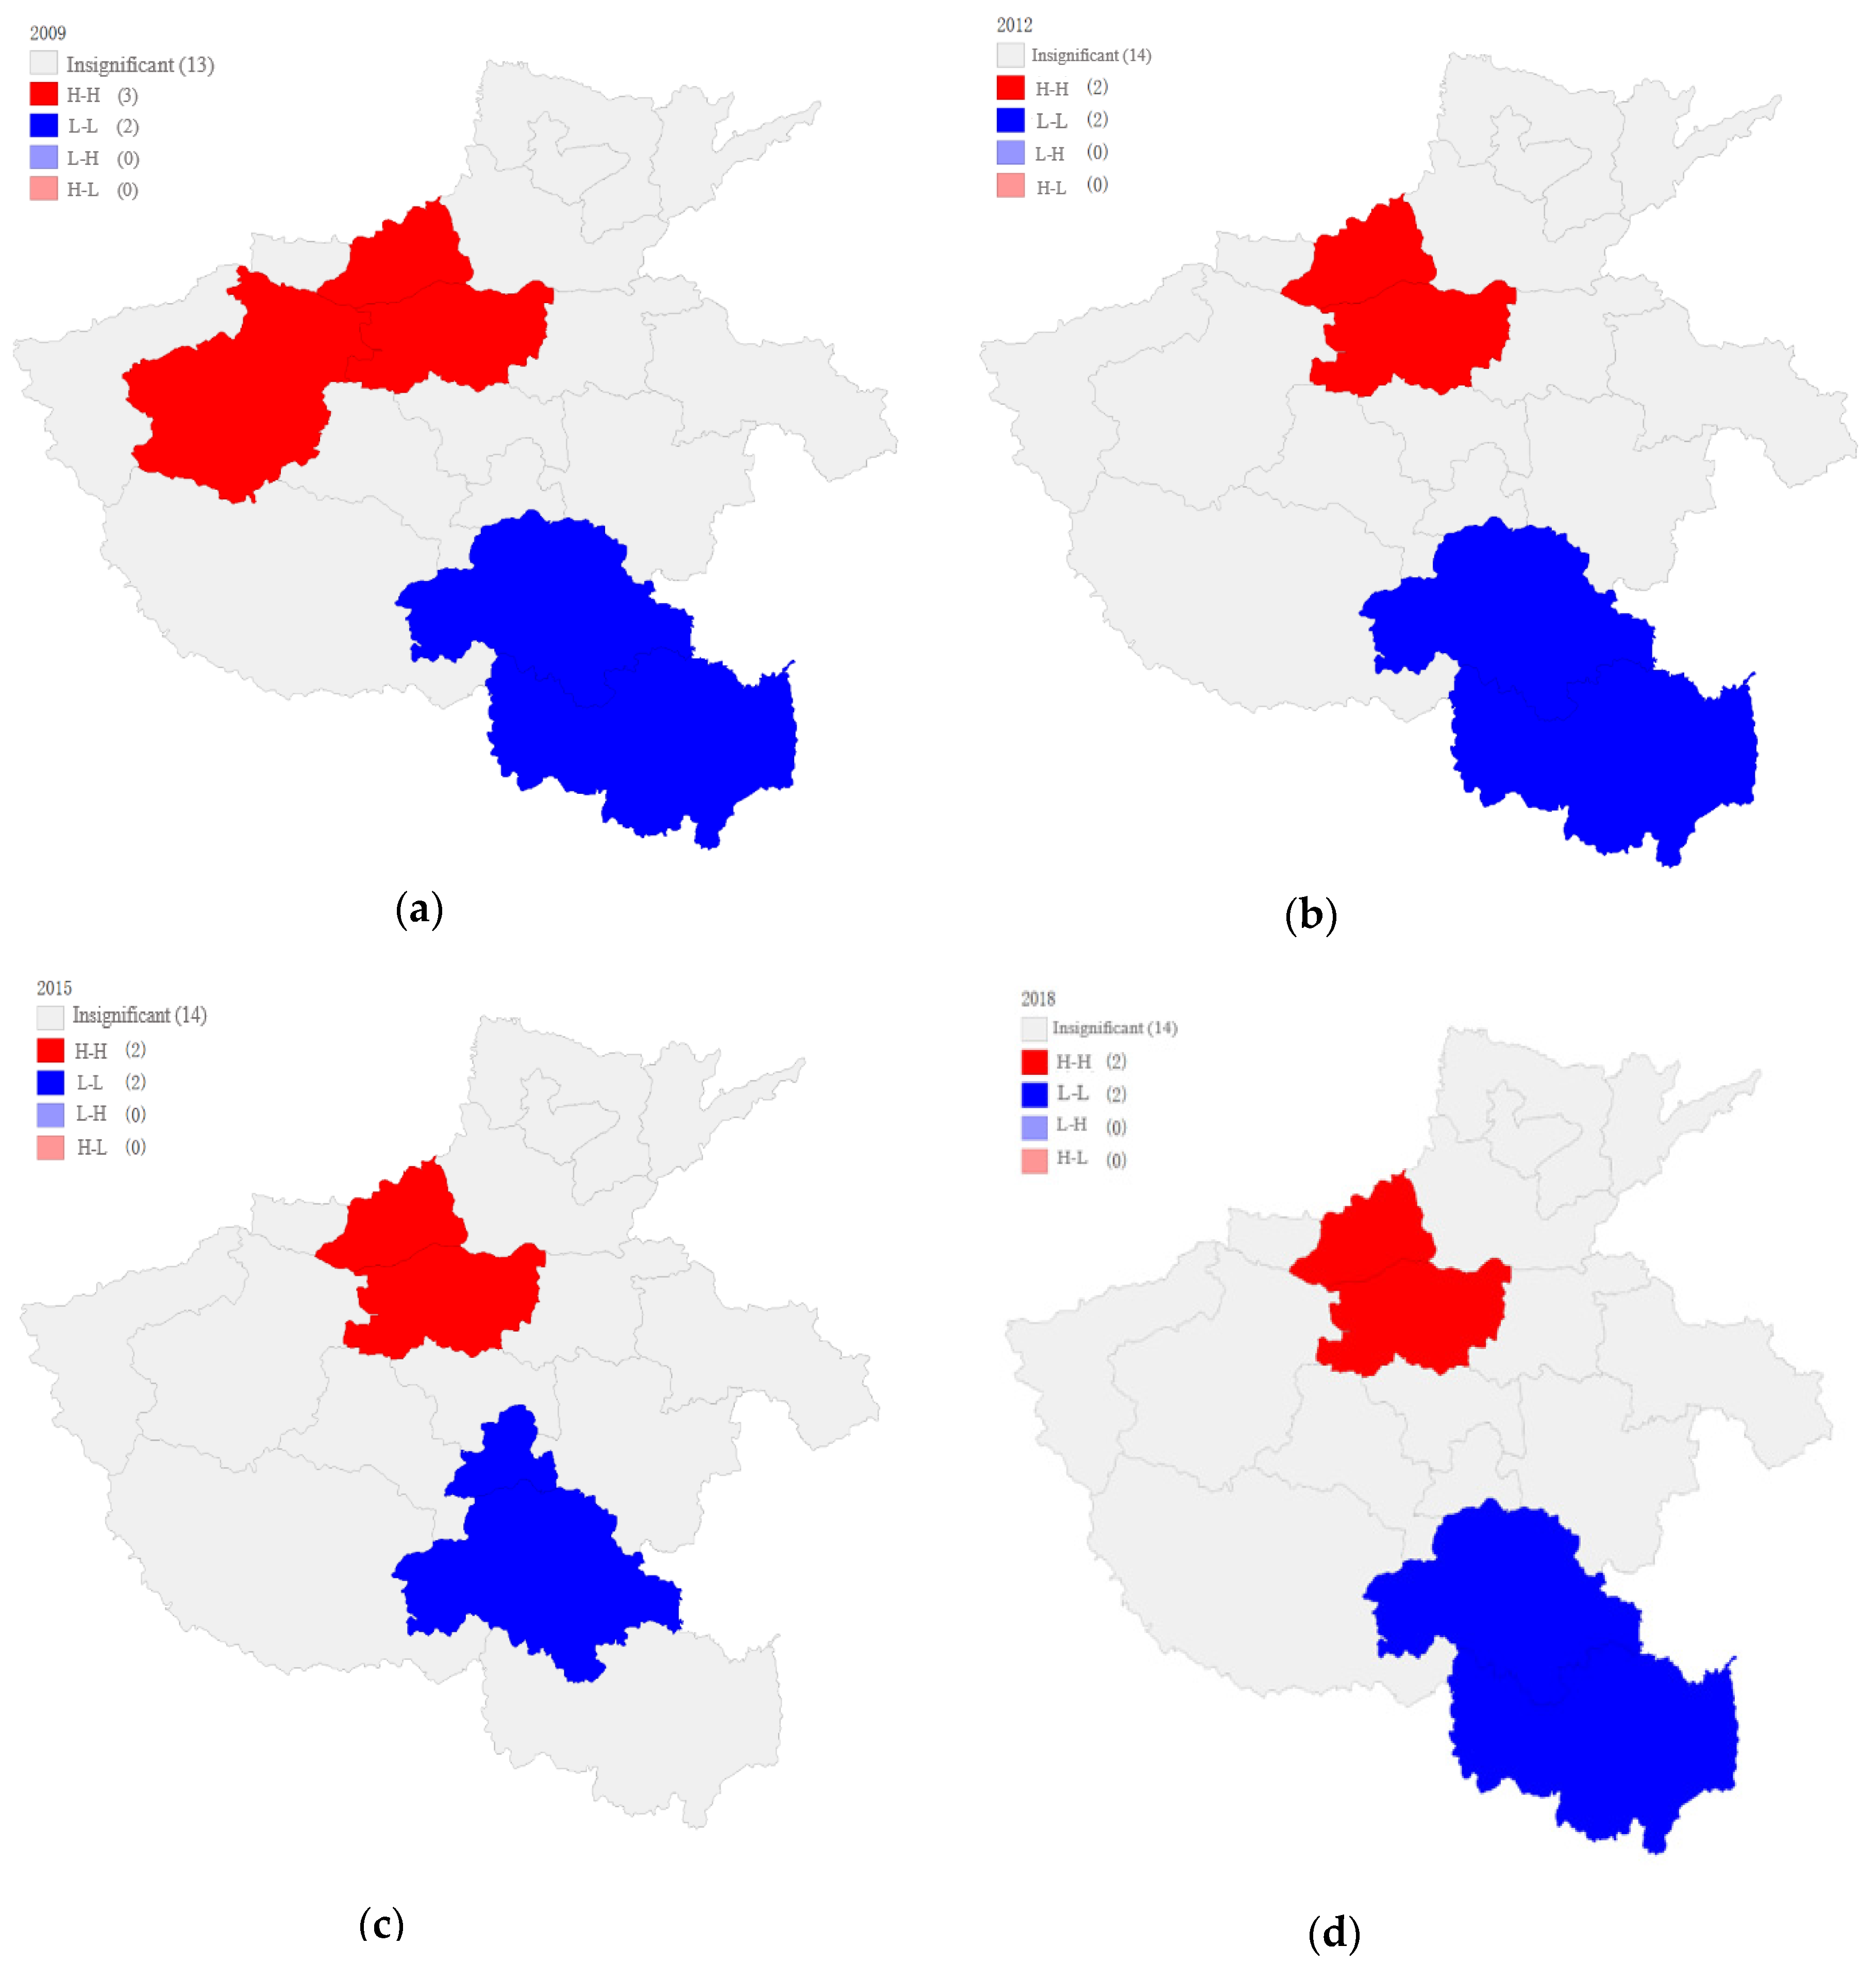
Fourth, from the perspective of spatial correlation analysis, the Moran Index indicated that the urban resilience level of Henan Province showed a significant positive spatial autocorrelation. The urban resilience spatial agglomeration characteristics of Henan Province are obvious, and the distribution of cold and hot spots is uneven. On the whole, the urban resilience HH clusters (high-efficiency type) in Henan Province were concentrated in Zhengzhou, Luoyang, and Jiaozuo (central Henan, western Henan), while the LL clusters (low-efficiency type) were distributed in Zhumadian and Xinyang (southern Henan), which was consistent with the first verification result. There were no HL aggregation (polarized) types and LH aggregation (hollow) state.
Fifth, in the evaluation of the influencing factors of urban resilience in Henan Province, because the urban resilience of Henan Province was affected by the explanatory variables and their lags, as well as some unobservable errors, the fixed-effect spatial Dubin model was selected for simulation. Among the six influencing factors of urban resilience selection in Henan Province, the local effects and spatial spillover effects of innovation, market power, and industrial structure on the overall resilience of the city were all positive; that is, these factors have a significant positive impact on the improvement of urban resilience in Henan Province. While the urbanization rate and administrative power had a positive impact on local resilience, they also showed a negative spillover response to the neighborhood. Only the openness failed the significance test and had a local effect on urban resilience. The spatial spillover effects of the neighborhood and the neighborhood were both negative.
5. Discussion
5.1. Temporal and Spatial Evolution Patterns of City Resilience in Henan Province
5.1.1. Spatial and Temporal Evolution of Urban Resilience in Henan Province
Based on the resilience development trend in the three major regional cities of Henan Province, the overall resilience level in the considered Henan Province cities is low, but a trend of sustained growth is observed. As shown in
Figure 2, the overall urban resilience level in Henan Province rose from 0.104 in 2009 to 0.412 in 2018, an increase of 0.308 over 10 years, at an average annual growth rate of 29.6%, indicating that the urban resilience in Henan Province exhibited an overall increase in characteristics since 2009. This occurred due to the Henan Provincial Government’s emphasis on sustainable and healthy urban development over the past 10 years and the successive promulgation of policies aimed at the construction of high-quality cities, which created many dividends for urban resilience enhancement in Henan Province. However, the overall urban resilience in Henan Province from 2009 to 2018 reached a low level of 0.233, which remains far from the effective frontier, indicating that the urban resilience level in Henan Province should be improved. The urban resilience level in Henan Province in 2017 experienced a relatively large-scale increase, which was mainly attributed to the official issuance and implementation of the Central Plains City Cluster Development Plan in 2016 to encourage the advancement of the central region and promote the scientific development of the Central Plains City Cluster, which provided important strategic support, guaranteed urban resilience development in Henan Province, and effectively facilitated a notable increase in urban resilience. Moreover, this was inseparable from the improvement in the economic development level, the progress of science and technology, and the strengthening of the eco-environmental protection concept in recent years.
Table 3 indicates that, in general, the overall resilience level and the resilience level of each subsystem increased during the initial year and by the end of the period from 2009 to 2018, and growth was more obviously encountered, indicating that the overall situation of urban resilience development in Henan Province was suitable. Specifically, in regard to each subsystem, the economic resilience level (0.0767) was the highest, followed by the social resilience level (0.0733). The economic and social resilience level indicated a steady growth trend and basically agreed with the overall urban resilience level in Henan Province. The levels were consistent, indicating that these two subsystems are the key factors promoting the overall resilience of Henan cities. In addition, the ecological resilience level (0.0465) ranked third, and the engineering resilience level (0.0369) ranked at the bottom. The advancement of ecological and engineering resilience lagged, which has become a bottleneck in the development process of urban resilience in Henan Province. On the whole, although the ecological and engineering resilience levels increased, the overall extent was limited. This yielded a small contribution to the improvement in the urban resilience development level in Henan Province; much room for future improvement remains.
5.1.2. Spatial Evolution Pattern
From the perspective of the overall development trend of the urban resilience level in Henan Province (as shown in
Figure 2), the resilience levels of the cities in the three major regions exhibit notable differences, but they all indicate an upward development trend. From 2009 to 2017, the average urban resilience levels in the Zhengzhou metropolitan area, core development area, and linkage radiation area are 0.340, 0.255, and 0.216, respectively, and the resilience level in the Zhengzhou metropolitan area is higher than the average level in the core development area, linkage radiation area, and province, and the lowest resilience level is observed in the linkage radiation area. This is closely related to the regional economic development level. The Zhengzhou metropolitan area is the core area of the Central Plains urban agglomeration and integrates economy, culture, industry, and population as the center. The urban infrastructure is complete, social resources are abundantly available, and the medical system and urban functions are comprehensive, so this area is resilient. The level is relatively high. From the perspective of the growth rate, the resilience level in the Zhengzhou metropolitan area rose from 0.218 in 2009 to 0.572 in 2018, an average annual growth rate of 16.2%. The resilience level in the core development area increased from 0.169 in 2009 to 2018 0.441, an average annual increase rate of 16.1%. The resilience level in the linkage radiation area increased from 0.134 in 2009 to 0.405 in 2018, an average annual increase rate of 20.2%. At present, the growth rate of the resilience level in the linkage radiation area is higher than that in the Zhengzhou metropolitan area and core development area, reflecting that the linkage radiation area exhibits a good development momentum, but the overall resilience level in the region remains lower than the national average level. The main reason is that the economic foundation of the linkage radiation area is poor, and the urban development level is relatively lagging due to the influence of various factors, such as natural variables, human factors, and historical conditions.
To further analyze the spatial differences in urban resilience across Henan Province, the Theil index is adopted to decompose the urban resilience in Henan Province (as presented in
Table 4). In general, the regional difference in urban resilience across Henan Province exhibits a development trend of increasing and then decreasing, from 0.0426 in 2009 to 0.0266 in 2018, a decrease of 60.15%. Furthermore, core-edge spatial structure characteristics of the urban resilience in Henan Province are observed, but the overall difference is greatly reduced. From 2016 to 2017, the overall city-level Theil index dropped the most, by 74.5% below the 2016 level, mainly due to the implementation of the 2016 Central Plains Urban Agglomeration Development Plan, which provided a great opportunity to reduce regional differences in Henan Province. Strategic guidance and policy support could promote more coordinated and harmonious development of the Central Plains urban agglomeration. According to the decomposition results, the regional and interregional differences in urban resilience across Henan Province were similar to the overall differences, but the intraregional differences always exceeded the interregional differences. The average contribution rate of the intraregional differences from 2009 to 2018 reached 70.93%. The contribution rate was much higher than that of the interregional differences (29.06%). It could be concluded that the intraregional differences were the main cause of the regional differences in urban resilience across Henan Province.
5.2. Spatial Correlation Analysis of the Urban Resilience in Henan Province
To further explore the spatial agglomeration characteristics of urban resilience in Henan Province, GeoDa software was employed to determine the global Moran index (Moran scatter plot) and local Moran index (LISA cluster plot). The calculation results are provided in
Table 5 and
Figure 3.
The results are listed in
Table 5. The Moran index of the urban resilience level in Henan Province from 2009 to 2018 was positive, and all values passed the 95% significance level test, indicating that the urban resilience level in Henan Province attained a significantly positive spatial autocorrelation. The spatial distribution of the urban resilience level was not random but demonstrated a certain agglomeration effect. In particular, areas with high urban resilience levels were adjacent to other high-level areas, and areas with low urban resilience levels occurred adjacent to other low-level areas. Compared to 2009, the Moran index has decreased in recent years, reflecting differentiation in the spatial pattern of urban resilience development in Henan Province.
As shown in
Figure 4, the Moran index of the urban resilience level in Henan Province in 2018 reached 0.066, which indicates that there was a positive spatial correlation in the urban resilience development level among the 18 prefecture-level cities in Henan Province. To more intuitively reflect the urban resilience clustering degree in Henan Province in 2018, a dynamic distribution table was compiled based on the distribution of prefecture-level cities (
Table 6). According to the Moran scatter diagram, the urban resilience level in Henan Province exhibits a significant dual spatial structure, namely, the Zhengzhou metropolitan area and core development area are mainly concentrated in the HH and HL quadrants. The radiation area largely occurs in the LL quadrant, and a positive spatial correlation is observed, but there is no clear spatial correlation between the cities. As the urban development planning system and space management system in Henan Province are not yet mature, there remains room for the coordinated development of the various regions, indicating that there is still a long way to go to promote coordinated urban resilience development in Henan Province in the present and in the future.
The global Moran index can analyze the degree of spatial agglomeration of the urban resilience level in Henan Province as a whole and can better reveal the spatial characteristics of the urban resilience level in Henan Province, effectively distinguishing the degrees of local spatial agglomeration and dispersion and explore local spatial development models. The local Moran index is considered for measurement purposes. GeoDa software was adopted for calculation and to generate a LISA cluster map of the urban resilience level in Henan Province to reflect the autocorrelation degree between regions. In this study, we selected the four years of 2009, 2012, 2015, and 2018 to reveal the temporal and spatial evolution characteristics of the local spatial agglomeration of the urban resilience level in Henan Province. As shown in
Figure 5, urban resilience level agglomeration in Henan Province from 2009 to 2017 mainly occurred as HH and LL agglomerations, among which Zhengzhou, Luoyang, and Jiao in the Zhengzhou metropolitan area were HH agglomerations, indicating that these cities possessed a better development foundation and long-term economic leadership, while the economic development level directly affected infrastructure and social development optimization and enhancement. Coupled with the implementation of policies such as urban ecological management and regional coordinated governance measures in recent years, the overall regional urban resilience was high. The LL agglomeration area was largely distributed in the linkage radiation area encompassing Zhumadian, Luohe, Xinyang, etc. These cities are located in the eastern and southern parts of Henan Province, mostly agricultural areas with a relatively low economic development level, poor social development conditions, and weak regional thematic functions. Coupled with the crude resource extraction method, the urban resilience level in the region was low. Therefore, the driving effect among the cities in the region occurring in the LL quadrant was not obvious. In addition, the number of cities in the low–high and high–low quadrants was zero, which indicates that the spatial heterogeneity in the urban resilience level in Henan Province was not notable.
5.3. Analysis of the Influencing Factors of the Urban Resilience in Henan Province
Through the above correlation test, it was found that no spatial correlation occurred in the urban resilience in Henan Province, and to further reveal the influencing factors of the urban resilience level in Henan Province, a spatial econometric model was applied in regression analysis in MATLAB 2019 software. Based on the principles of operability, science, and orientation of variable selection, six aspects highly relevant to urban resilience were selected as explanatory variables considering existing studies. ① Urbanization rate (URB). Urbanization can create suitable objective conditions, such as a market, technology, and capital, and the urbanization level directly affects the degree of urban resilience development. The urbanization rate of the household population is adopted as a measure of the urbanization rate. ② Administrative power (GOV). The degree of infrastructure improvement in cities is an important criterion of the urban resilience level. Moreover, urban infrastructure development cannot be achieved without the financial support of the government, and the general public expenditure is therefore chosen as a measure of the administrative power of the government. ③ Openness (OPE). The openness level of a city affects its industry, technology, employment, etc. Openness is an important factor in enhancing the vitality of the city. The amount of foreign capital used is selected to measure the openness level. ④ Innovation (INN). The urban innovation ability is the eternal driving force of the sustainable development of a city, and urban innovation is highly important to promote the transformation of the city from an industrial production base to an innovation base. The number of patent applications (pieces) is selected to measure the innovation ability. ⑤ Market power (MAR). The increase in marketization can stimulate the economic growth process of the city to a certain extent and enhance the city’s vitality. The per capita retail sales of consumer goods are selected as a measure of marketization. ⑥ Industrial structure (IND). The adjustment of the industrial structure plays an important role in the transformation of the economy of a given city. The development of the tertiary industry is an important factor in the advancement of the industrial structure. The proportion of the output value of the tertiary industry in the total industrial output value is selected to measure the industrial structure. The data employed for the above variables are retrieved from the 2009–2018 Henan Provincial Statistical Yearbook and China City Statistical Yearbook.
The formal test results for the model are listed in
Table 7. The Hausman test demonstrates that the model passes the 1% significance level test, and the null hypothesis is thus rejected, indicating that the fixed-effects model is better than the random-effects model. Then, after the Wald and log-likelihood ratio (LR) tests, it is found that in both tests, the null hypothesis is rejected at the 10% significance level, which suggests that the SDM cannot be decomposed into an SLM (spatial autoregressive (SAR) model) nor an SEM. This further verifies that the urban resilience in Henan Province at the city scale is affected not only by the explanatory variables and their lags but also by certain unobservable error terms. Therefore, the SDM is chosen. Finally, according to the actual calculation results, comparative analysis of the three fixed-effects SDMs (spatial fixed-effects, temporal fixed-effects, and spatial and temporal dual fixed-effects models) reveals that the SDM with spatial and temporal dual fixed effects attains the highest R-squared value (0.9917) and the best goodness of fit. Hence, this paper selects the SDM with spatial and temporal dual fixed effects to obtain the final simulation results.
According to the estimation results in
Table 6, (1) the local effect of the urbanization rate on urban resilience is positive and passes the 1% significance test. This indicates that an increase in the urbanization rate can promote regional economic development to a certain extent, improve the transformation and upgrading of industrial development, increase the industrial production efficiency, and provide a sustainable impetus for the development of resilient cities. However, the spatial spillover effect of this indicator is negative at the 10% significance level, which indicates that the siphoning effect of cities with a high urbanization rate could cause the migration of people, capital, technology, information, and other resources to cities with a high urbanization rate, and the development potential of neighboring cities could be reduced due to the outflow of resources, which hinders urban resilience improvement to a certain extent. (2) The administrative power variable passes the 1% significance level test. This indicates that government financial support is important in guiding resource factor allocation, infrastructure planning, and income redistribution within cities, which is conducive to managing the improvement in the urban resilience level in the right direction. However, this indicator also reveals a negative spillover effect, which suggests that local governments, in the process of urban resilience development promotion, focus excessively on the protection and development of cities within their region to the exclusion of outside cities, thereby ignoring synergistic regional development, which to a certain extent exerts downward pressure on the resilience of neighboring cities. (3) The local and spatial spillover effects of the openness level on urban resilience are both negative, and both fail the significance test. This indicates that Henan Province, which is located in the Central Plains, is a largely agricultural province with a low degree of openness to the outside world, and the effect of total real foreign capital utilization on urban resilience improvement in Henan Province has not yet been fully realized, but this does not suggest that the urban resilience improvement process in Henan Province does not require openness to the outside world but rather reflects that the response mechanism between urban resilience improvement in Henan Province and openness to the outside world should be further enhanced. (4) The local and spatial spillover effects of innovation on urban resilience are both positive, and both pass the 1% significance test. Urban resilience improvement is inseparable from the driving effect of innovation factors. The improvement of innovation capabilities can promote the optimization of the regional industrial structure, enhance the economic growth vitality of the city, retain technical talent, and yield a positive spillover effect on the surrounding areas. Therefore, in the process of advancing the construction of urban resilience, the improvement of innovation capabilities should be prioritized. (5) The local and spatial spillover effects of market forces on urban resilience are both positive at the 1% significance level, indicating that the development of marketization in Henan Province helps to improve the resilience level in local cities, and simultaneously, with the radiation and diffusion effects of the market, leads to the improvement of the resilience level cities in neighboring regions. (6) The local and spatial spillover effects of the industrial structure on urban resilience are positive, and the local effect is significantly positive at the 1% level. The adjustment and optimization of the industrial structure can boost the overall development of cities, especially in the traditionally agricultural Henan Province. The increase in the proportion of the tertiary industry basically agrees with the evolutionary pattern whereby the industrial structure tends to be highly developed, which is compatible with the current development level of the overall national economy.
In general, the urban resilience level of Henan Province has obvious characteristics of cluster distribution and unbalanced spatial distribution and gradually shows the characteristics of “core-periphery” in spatial changes. The reasons for this phenomenon are: first, the natural geographical conditions and population distribution of various regions in Henan Province are very different; second, since the founding of New China, especially after the reform and opening up, the regional coordinated development strategy has been implemented continuously, and the level of regional coordinated development in Henan Province has been improving, and great achievements have been made in coordinating urban and rural development, coordinating regional relations, optimizing spatial layout, and promoting regional cooperation. The third is that sub-regional cooperation continues to increase, and urban connections are becoming closer. In 2017, the construction of Zhengzhou, the capital city of Henan Province, was approved. During the rapid progress of the Zhengzhou metropolitan area, sub-regional cooperation, including Zheng Kai, Zheng Jiao, Zheng Xin, Zheng Xu, etc., has also accelerated, which has led to cooperation and the interconnection of regional transportation, economy, trade, culture, and education. Therefore, the concentration of production factors and industries makes the employment opportunities, public services, and education levels of Zhengzhou and surrounding areas in the east higher than other areas. As a result, although the southern and northern regions of Henan Province have good ecological advantages such as agriculture, land, and minerals, due to the high cost of resource output and lack of factor concentration, the industrial advantage of regional industrial clusters cannot be formed in the short term. There are also differences in economic, social, ecological, engineering (infrastructure), and other aspects between regions. This degree of unbalanced development is the main reason for the difference in elasticity index between regions. Therefore, in response to this phenomenon, this article focuses on the analysis of the influencing factors of the urban resilience level of Henan Province, from the six aspects of urbanization rate, administrative power, open power, innovation power, market power, and industrial structure. The analysis of the reasons for resilience results and the analysis of influencing factors explored in this article may provide references for other inland regions with comparable economic levels and geographic locations. Among China’s 34 upgraded administrative regions, there are 12 inland provinces. As China’s population and food province, Henan Province is actively promoting and exploring the construction of new urbanization. Assessing the regional resilience of Henan Province can not only guide the social development and planning of the region but also provide a wealth of practical cases for studying the regional resilience of developing countries.
6. Conclusions and Recommendations
6.1. Conclusions
Based on the panel data of 18 cities in the YRB from 2009 to 2018, the temporal and spatial differentiation characteristics of urban resilience in Henan Province were analyzed, and a spatial measurement model was used to analyze the influencing factors of urban resilience. The main conclusions are as follows: (1) the overall resilience in Henan Province exhibits an evolutionary trend from a low level to a high level, but there are differences in the growth rate and trend. The three major urban regions in Henan Province from 2009 to 2017 are ranked as the Zhengzhou metropolitan area, core development area, and linkage radiation area. (2) The urban subsystem resilience in Henan Province reveals a growing trend, and the order of the resilience of the four subsystems is economic resilience, social resilience, ecological resilience, and engineering resilience. The overall resilience is mainly driven by economic and social resilience. (3) In terms of the global spatial characteristics, the Henan Province region exhibits a positive spatial correlation, and the urban resilience level in Henan Province exhibits significant dual structural characteristics of the spatial structure. (4) Among the influencing factors of the indicators of the urban resilience in Henan Province, the overall local effects of the urbanization rate, administrative power, innovation ability, market forces, and industrial structure factors are positive, and the local effect of the openness level on the urban resilience is negative. The spatial spillover characteristics of each influencing factor on the urban resilience in Henan Province are significantly differentiated.
The shortcomings of the paper are: (1) the exploration of urban resilience in this paper is at the preliminary stage. Since the academic community has not yet reached a consensus on the basic connotation and evaluation criteria of urban resilience, future urban resilience research will start more from the basic concept of urban resilience and explore the scientific connotation and framework structure of urban resilience from a diversified and composite perspective. (2) As the urban system and its resilience components are complex and diverse, in addition to the contradiction between internal and external factors, there are many other factors that affect system resilience, and each specific study is only discussed from a certain aspect. The discussion in this article covers urban resilience from the four dimensions of economy, ecology, society, and engineering and is more inclined to the discussion of the macro-city system. However, in the selection of secondary indicators, due to the limitation of data, the selection of indicators is mostly based on the data publicly announced by the state. In addition, the community, policy system [
67], cultural aspects [
68], human quality, and creativity are also important components of urban resilience, but these indicators are not included in the indicator system due to the difficulty of obtaining data. In the future, further research will be focused on the perfection of the indicator system. (3) The research unit of this paper is the county and urban area, and the granularity of the unit is large, so the precision of the research needs to be further improved, and the resilience level of cities can be explored at the community and township levels in the future.
6.2. Policy Suggestions
Based on the above research results, this paper proposes the following policy recommendations: (1) the development of new urbanization should be continuously promoted. Henan Province, as a highly populated and agricultural and new industrial province, exhibits a large gap between its urbanization level and the national level. Therefore, with policy adjustment and environmental improvement, Henan Province should follow the law of urban development, continuously enhance urban planning and spatial design, coordinate urban and rural construction, focus on the mitigation of infrastructure shortcomings, integrate urban–rural development, comprehensively improve public, municipal and educational facilities, and promote new urbanization toward scientific and rationalization. (2) Coordinated development of the region should be strengthened. We should fully manifest the policy role of the regional coordinated development strategy, deepen the integrated development of the Central Plains city cluster, promote the construction of Zhengzhou as a national central city, support the construction of Luoyang as a subcenter city, and establish a model in which the Zhengzhou metropolitan area leads the development of central cities, central cities spearhead the development of city clusters, and city clusters drive coordinated regional development. Moreover, it is necessary to strengthen the exchange and communication between economic, scientific and educational, ecological and other systems; optimize the spatial allocation structure of resources; form a collaborative and cooperative environment at all levels; create favorable conditions for the reasonable flow of various factors and resources; enhance the spatial spillover effects between neighboring regions; and realize integrated regional development. (3) The role of government financial support should be fully manifested. Financial system reform should be deepened, diversification of economic industries should be enhanced, the financial expenditure policy of each city in Henan Province should be adjusted, the positive role of government financial support should be fully facilitated in terms of the resilience of local urban projects, and full protection of urban infrastructure investment should be realized, while any administrative barriers to the flow of production factors should be overcome, economic exchange and cooperation between local cities should be facilitated, and the problems of duplication and vicious competition should be avoided in infrastructure construction between cities. Based on unified and rational planning, the benefits of interregional infrastructure investment and construction services should be maximized. (4) A new highland should be created for the two-way opening of inland areas. Internally, it is necessary to increase market activity, focus on the enhancement of housing, social security, and social services, release the comprehensive purchasing power of the people, and further actively develop online consumption, promote the diversified development of consumption patterns, and stimulate the innovation vitality of the market simultaneously. Externally, Henan Province is an inland province in the Central Plains. Compared to the national average, the openness level of Henan Province to the outside world still exhibits much room for improvement. Therefore, Henan Province should implement a more proactive opening strategy, vigorously develop an inland open economy, strengthen the opening door function of Zhengzhou Airport and other important transportation hubs, promote the construction of the Henan Free Trade Pilot Zone, accelerate the construction of Zhengzhou as a service outsourcing demonstration city, introduce well-known Chinese and foreign enterprises, undertake the transfer of the international service industry, create a comprehensive, multilevel, and wide-ranging two-way open pattern, and accelerate the formation of an inland open cooperation demonstration zone with global influence. (5) The scientific and educational innovation environment should be enhanced, and the innovation ability of the social system should be improved. With structural adjustment, transformation, and upgrading of economic development, innovation could become an important driving force of urban development. Since the improvement in the social system’s innovation ability cannot be separated from the support of government policies, to improve the innovation ability in Henan Province, we should first strengthen the guidance effect of government policies, adhere to the core position of scientific and technological innovation in overall modernization construction, implement the concept of innovation and development, and focus on attracting and cultivating innovative industries. In addition, it is necessary to vigorously develop education. On the one hand, the quality and level of education in Henan Province should be comprehensively improved, and on the other hand, balanced development of education should be promoted. In eastern, western, and southern Henan, where educational resources are relatively scarce, the availability of educational resources should be enhanced. (6) The industrial structure should be adjusted, and optimization and upgrading of the industrial structure should be encouraged. It is necessary to comprehensively consider the market characteristics of the various regions in Henan Province, fully utilize the industrial structure of Henan Province to build an important national food production base, energy raw material base, modern equipment manufacturing and high-tech industrial bases, and comprehensive transportation hub policy support conditions. Based on the objective development of laws, an industrial structure with a reasonable layout and complementary advantages between neighboring regions should be established to form industrial clusters. First, the industrial structure should be scientifically adjusted. The traditional economic model relying on the development of agriculture and heavy industry should be modified, and the new industrial development model led by the tertiary industry should be adjusted and transformed in a timely manner. Second, we should focus on the cultivation of new industries, dynamics and growth poles, and the digital economy, information technology, biomedicine, high-end equipment manufacturing, new energy, new materials, and other strategic emerging industries should be assigned the top priority.


