1. Introduction
Urbanization processes have led to a significant increase in the study of the sustainability of cities [
1], to such an extent that the United Nations has established the objective to make cities and human settlements inclusive, safe, resilient, and sustainable as one of its Sustainable Development Goals [
2]. Similarly, several measurement initiatives have been developed to monitor and compare the sustainability performance of cities around the world.
These urbanization processes have been implemented by means of distinct instruments such as plans, policies, or programs devised by the authorities of each nation. Indeed, countries have gradually incorporated sustainability objectives into national legislation over time in an effort to recognize the interactions between the different uses of land and their effects on the environment. This has traditionally been carried out via Environmental Impact Assessment or, in recent decades, Strategic Environmental Assessment [
3,
4,
5,
6]. Strategic Environmental Assessment (SEA) aims to ensure that sustainability considerations are taken into account during strategic decision-making processes [
7], including those related to urban planning.
SEA has been incorporated by different nations using distinct approaches [
8], in order to improve the evaluation of environmental and sustainability implications of national plans, policies, and programs. To fully meet the subsequent objectives, it is essential that all consequences of the decisions taken are crosschecked against the perceived effects and, in the process, ensure that impacts are minimized [
9]. Accordingly, the SEA framework could directly contribute to the achievement of its stated objectives if it were to incorporate a monitoring model to evaluate whether the stated objectives have been achieved. It would also allow for the publication of the results of the executed processes [
10] and help facilitate the corresponding changes required.
Under the SEA monitoring model, indicators are considered an essential component for the implementation of the sustainability concept [
11]. This is because they facilitate the assessment of current conditions, the monitoring of trends in certain conditions over a period of time, and the anticipation of hazardous conditions that may arise in the future [
12]. Overall, indicators are recognized as fulfilling a critical role. For example, they provide information about the progress of proposed sustainability objectives, such as in the case of the resource Key Environmental Indicators for Ireland [
13], and prove highly useful in influencing public opinion and authorities to call for and adopt the most appropriate measures [
14] with regards to fulfilling relevant objectives.
However, the way indicators are incorporated into the SEA framework will affect their performance. Chile incorporated the SEA system in 2010 and established that all national land-use- and spatial-planning instruments must be subject to the assessment framework as part of the broader evaluation process [
15]. The objectives were multiple: to incorporate environmental considerations of sustainable development into the design and implementation of general regulatory plans, policies, and programs that impact on the environment or sustainability processes; to ensure the integration of such considerations within the respective plan, policy or program including any subsequent amendments or modifications thereto; and to detect any potentially adverse environmental effects associated with, or that may result from, a particular plan, policy, or program, and thus facilitate the mitigation of such effects in order to prevent subsequent and/or cumulative environmental impacts [
16].
Internationally, since the 1960s and 1970s, environmental impact assessment has been utilized to incorporate the environmental variable into the decision-making process of certain policies, plans, program, and, in particular, investment activities or projects [
3,
4,
5,
6]. The limitations of EIA, as recognized [
17,
18], led to SEA, considered to be the appropriate route for identifying—in a formalized assessment process, at an early stage—the environmental impacts of decisions made at a policy, plan, and program level [
4], and a tool that makes it possible to link the degradation of nature with the sustainable development objectives of poverty reduction [
19], as well as recognizing its influence on the choice between development alternatives during the early phases of decision-making. In other words, SEA can facilitate a proactive approach in order to ensure that environmental and sustainability considerations are taken into account during the initial phases of a strategic decision-making process [
7]. Prior to the incorporation of the SEA framework, planning instruments were evaluated under the
Sistema de Evaluación de Impacto Ambiental (Environmental Impact Assessment System). Under this system, official reports argued that land-use and spatial-planning instruments failed to prevent environmental pressures caused by changes to the way in which land was utilized. Problems that were frequently highlighted included uncontrolled urban sprawl and the construction of factories in environmentally sensitive areas or locations vulnerable to natural disasters. Consequently, authorities proposed the incorporation of the SEA instrument [
20].
At present, land-use- and spatial-planning instruments in Chile that establish regulations applicable to the use of land are restricted almost exclusively to the urban context. In addition, their legal objective is to guide and regulate the development of urban areas according to a national, regional, and municipal-level policy of socio-economic development. Urban planning is executed at three levels: national, inter-municipal, and municipal, with the latter two being obligatory. Chilean legislation stipulates that urban planning at the municipal level should promote the harmonious development of the local area, particularly of the most populous districts, in accordance with the regional goals of economic and social development. Municipal-level urban planning is executed by means of the Plan Regulador Comunal (Municipal Regulatory Plan), or PRC (by its Spanish acronym).
As per Chilean regulations, both the PRCs and their substantial modifications must be submitted to SEA in order to ensure the incorporation of sustainable development considerations, i.e., environmental objectives and impacts and sustainable development criteria. As determined by
Decreto Supremo (Supreme Decree) 32 issued by the Ministry of Environment (MMA), the administrative procedure that concludes the SEA process must identify the monitoring indicators required to regulate its effectiveness. This refers to the elements of analysis required to understand and evaluate the potential outcomes of the implementation of an urban plan submitted to SEA for approval. In addition, the MMA devised a guideline which recommended that all indicators to monitor the effectiveness of the plan should also stipulate the fulfilment of the proposed environmental objectives outlined therein [
21]. The guideline stated that the purpose of environmental monitoring of land-use- and spatial-planning instruments is to establish the extent to which the environmental objectives formulated in the SEA procedure are met [
21]. In 2015, the MMA published a new guideline for the use of SEA in which it stated that indicators should be quantitative or qualitative, and not descriptive but indicative. This guideline also established criteria for the development of indicators in line with recently published research on the subject [
22]. In the same year, a further guideline for incorporating an environmental dimension within sustainable land-use- and spatial-planning processes was published, which comprises a list of recommended indicators [
23]. The aforementioned outlines the set of conditions devised by authorities for the design and development of indicators, in which only one is mandatory for the authorities responsible for overseeing the process (that established by Supreme Decree 32).
Over a decade after the implementation of the SEA instrument in Chile, now is an opportune moment to review the indicators used for municipal-level urban planning under the SEA framework. This review will help to identify the most important lessons learned and devise best practice moving forward for future indicator-based assessments. With that in mind, this study sought to evaluate two main aspects. First, whether the authorities mandated to implement the SEA of PRCs are fulfilling their responsibilities to include indicators and, simultaneously, monitor environmental conditions that may be affected by the Plans in order to anticipate potentially adverse environmental impacts generated. Second, to identify the particular aspects of sustainable development on which the indicators used by PRCs during SEA focus.
It should be noted that there is an absence of a standardized set of indicators within the Chilean SEA framework. To conduct this study, it was therefore necessary to follow objective criteria devised by relevant third-party classification instruments to assess whether SEA has successfully contributed to the incorporation of environmental considerations of sustainable development in land-use- and spatial-planning instruments. Consequently, two classifications of indicators used at the international level to measure sustainability in cities were applied. The first was the Pressure–State–Response (PSR) model utilized by the Organisation for Economic Co-operation and Development (OECD). The PSR model distinguishes between sets of indicators of environmental pressures (direct and indirect), environmental condition (state), and society-wide response [
24]. This framework was adopted by OECD countries in the 1970s and member states continue to view it as a robust and useful model since it has provided continuity to the development of distinct sets of environmental indicators since its inception [
25]. The PSR indicators can be used to evaluate the pressures of human activities on the state of the environment and provide policy responses to achieve a so-called “desirable state”. This approach has recently been extended to social, institutional, and economic dimensions [
26]. It also has the advantage of being one of the most straightforward frameworks to understand and put into practice, as well as being neutral in the sense that it defines what linkages exist, rather than whether these have positive or negative impacts. Depending on the purpose for which the PSR model is used, it can be easily adjusted to take account of greater detail or specific characteristics. It should also be noted that Chile places great importance on being a member nation of the OECD and it should therefore consider this latter model as a point of reference for developing sustainability and/or environmental indicators moving forward.
According to Ji [
27], the OECD PSR classification is one of the most famous worldwide, in particular its conceptual framework that has in turn influenced similar activities in several countries and international organizations (United Nations Commission for Sustainable Development (UNCSD), the United Nations Environment Program (UNEP), the World Bank, the European Union (Commission of the European Communities, Eurostat, the European Agency for the European Environment Agency) and with a number of international institutes including non-OECD countries [
28]. The PSR classification model can be used to determine whether the indicators applied in the Chilean SEA of PRCs relate more to pressure, state, or response. To clarify, indicators that relate to pressure focus on aspects that PRCs seek to modify (a current pressure that is exerted and which PRCs seek to alter). Those that relate to state assume a role of monitoring the current state of (environmental) conditions at the time of PRC adoption or modification. Those that relate to response aim to understand whether the effects sought by PRCs have been established.
The second classification system used by this study corresponds to International Standard 37120 emitted by the International Organization for Standardization (ISO), called ‘Sustainable development of communities—Indicators for city services and quality of life’. The Standard used in this study relates to its first edition that was published in 2014, also known as ISO Standard 37120:2014. It is the first international standard for indicators on cities [
29] and its origins go back to a research project financed by the World Bank on development indicators for Latin American cities. It currently has empirical applications [
30,
31]. In addition, it has allowed a global registry of data reported by different cities in the world that have applied the standard [
32].
This Standard developed a set of 100 indicators for 17 sectors or areas (see
Table 1) including urban planning, environment, energy, solid waste, wastewater, and transport, among others. The Standard establishes a selected set of indicators that provide precise definitions to facilitate the measurement of city performance across a range of indicators [
33]. As such, it is considered a serious attempt to compare and contrast cities [
30]. ISO developed the Standard in order to provide clear recommendations on what and how to measure. The main objective of the model itself is to assist city authorities to measure the performance management of their municipal services and the quality of life of their residents over time. This includes facilitating learning from one city to the next, enabling comparisons to be made across a wide range of measurements, and for the sharing of best practice in general [
34].
By means of this classification, the present study sought to determine whether the indicators used in the Chilean SEA can be adjusted to any of the 100 indicators proposed by the aforementioned ISO Standard 37120. Such an approach would help to identify whether the authorities mandated to implement SEA of PRCs focus on any of the 17 areas of sustainable development established by the Standard.
The primary aim of this study was to learn lessons about current practices in the use of applied indicators at municipal-level regulatory plans submitted to SEA in Chile. The objective also included identifying whether the authorities responsible were monitoring the state of the environment during plan implementation, which would thus enable them to prevent adverse environmental outcomes, in addition to evaluating which areas of sustainable development were being considered in those indicators applied.
2. Materials and Methods
This study compiled a set of indicators to monitor the effectiveness of the plan deployed via the framework of the SEA of the PRCs. In order to understand which land-use- and spatial-planning instruments have been subjected to SEA, the MMA maintains an updated register which can be accessed in different formats on its official website: eae.mma.gob.cl
As part of the study, an MS Excel spreadsheet was downloaded (see
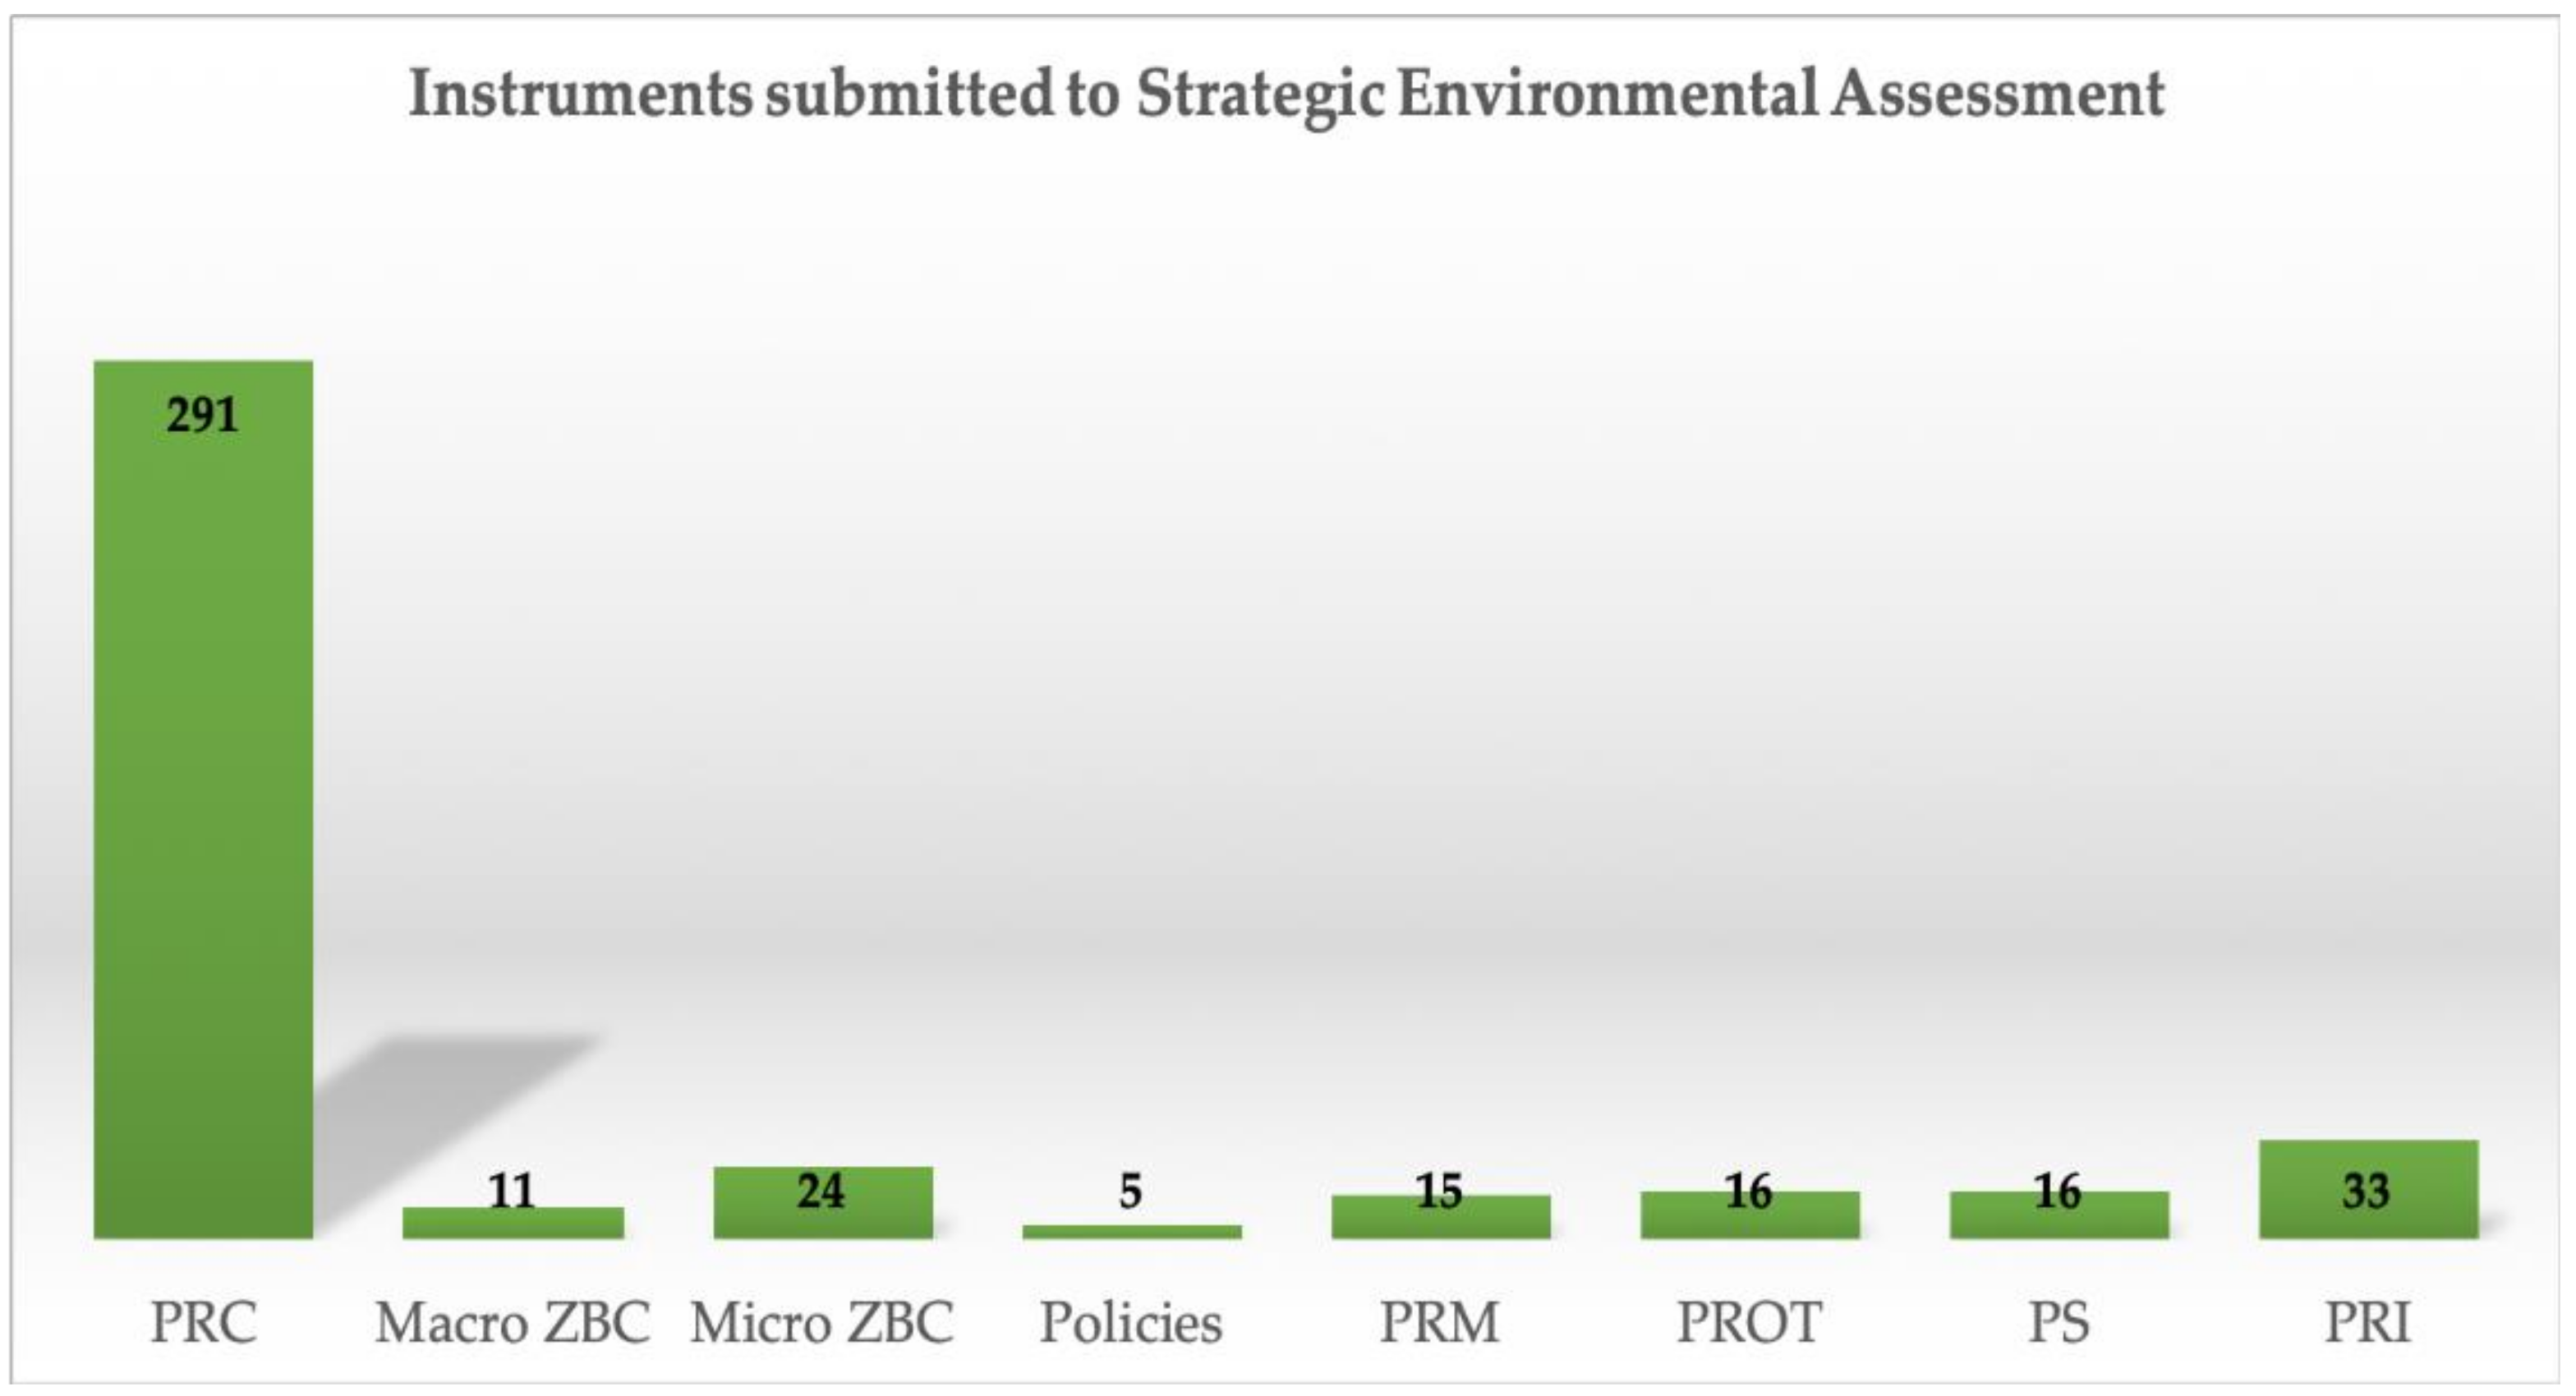
File S1 in Supplementary Materials) which provides a full register of the instruments submitted to SEA, including district-based policies and zoning plans, inter-municipal regulatory plans or PRCs, and others at distinct stages of the SEA process. The register contains information pertaining to 411 instruments submitted to SEA from when the system entered into force in 2010 until 1 March 2021 (the date on which the latest version of the register was downloaded).
By means of the first filter process, of the 411 instruments submitted to SEA, 291 relate to PRCs, i.e., 71%. A breakdown of the register is provided in
Figure 1.
A second filter was then executed, which yielded the following results: of the total number of PRC instruments, only those that had successfully overcome two of the key procedural stages were considered. These two stages are the
resolution of termination and
resolution of approval of the instrument. The
resolution of termination is issued by the authority responsible for the PRC (this generally relates to the respective municipality). The role of this authority is to finalize the SEA approval stage of the PRC, including emphasizing that all stages and requirements for such assessment have been fulfilled [
35]. The
resolution of approval is issued by the respective authority responsible and its role is to ensure that, by means of the resolution, the PRC is deemed to be in force. Therefore, the difference between the two procedural stages is that the
resolution of termination declares that the SEA of the PRC process has been concluded, while the
resolution of approval of the instrument stipulates that the PRC itself has been approved. Consequently, once the instrument has completed these steps, one of which is the SEA process itself, it has thus fulfilled all procedural stages necessary to enter into force. Since both procedural stages apply to the indicators, in the event that one was not identified by the
resolution of approval, the
resolution of termination was reviewed. These particular procedural stages were selected because they emphasize how the SEA of PRCs is not subject to any subsequent modifications with respect to the indicators used, since no further revision or observation stages remain.
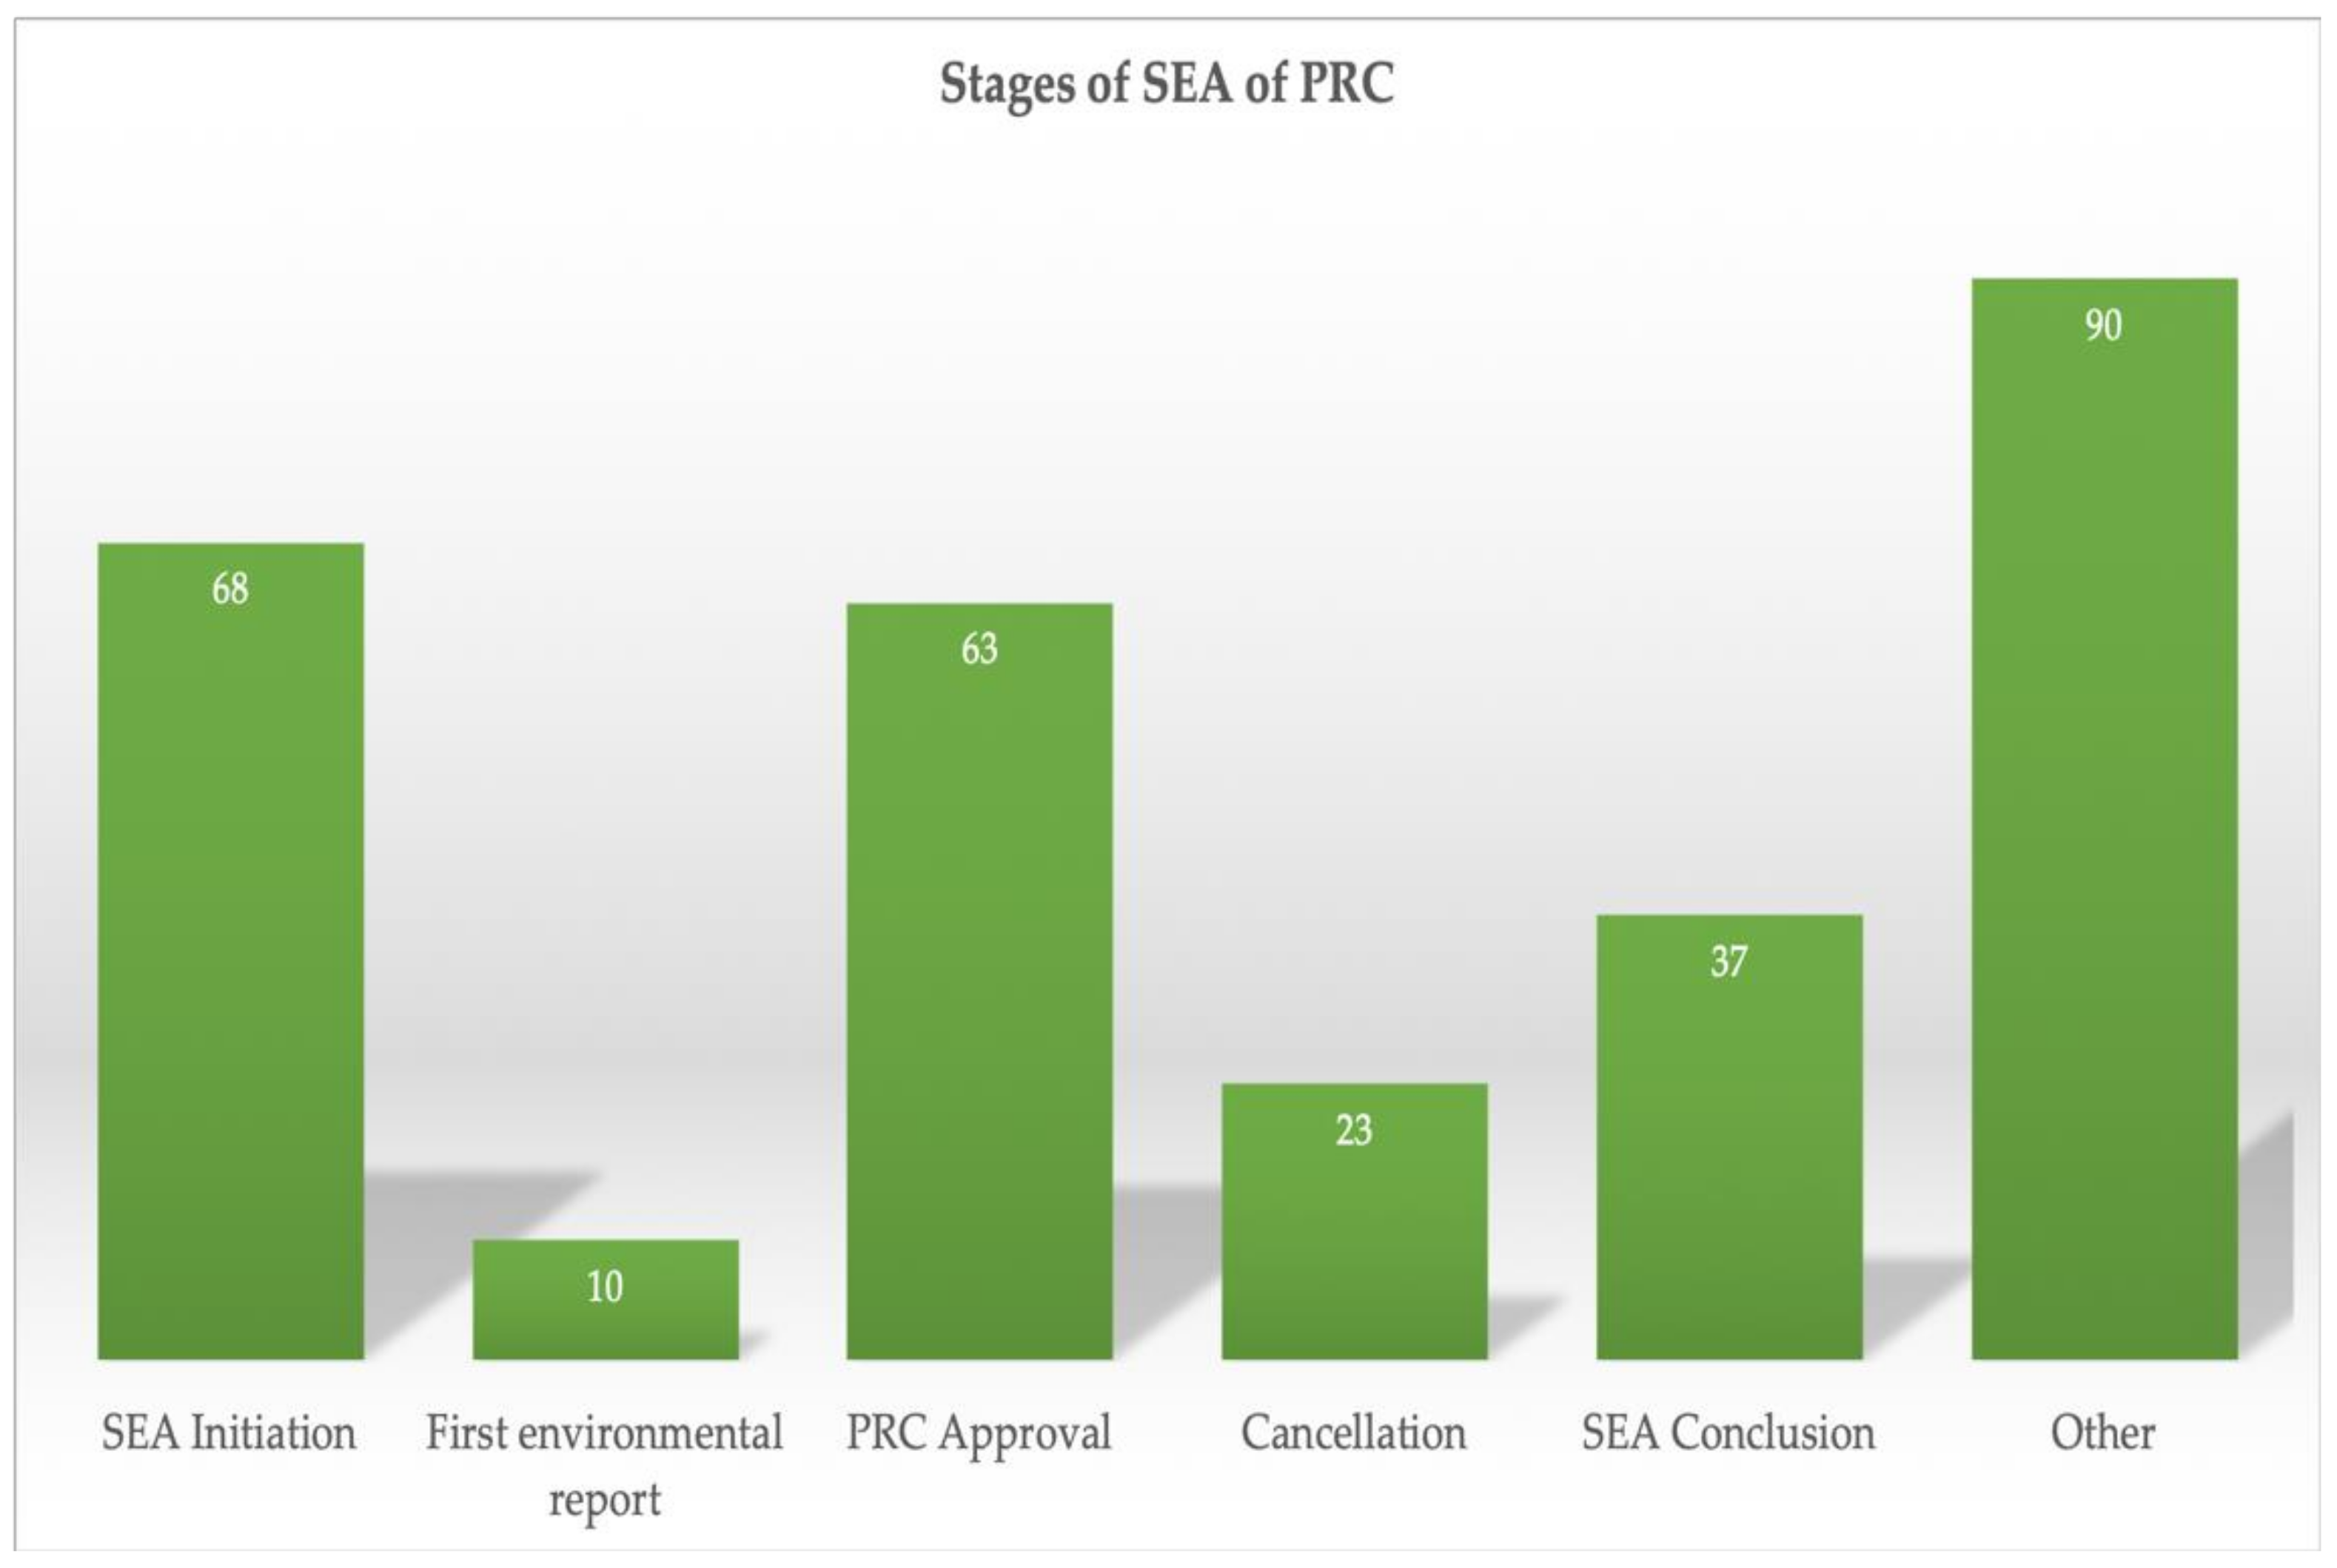
The application of this second filter shows that out of the total number of PRCs submitted to SEA (291), 100 had reached the
resolution of termination and
resolution of approval stages in relation to the period studied (
Figure 2).
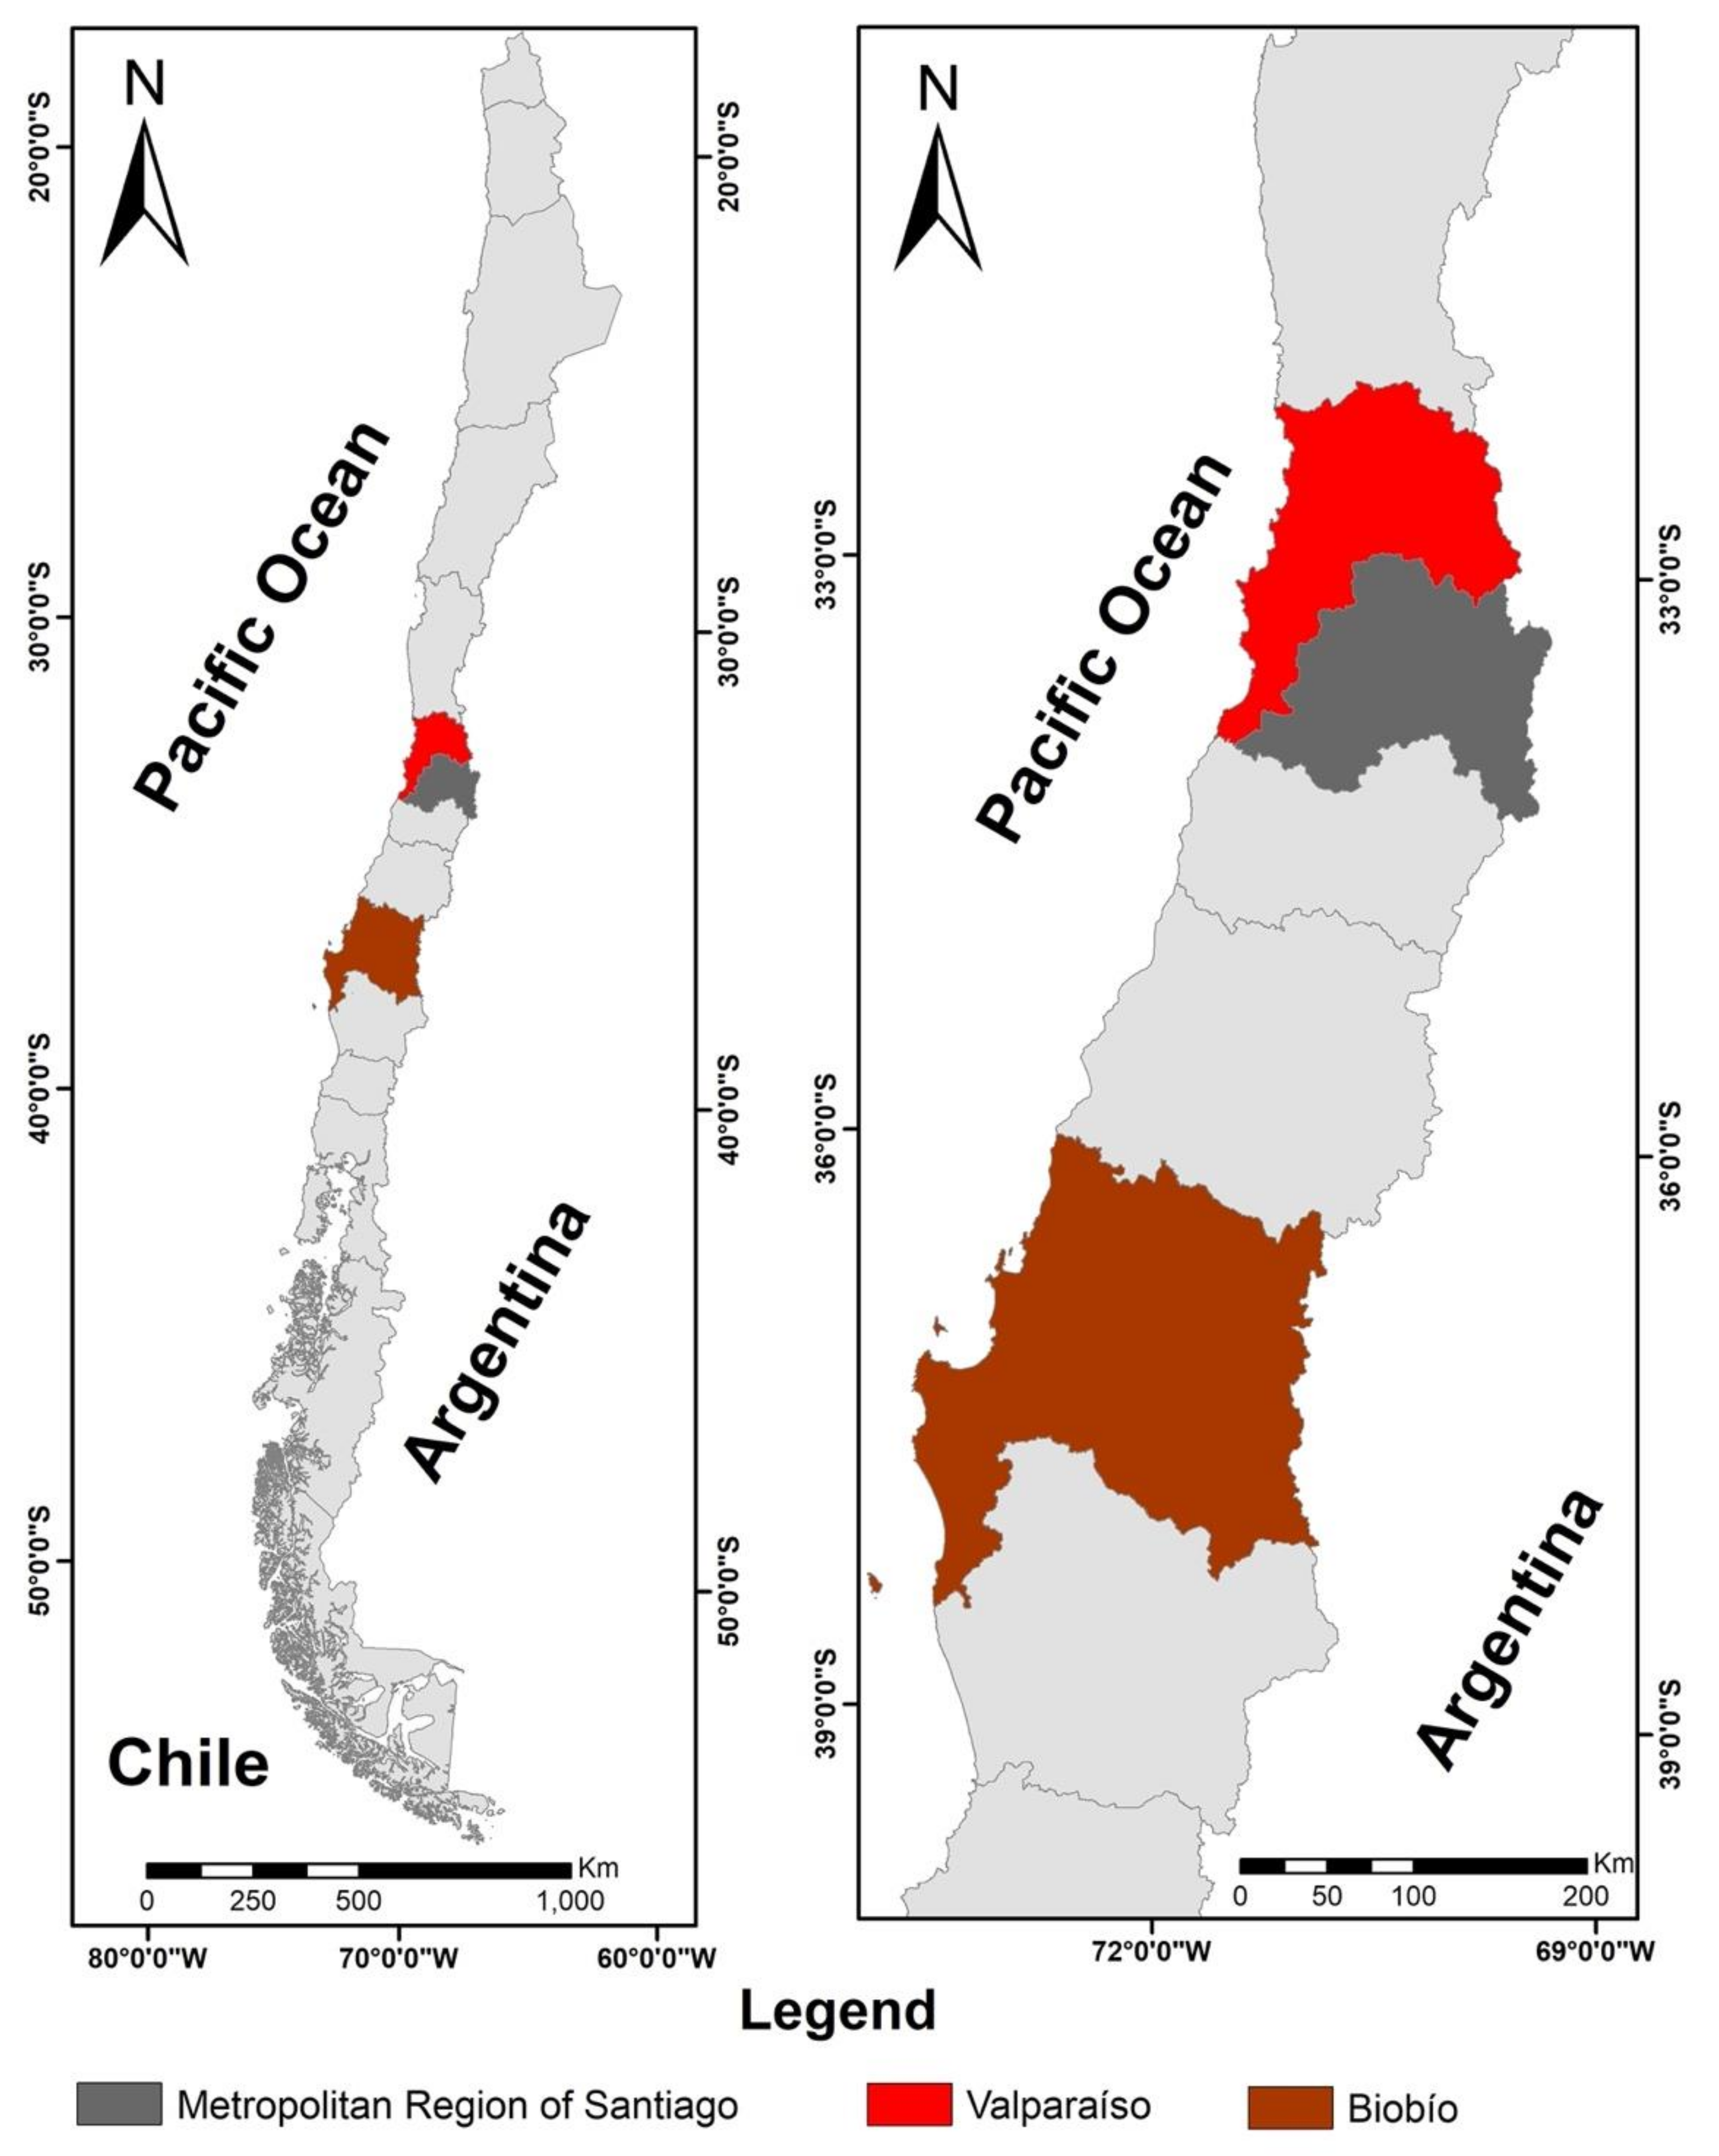
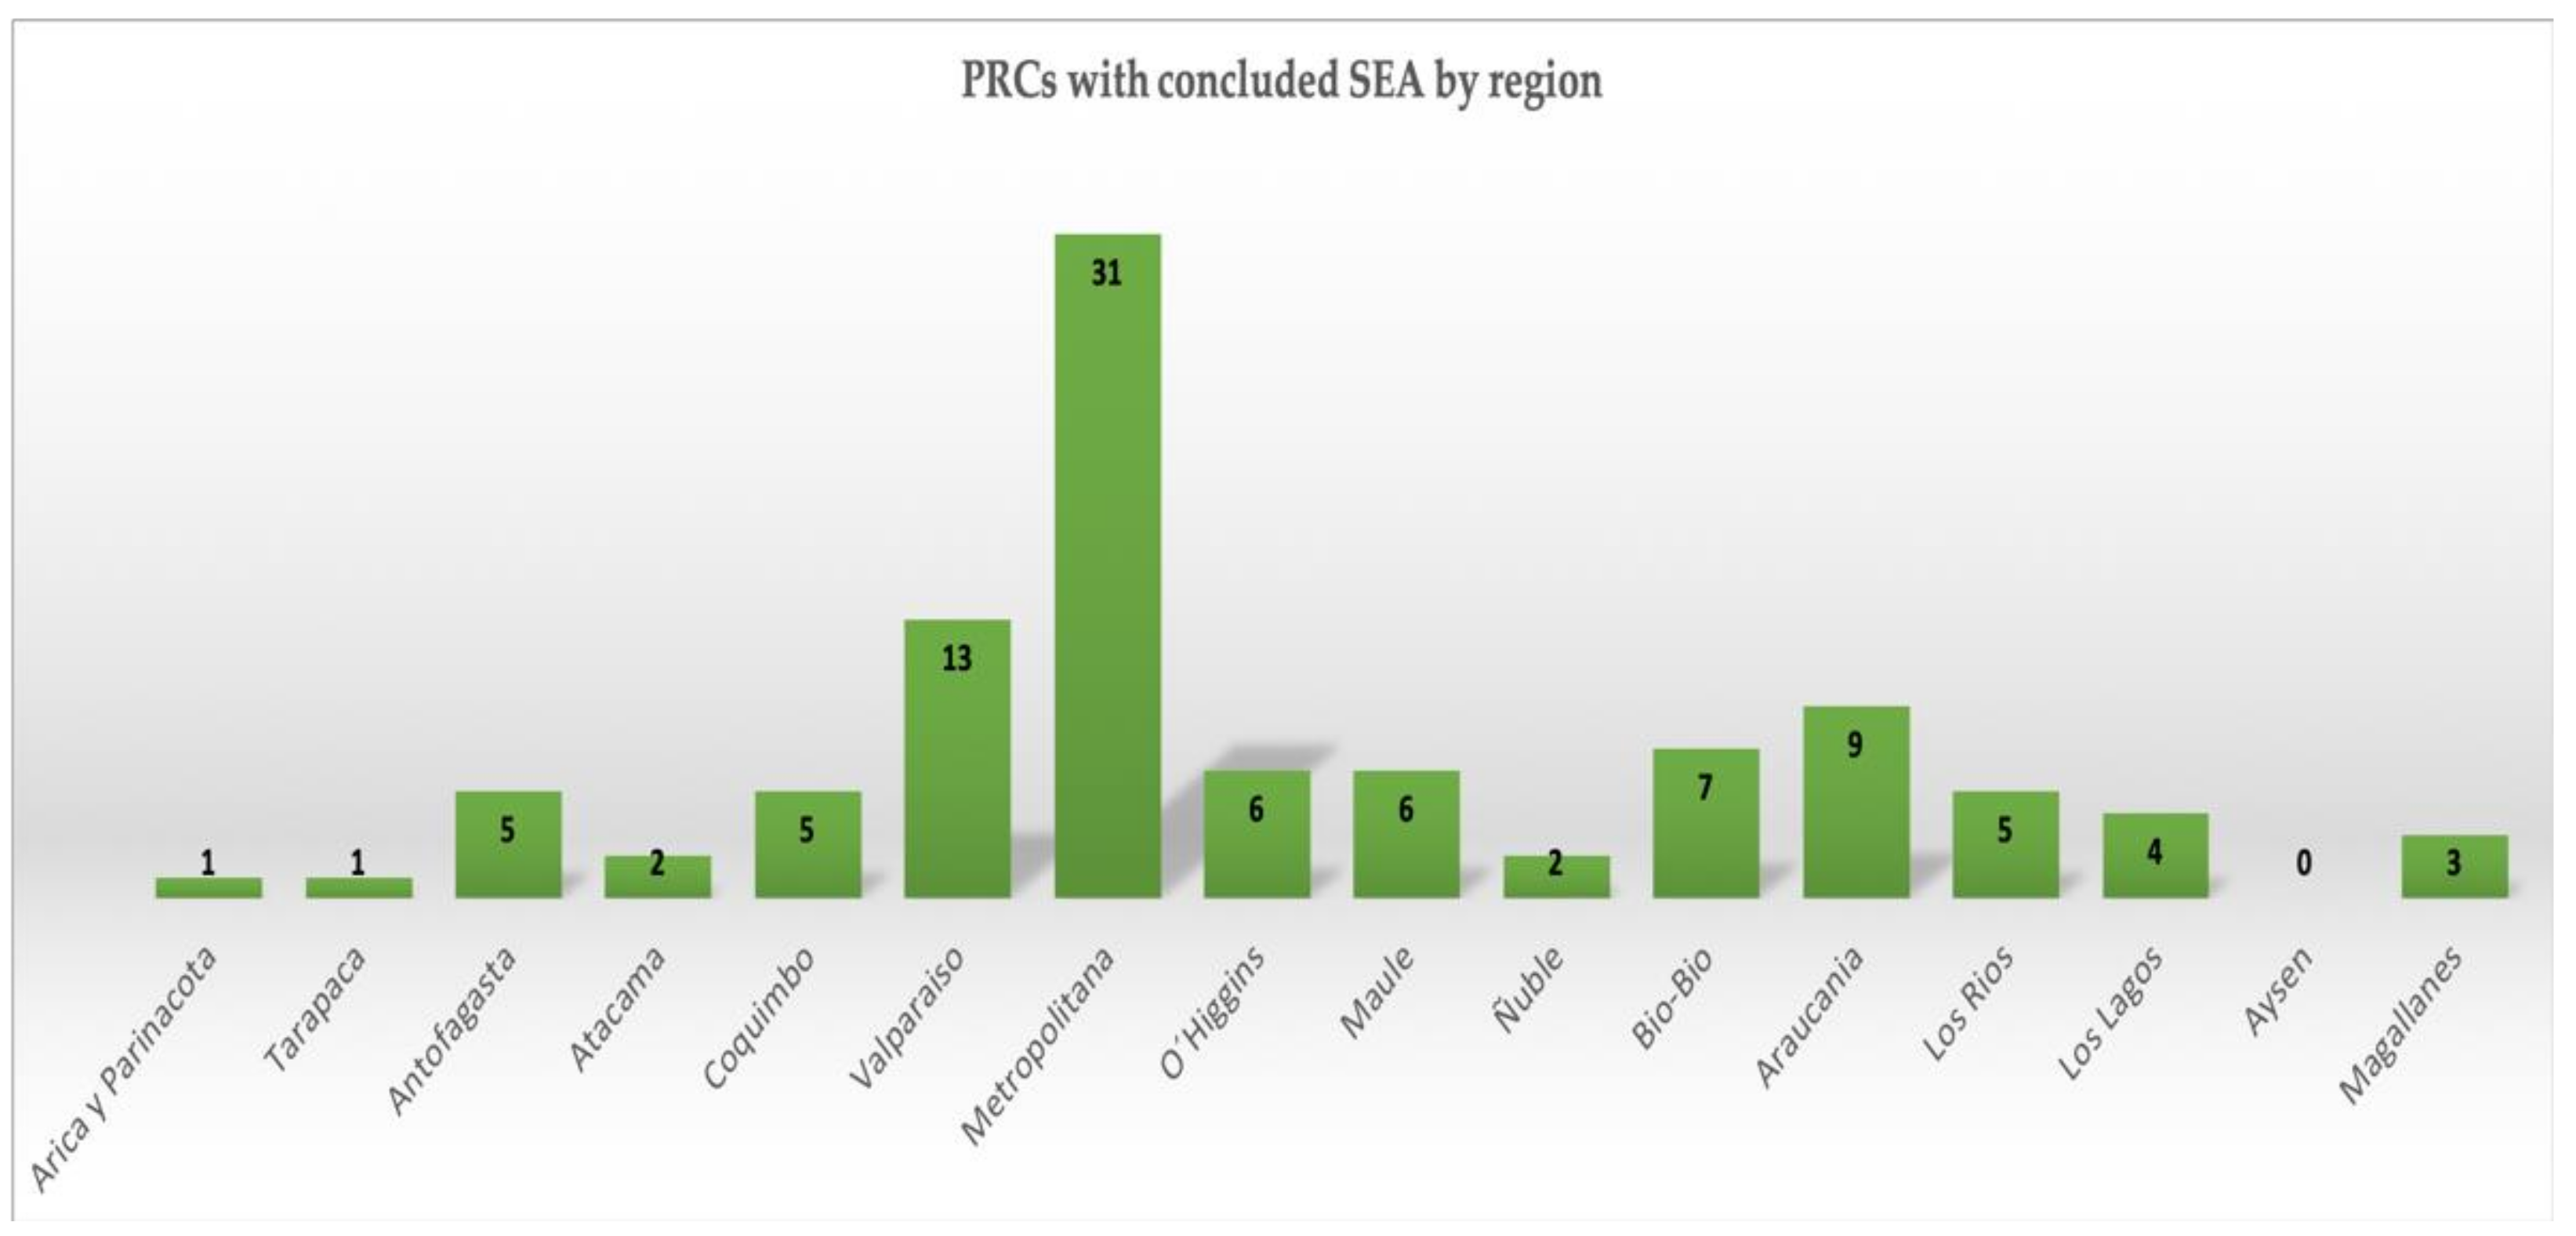
The population of Chile is primarily concentrated in the Metropolitan, Valparaiso, and Biobio regions (see
Figure 3 and
Table 2) [
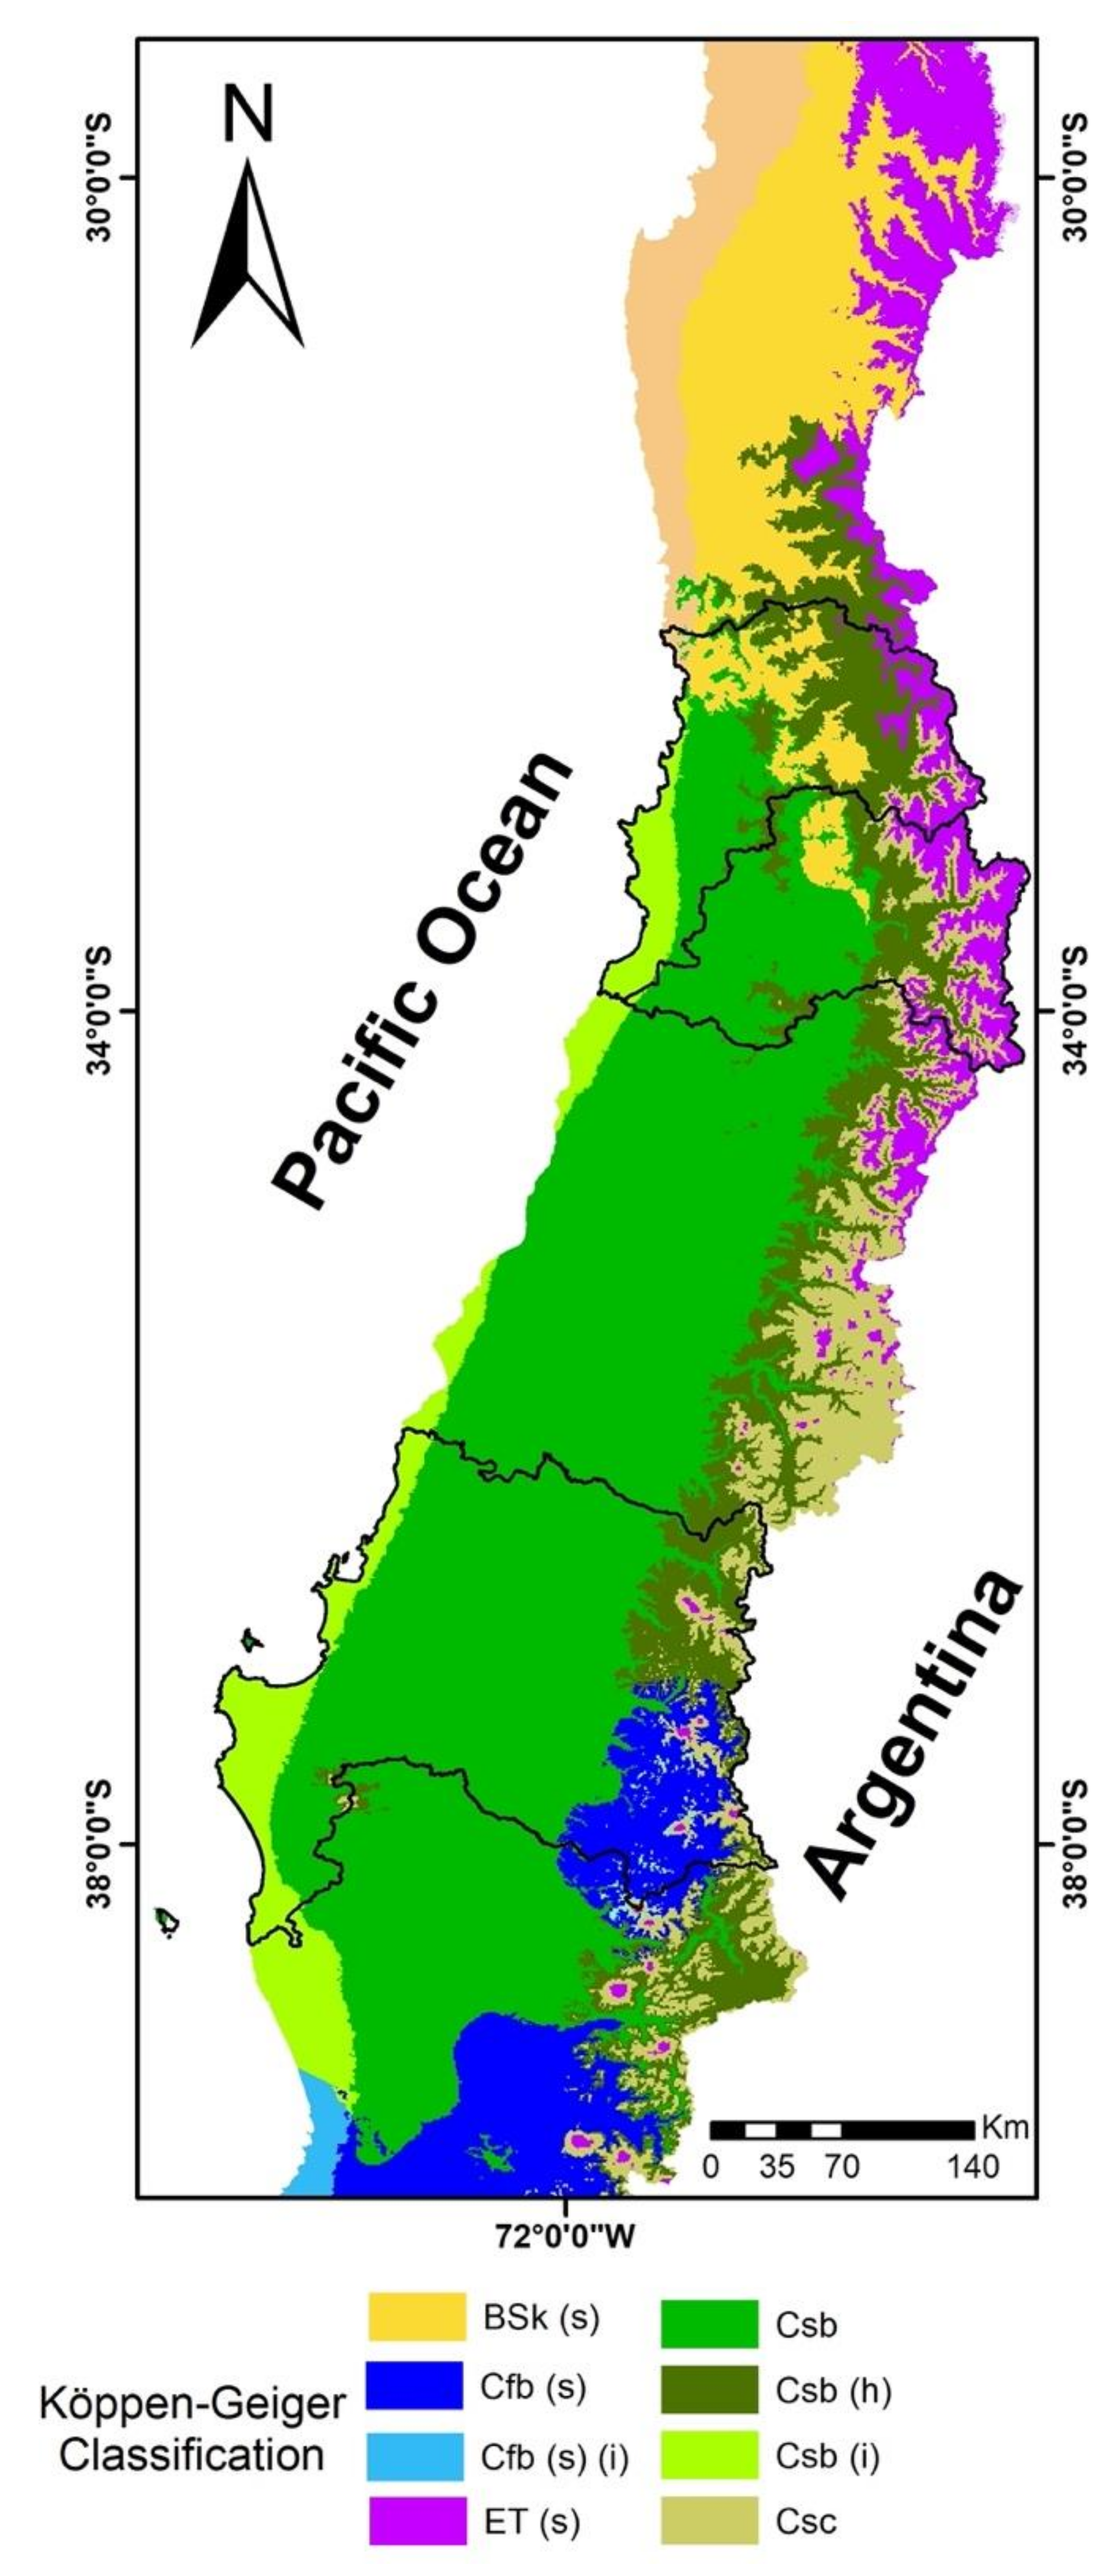
36]. Furthermore, the high concentration of urban centers in these regions is located geographically in and around an area defined as having a Mediterranean climate (
Figure 4). This area is recognized as a biodiversity hotspot for both the endemic nature of its flora and fauna and the threat to their collective conservation [
37]. Accordingly, only the PRCs issued in these three regions have been considered for this study, and this geographical selection represents the third filter of this research. The Mediterranean climate in this area of Chile is extremely fragile and, therefore, urbanization can cause severe and critical impacts on the local environment due to the existence of high levels of pollution, soil sealing, increased runoff and other associated risks [
38].
By applying this third filter, a total of 51 PRCs were identified in the aforementioned stages in relation to the three most populous regions in the country (
Figure 5).
Subsequent to the selection of the three aforementioned regions, the resolutions of terms and the resolutions of approval of each PRC were reviewed in order to identify the environmental-monitoring indicators used in the SEA framework, a legal requirement for the approval of the respective PRC. Having identified the indicators, each one was subject to the classification process. This was executed by selecting each indicator in turn and contrasting it with the PSR-based criteria from the OECD and the indicators pertaining to ISO Standard 37120.
3. Results
A total of 300 environmental-monitoring indicators were obtained from the 51 PCRs related to the three regions analyzed in this study. Each individual indicator was noted down in line with the submissions made by the relevant authority responsible during the SEA process (See
File S2 in Supplementary Materials).
It should be noted that the results show a high dispersion of indicators. This reflects the fact that each authority is responsible for establishing its own indicators.
3.1. Classification by OECD-PSR Model
The framework proposed by the OECD classification bases its indicator typology on what is being observed by that indicator. A pressure indicator seeks to answer the question “why is something happening?”, i.e., to assess the range of pressures or actions exerted by human activities A state indicator is designed to answer the question “what is currently happening in the environment?” and thus seeks to record trends in the biological or physical conditions of the natural world. A response indicator collects information associated with the actions taken to bring about the expected change, and therefore seeks to answer the questions “what will be done to bring about change?” or “what has been done to bring about a certain outcome?”
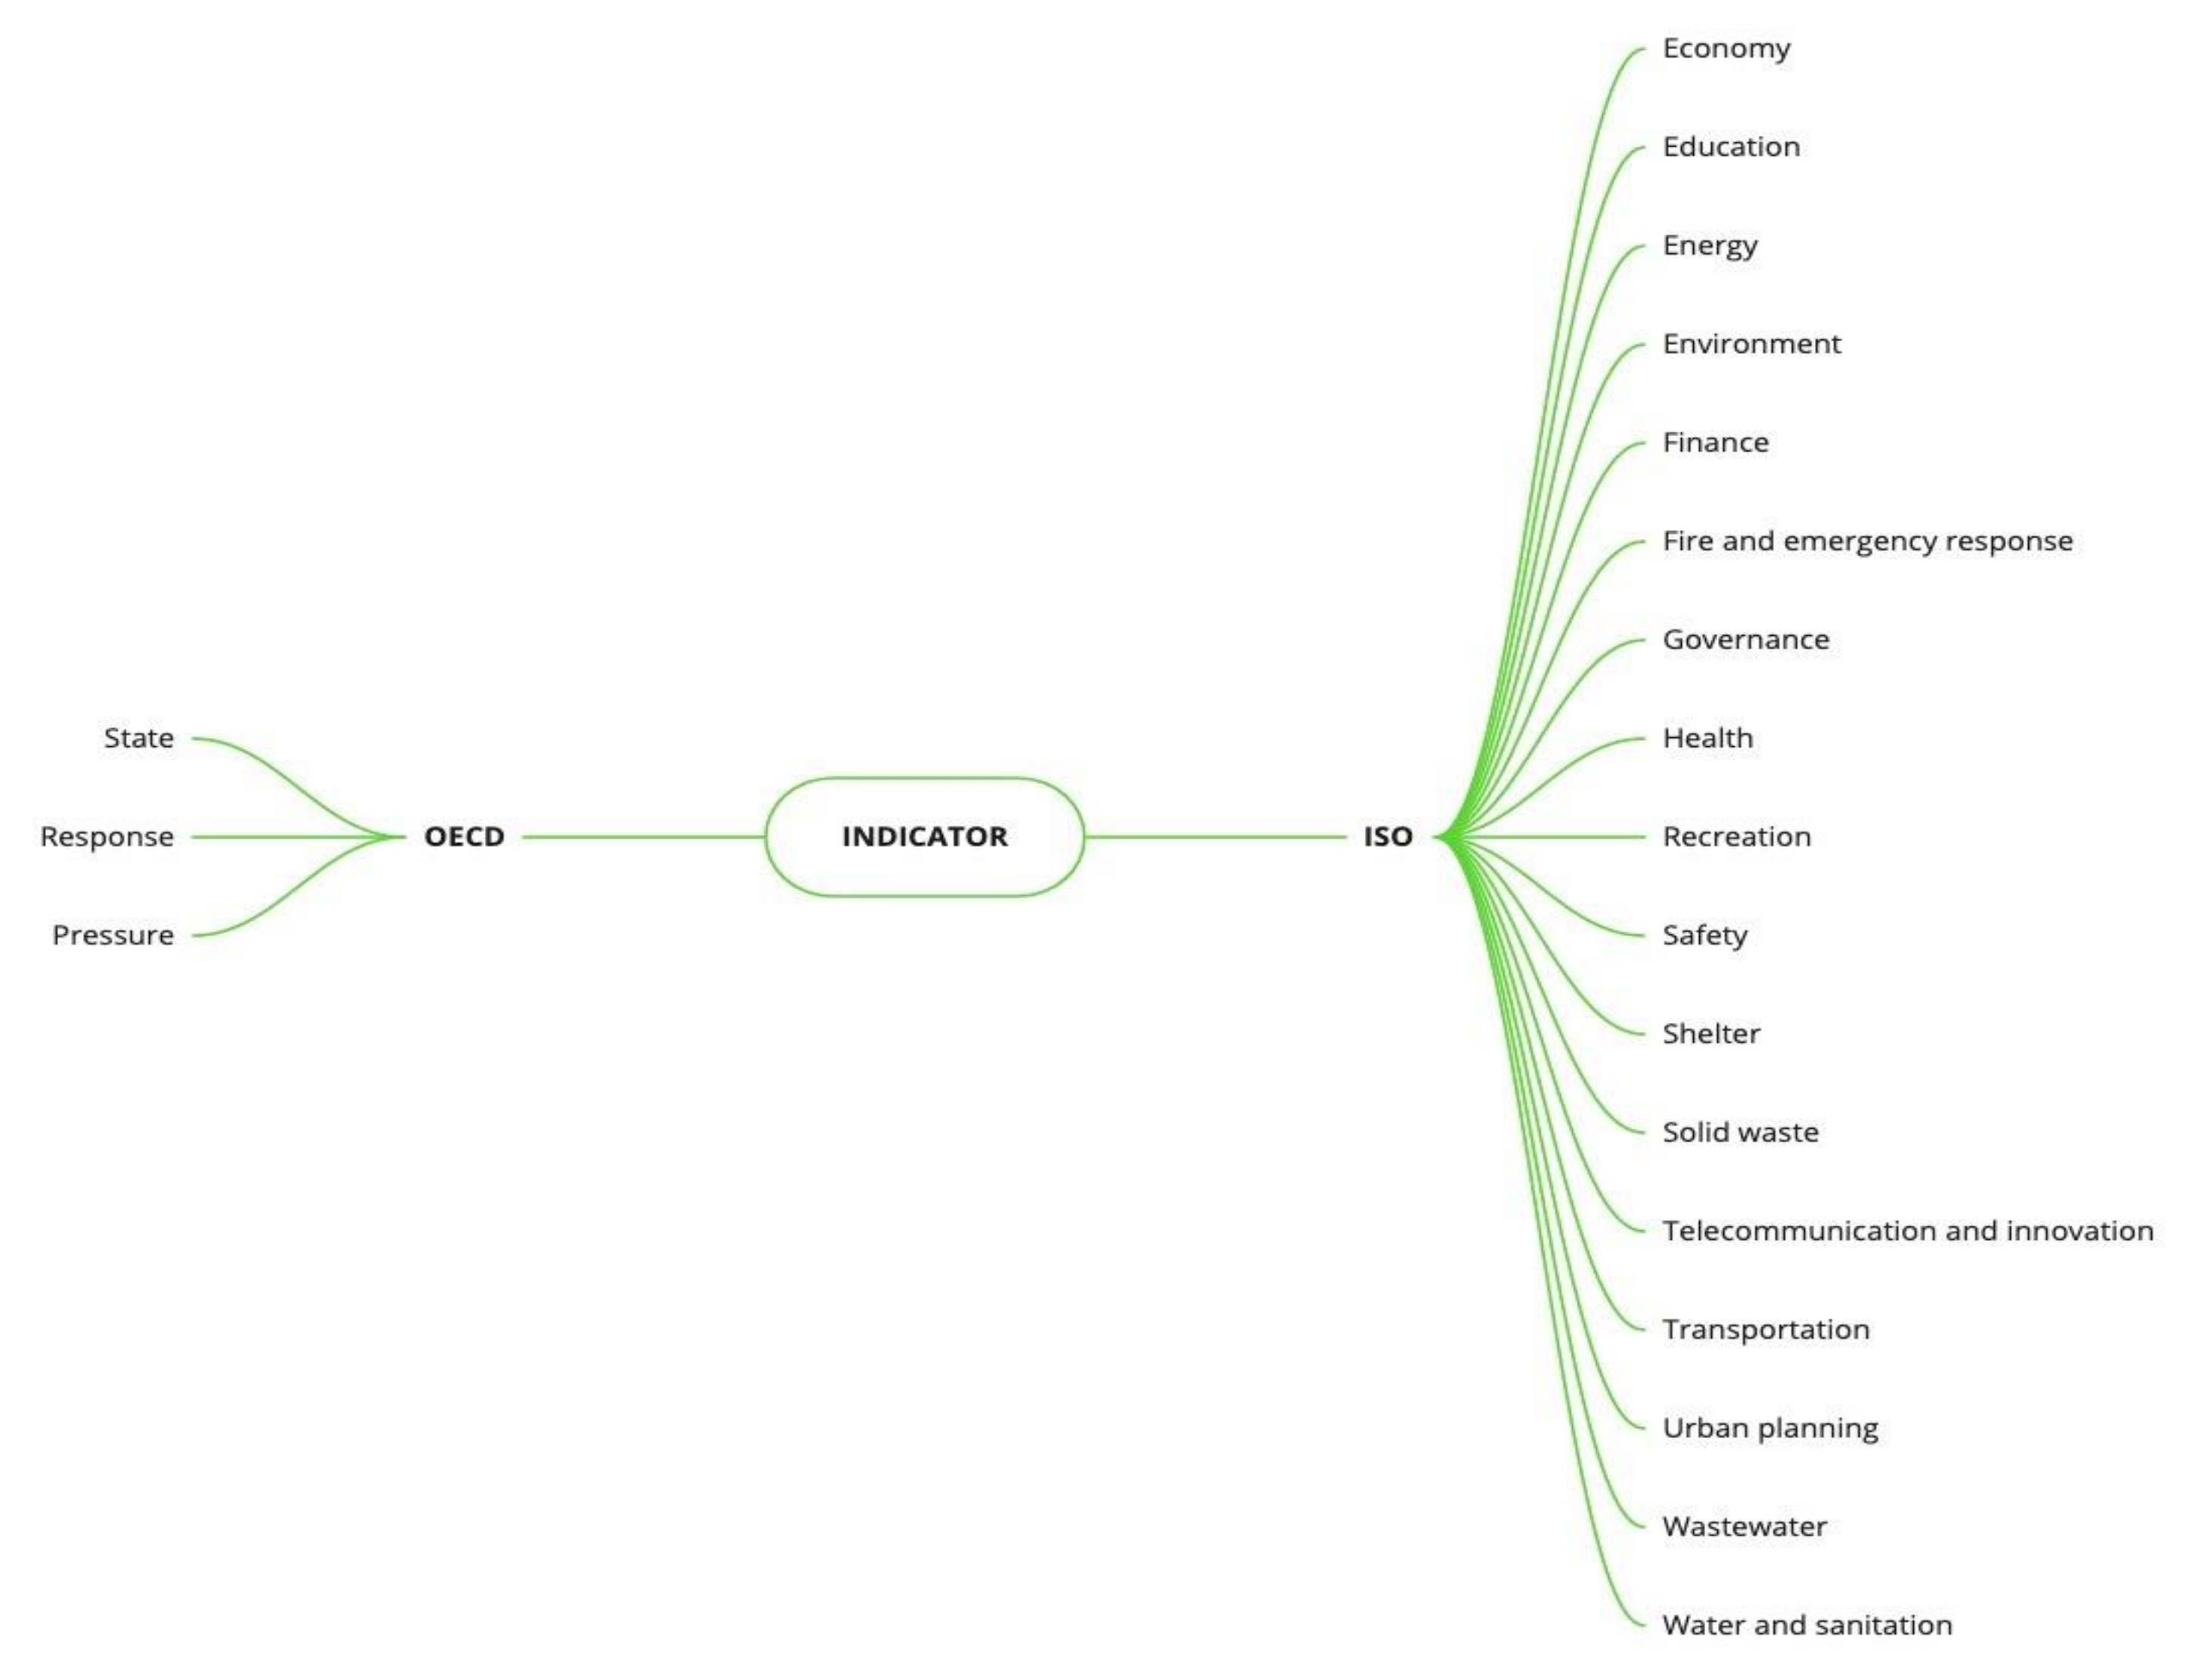
The review of the 300 indicators was conducted individually by each author of this study, through a qualitative analysis of the indicators collected by applying the conceptual tools that the PSR and ISO classification has elaborated (
Figure 6). In cases of disagreement, the final results were agreed on by consensus. Qualitative data analysis was used in cases with a large amount of data obtained from practical experiences (such as the 300 indicators used by the Municipalities in PRC) [
39], since it allows interpretations and conclusions. Due to dispersion of indicators, this qualitative analysis had the following stages: first, recompilation of the database (review PRCs submitted to SEA); second, transcription of data (
File S2); third, codification of data trough conceptual tools made by the OECD and ISO; and finally, classifying registered indicators according to those international categories [
40].
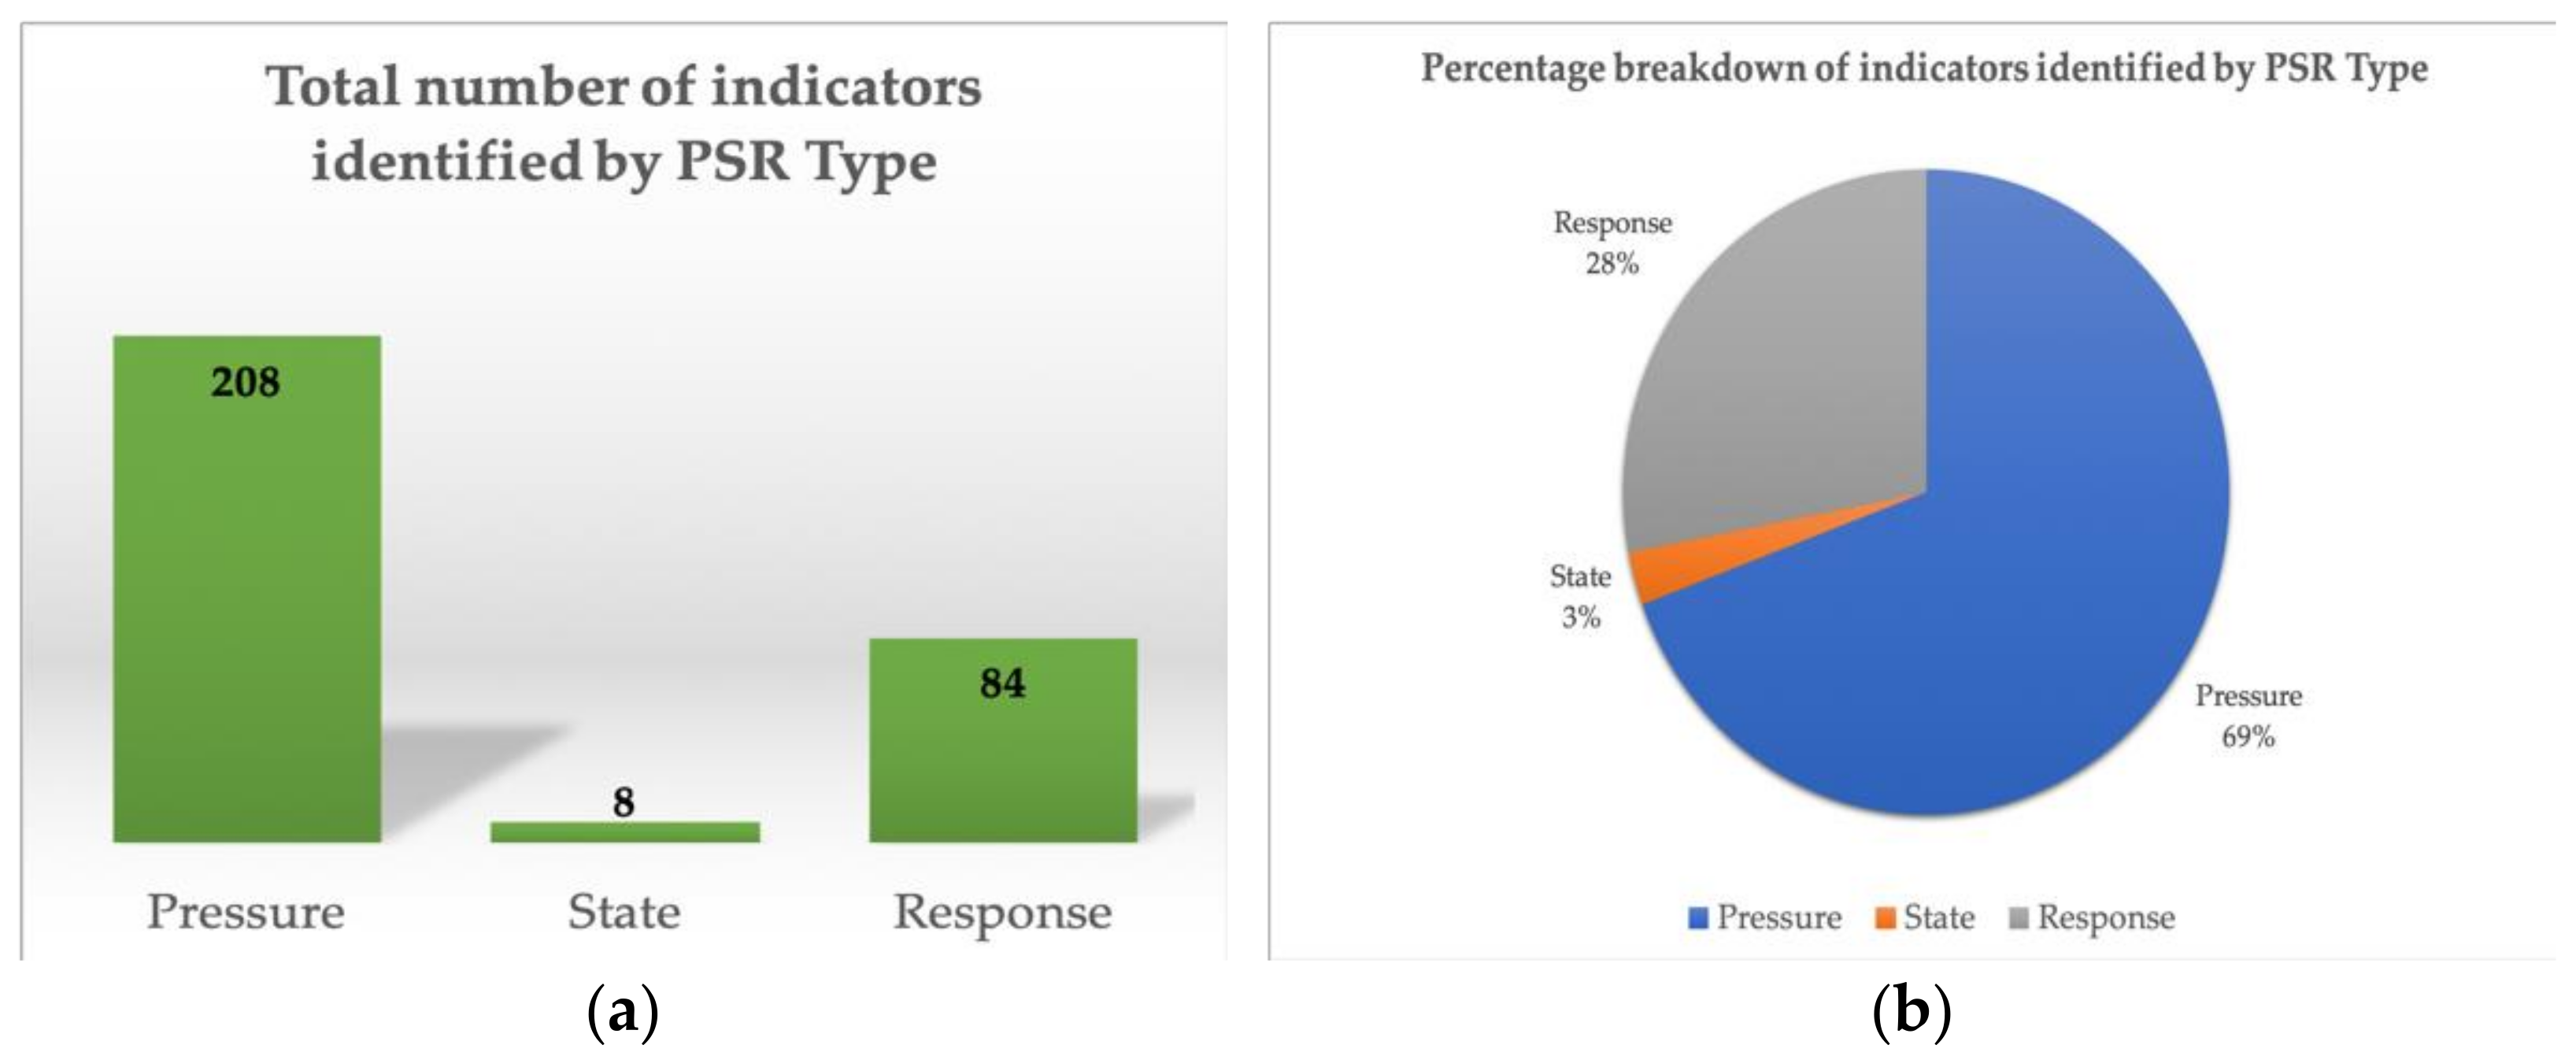
The review shows (see
File S3 in Supplementary Materials) that over 69% of the 300 indicators used in the study area focus on the pressure-type indicator (see
Figure 7), i.e., the different forms of pressure or action that will be generated by the PRC. Consequently, the indicator used focuses on the type and/or extent of that pressure. For example, the indicators identified in this regard include those related to: equipment and public-area projects implemented in municipal parks; decreasing the housing deficit; increasing basic and intermediate-level housing in the local area; percentage of building permits for certain areas of interest to the PRC; percentage of expropriated or consolidated roads affected by a declaration of public utility; and surface area (in square meters) of green and recreational spaces developed in the earmarked areas, among others.
A smaller number of response indicators were identified, representing 28% of the total. These indicators focus on actions due to be implemented via the PRC, including: restrictions to new lakefront developments and the commissioning of protected coastal zones to ensure the environmental recovery of lakes; commissioning of land areas that constitute the system of green spaces; public spaces and municipal parks; construction of housing projects; selective waste collection; use of areas of natural value for research purposes; construction of bicycle lanes; use of adjacent green spaces; consolidation of areas for recreational and public use; and the definition of waste-management plans for disused sites, among others.
As previously noted, the state indicators aim to record trends in the biological or physical conditions of the natural world. Overall, eight such indicators were identified, representing 2.66% of the total. These include indicators related to the following: greater rainwater infiltration capacity according to land use; measurements of air pollutants and compliance with air-quality standards regulations in cities; air quality measured by particulate matter and emissions from mobile sources; existing infiltration surface in square meters (greenfield sites and brownfield sites) assessed periodically; number of floods in the municipal area from significant rainfall events; and prevalence of floods in the local area, among others.
3.2. Classification by ISO 37120
Due to their high dispersion, the indicators identified in this study do not strictly comply with those outlined in the ISO Standard. Furthermore, since ISO 37120 pertains to a worldwide standardization of indicators, it was necessary to study each one in turn and subsequently assimilate them with the indicators used in this research. Consequently, each of the indicators used in the sample studied was analyzed prior to undergoing its respective categorization according to one of the sustainable development areas contained in the ISO Standard.
Of the 17 sustainable development areas that comprise the ISO Standard, nine did not contain assimilated indicators, including Economy, Education, Energy, Finance, Fire and emergency response, Governance, Health, Safety, and Telecommunication and innovation. This may be due to the fact that Chilean regulations do not grant powers to PRCs in the aforementioned areas.
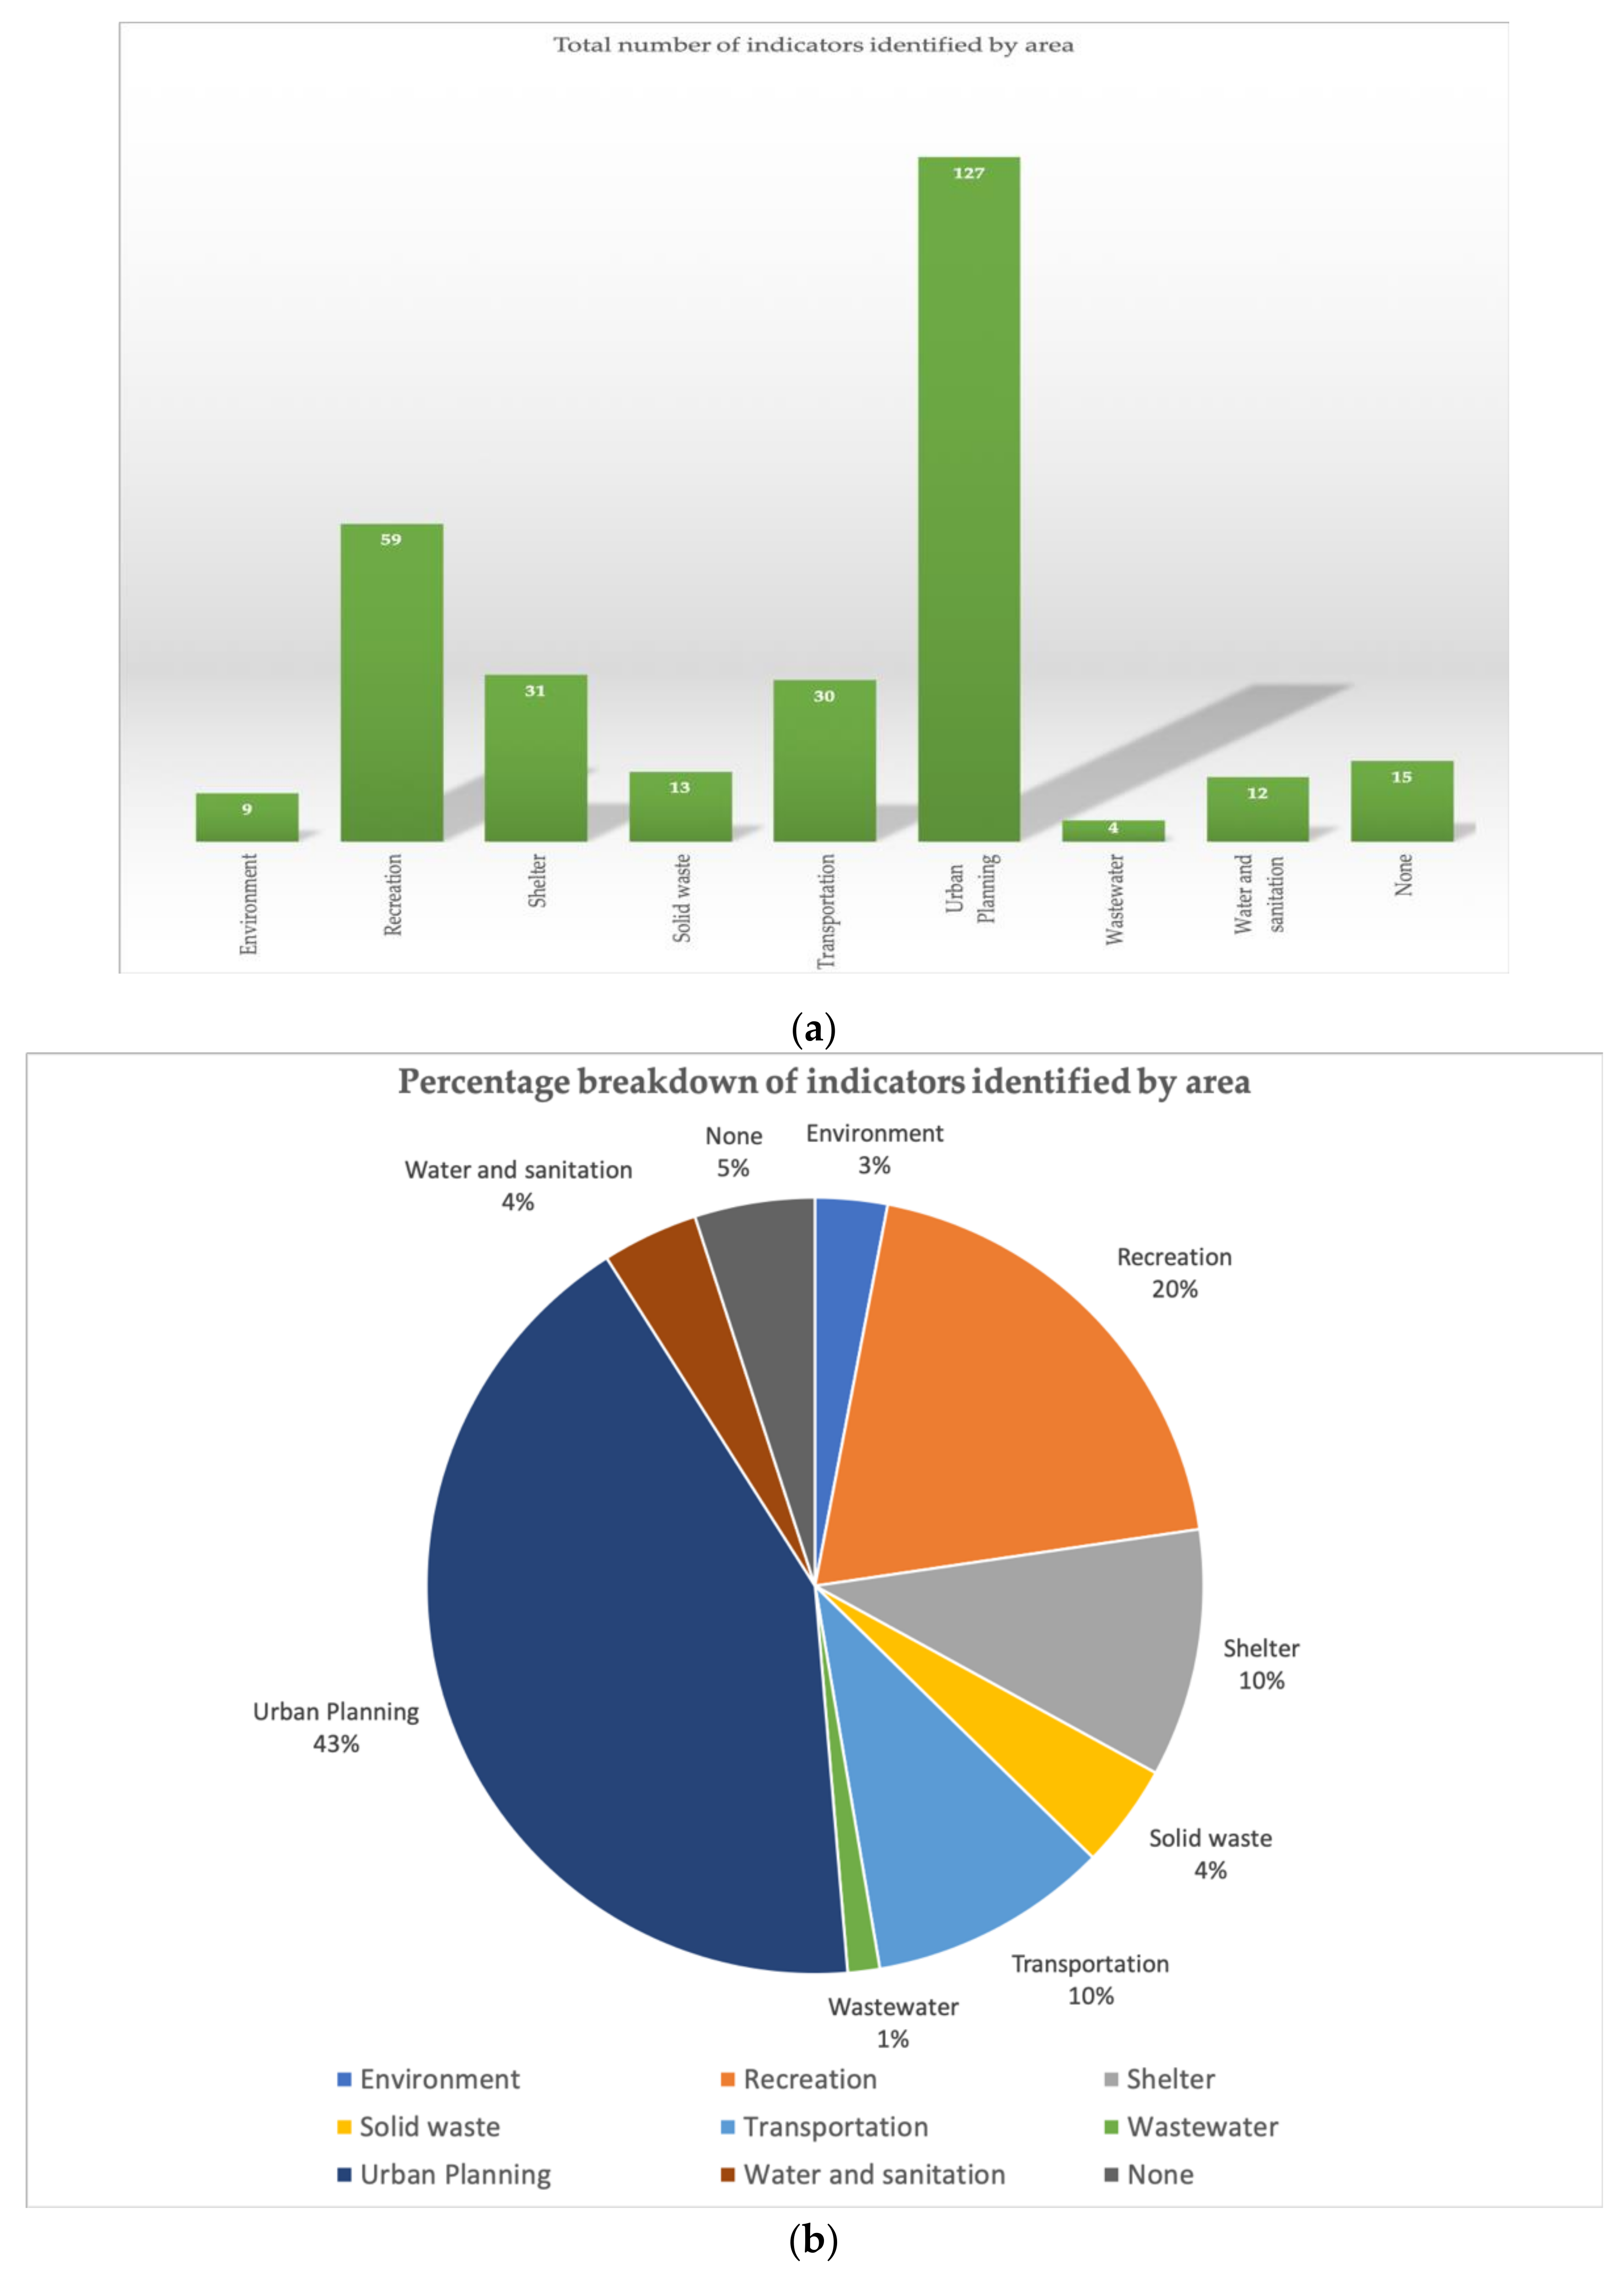
Of the eight areas in which indicators similar to the 300 used in the study area were identified (see
File S4 in Supplementary Materials), those related to Urban planning represented 42% of the total, with 127 indicators (
Figure 8). The other 58% were distributed among the remaining areas. There were also 15 types that could not be classified under any of the indicators according to the ISO 37120 criteria and which were marked ‘None’.
In relation to the ISO indicators that pertain to the area of Urban planning, the most recurrent ones identified in this study concern urban issues that PRCs seeks to prevent or implement, including irregular building ownership and the regularization of unplanned developments or unauthorized housing that fails to comply with local building codes and regulations, as described in the ISO Standard. For example: percentage of buildings repaired or restored in conservation areas of historic interest; percentage of consolidation of the use of residential, commercial, and service developments in areas of special interest to the authority responsible; number of disused and green sites; and their conservation status located within urban boundaries; devise a localized plan for the civic neighborhood which adjoins main squares (Plazas de Armas) in order to conserve nearby culturally significant buildings and encourage urban development that is harmonious with these historic sites; and enter into agreements with large companies located in predominantly residential districts in urban areas to facilitate their relocation to industrial areas.
The sustainable development area as classified by ISO Standard 37120 that produced the second-most indicators was Recreation, which refers to green spaces destined for distinct uses as outlined by each PRC in question. Common uses include: percentage of surface area (in hectares) of green spaces developed in relation to the total surface area of green spaces (ZAV) and communal parks (ZPC); surface area (in square meters) of green spaces and recreation zones developed in ZAV areas; control of access to ecologically protected areas from urban areas; and use of adjacent green spaces, among others.
4. Discussion
By following the OECD criteria, findings show that pressure indicators constitute a large percentage of the indicators used across the study area. This means that PRCs undergoing SEA concentrate primarily on the collection of information to describe what kind of pressure and/or the extent of that pressure that the respective instrument will generate. It was common practice for the authors to identify indicators related to the granting of building permits or the number of expected constructions, but not what the impact of such constructions would be on sustainable or environmental development. Conversely, only a small percentage (3%) of the results incorporate state indicators, which would enable the authorities responsible to assess the current state of the environment or the state thereof during the execution of the PRC in question.
The indicator review conducted by following the ISO Standard 37120 criteria confirms the findings generated by the OECD-indicator analysis. It shows that from among the 17 areas described by the Standard, the indicators used in Chile focus primarily on urban and recreational aspects (essentially, indicators associated with green spaces). In conjunction, the two areas of Urban planning and Recreation account for over 60% of all indicators identified, while only 3% pertain to the Environment category.
The results show that the authorities responsible are generating very limited information on the environmental impacts of their PRCs. Although SEA regulation in Chile aims to incorporate environmental considerations of sustainable development into the design and implementation of general regulatory plans, policies, and programs that have an impact on the environment or sustainability, this practice is not reflected among the indicators being applied. Rather, these indicators focus more on recording the urban-based outcomes of the Plan than the environmental impact or the impact on sustainable development. In theoretical terms, the measurement of sustainability in cities can focus on measuring the quality of urban systems and the impact that cities have on the environment [
41]. In law terms, the European Union incorporates SEA and the corresponding follow-up in Article 10 of Directive 2001/42/EC—the SEA Directive (2001)—it nonetheless grants a significant degree of flexibility to each member country to establish rules specific to their reality [
42]. In
File S1, there is a description of the measures envisaged for “monitoring” the effects of the plans and programs, in order to, inter alia, promptly identify unforeseen adverse effects and allow appropriate remedial action to be undertaken.
File S1(g) identifies, among the information to be provided, the measures envisaged to prevent, reduce, and, as fully as possible, offset any significant adverse effect on the environment resulting from the implementation of the plan or program. Empirically, Shane and Graedel [
43] have proposed “metrics” such as: average annual atmospheric concentration of O
3 at soil level, SO2 emissions per capita, water use per capita, a measure of water used with the sustainable draw from an area’s watershed(s), measures of water quality including bacterial growth, turbidity, acidity, nutrient concentrations, and concentrations of toxins; and about the waste issues: trips to a disposal site, recycling center, or incinerator. The ISO Standard 37120 proposes different indicators such as percentage change in number of native species, noise pollution, NO
2 concentration, greenhouse gas emissions measured in tonnes per capita, percentage of population with authorized electrical service, among others. Furthermore, the OECD has developed indicators [
44] such as emissions of nitrogen and phosphor in water and soil, biological oxygen demand in inland waters, emissions of heavy metals, emissions of organic compounds, intensity of use of water resources or forest resources, habitat alteration, and land conversion.
It is possible to explain these results from a regulatory point of view. SEA regulation in Chile states that monitoring criteria and indicators should be identified in order to oversee their effectiveness. In addition, it asserts that monitoring criteria are understood as the set of elements of analysis aimed at enhancing the knowledge and evaluation of the outcomes of the implementation of a plan, policy, program or land-use- and spatial-planning instrument subject to SEA within a given timeframe. However, since regulations fail to provide definitions of what “oversee the effectiveness” and “outcomes of implementation” of the PRC mean in practice, the authorities responsible have been able to fulfil requirements necessary to secure SEA approval of PRCs by focusing on aspects other than those pertaining to environmental or sustainable development factors. As the results demonstrate, the recommendations provided by the guidelines cited in
Section 1 of this study have also been insufficient, despite having helped to broaden the scope of the use of indicators to assess fulfilment of proposed environmental objectives. A further explanation of the results relates to the way in which PRCs are able to regulate on primarily urban matters [
45] and which therefore have no regulatory mandate to establish standards in other areas of sustainable development in cities, as is proposed by the ISO Standard. Consequently, the regulations themselves limit the possibility to follow up on environmental considerations of sustainable development that are stipulated as an objective by existing SEA regulation.
Previous work on this topic has concluded that ecosystem services (ES) are considered in all SEA reports to have undergone analysis (15 reports including regional, inter-municipal, and PRC instruments) and that ES are also included in monitoring stages [
46]. However, it proved necessary to examine the events of the final stages of SEA and those focused on PRC in this study. This is because these events relate to the most frequently applied land-use- and spatial-planning instruments in Chile from an urban point of view (as observed in
Figure 1). Specifically, the aforementioned instruments are designed to determine whether differences exist between the objectives drawn up and what becomes of the indicators that are due to be applied during PRC implementation, as well as the extent of these differences, if relevant. Accordingly, this work contemplated a sample of 51 PRCs from the most populous regions of Chile using the main indicators for each instrument.
In 2016, the OECD reported on the lack of evidence as to whether SEA has resulted in significant modifications to land-use and spatial development plans in Chile as part of efforts to enhance the mitigation of environmental problems in urban areas [
47]. It should be noted that the challenge of rectifying this problem warrants more than simple regulatory amendment. Indeed, previous studies show that the monitoring stage is limited to the development of impact monitoring or supervision reports (requirements that are not accounted for in Chilean regulations) and that in certain nations where SEA is not legally recognized, monitoring nevertheless is conducted in areas such as governance, planning, and management [
48].
Furthermore, the use of indicators requires meticulous selection. It is not sufficient to simply adopt a set of indicators (such as one of the two examined in this study) as a standard that can subsequently be applied to all instruments under assessment. This is because problems can arise due to the limitation of certain environmental indicators that measure only a restricted number of parameters or which have a different sensitivity to the aspect undergoing monitoring due to the speed at which environmental changes take place [
49]. In other cases, excessive amounts of detailed information are unnecessary since they may cause confusion for the decision-maker or provide a false impression of accuracy [
50]. To ensure the adoption of the most adequate indicators, the best practice is to follow the criteria recommended by experts in the field rather than simply applying a pre-established set. The work undertaken by Donnelly et al. [
24] or Button [
51] provides a valuable starting point in this regard.
As we have empirically analyzed the performance of SEA, especially regarding the type of monitoring indicators used by municipalities (which is the local government of Chile), it can become a useful way for other nations (Peru, Argentina, Costa Rica, and the European Union with Portugal, France, Spain, European Union, Slovenia, and others [
8,
9,
10,
11,
12,
13,
14,
15,
16,
17,
18,
19,
20,
21,
22,
23,
24,
25,
26,
27,
28,
29,
30,
31,
32,
33,
34,
35,
36,
37,
38,
39,
40,
41,
42,
43,
44,
45,
46,
47,
48,
49,
50,
51,
52] that have adopted normative designs of this instrument in a similar way to the one that was promulgated in Chile to study the operation of their own strategic environmental assessments. In addition, international organizations such as the OECD have published where they account for the scant evidence on the operation of SEA [
47], so this work may draw attention to its effectiveness in incorporating environmental variables into territorial-planning instruments.
This study generates a number of questions for future work on the topic, including: what happens to the information that is generated by the indicators used in the SEA of the PRCs? Is this information taken into account in future PRC reforms? How can the lessons learned from the application of indicators of a municipal PRC be used to design subsequent PRCs in the same municipality? In this regard, regulations in Chile do not provide additional details and therefore, further doubts remain about the real contribution of SEA.
5. Conclusions
Effects of cities on the environment are a matter of current global concern, so understanding their consequences is a task of special relevance, where Strategic Environmental Assessment is an instrument that has been selected to evaluate these effects. Better SEA will depend, among other factors, on the way it affects the plans that cities design. In this sense, the indicators are a key piece to evaluate the consequences of the implementation of plans and policies, since they help to facilitate comparisons within the same city and between cities.
The SEA regulatory model followed in Chile shows a dispersion of indicators and focuses primarily on urban aspects, thereby fulfilling the regulatory requirement to monitor the “effectiveness of the plan”. The authorities responsible for the execution of SEAs and those interested in achieving PRC approval comply with existing legal requirements by simply monitoring facts. The results show that the indicators defined by the responsible authorities do not focus on monitoring the environmental effects of the PRC, making it less likely that they will make informed decisions to adjust the plan to the unforeseen environmental effects that it generates or compensate for them. Examples of this practice include expansions to road infrastructure that do not consider resultant greenhouse gas emissions, or indicators on granting of building permits or the number of expected constructions but not what the impact of such constructions would be on sustainable or environmental development, i.e., they fail to monitor the environmental impacts or the effects on sustainable development of the urban-planning decisions adopted. Even though PRC does not have power in certain sustainable development areas, the objective of SEA is ensuring the incorporation of sustainable development considerations to land-use planning instruments such as PRC, so this empirical analysis (made on a representative sample of used indicators in PRC on the most populated regions in Chile) demonstrates a need for amendments to SEA regulation, requiring indicators that allow a follow-up of environmental impacts.
The results may be useful for other countries that have followed SEA models, since according to our bibliographic review, an empirical analysis of the use of indicators in urban plans has not been carried out, so it draws attention to the effectiveness of this instrument in other countries, with examples of sustainability indicators defined by standards with empirical experiences and international support, to be considered in reforms in monitoring issues.
Given the results obtained from the present study, in addition to the fact that Chile has proposed the need to measure and monitor urban environmental variables as part of its national urban development policy (2014), this study provides valuable information that should be considered in all future reforms to strategic environmental assessments.


