Abstract
Ecosystem light use efficiency (ELUE) is generally defined as the ratio of gross primarily productivity (GPP) to photosynthetically active radiation (PAR), which is an important ecological indictor used in dry matter prediction. Herein, investigating the dynamics of ELUE and its controlling factors is of great significance for simulating ecosystem photosynthetic production. Using 35 site-years eddy covariance fluxes and meteorological data collected at 11 cropland sites globally, we investigated the dynamics of ELUE and its controlling factors in four agroecosystems with paddy rice, soybean, summer maize and winter wheat. A “U” diurnal pattern of hourly ELUE was found in all the fields, and daily ELUE varied with crop growth. The ELUE for the growing season of summer maize was highest with 0.92 ± 0.06 g C MJ−1, followed by soybean (0.80 ± 0.16 g C MJ−1), paddy rice (0.77 ± 0.24 g C MJ−1) and winter wheat (0.72 ± 0.06 g C MJ−1). Correlation analysis showed that ELUE positively correlated with air temperature (Ta), normalized difference vegetation index (NDVI), evaporative fraction (EF) and canopy conductance (gc, except for paddy rice sites), while it negatively correlated with the vapor water deficit (VPD). Besides, ELUE decreased in the days after a precipitation event during the active growing seasons. The path analysis revealed that the controlling variables considered in this study can account for 73.7%, 85.3%, 75.3% and 65.5% of the total ELUE variation in the rice, soybean, maize and winter wheat fields, respectively. NDVI is the most confident estimators for ELUE in the four ecosystems. Water availability plays a secondary role controlling ELUE, and the vegetation productivity is more constrained by water availability than Ta in summer maize, soybean and winter wheat. The results can help us better understand the interactive influences of environmental and biophysical factors on ELUE.
1. Introduction
To reveal the ability of plants to convert radiation energy into carbohydrate at the ecosystem level, ecosystem light use efficiency (ELUE) is routinely defined as the ratio of gross primary production (GPP), or the above ground net primary production, to incident photosynthetically active radiation (PAR) [1,2,3]. Moreover, ELUE is an indicator of how sensitive photosynthetic production is to both environmental and physiological regulations [4], as well as an underlying basis for estimating the carbon cycle in the satellite-based light use efficiency models [5,6]. Herein, investigating the dynamics of ELUE and its controlling factors is of great significance for simulating ecosystem photosynthetic production.
ELUE is the combined effects of environmental controls, e.g., incoming solar radiation, air temperature, soil and atmosphere dry-wet conditions [7,8], physiological factors (canopy conductance and foliar age) [9], vegetation index [10,11], etc. Previous studies suggested that soil moisture, air temperature, vapor pressure deficit and crop management practice have significant influence on ELUE variability through regulating stomatal aperture and the related photosynthetic reaction [12,13], while some others concluded that vegetation indices (i.e., NDVI or LAI) are the dominant control factors on the process of carbon exchange by affecting the fraction of radiation absorbed by photosynthesis [14,15]. An analysis conducted at the 35-eddy covariance (EC) flux sites across various terrestrial ecosystems revealed that rainfall determined the inter-annual ELUE variation [7]. It seemed that the dominating factors of ELUE varied spatially among ecosystems and temporally over time [13,16]. Furthermore, the effects of one factor on ELUE can be masked by other covarying factors [7,17]. For example, Garbulsky et al. (2010) demonstrated that water stress significantly affects ELUE more than air temperature in the Mediterranean environment [7]. Therefore, a persistent challenge for simulating the carbon cycle and energy transformation in general has been the lack of systematically understanding the concerning factors and their interactions controlling ELUE [7,18]. Therefore, it is necessary to investigate the important factors that control the ELUE variation, which is significant for revealing how ELUE changes in face of climate change. Path analysis is a typical multivariate statistical analysis approach to study the relationship between multiple variables [19,20]. For example, Fei et al. (2019) revealed the critical roles of GPP and vapor pressure deficit in controlling ELUE by path analysis [21]; Jiang et al. (2020) quantified the effects of climatic factors and the leaf area index on crop canopy water consumption and carbon sequestration [22]. Therefore, the path coefficients in the analysis as standardized partial regression coefficients can allow us to examine the possible causal link between the independent variables and their relative effects on the dependent variable.
New measurement techniques, including EC-based method and model inversions based on EC, Geographic Information System (GIS) or Moderate Resolution Imaging Spectroradiometer (MODIS) surface reflectance products, are the most common methods in current research to investigate the dynamics of site-level and regional-level ELUE [23,24]. EC measurement determines carbon fluxes by the covariance between the vertical wind velocity pulsation and the concentration of CO2 in the air mass [25]. The measurement provides a time-continuous and spatially integrated data set simultaneously with the advantage of minimal disturbance to the surrounding vegetation [26]. The open-access availability of fluxes and tower-based supplementary meteorology data provide important support to reveal the spatiotemporal variations and controlling variables of ELUE.
Cultivated croplands covers about 12% of the ice-free land surface on the earth, provides a great deal of the food and fiber for humans and has great potential for greenhouse gas mitigation by Grow-Harvest-Grow management of the global ecosystem [26,27,28]. Summer maize, winter wheat, paddy rice and soybean are the most widely produced grains for humans and livestock globally [24]. However, the complex interactions among the environmental and biophysical factors on ELUE have seldom been systematically analyzed in the agroecosystems. In this study, we used EC fluxes and meteorological data collected from 11 EC towers with 4 different coverages (maize, winter wheat, paddy rice and soybean) globally to analyze ELUE. The objectives of the paper are (1) to reveal the dynamics of ELUE diurnally and daily, (2) to explore the mechanisms of how environmental and physiological variables affect ELUE dynamics and (3) to quantify the relative effects of the control factors on ELUE through the path analysis. This study is important for predicting the process of carbon storage and grain production of croplands in the context of climate change.
2. Materials and Methods
2.1. EC Fluxes and Meteorological Data
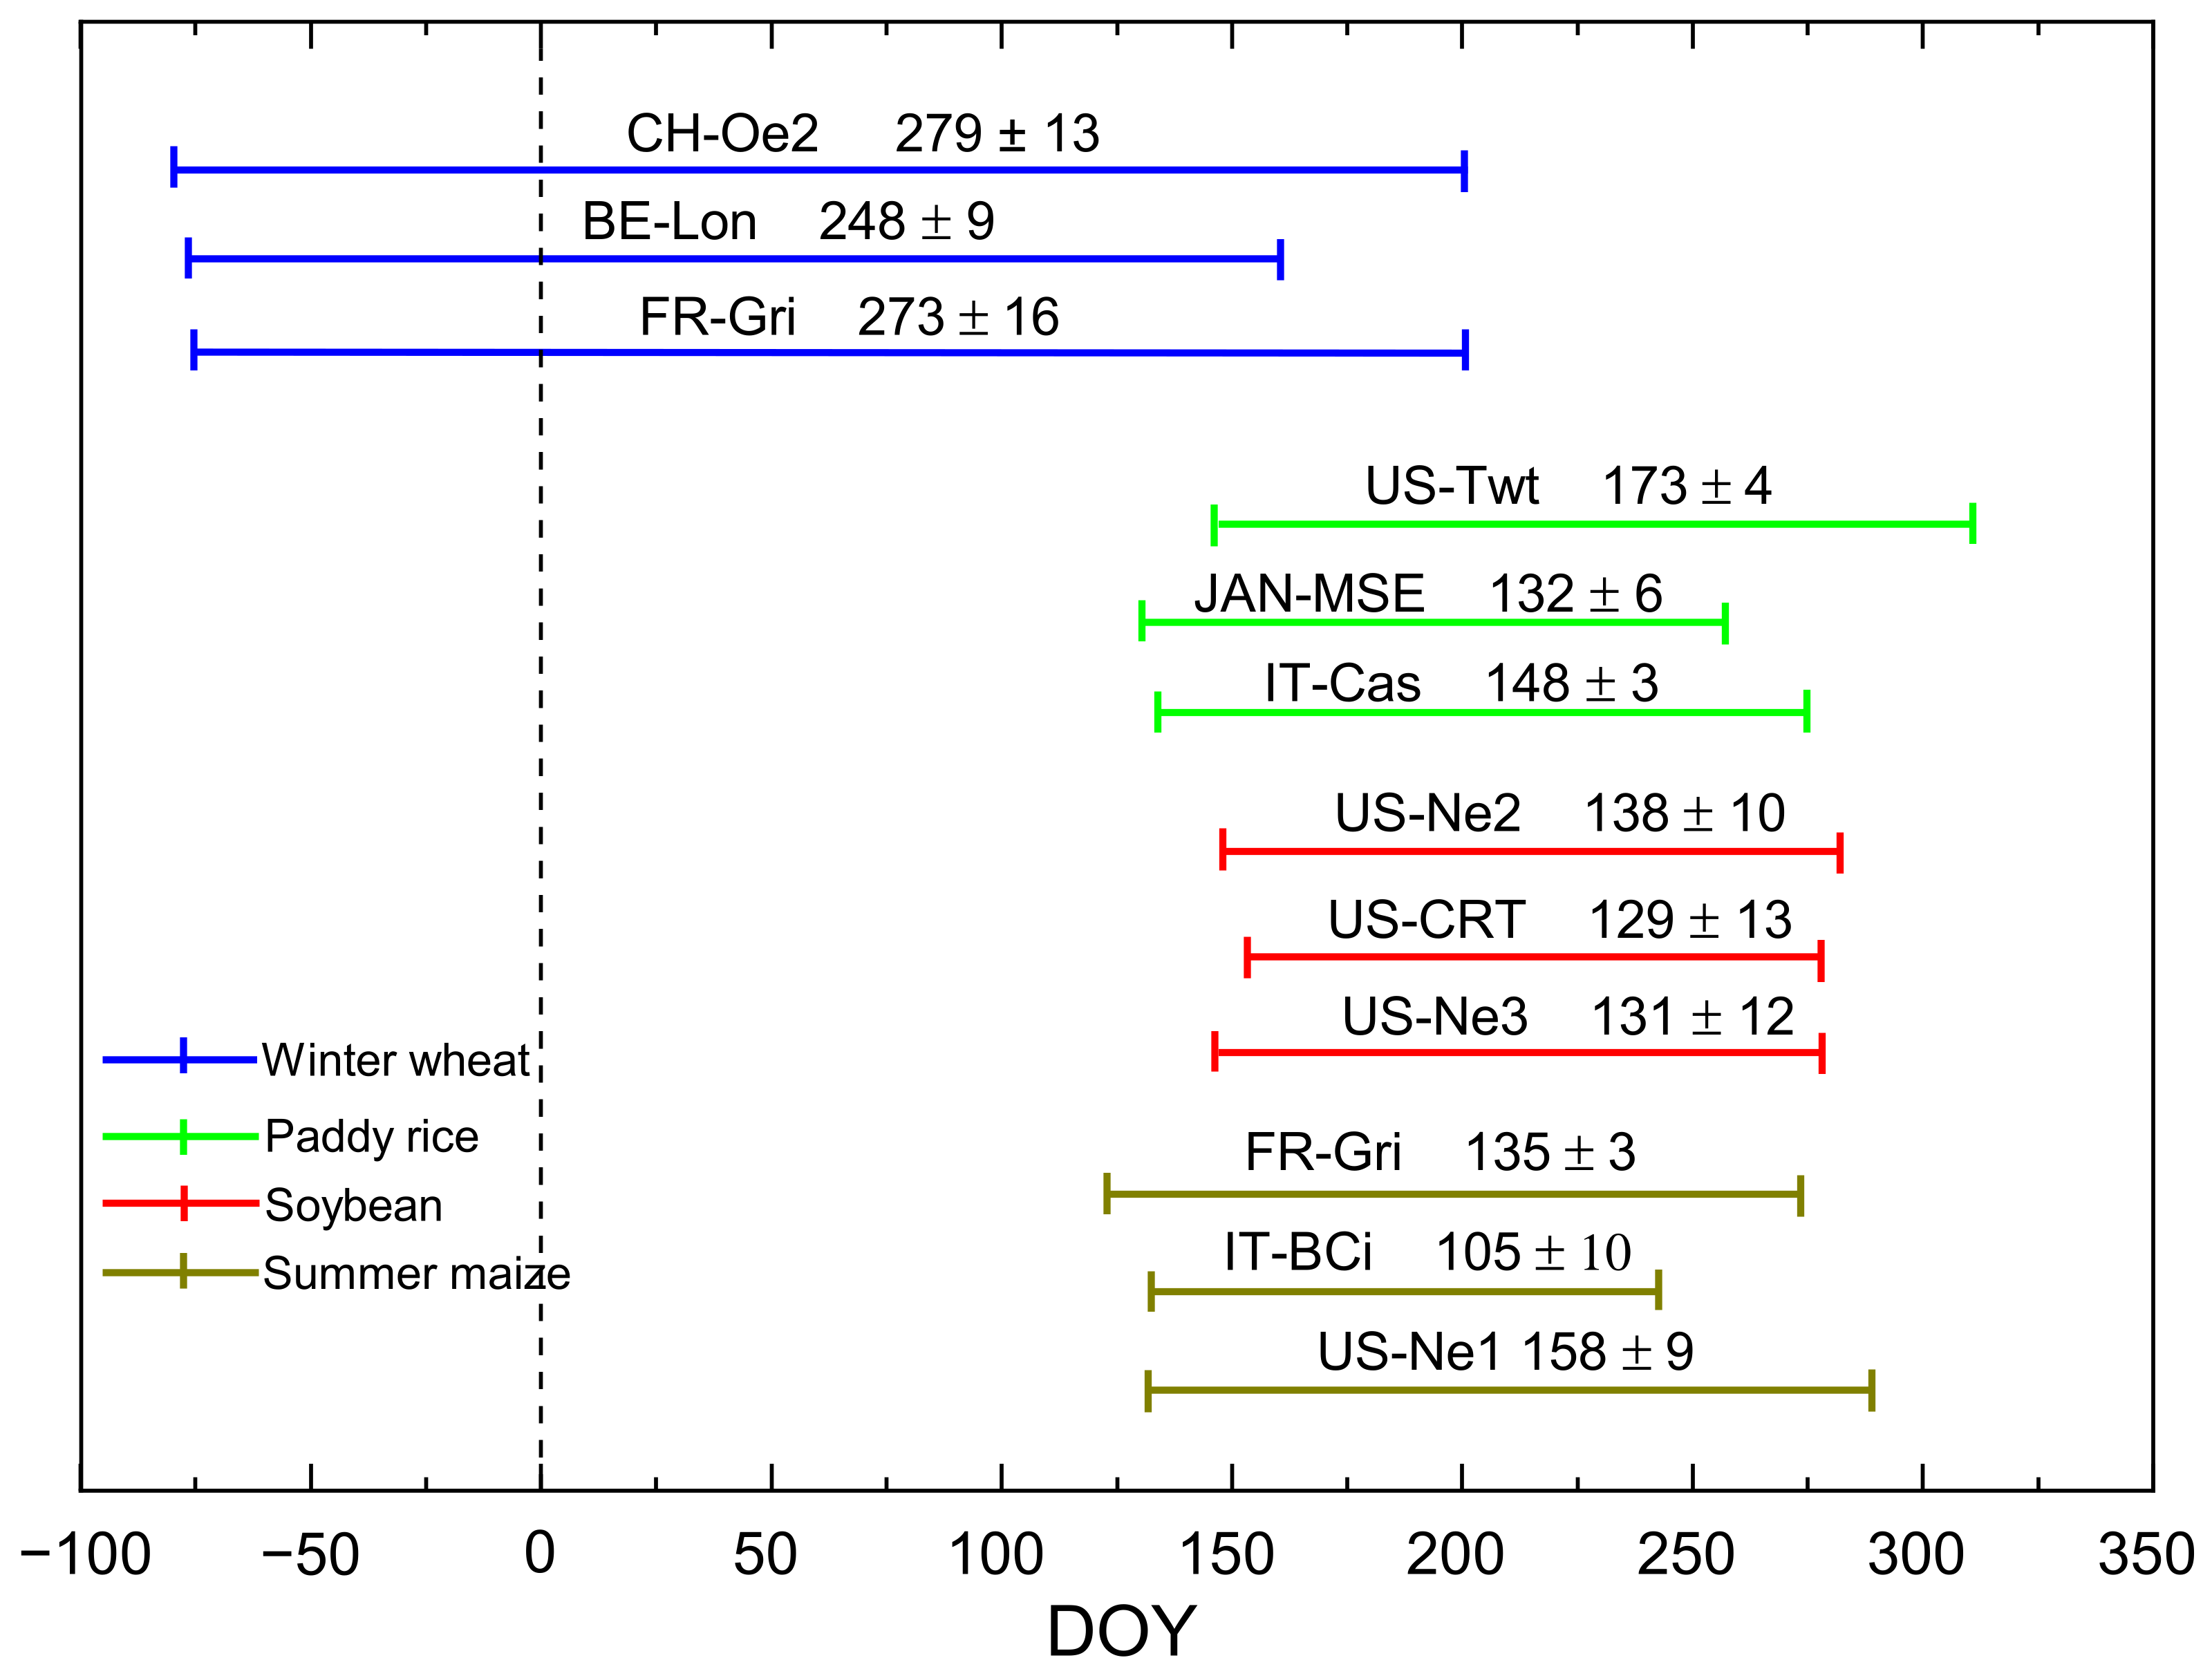
The data from 11 EC flux sites from around the world with a measurement duration of at least two years (Table 1) were used for this study. The towers were located in four different crop (paddy rice, winter wheat, soybean and maize) fields. Hourly measured and derived EC fluxes as well as meteorological data over the growing seasons (Figure 1) were obtained from the Fluxnet 2015 Dataset (http://fluxnet.fluxdata.org/data/fluxnet2015-dataset/ accessed on 10 October 2019), including downward shortwave radiation (Rg, W m−2), net solar radiation (Rn, W m−2), air temperature (Ta, °C), vapor pressure deficit (VPD, hPa), precipitation (mm), latent heat flux (LE, W m−2), sensible heat flux (H, W m−2) and gross primary production (GPP, g C m−2 d−1 [29,30]. Data associated with equipment failures and stable boundary layer conditions (fraction velocity u* < 0.25 m/s in this study) were removed [31,32]; then, the data gaps (≤2 h) were filled with linear interpolation while larger gaps (>2 h) were filled using mean diurnal variation (MDV). In the MDV method, a missing observation is replaced by the mean for that time period (half-hour) based on previous and subsequent days. Data windows of days 7 and 14 were usually chosen for averaging within the application [25]. Ultimately, hourly data was aggregated to daily data. Besides, data from rainy days (the amount of daily precipitation > 0.0 mm) were removed when performing path analysis and correlation analysis (see Section 2.4).

Table 1.
Descriptions of the eddy covariance (EC) flux sites of the croplands studied.
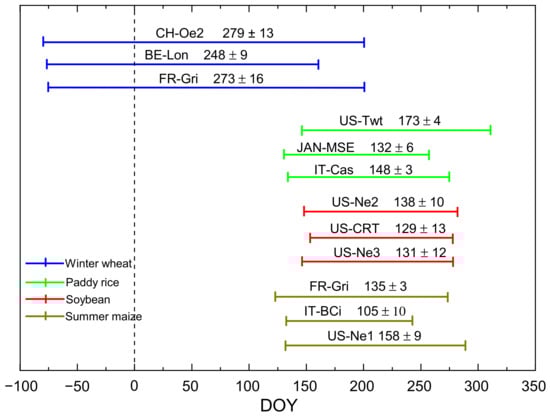
Figure 1.
The length of the growing season of winter wheat, paddy rice, soybean and summer maize at the representative sites (refer to Table 1). Negative DOY represents days of the previous year. (The duration of the growing season at each site was investigated from literature reviews and private inquiries).
2.2. Normalized Difference Vegetation Index (NDVI)
The MODIS 16-day composite NDVI at a resolution of 250 × 250 m at 11 sites was downloaded (MODIS 13Q1, https://modis.ornl.gov/data.html accessed on 1 November 2019). Data with poor quality caused by the interference of clouds and precipitation were also removed. The spikes presented in the raw NDVI data were smoothed by removing unrealistic abrupt short-term changes in the NDVI. The gaps were filled by linearly interpolating the closest available data. Then, the 16-day NDVI was interpolated to a daily scale using a spline function for daily scale analysis.
2.3. Derived Variables
Canopy conductance (gc), a vital physiological indicator that reveals the weighted integration of the individual leaf’s conductance, is calculated using an inversion of the Penman–Monteith equation (Monteith 1964):
where Δ is the curve slope of the saturation vapor pressure (kPa °C−1); γ is the psychrometric constant (kPa °C−1); G is the surface soil heat flux (MJ m−2 d−1); ga is the aerodynamic conductance (m s−1); ρa is the air density (kg m−3); is the air specific heat capacity (J kg−1 K−1); and is the friction velocity estimated by the EC system (m s−1).
The evaporative fraction (EF) was calculated:
For EF, we only used the values between 0 and 1 from the dataset.
ELUE was estimated by [40]:
where PAR is photosynthetically active radiation, and is set to half of Rg for some sites where PAR is not measured [41,42].
2.4. Path Analysis Theory
Multiple linear regression was adopted to investigate the relationship between ELUE and explanatory variables:
where xi indicates the ith factor (one of NDVI, gc, Ta, PAR, Rn, VPD and EF in this study); n (=7) is the number of the factors. Rn and PAR were chosen as the energy terms, although they are related: PAR relates more to photosynthesis, while Rn relates more to the energy balance and Penman–Monteith model. NDVI and gc were chosen as the deputations of the crop structural and physiological factors, respectively. Ta and VPD were chosen since both of them were vital climate factors, while EF was chosen to analyze the effect of the energy allocation on ELUE.
A matrix based on Equation (5) can be expressed as:
where is the correlation coefficient between xi and xj (rxjxi = rxixj); is the quantified direct effects of xi on ELUE:
where and represent the standard deviations of xi and ELUE; represent the quantified indirect effects of xi through xj on ELUE. The relative effects of unconsidered variables on ELUE were estimated:
2.5. Regression Analysis
The one-factor linear regression model was adopted to explore the responses of ELUE to NDVI, gc, EF and P; meanwhile, an exponential curve was presented to describe the response of the ELUE to the days after a certain precipitation event.
where a and b are fitted parameters; x represents the variables mentioned above.
3. Results and Discussion
3.1. Variation Patterns of GPP, PAR and ELUE on Different Time Scales
3.1.1. Diurnal Characteristics
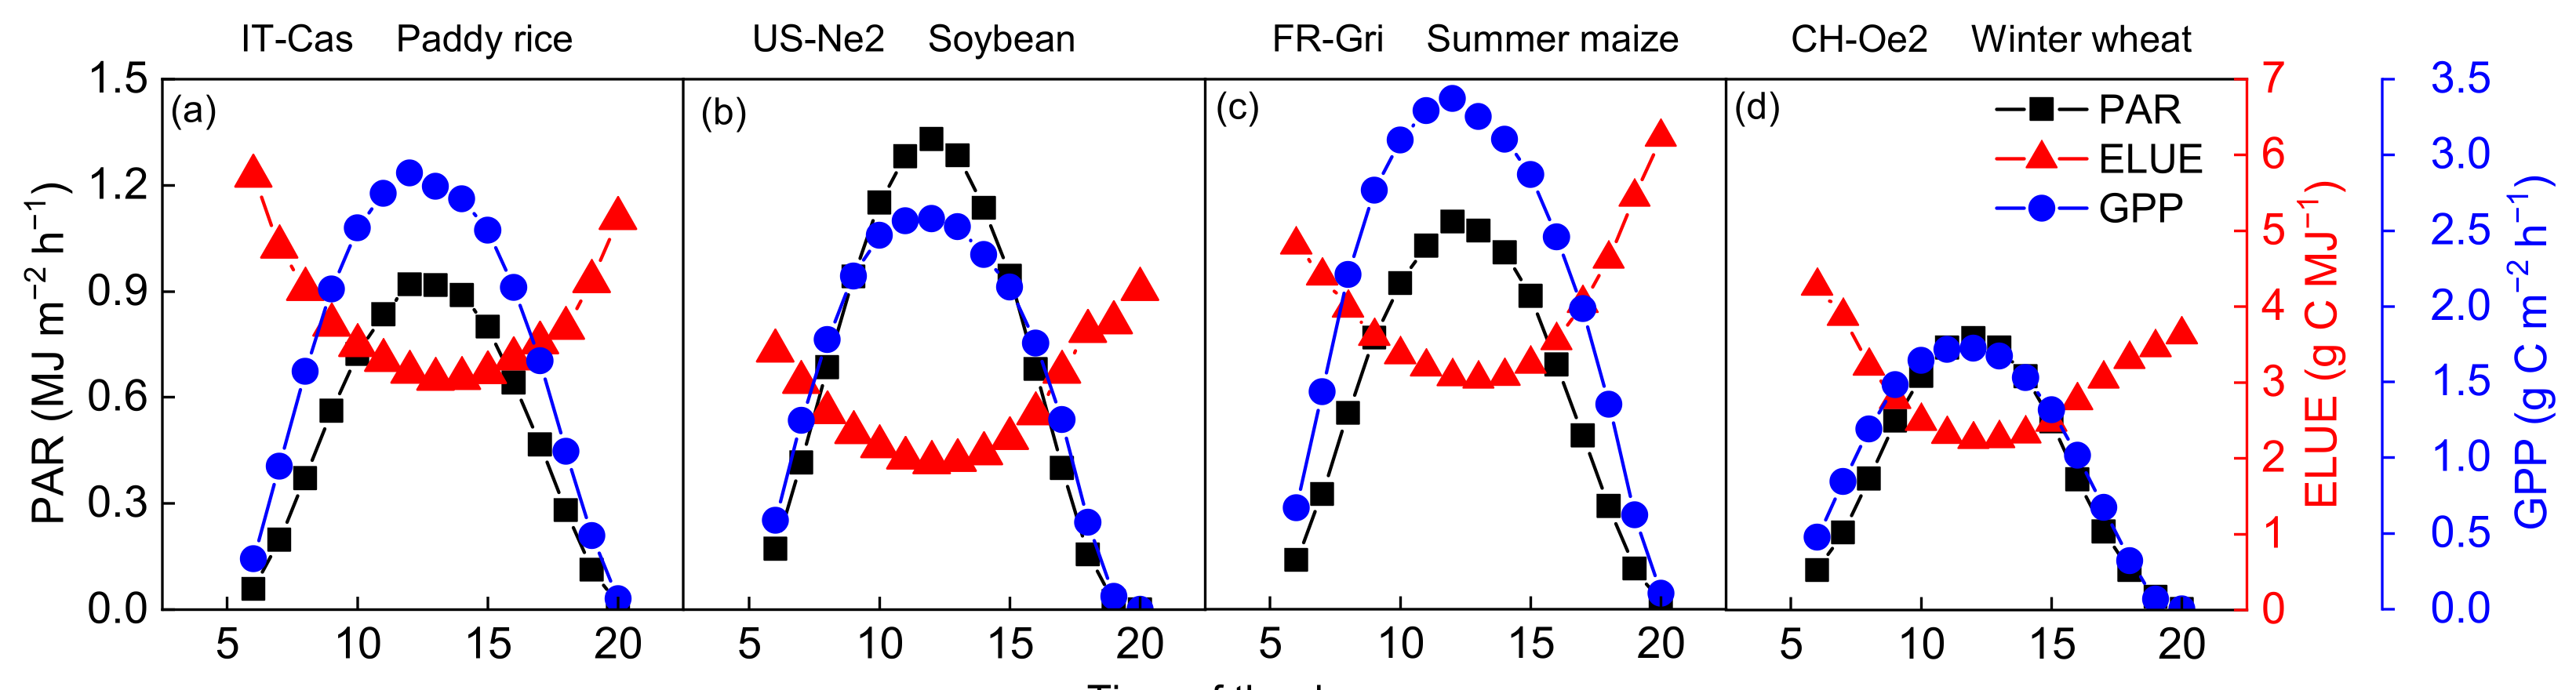
Hourly averaged daytime GPP, PAR and ELUE during the growing seasons were shown in Figure 2a–d. A trough of ELUE occurred at around noon and peaks appeared at sunrise/sunset. ELUE varied from 0.07 to 0.13, 0.04~0.10, 0.07~0.14 and 0.05~0.10 mol C MJ−1 in rice, soybean, maize and wheat fields, respectively. A synergistic relationship was found between GPP and PAR, of which the trends were opposite to ELUE. Evrendilek and Ben-Asher (2008) found that leaf LUE exhibited a bimodal behavior, which peaked in the early morning and late afternoon in wheat fields [43]. The midday depressions in net CO2 assimilation have been reported because stomatal control of photosynthesis results from high Ta or VPD [44]. Besides, the assimilation of 1 mol of CO2 requires 8 moles of photons at the leaf scale under ideal conditions [45]. However, the measured ELUE values are much lower than the theoretical ELUE values because they are constrained by many photosynthetic reactions [21,46]. Photosynthetic productivity usually saturates far below the maximum solar light intensity; in those conditions, many absorbed photons and the resulting electronic excitations of the pigment molecules can no longer be utilized for photosynthesis. To avoid photodamage, various protection mechanisms are induced that dissipate excess excitations, which otherwise could lead to the formation of harmful molecular species such as singlet oxygen. For example, non-photochemical quenching (NPQ) of chlorophyll fluorescence is thought to be an indicator of an essential regulation and photoprotection mechanism against high-light stress in photosynthetic organisms [47]. Ventre-Lespiaucq et al. (2018) revealed that the depression of light interception is a strategy for avoiding the interception of excessive irradiance on whole-crown and leaf scales [48]. These processes may be the other reasons causing a decline in ELUE at midday.
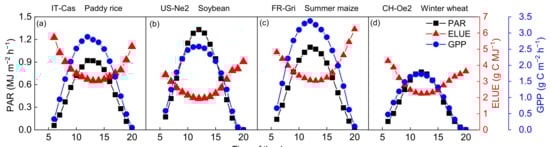
Figure 2.
Diurnal patterns (a–d) of gross primary production (GPP), photosynthetic active radiation (PAR) and ecosystem light use efficiency (ELUE) during daytime over the growing season at the four typical sites.
3.1.2. Seasonal Variations
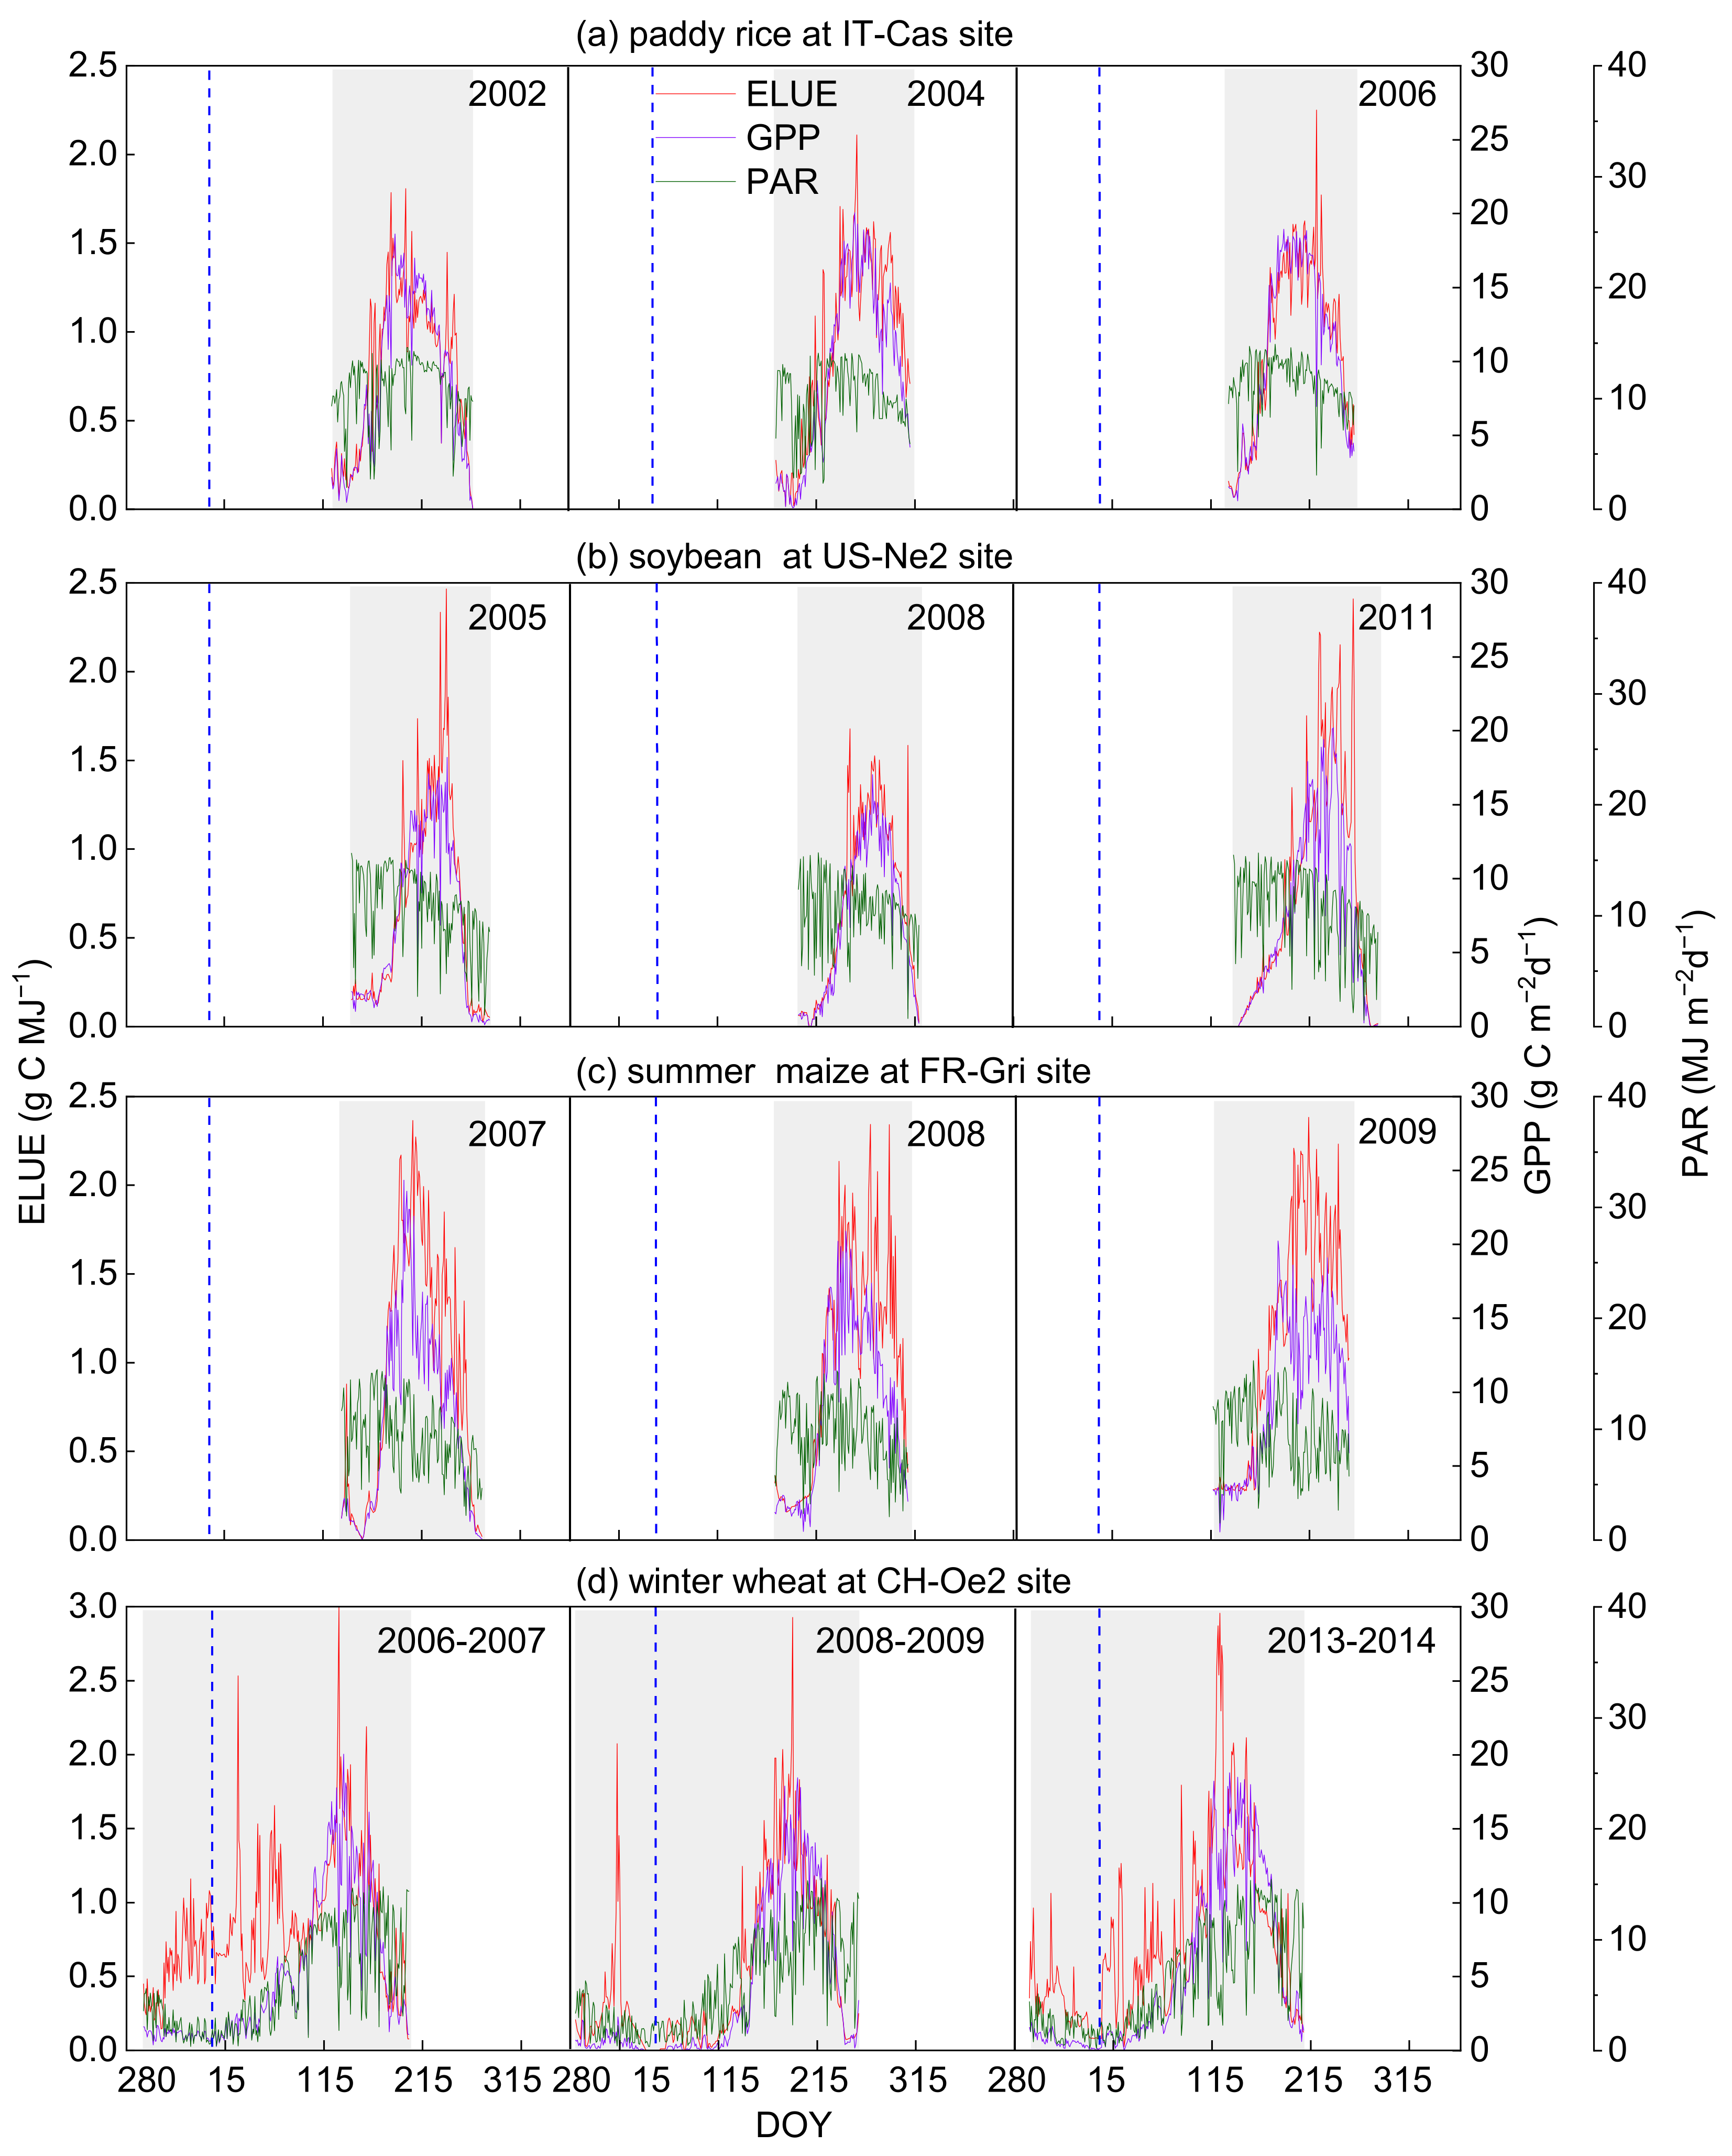
The dynamics of daily GPP, PAR and ELUE in different fields during the growing seasons were illustrated in Figure 3. PAR in the rice, soybean, and maize fields did not show apparent seasonal changes, while the variations of GPP showed apparent seasonal cycles and had a peak in active growth stages. Daily ELUE of paddy rice, soybean and summer maize increased firstly, peaked during the active growing period and decreased as the crops matured (Figure 3a–c). Winter wheat seed germination occurred typically in the autumn; GPP had a small peak and then fell to near zero after the wheat entered the wintertime (due to lack of PAR and heat during the wintertime) [49]. Thus, ELUE presented quite different seasonal variations that increased firstly after germination and then fell as photosynthetic productivity (namely GPP) was limited due to an unfavorable growing environment (Figure 3d). ELUE exhibited the highest value in summer maize with 0.92 ± 0.06 g C MJ−1, followed by soybean, paddy rice and winter wheat, with values of 0.80 ± 0.16, 0.77 ± 0.24 and 0.72 ± 0.06 g C MJ−1, respectively (Table 2). Summer maize possessed the highest GPP of 9.76 g C m−2 d−1, followed by soybean and paddy rice, with the values of 7.80 ± 1.80 and 7.72 ± 2.10 g C m−2 d−1, respectively. Winter wheat had the lowest GPP, 4.74 ± 0.48 g C m−2 d−1, due to undergoing the wintertime during which physiological activity was weak under the lower temperature and PAR conditions [49] (approximately half the PAR of other ecosystems, Table 2). These findings suggested that the C4 crop (summer maize) generally showed higher photosynthetic efficiency than C3 crops (paddy rice, soybean and winter wheat), which was in line with previous reports [50,51]. Under similar climatic conditions, C4 plants possessed a stronger ability of environmental adaptation, absorbing more carbon using radiation energy that resulted in their robust photosynthetic capacity and leaf-cell anatomy. Wang et al. (2018) found that the increase in both biomass production and CO2 fixation with light intensity and CO2 concentration in C4 was faster than that in C3 [24]. Therefore, the characteristics of C4 plants determine a more efficient use of light and CO2 than that of C3 plants [50,52,53].
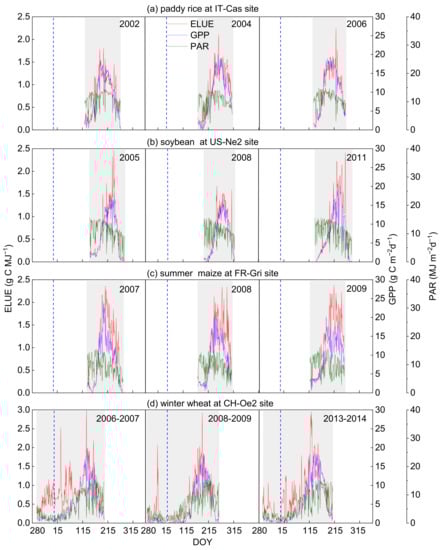
Figure 3.
Seasonal variations of gross primary production (GPP), photosynthetic active radiation (PAR) and ecosystem light use efficiency (ELUE) in the representative site of (a) paddy rice (IT-Cas), (b) soy-bean (US-Ne2), (c) summer maize (FR-Gri), (d) winter wheat (CH-Oe2). The grey area is marked as the growing season of the crops in the four typical sites. DOY is the day of the year. The vertical dotted line indicates the start of the year.
Table 2.
Growing season mean + standard deviation of gross primarily productivity (GPP) and ecosystem light use efficiency (ELUE) across the typical croplands.
3.2. Responses of ELUE and GPP to Bio-Physical and Environmental Factors
3.2.1. Responses of ELUE and GPP to Vegetation and Physiological Factors
NDVI affected crop ELUE significantly with a linear relationship in all the crop fields (p < 0.01, Figure 4), with the highest Pearson correlation coefficient (r) of 0.87 (R2 = 0.76) in soybean, followed by summer maize (0.81, R2 = 0.66), paddy rice (0.79, R2 = 0.62) and winter wheat (0.73, R2 = 0.53). In addition, it seemed that NDVI was better fitted to ELUE with an exponential function than linear function, with the R2 of 0.78, 0.67, 0.63 and 0.58 in soybean, summer maize, paddy rice and winter wheat, respectively. The consistent relationship showed the potential of utilizing NDVI to estimate ELUE as well as further GPP in the agroecosystems. Similar variation patterns of ELUE with NDVI were reported in other ecosystems [4]. Gitelson et al. (2014) examined the fraction of absorbed PAR (fAPAP) by the photosynthetic tissues in cropland sites and found that there was an exponential function relationship between NDVI and fAPAR [14]. The fAPAR increases when NDVI rises, and PAR is more effectively intercepted for carbon uptake, leading to an increase in ELUE. An ecosystem-level ELUE study showed that NDVI was quite consistent with photosynthesis dynamics and could be used as a proxy for both fAPAR and ELUE to predict GPP on a seasonal time scale [54,55]. Moreover, positive correlation relationships were found between NDVI and GPP (p < 0.01, Table 3), with the r of 0.85, 0.91, 0.81 and 0.76 in paddy rice, soybean, summer maize and winter wheat, respectively. Strong seasonal and positive coupling of leaf area and photosynthesis occurred in annual crops, such as wheat [56,57] and peatland [58], where the findings demonstrated that the higher the LAI is, the higher the GPP is. These findings revealed the fact that the vegetation factor (NDVI) can be recognized as an essential parameter in ecosystem photosynthesis [24,56,59].
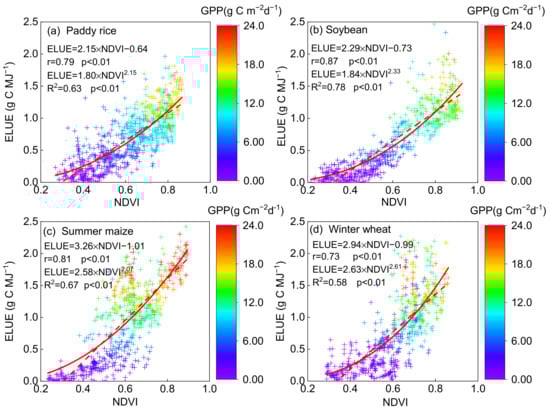
Figure 4.
The relationship between ecosystem light use efficiency (ELUE) and normalized difference vegeta-tion index (NDVI) on a daily basis on non-rainy days at the (a) paddy rice, (b) soybean, (c) summer maize and (d) winter wheat fields. The correlation coefficient (R2) and Pearson’s correlation coef-ficient (r), as well as the exponential and linear function, are also shown. The color of the cross symbol showed the level of daily gross primary production (GPP).
Table 3.
Pearson’s correlation analysis between daily gross primary production (GPP) and the selected variables in different crop fields.
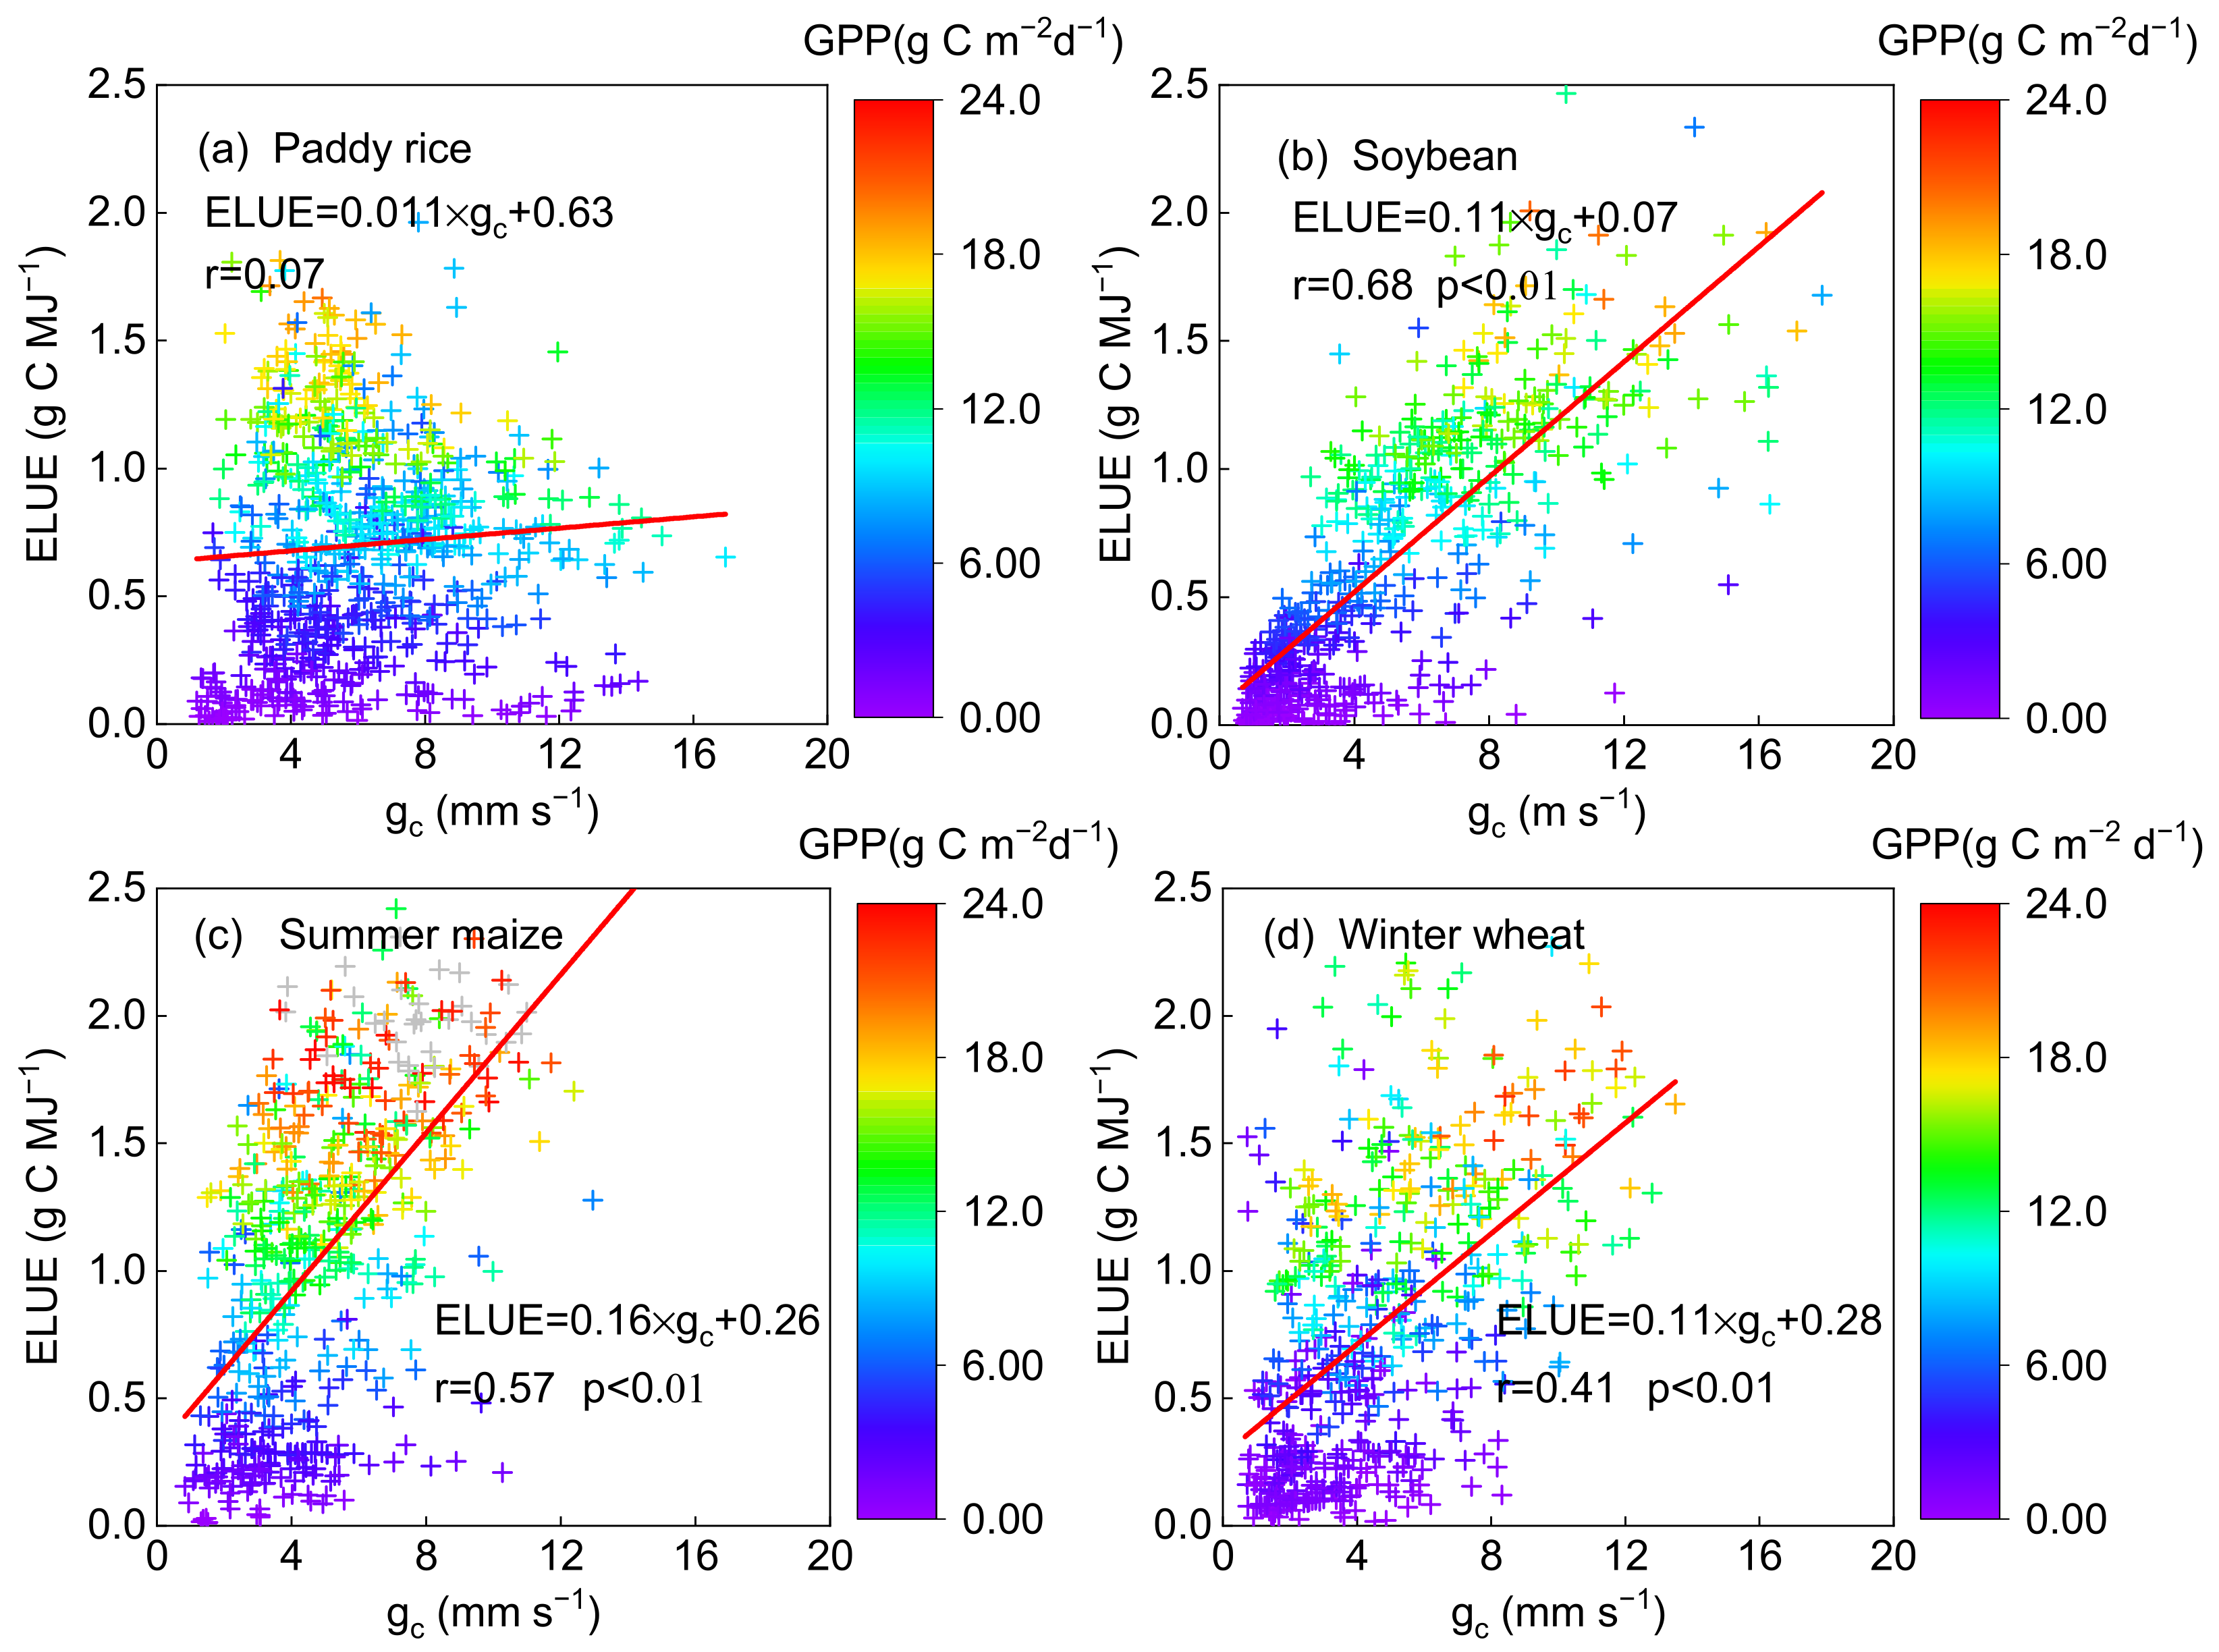
There is a significant relationship between ELUE and gc in the soybean, summer maize and wheat fields (with r of 0.68, 0.56 and 0.41 (p < 0.01), respectively) but not in the rice fields (with r of 0.07) (Figure 5). Besides, GPP was also significantly positively related to gc in the soybean (r = 0.68), maize (r = 0.54) and wheat (r = 0.40) fields (p < 0.01, Table 3). These results revealed that the physiological factor (gc) can be well recognized as the control for crop photosynthesis in the typical agroecosystems, except for paddy rice. Vegetation physiological control of water and carbon fluxes between the atmosphere and vegetation canopy is exerted by stomata and the degree of control is quantified in terms of gc [60]. gc was conducted using an inversion of the Penman–Monteith equation as described in Section 2.2. The Penman–Monteith equation, which was termed as a “big-leaf” model to estimate ET, can generally obtain satisfying simulation results only in a closed canopy [61,62], when vegetation transpiration was dominant in the composition of evapotranspiration. However, only transpiration was tightly linked with the carbon exchange process [60]; therefore, gc calculated in this study cannot be recognized as a reasonable control of the photosynthetic process due to the higher water evaporation in long-term flooded paddy rice croplands, where transpiration occupied a relatively smaller proportion of the time compared to other crops (wheat and corn [63]), though it is a common way to calculate gc based on the inversion of the Penman–Monteith equation. The two-source approach, similar to the Shuttleworth–Wallace model [64], would be a better approach for paddy rice than the single source Penman–Monteith model to inverse gc using the transpiration component; however, the test cannot be achieved due to the lack of transpiration data.

Figure 5.
The relationship between daily ecosystem light use efficiency (ELUE) and canopy conductance (gc) on a daily basis on non-rainy days at the (a) paddy rice, (b) soybean, (c) summer maize and (d) winter wheat fields. The color of the cross symbol showed the level of daily gross primary produc-tion (GPP).
3.2.2. Responses of ELUE and GPP to Climatic Factors
Based on the linear regression analysis, ELUE was positively correlated to Ta across the four crop fields, but only significantly in paddy rice and summer maize, with the r of 0.48 and 0.50 (p < 0.01), respectively. ELUE was only significantly correlated to Rn in summer maize croplands (r = 0.36, p < 0.01), while no consistent relationship was found between PAR and ELUE in the four agroecosystems. However, GPP was significantly positively correlated to Rn in the fields (Table 3), while significantly related to Ta and PAR in the fields, except for the soybean fields. The results were consistent with previous reports that GPP generally increased linearly with rising Ta and light intensity (reflected by Rn, PAR) [65,66]. Lower light intensity and temperature could inhibit photosynthesis by influencing stomatal behavior and intrinsic biochemical reaction (e.g., thylakoid rection, Rubisco catalytic activity, electron transport capacity) [23]. Hence, the photosynthesis rate was lower during cold weather as was the ELUE [7,67]. However, the low affinity of the enzyme for CO2 and its dual nature as an oxygenase limit the possible increase in net photosynthesis as temperature rises; although the catalytic activity of Rubisco increases, there can be a rapid fall-off of the photosynthetic rate at high temperatures [68,69]. For example, a quadratic regression result between ELUE and PAR was found in a semiarid savanna ecosystem [4]. However, for farmlands distributed at middle and high latitudes, the temperature usually did not reach the level that incurred a strong negative effect on photosynthesis. Research also demonstrated that Ta tended to exert a more significant positive influence on photosynthesis on colder sites [7]; for instance, Ta was not significantly correlated to the actual ELUE in hot humid ecosystems [18], while Ta determined the intra-annual variability of the ELUE in an energy-limited forest [7]. Therefore, the impact of climate control on carbon fixation will differ depending on the ecosystem types and vegetation growth conditions. More attention should be paid to studying differences in the photosynthetic limiting process according to different species and growth conditions.
3.2.3. Responses of ELUE and GPP to Water Availability
ELUE was significantly correlated to EF in the soybean (r = 0.83, p < 0.01), maize (r = 0.74, p < 0.01) and winter wheat (r = 0.37, p < 0.05) fields (Figure 6a–c). It was noted that ELUE had a negative relationship with EF in the rice fields (r = −0.07, Figure 6d). A similar relationship between GPP and EF was shown in Table 3. Such results indicated that water availability might not be a limiting factor in the photosynthetic process in long-term flooded paddy rice croplands.
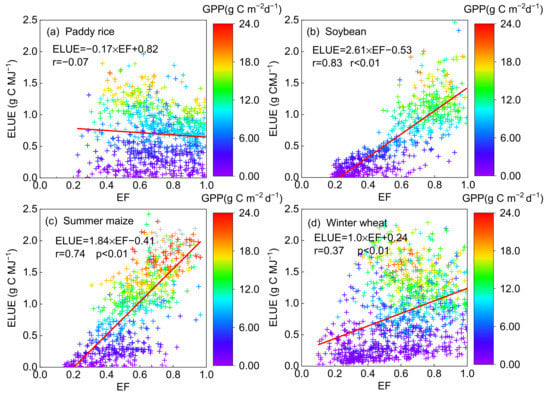
Figure 6.
The relationship between ecosystem light use efficiency (ELUE) and evaporation fraction (EF) on a daily basis on non-rainy day at the (a) paddy rice, (b) soybean, (c) summer maize and (d) winter wheat fields. The color of the cross symbol showed the level of daily gross primary production (GPP).
ELUE and GPP were negatively related to VPD, while the relationship between VPD and ELUE in soybean (r = −0.36, p < 0.01), as well as VPD and GPP in winter wheat (r = −0.28, p < 0.05) was significant, respectively. Yuan et al. (2015) found there was a negative correlation between VPD and GPP in the maize and soybean fields [53], since increased VPD may trigger stomatal closure to avoid excess water loss due to the high evaporative demand of the air, leading to a negative carbon balance [70]. Besides, we also found that VPD did not fully characterize the impacts of water availability on vegetation production except for winter wheat. Conversely, EF can better explain the water availability effects on the variability of ELUE and GPP for all but paddy rice in our analysis. EF is estimated by the evaporative fraction (EF = LE/(LE + H)), since increasing the amounts of energy partitioned to evaporated water indicates a greater potential of soil in the water supply [7,71]. Therefore, EF has a more significant correlation with vegetation production than VPD in the agroecosystems, except for paddy rice. VPD tends to exert the effect of atmospheric water restraint but ignore water supply from the soil [72]. Yuan et al. (2015) also indicated that VPD easily decouples with GPP in crop fields [53]. Therefore, VPD might not be a suitable indicator to represent the effect of water availability on photosynthesis [71], though there might be a strong covariance between VPD and soil moisture in semi-arid areas [73].
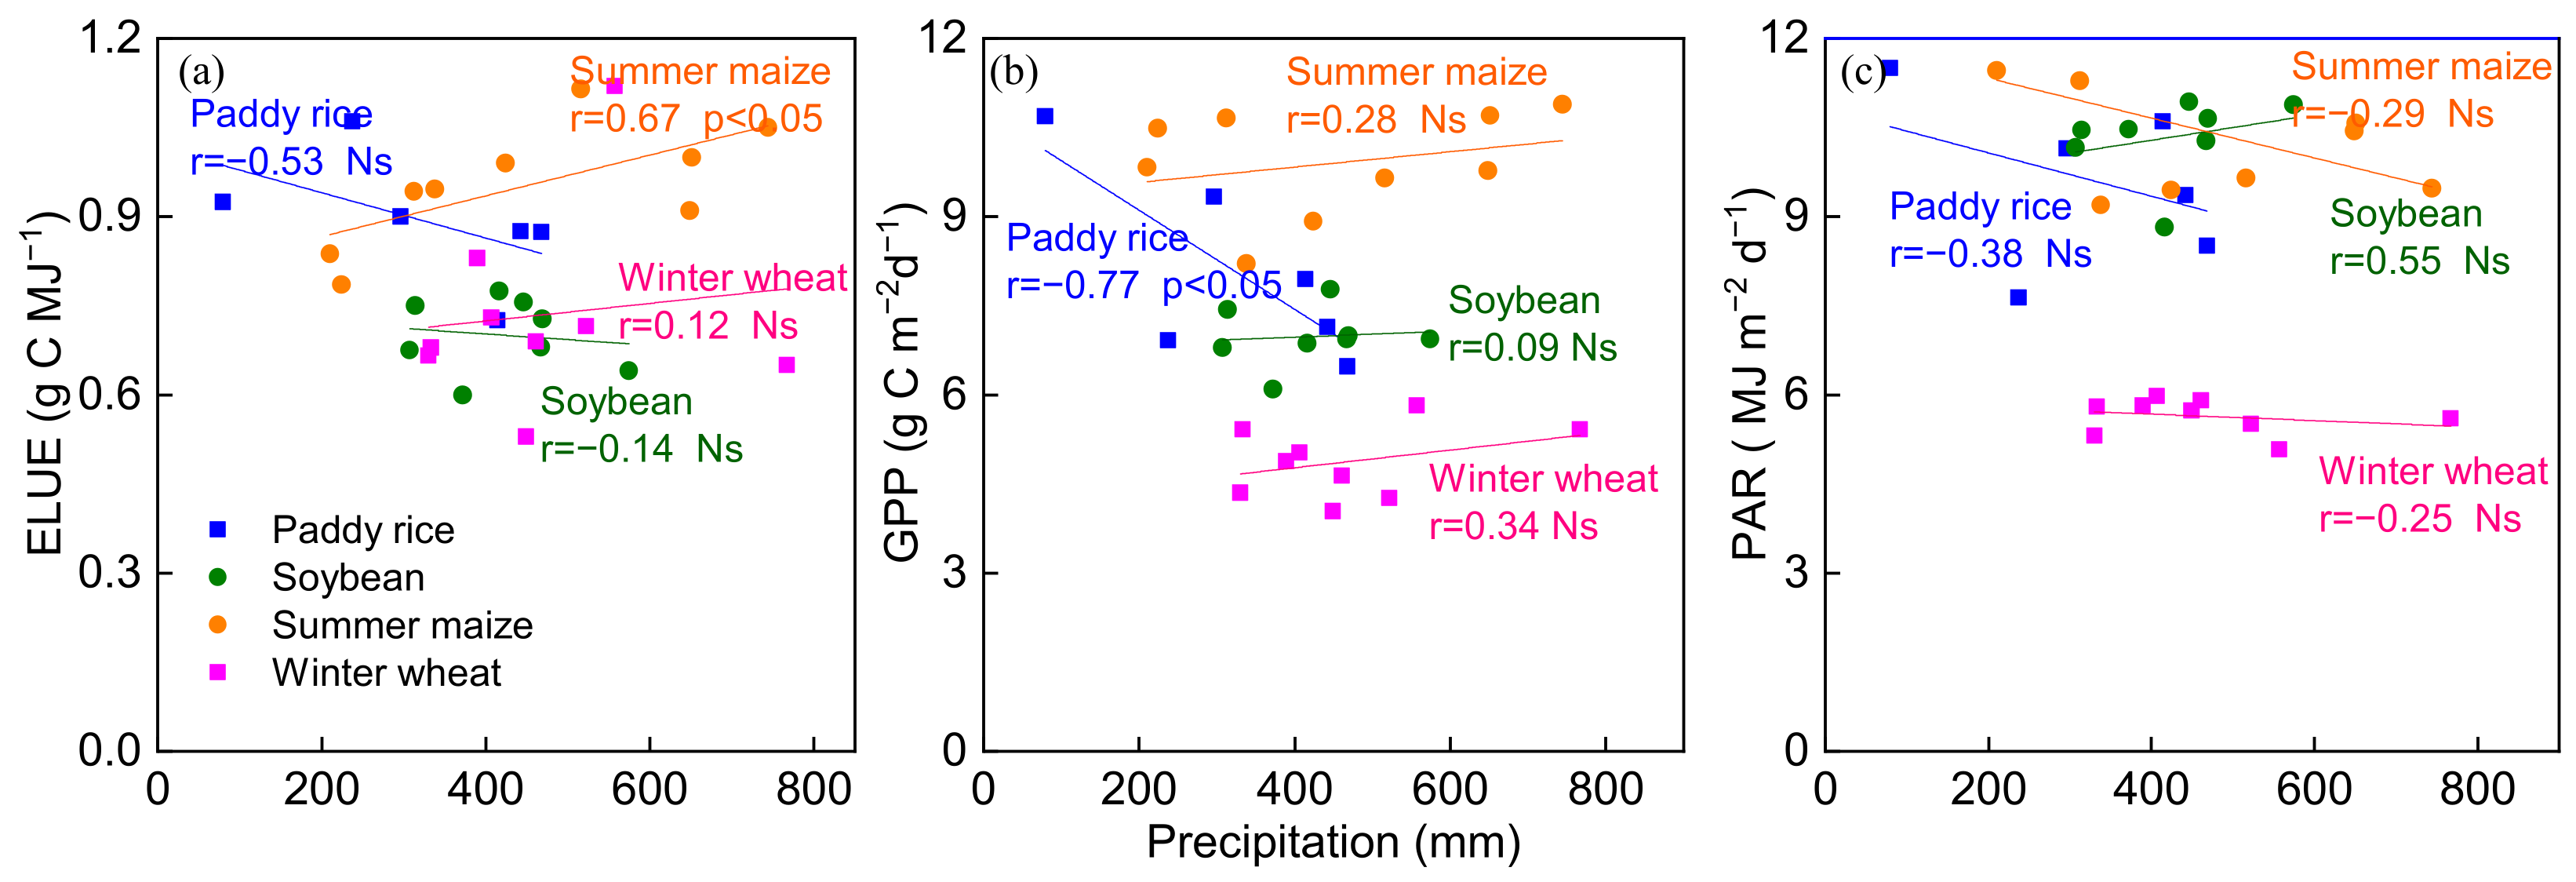
The relationship between ELUE, GPP, PAR and total precipitation during the crop-growing season was investigated (Figure 7). An upward trend was found between ELUE and precipitation in summer maize and winter wheat, while a downward trend was found in paddy rice and soybean sites (Figure 7a). GPP significantly decreased with increasing total precipitation in paddy rice (r = 0.77, p < 0.05), while GPP increased with increasing total precipitation in the other three agroecosystems (Figure 7b). Increasing precipitation was thought to reduce VPD, which increases GPP by enhancing gc [74]. Therefore, ELUE rises when precipitation increases and VPD decreases. However, the negative relationship between GPP and precipitation was found in paddy rice in the current study, which was contrary to the other three agroecosystems as well as previously published reports on arid and semiarid regions [75]. Presumably because the effect of precipitation on soil water content (SWC) was weak in long-term flooded paddy rice croplands, more precipitation may indicate additional clouds and the downward trend of PAR; therefore, vegetation photosynthesis may be restricted due to the lack of PAR [7,76,77].
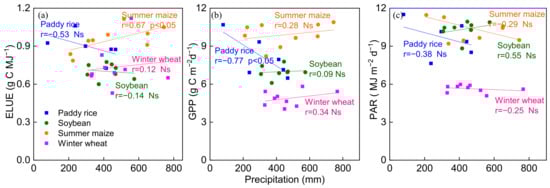
Figure 7.
Relationships between the total precipitation and (a) ecosystem light use efficiency (ELUE), (b) gross primarily productivity (GPP) and (c) photosynthetic active radiation (PAR) during the crop growing season at the four agroecosystems. Ns represents that the trend is not significant.
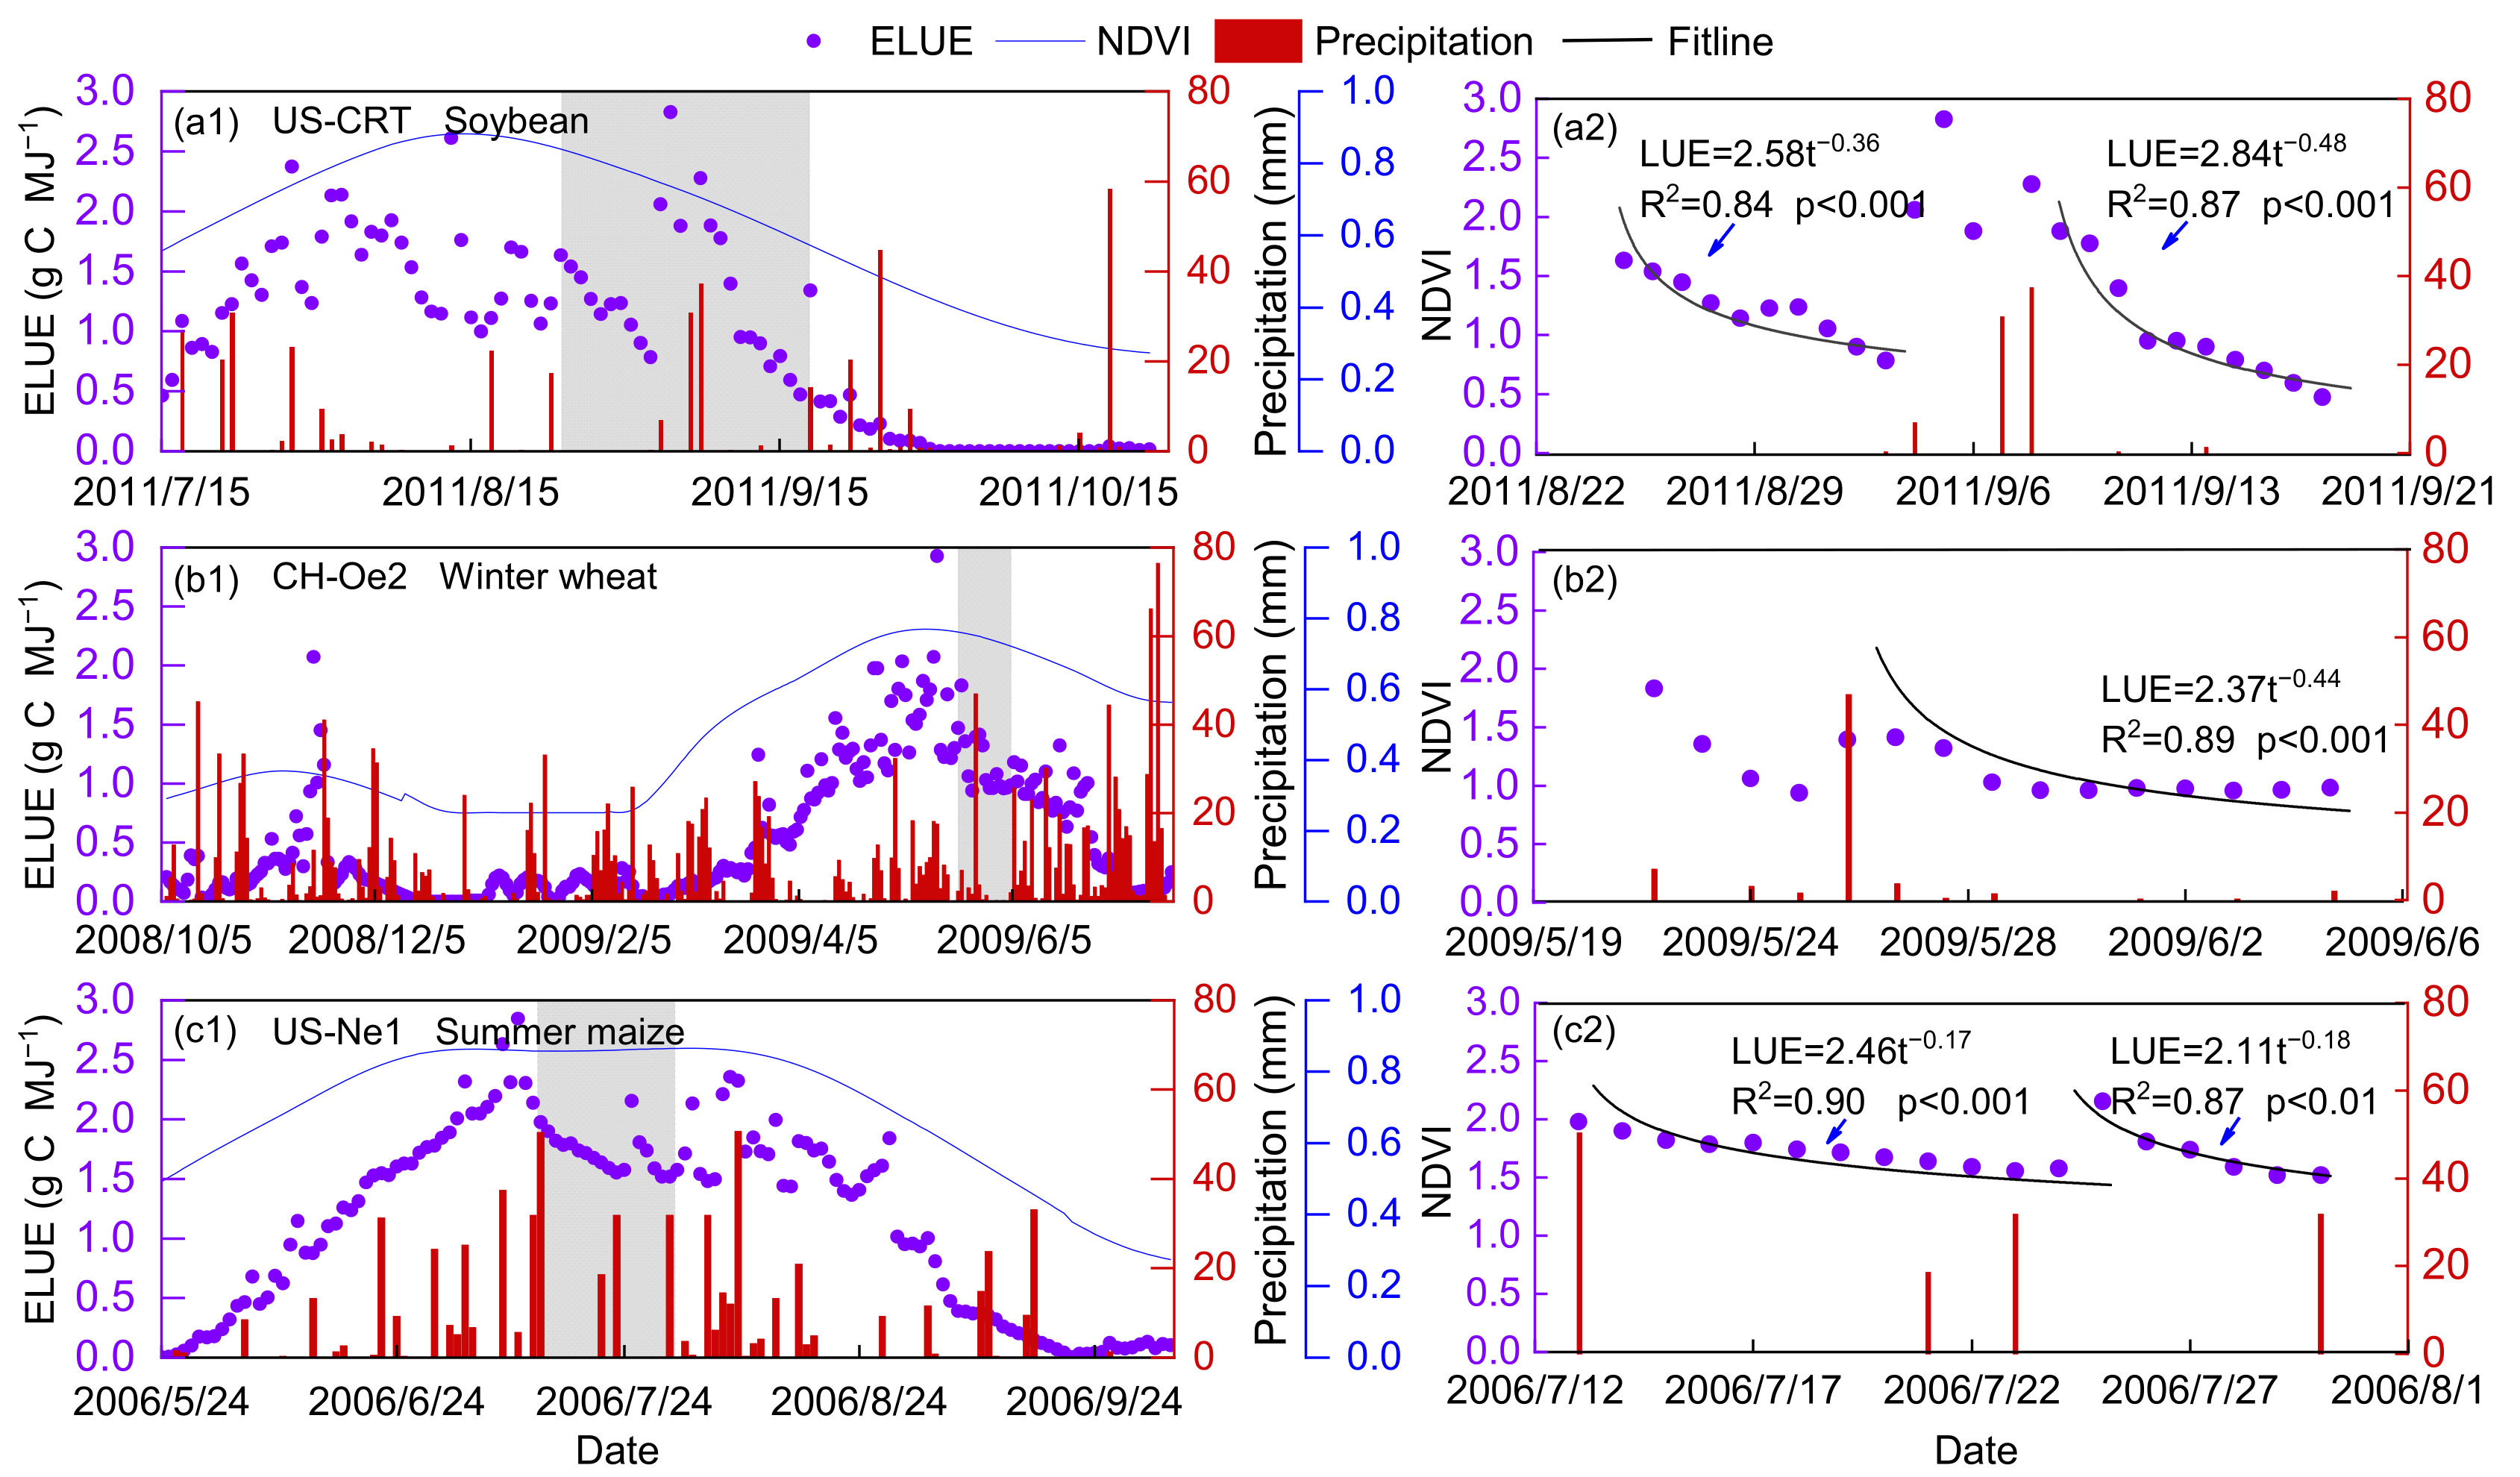
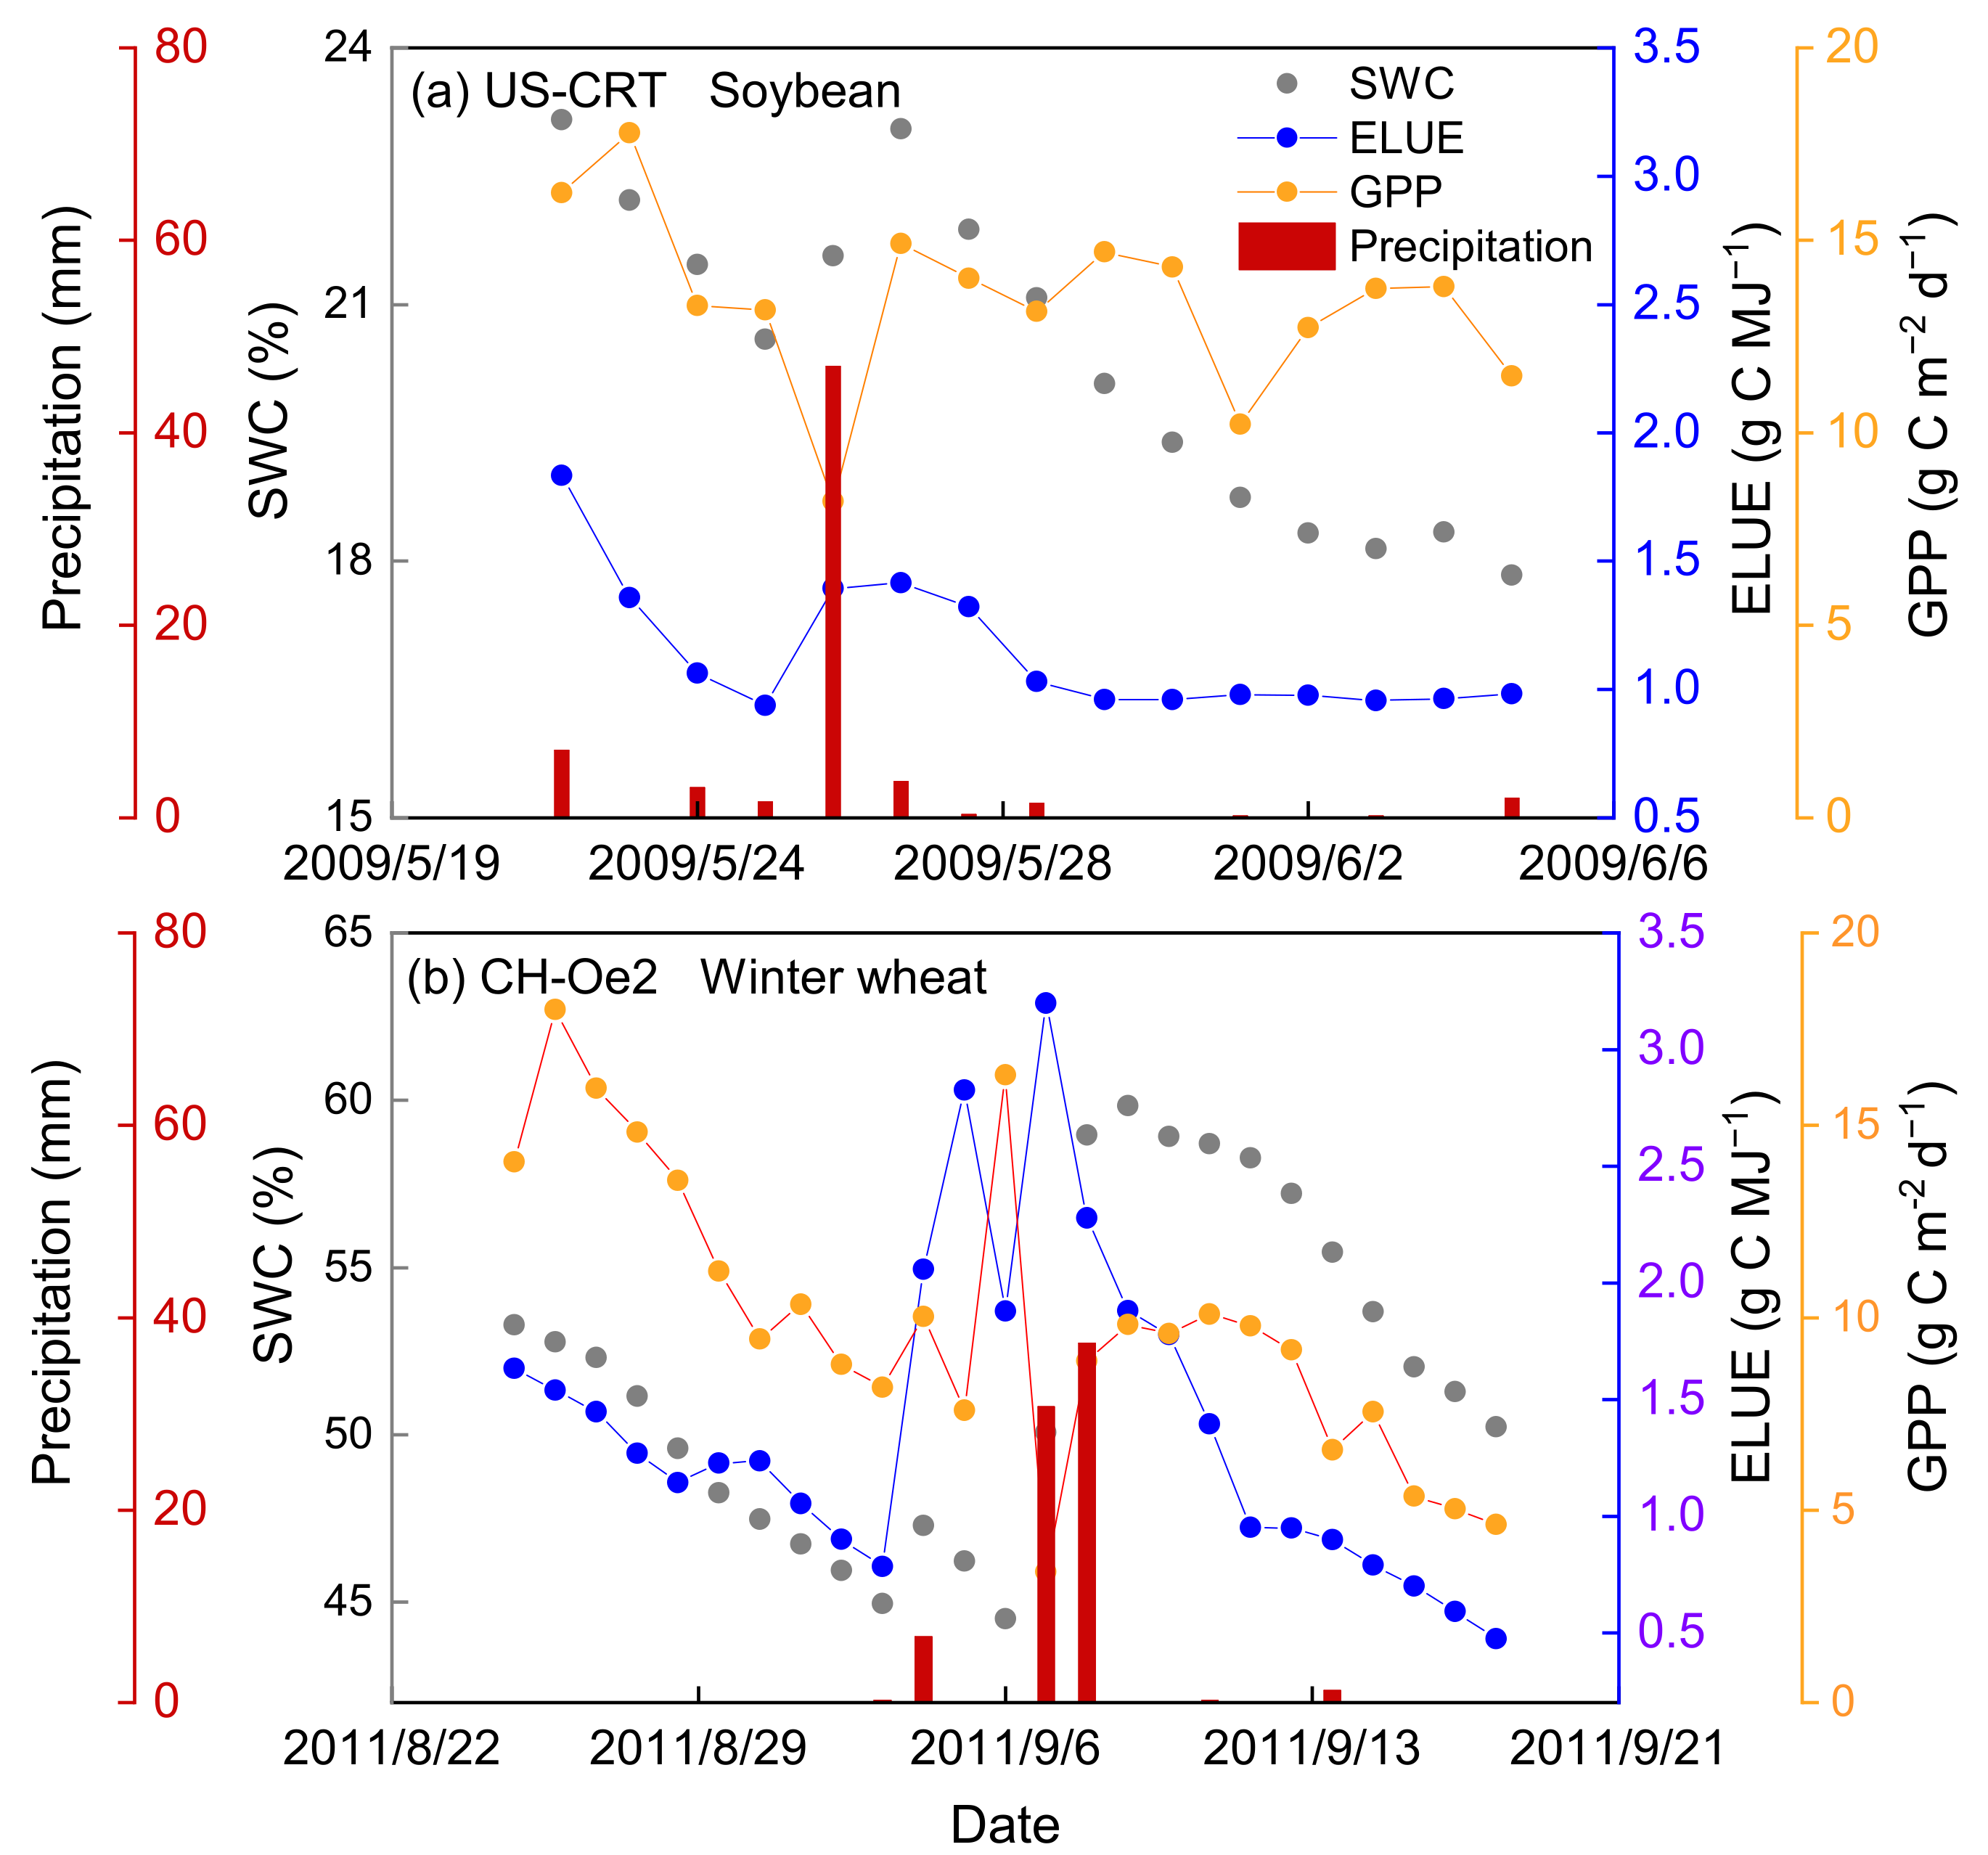
The effect of precipitation on the temporal variations of ELUE was analyzed, and only the data during the active growing season was considered to exclude the effects of growth phenology changes on ELUE. Figure 8 shows that ELUE increased sharply, which may be caused by the decline in PAR when there is rainfall during cloudy conditions, since then ELUE gradually decreased. These results are the first evidence showing that the ELUE variation trend is approximately proportional to the square root of inverse time after a precipitation event; a low and relatively steady ELUE was found during a long period without precipitation or irrigation, reflecting the fact that a soil water deficit will suppress ELUE due to declining GPP (Figure 9). The effect of precipitation on ELUE is mainly in the way of replenishing soil moisture content. The relationship between SWC and ELUE was simple and coherent, exhibiting a trend in which ELUE increased with increasing SWC during the active growing season. Previous studies have concluded water stress will reduce the carbon exchange between the ecosystem and atmosphere physiologically as a result of the combination of stomatal, mesophyll conductance and biochemical limitations [8,78,79]. Such results can provide a theoretical basis for the development of carbon flux estimation and crop yield prediction models in water-limited environments.
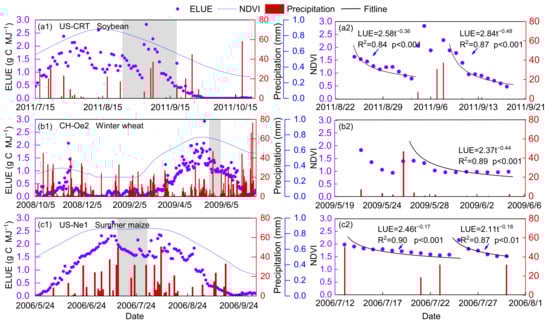
Figure 8.
The seasonal variation of ecosystem light use efficiency (ELUE) at a representative site of soybean (a1,a2) (US-CRT), (b1,b2) winter wheat (CH-Oe2) and (c1,c2) summer maize (US-Ne1). Series 2 is an enlarged part of the gray shade of Series 1. Bar plots show precipitation. The equations inserted in Series 2 show the ELUE variation with the number of days after a certain precipitation event.
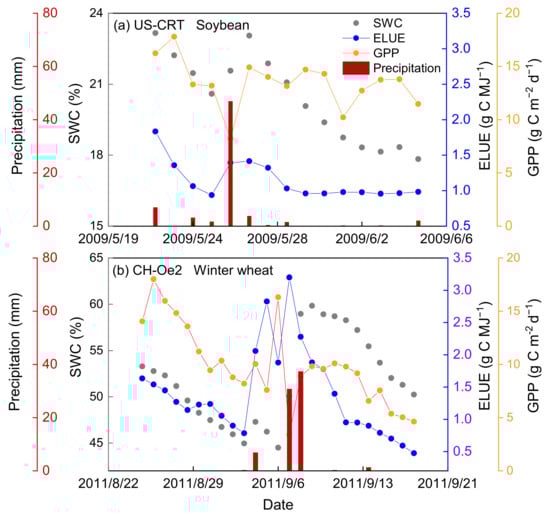
Figure 9.
The variation of soil water content (SWC), ecosystem light use efficiency (ELUE) and gross primary production (GPP) after precipitation at a representative (a) soybean site (US-CRT) and (b) winter wheat site (CH-Oe2).
3.3. Comparison of Relative Effects of Critical Factors on ELUE by Path Analysis
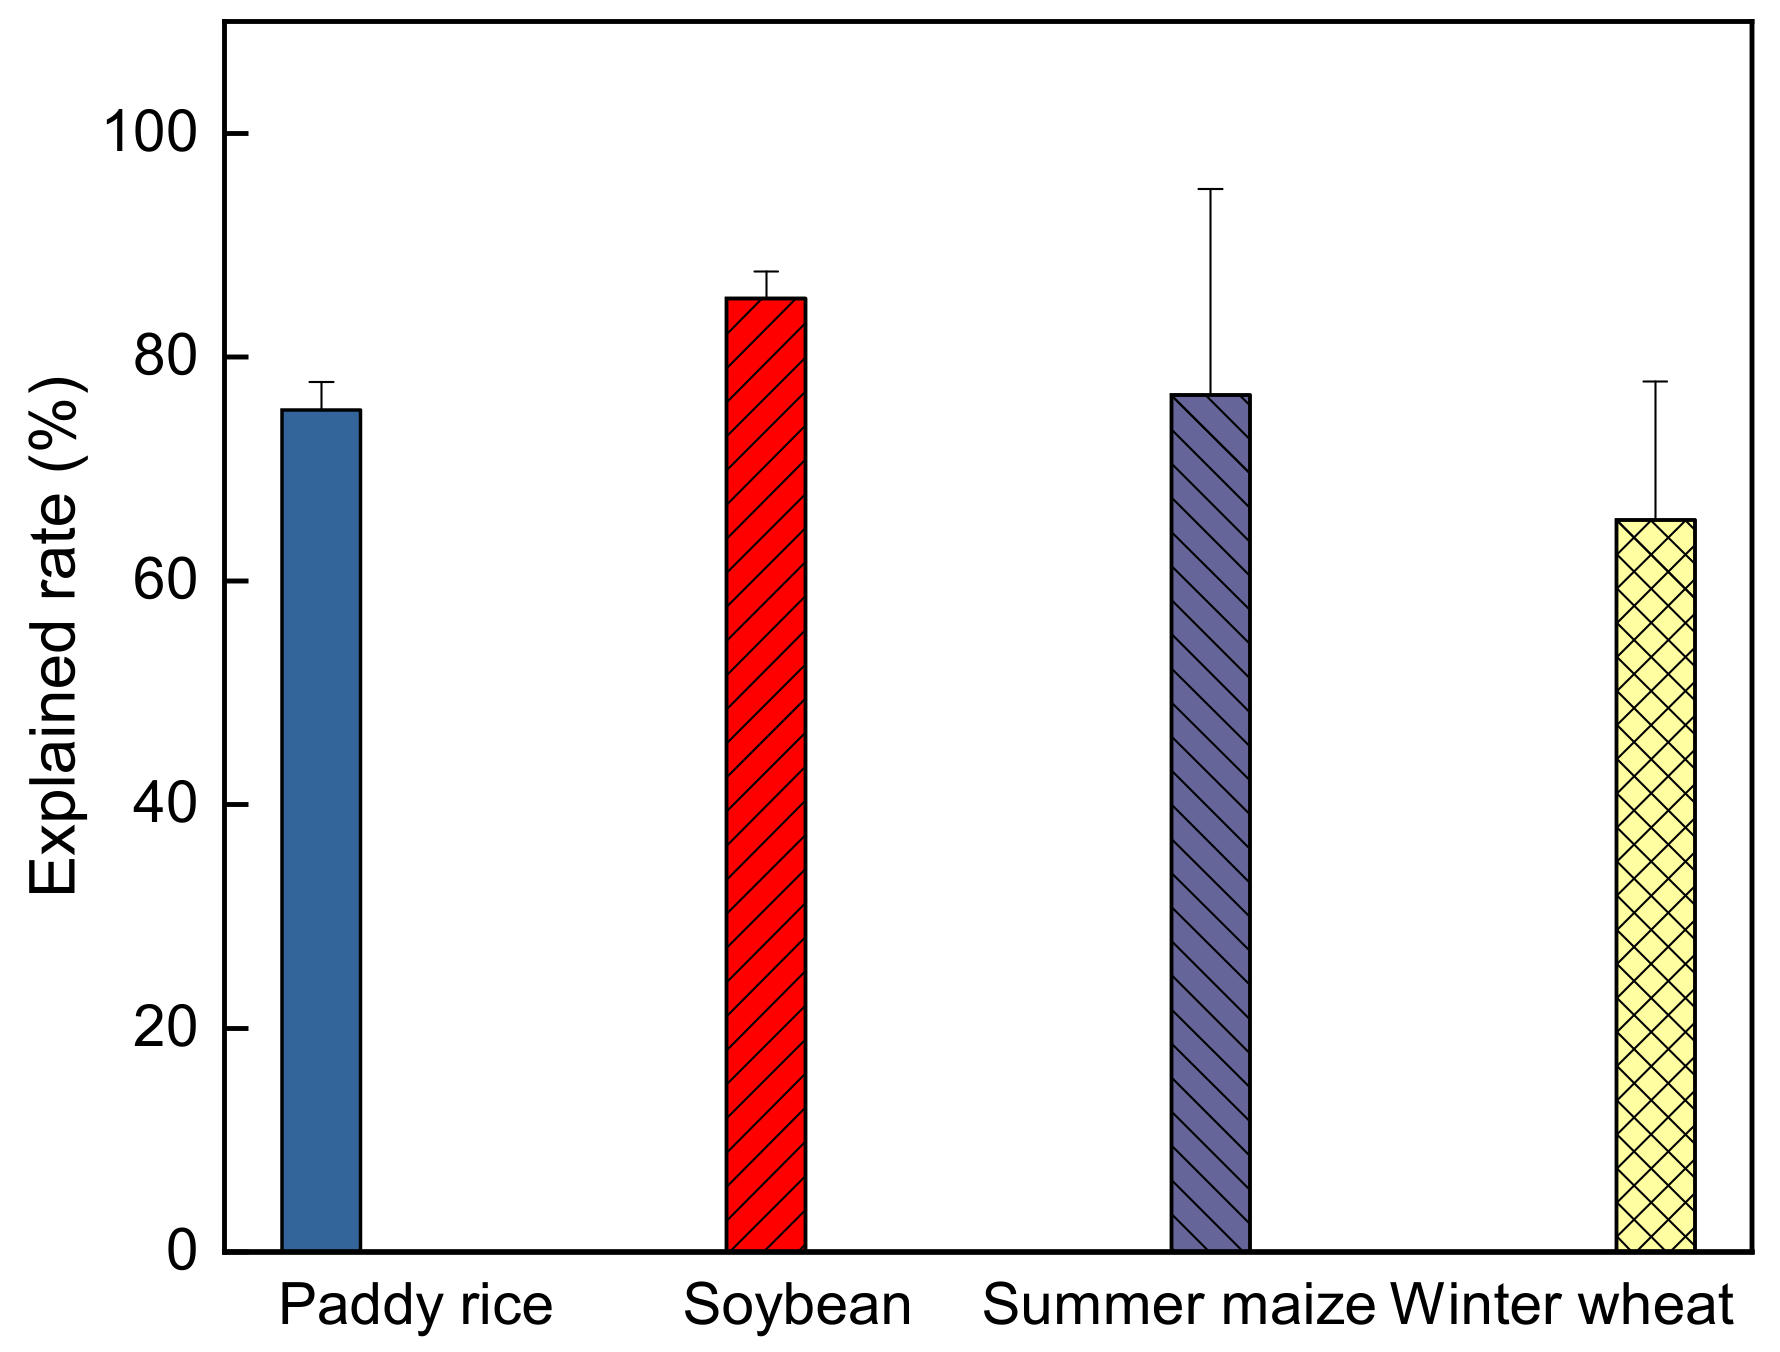
The path analysis showed that the controlling variables considered in this study can account for 73.7%, 85.3%, 75.3% and 65.5% of the total ELUE variation (Figure 10), while relative effects of unconsidered variables on ELUE (i.e., nutrition content in soil/leaf, CO2 concentration, etc.) still accounted for 26.3%, 14.7%, 24.7% and 34.5% in the rice, soybean, maize and winter wheat fields, respectively.

Figure 10.
The explanation rate of the variables on crop ecosystem light use efficiency based on path analysis.
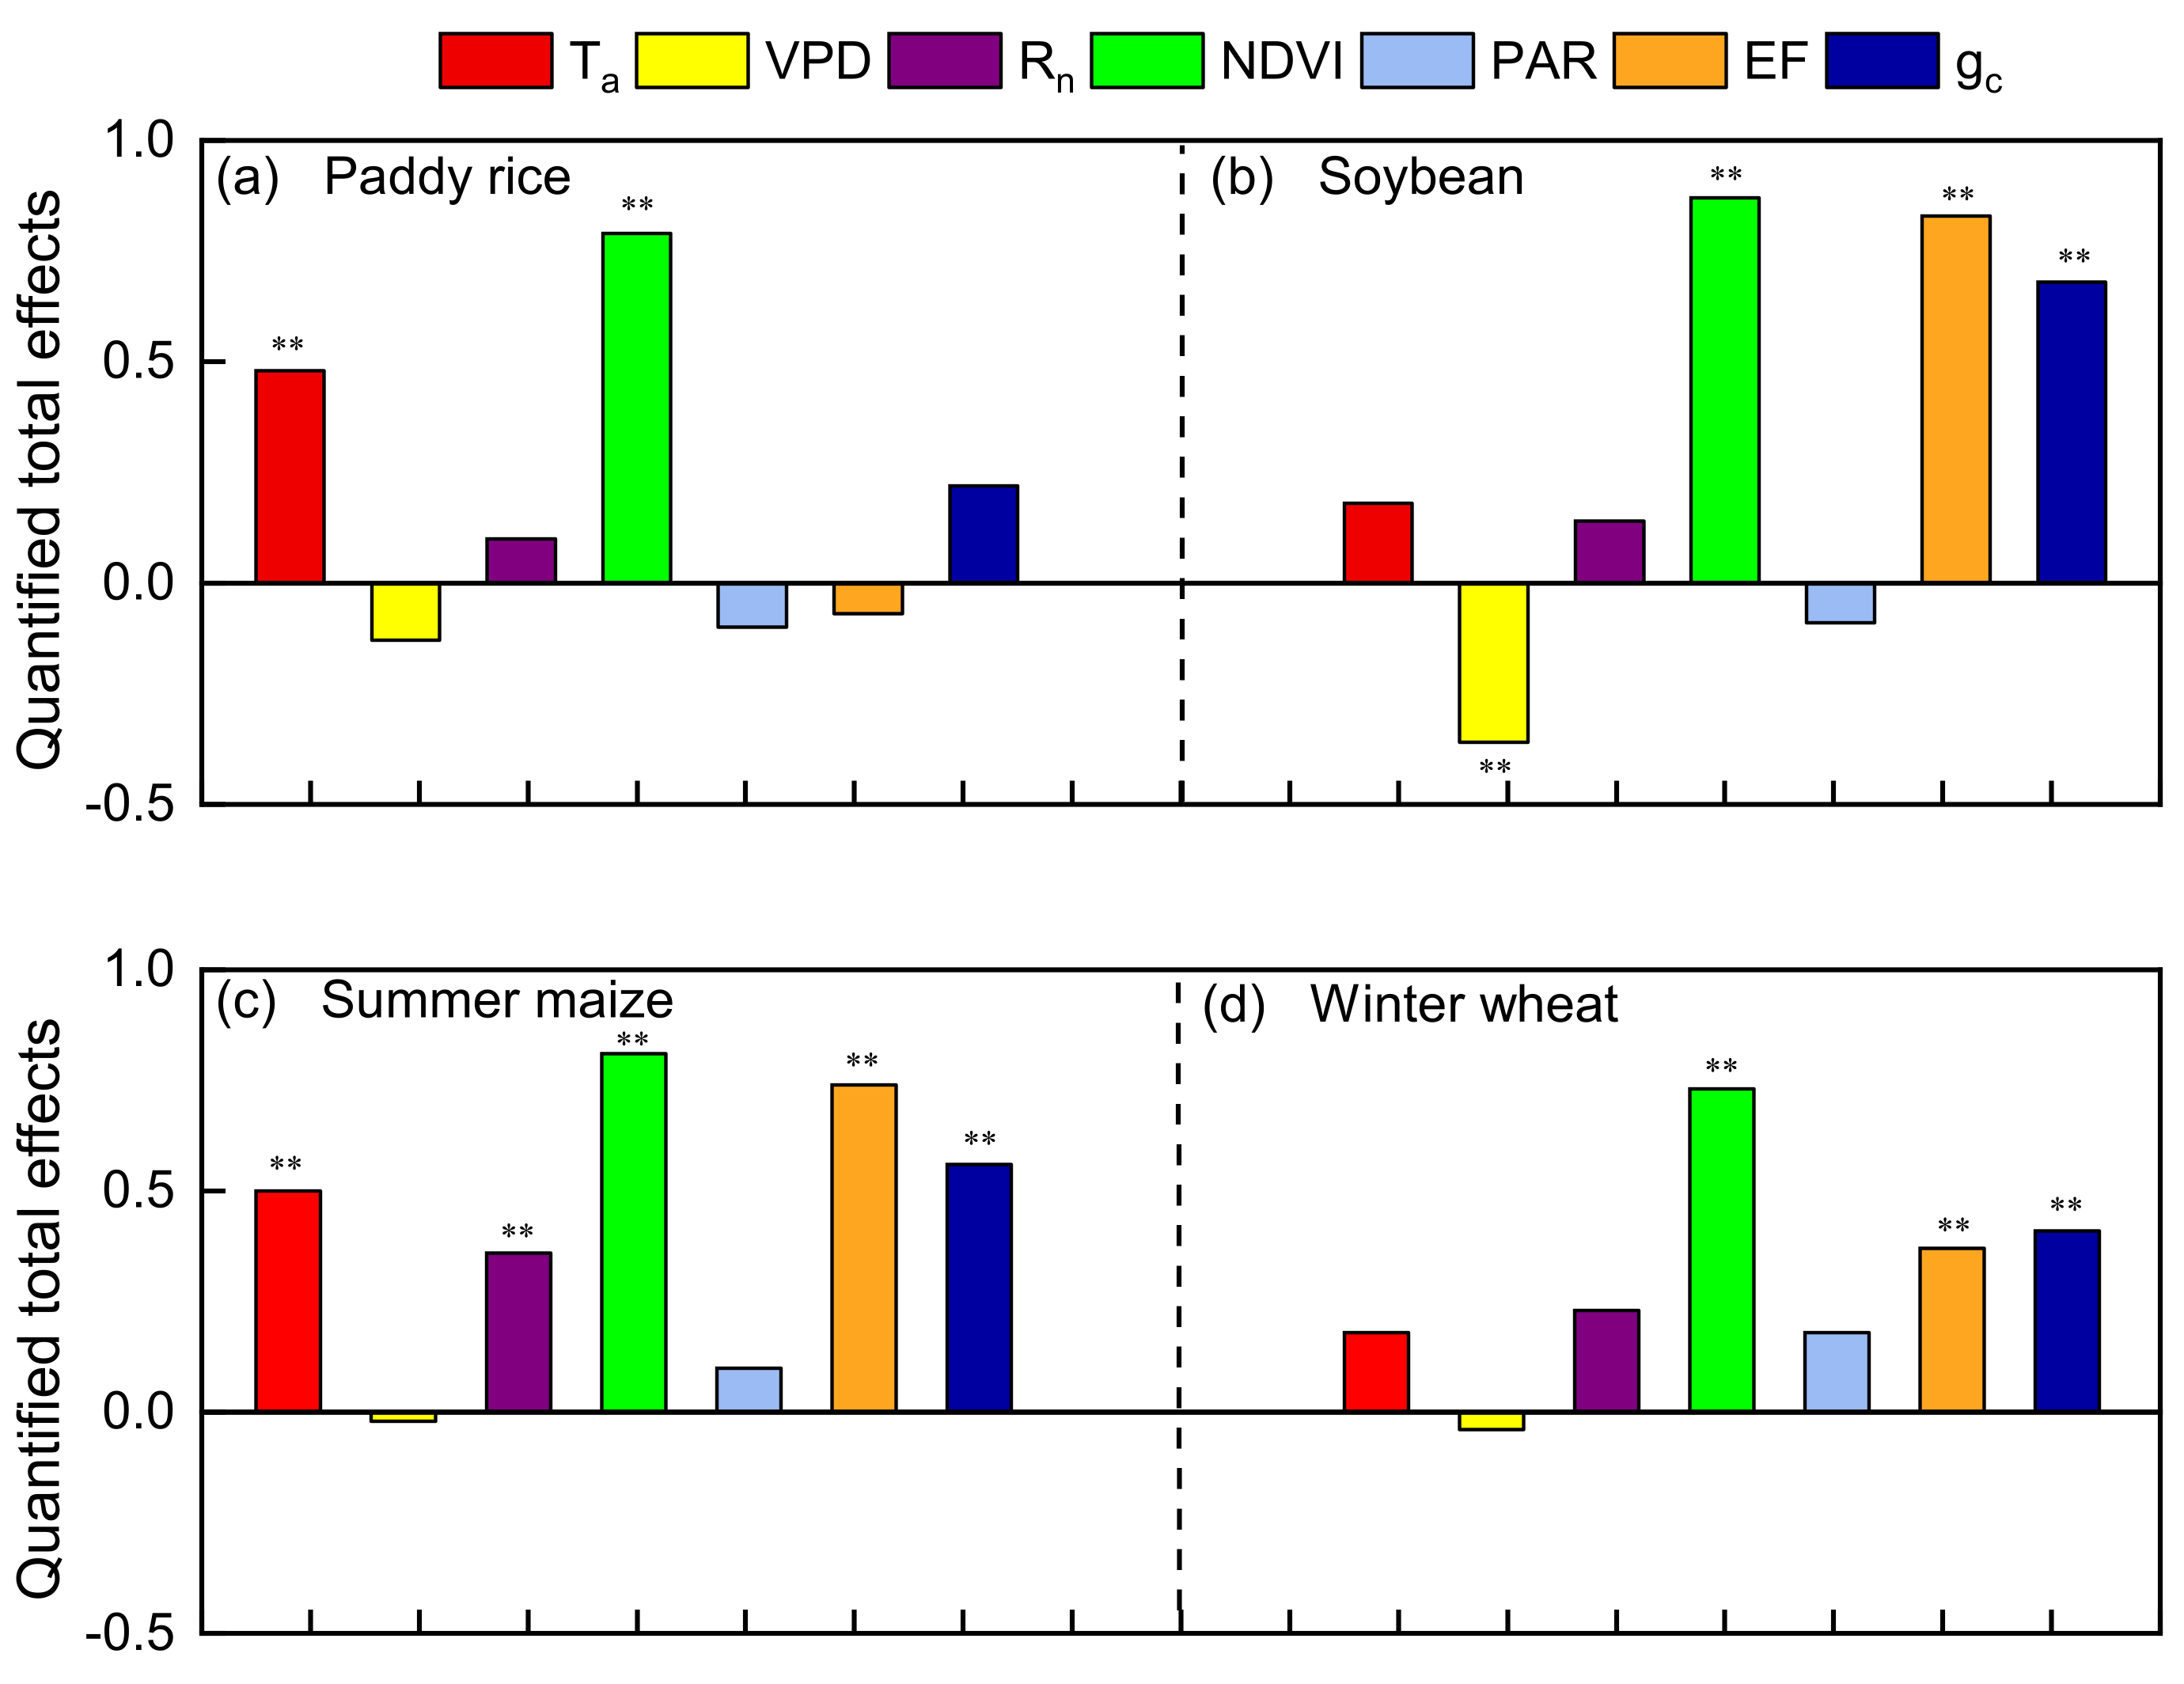
The quantified standardized total effects of the controlling variables on ELUE in four agroecosystems are shown in Figure 11. NDVI is the most critical controlling variables for ELUE in all the fields. Previous researchers also demonstrated that ELUE variation patterns were mainly determined by vegetation index (LAI, NDVI, EVI etc.) [4,7]. Campoe et al. (2013) reported that the seasonal variations of GPP were mainly exerted by LAI on carbon assimilation [80]. Analysis done by a process-based model also showed that vegetation indices had significant positive effects on GPP [81], as canopy development can influence the biophysical properties of vegetation, carbon and the absorption of energy as discussed in Section 3.2.1 [59,82,83].

Figure 11.
The standardized total effects of the controlling variables on ELUE. Rn, PAR, Ta, VPD, NDVI, gc and EF are net radiation, photosynthetically active radiation, air temperature, normalization difference vegetation index, canopy conductance and evaporation fraction, respectively. ** represents significant level p < 0.01.
In addition to NDVI, there was one variable (Ta) in the rice fields, three variables (EF, gc, and VPD) in the soybean fields, four variables (EF, gc, Ta and Rn) in the maize fields and two variables (EF and gc) in the wheat fields that significantly affected ELUE (p < 0.01, Figure 11). Crop growth sometimes suffered adverse environmental conditions, such as high Ta, low water availability, etc. Ta was generally considered as an essential driver of GPP when analyzing biomes and increasing importance in the coldest and energy-limited areas [7,84]. Therefore, the warming climate may increase GPP and ELUE in an energy-limited area. However, we found that the total effects of EF on ELUE were higher than that of Ta among the typical crops, except for paddy rice, which indicated that water availability was more important than Ta in controlling agroecosystem ELUE. A similar conclusion was also found in the Mediterranean environment, where water stress significantly affected ELUE inter-annual variations, while Ta marginally affected ELUE [85]. Our analysis supports the idea that ELUE is constrained by water availability more than temperature at the typical crop sites, except for paddy rice. Water availability affects nearly all aspects of plant growth and most physiological processes. Meanwhile, the stress response depends on intensity, rate, duration and the stage of plant growth [7,71,73]. Plants close their stomates, and thereby lower gc, to prevent further water loss by transpiration in the early drought stages [86]. Consequently, the supply of CO2 for the carboxylation through stomatal is reduced and thereof GPP. Studies also demonstrated the decrease in APAR was likely caused by photoprotective mechanisms such as changes in leaf inclination/leaf rolling as the cumulative deficit on soil water [10,87]. However, the long-term effect of soil water deficit on canopy assimilation is a limitation in canopy structure development (i.e., LAI, NDVI), even shortening the growing season, and thus reduces the seasonal cumulative ecosystem productivity and the consequent ELUE [88]. However, those effects of water stress seldom or never occurred in long-term flooded paddy rice croplands. Therefore, Ta might exert more effect on ELUE than water availability in paddy rice.
4. Conclusions
Based on the 35 site-years CO2 flux measurements from 11 cropland sites globally, we investigated the variation characteristics of multi-timescales ELUE as well as the effects of the environmental factors (i.e., Ta, Rn, PAR, EF, VPD, and P) and vegetation physiological factors (i.e., NDVI, gc) on ELUE variation across the four typical agroecosystems that are widespread on earth, including paddy rice, soybean, maize and winter wheat. Specifically, a trough of hourly ELUE was found across the four typical agroecosystems. The variability in daily ELUE exhibited apparent seasonal dynamics with crop growth, and the summer maize croplands possessed a higher ELUE than the other three C3 agroecosystems. The crop-specific variation is in control of ELUE; overall, the variations in ELUE and GPP were positively related to the variations of NDVI, EF (except for that in paddy rice croplands), gc, Ta and Rn, while the opposite relationship was found with VPD. No significant consistent relationship was found between total growing season precipitation and ELUE or GPP. The ELUE variation trend is approximately proportional to the square root of inverse time after a precipitation event across the different crop sites. The results showed that NDVI is the most confident estimator for ELUE in the four ecosystems. Water availability plays a secondary role controlling ELUE, and vegetation productivity is more constrained by water availability than Ta in summer maize, soybean and winter wheat. This study improves our understanding of the influence of bio-physiology and environmental factors on ELUE.
Author Contributions
S.J., F.C. and N.C. conceived and designed the study. M.L. and Y.H. made substantial contributions to the acquisition, analysis and interpretation of the data. N.C. and Y.W. wrote the first draft of the article. F.C., X.H., M.L., S.J. and D.G. reviewed and edited the draft. F.C., revised the article according to the opinions of the reviewer and completed the proofreading work. All authors have read and agreed to the published version of the manuscript.
Funding
This research was funded by the National Natural Science Foundation of China, grant number “51922072”, “51779161”, “51009101” and the Fundamental Research Funds for the Central Universities, grant number “2017CDLZ-N22”, “2018CDPZH-10”, “2019CDPZH-10”, “2019CDLZ-10”.
Institutional Review Board Statement
Not applicable.
Informed Consent Statement
Not applicable.
Data Availability Statement
Publicly available datasets were analyzed in this study. This data can be found here: [The Fluxnet 2015 Dataset (http://fluxnet.fluxdata.org/data/fluxnet2015-dataset/); The MODIS 16-day NDVI was downloaded from MODIS 13Q1, https://modis.ornl.gov/data.html] (accessed on 1 November 2021).
Acknowledgments
This work used eddy covariance data acquired by the FLUXNET community and in particular by the following networks: AmeriFlux (U.S. Department of Energy, Biological and Environmental Research, Terrestrial Carbon Program (DE-FG02-04ER63917 and DE-FG02-04ER63911)), AsiaFlux, CarboEuropeIP, CarboItaly, Fluxnet-Canada (supported by CFCAS, NSERC, BIOCAP, Environment Canada, and NRCan). The FLUXNET eddy covariance data processing and harmonization was carried out by the European Fluxes Database Cluster, AmeriFlux Management Project, and Fluxdata project of FLUXNET, with the support of CDIAC and ICOS Ecosystem Thematic Center, and the OzFlux, ChinaFlux, and AsiaFlux offices. We are also grateful for the Distributed Archive Center of Oak Ridge National Laboratory and the Earth Observing System Data for making MODIS data available. We would like to thank all scientists and technicians maintaining the flux site management and providing crop information. We thank the two anonymous reviewers for their constructive and insightful comments on our manuscript.
Conflicts of Interest
The authors declare no conflict of interest.
Nomenclature
| ELUE | Ecosystem light use efficiency (g C MJ−1) |
| GPP | Gross primary productivity (g C m−2 d−1) |
| NEE | Net ecosystem exchange of CO2 (g C m−2 d−1) |
| ER | Ecosystem respiration (g C m−2 d−1) |
| Ta | Air temperature (°C) |
| NDVI | Normalized difference vegetation index (dimensionless) |
| gc | Canopy conductance (mm s−1) |
| EF | evaporative fraction (dimensionless) |
| VPD | Vapor water deficit (hPa) |
| Rg | Downward shortwave radiation (W m−2) |
| PAR | Photosynthetically active radiation (W m−2) |
| Rn | Net solar radiation (W m−2) |
| LE | Latent heat flux (W m−2) |
| H | Sensible heat flux (W m−2) |
| RH | Relative humidity (%) |
| VPD | Vapor pressure deficit (hpa) |
| γ | Psychrometric constant (0.066 kPa °C−1) |
| Δ | Slope of saturation vapor pressure curve at Ta (kPa °C−1) |
| ρa | Air density (kg m−3) |
| cp | Air specific heat capacity (J kg−1 K−1) |
| ga | Aerodynamic conductance (m s−1) |
| u* | Faction velocity (m s−1) |
References
- Ruimy, A.; Kergoat, L.; Bondeau, A. Comparing global models of terrestrial net primary productivity (NPP): Analysis of differences in light absorption and light-use efficiency. Glob. Chang. Biol. 1999, 5, 56–64. [Google Scholar] [CrossRef] [Green Version]
- Ruiz, R.A.; Bertero, H.D. Light interception and radiation use efficiency in temperate quinoa (Chenopodium quinoa Willd.) cultivars. Eur. J. Agron. 2008, 29, 144–152. [Google Scholar] [CrossRef]
- Kukal, M.S.; Irmak, S. Evidence of arithmetical uncertainty in estimation of light and water use effciency. Sustainability 2020, 12, 2271. [Google Scholar] [CrossRef] [Green Version]
- Kattge, J.; Knorr, W.; Raddatz, T.; Wirth, C. Quantifying photosynthetic capacity and its relationship to leaf nitrogen content for global-scale terrestrial biosphere models. Glob. Chang. Biol. 2009, 15, 976–991. [Google Scholar] [CrossRef]
- Gao, Y.; Yu, G.; Yan, H.; Zhu, X.; Li, S.; Wang, Q.; Zhang, J.; Wang, Y.; Li, Y.; Zhao, L.; et al. A MODIS-based Photosynthetic Capacity Model to estimate gross primary production in Northern China and the Tibetan Plateau. Remote Sens. Environ. 2014, 148, 108–118. [Google Scholar] [CrossRef]
- Zhao, M.; Running, S.W. Drought-induced reduction in global terrestrial net primary production from 2000 through 2009. Science 2010, 329, 940–943. [Google Scholar] [CrossRef] [PubMed] [Green Version]
- Garbulsky, M.F.; Peñuelas, J.; Papale, D.; Ardö, J.; Goulden, M.L.; Kiely, G.; Richardson, A.D.; Rotenberg, E.; Veenendaal, E.M.; Filella, I. Patterns and controls of the variability of radiation use efficiency and primary productivity across terrestrial ecosystems. Glob. Ecol. Biogeogr. 2010, 19, 253–267. [Google Scholar] [CrossRef]
- Williams, C.A.; Albertson, J.D. Soil moisture controls on canopy-scale water and carbon fluxes in an African savanna. Water Resour. Res. 2004, 40, 1–14. [Google Scholar] [CrossRef] [Green Version]
- Li, T.; Kromdijk, J.; Heuvelink, E.; van Noort, F.R.; Kaiser, E.; Marcelis, L.F.M. Effects of diffuse light on radiation use efficiency of two Anthurium cultivars depend on the response of stomatal conductance to dynamic light intensity. Front. Plant Sci. 2016, 7, 1–10. [Google Scholar] [CrossRef] [Green Version]
- Gitelson, A.A.; Peng, Y.; Arkebauer, T.J.; Schepers, J. Relationships between gross primary production, green LAI, and canopy chlorophyll content in maize: Implications for remote sensing of primary production. Remote Sens. Environ. 2014, 144, 65–72. [Google Scholar] [CrossRef]
- Medlyn, B.E. Physiological basis of the light use efficiency model. Tree Physiol. 1998, 18, 167–176. [Google Scholar] [CrossRef]
- Baldocchi, D.; Knox, S.; Dronova, I.; Verfaillie, J.; Oikawa, P.; Sturtevant, C.; Matthes, J.H.; Detto, M. The impact of expanding flooded land area on the annual evaporation of rice. Agric. For. Meteorol. 2016, 223, 181–193. [Google Scholar] [CrossRef] [Green Version]
- Stocker, B.D.; Zscheischler, J.; Keenan, T.F.; Prentice, I.C.; Peñuelas, J.; Seneviratne, S.I. Quantifying soil moisture impacts on light use efficiency across biomes. New Phytol. 2018, 218, 1430–1449. [Google Scholar] [CrossRef] [Green Version]
- Gitelson, A.A.; Peng, Y.; Huemmrich, K.F. Relationship between fraction of radiation absorbed by photosynthesizing maize and soybean canopies and NDVI from remotely sensed data taken at close range and from MODIS 250m resolution data. Remote Sens. Environ. 2014, 147, 108–120. [Google Scholar] [CrossRef] [Green Version]
- Cheng, M.; Jin, J.; Jiang, H. Strong impacts of autumn phenology on grassland ecosystem water use efficiency on the Tibetan Plateau. Ecol. Indic. 2021, 126, 107682. [Google Scholar] [CrossRef]
- Alton, P.B.; North, P.R.; Los, S.O. The impact of diffuse sunlight on canopy light-use efficiency, gross photosynthetic product and net ecosystem exchange in three forest biomes. Glob. Chang. Biol. 2007, 13, 776–787. [Google Scholar] [CrossRef]
- Niu, S.; Wu, M.; Han, Y.; Xia, J.; Li, L.; Wan, S. Water-mediated responses of ecosystem carbon fluxes to climatic change in a temperate steppe. New Phytol. 2008, 177, 209–219. [Google Scholar] [CrossRef]
- Law, B.E.; Falge, E.; Gu, L.; Baldocchi, D.D.; Bakwin, P.; Berbigier, P.; Davis, K.; Dolman, A.J.; Falk, M.; Fuentes, J.D.; et al. Environmental controls over carbon dioxide and water vapor exchange of terrestrial vegetation. Agric. For. Meteorol. 2002, 113, 97–120. [Google Scholar] [CrossRef] [Green Version]
- Wright, S. Correlation and causation. J. Agric. Food Res. 1921, 20, 557–585. [Google Scholar]
- Xing, X.; Liu, Y.; Zhao, W.; Kang, D.; Yu, M.; Ma, X. Determination of dominant weather parameters on reference evapotranspiration by path analysis theory. Comput. Electron. Agric. 2016, 120, 10–16. [Google Scholar] [CrossRef]
- Fei, X.H.; Song, Q.H.; Zhang, Y.P.; Yu, G.R.; Zhang, L.M.; Sha, L.Q.; Liu, Y.T.; Xu, K.; Chen, H.; Wu, C.S.; et al. Patterns and Controls of Light Use Efficiency in Four Contrasting Forest Ecosystems in Yunnan, Southwest China. J. Geophys. Res.-Biogeosci. 2019, 124, 293–311. [Google Scholar] [CrossRef]
- Jiang, S.; Liang, C.; Cui, N.; Zhao, L.; Liu, C.; Feng, Y.; Hu, X.; Gong, D.; Zou, Q. Water use efficiency and its drivers in four typical agroecosystems based on flux tower measurements. Agric. For. Meteorol. 2020, 295. [Google Scholar] [CrossRef]
- Heinsch, F.A.; Zhao, M.; Running, S.W.; Kimball, J.S.; Nemani, R.R.; Davis, K.J.; Bolstad, P.V.; Cook, B.D.; Desai, A.R.; Ricciuto, D.M.; et al. Evaluation of remote sensing based terrestrial productivity from MODIS using regional tower eddy flux network observations. IEEE Trans. Geosci. Remote Sens. 2006, 44, 1908–1923. [Google Scholar] [CrossRef] [Green Version]
- Wang, T.; Tang, X.; Zheng, C.; Gu, Q.; Wei, J.; Ma, M. Differences in ecosystem water-use efficiency among the typical croplands. Agric. Water Manag. 2018, 209, 142–150. [Google Scholar] [CrossRef]
- Falge, E.; Baldocchi, D.; Olson, R.; Anthoni, P.; Aubinet, M.; Bernhofer, C.; Burba, G.; Ceulemans, R.; Clement, R.; Dolman, H.; et al. Gap filling strategies for defensible annual sums of net ecosystem exchange. Agric. For. Meteorol. 2001, 107, 43–69. [Google Scholar] [CrossRef] [Green Version]
- Yuan, W.; Cai, W.; Xia, J.; Chen, J.; Liu, S.; Dong, W.; Merbold, L.; Law, B.; Arain, A.; Beringer, J.; et al. Global comparison of light use efficiency models for simulating terrestrial vegetation gross primary production based on the LaThuile database. Agric. For. Meteorol. 2014, 192–193, 108–120. [Google Scholar] [CrossRef]
- Wagle, P.; Zhang, Y.; Jin, C.; Xiao, X. Comparison of solar-induced chlorophyll fluorescence, light-use efficiency, and process-based GPP models in maize. Ecol. Appl. 2016, 26, 1211–1222. [Google Scholar] [CrossRef] [PubMed] [Green Version]
- Yang, X.; Li, J.; Yu, Q.; Ma, Y.; Tong, X.; Feng, Y.; Tong, Y. Impacts of diffuse radiation fraction on light use efficiency and gross primary production of winter wheat in the North China Plain. Agric. For. Meteorol. 2019, 275, 233–242. [Google Scholar] [CrossRef]
- Lasslop, G.; Reichstein, M.; Papale, D.; Richardson, A.; Arneth, A.; Barr, A.; Stoy, P.; Wohlfahrt, G. Separation of net ecosystem exchange into assimilation and respiration using a light response curve approach: Critical issues and global evaluation. Glob. Chang. Biol. 2010, 16, 187–208. [Google Scholar] [CrossRef] [Green Version]
- Lloyd, J.; Taylor, J.A. On the Temperature Dependence of Soil Respiration. Funct. Ecol. 1994, 8, 315–323. Available online: http://www.jstor.org/stable/2389824 (accessed on 12 November 2019).
- Papale, D.; Reichstein, M.; Aubinet, M.; Canfora, E.; Bernhofer, C.; Kutsch, W.; Longdoz, B.; Rambal, S.; Valentini, R.; Vesala, T.; et al. Towards a standardized processing of Net Ecosystem Exchange measured with eddy covariance technique: Algorithms and uncertainty estimation. Biogeosciences 2006, 3, 571–583. [Google Scholar] [CrossRef] [Green Version]
- Zhu, Z.; Sun, X.; Wen, X.; Zhou, Y.; Tian, J.; Yuan, G. Study on the processing method of nighttime CO2 eddy covariance flux data in ChinaFLUX. Sci. China Ser. D Earth Sci. 2006, 49, 36–46. [Google Scholar] [CrossRef]
- Saito, M.; Miyata, A.; Nagai, H.; Yamada, T. Seasonal variation of carbon dioxide exchange in rice paddy field in Japan. Agric. For. Meteorol. 2005, 135, 93–109. [Google Scholar] [CrossRef]
- Skiba, U.; Drewer, J.; Tang, Y.S.; van Dijk, N.; Helfter, C.; Nemitz, E.; Famulari, D.; Cape, J.N.; Jones, S.K.; Twigg, M.; et al. Biosphere-atmosphere exchange of reactive nitrogen and greenhouse gases at the NitroEurope core flux measurement sites: Measurement strategy and first data sets. Agric. Ecosyst. Environ. 2009, 133, 139–149. [Google Scholar] [CrossRef]
- Suyker, A.E.; Verma, S.B. Gross primary production and ecosystem respiration of irrigated and rainfed maize-soybean cropping systems over 8 years. Agric. For. Meteorol. 2012, 165, 12–24. [Google Scholar] [CrossRef] [Green Version]
- Chu, H.; Chen, J.; Gottgens, J.F.; Ouyang, Z.; John, R.; Czajkowski, K.; Becker, R. Net ecosystem methane and carbon dioxide exchanges in a Lake Erie coastal marsh and a nearby cropland. J. Geophys. Res.-Biogeosci. 2014, 119, 722–740. [Google Scholar] [CrossRef]
- Verma, S.B.; Dobermann, A.; Cassman, K.G.; Walters, D.T.; Knops, J.M.; Arkebauer, T.J.; Suyker, A.E.; Burba, G.G.; Amos, B.; Yang, H.; et al. Annual carbon dioxide exchange in irrigated and rainfed maize-based agroecosystems. Agric. For. Meteorol. 2005, 131, 77–96. [Google Scholar] [CrossRef] [Green Version]
- Wattenbach, M.; Sus, O.; Vuichard, N.; Lehuger, S.; Gottschalk, P.; Li, L.; Leip, A.; Williams, M.; Tomelleri, E.; Kutsch, W.L.; et al. The carbon balance of European croplands: A cross-site comparison of simulation models. Agric. Ecosyst. Environ. 2010, 139, 419–453. [Google Scholar] [CrossRef]
- Allison, V.J.; Miller, R.M.; Jastrow, J.D.; Matamala, R.; Zak, D.R. Changes in Soil Microbial Community Structure in a Tallgrass Prairie Chronosequence. Soil Sci. Soc. Am. J. 2005, 69, 1412–1421. [Google Scholar] [CrossRef] [Green Version]
- Monteith, J.L. Solar-radiation and productivity in tropical Ecosystems. J. Appl. Ecol. 1972, 9, 747–766. Available online: http://www.jstor.org/stable/ (accessed on 7 June 2017). [CrossRef] [Green Version]
- Alton, P.B. The sensitivity of models of gross primary productivity to meteorological and leaf area forcing: A comparison between a Penman-Monteith ecophysiological approach and the MODIS Light-Use Efficiency algorithm. Agric. For. Meteorol. 2016, 218–219, 11–24. [Google Scholar] [CrossRef] [Green Version]
- Boschetti, M.; Mauri, E.; Gadda, C.; Busetto, L.; Confalonieri, R.; Bocchi, S.; Brivio, P.A. Monitoring paddy rice crops through remote sensing: Productivity estimation by light use efficiency model. In Remote Sensing for Agriculture, Ecosystems, and Hydrology VI; International Society for Optics and Photonics: Bellingham, WA, USA, 2004; Volume 5568, pp. 46–56. [Google Scholar]
- Evrendilek, F.; Ben-Asher, J.; Aydin, M. Diurnal photosynthesis, water use efficiency and light use efficiency of wheat under Mediterranean field conditions. J. Environ. Biol. 2008, 29, 397–406. [Google Scholar] [PubMed]
- Evrendilek, F.; Ben-Asher, J.; Aydin, M.; Çelik, I. Spatial and temporal variations in diurnal CO2 fluxes of different Mediterranean ecosystems in Turkey. J. Environ. Monitor. 2005, 7, 151–157. [Google Scholar] [CrossRef]
- Xiao, X. Light absorption by leaf chlorophyll and maximum light use efficiency. IEEE Trans. Geosci. Remote Sens. 2006, 44, 1933–1935. [Google Scholar] [CrossRef]
- Lambrev, P.H.; Miloslavina, Y.; Jahns, P.; Holzwarth, A.R. On the relationship between non-photochemical quenching and photoprotection of Photosystem II. Biochim. Biophys. Acta-Bioenerg. 2012, 1817, 760–769. [Google Scholar] [CrossRef] [Green Version]
- van Amerongen, H.; Chmeliov, J. Instantaneous switching between different modes of non-photochemical quenching in plants. Consequences for increasing biomass production. Biochim. Biophys. Acta-Bioenerg. 2020, 1861. [Google Scholar] [CrossRef] [PubMed]
- Ventre-Lespiaucq, A.; Flanagan, N.S.; Ospina-Calderón, N.H.; Delgado, J.A.; Escudero, A. Midday depression vs. Midday peak in diurnal light interception: Contrasting patterns at crown and leaf scales in a tropical evergreen tree. Front. Plant Sci. 2018, 9, 1–10. [Google Scholar] [CrossRef] [Green Version]
- Du, X.; Li, Q.; Dong, T.; Jia, K. Winter wheat biomass estimation using high temporal and spatial resolution satellite data combined with a light use efficiency model. Geocarto Int. 2015, 30, 258–269. [Google Scholar] [CrossRef]
- Gitelson, A.A.; Arkebauer, T.J.; Suyker, A.E. Convergence of daily light use efficiency in irrigated and rainfed C3 and C4 crops. Remote Sens. Environ. 2018, 217, 30–37. [Google Scholar] [CrossRef]
- Liu, L.; Guan, L.; Liu, X. Directly estimating diurnal changes in GPP for C3 and C4 crops using far-red sun-induced chlorophyll fluorescence. Agric. For. Meteorol. 2017, 232, 1–9. [Google Scholar] [CrossRef]
- Xin, Q.; Broich, M.; Suyker, A.E.; Yu, L.; Gong, P. Multi-scale evaluation of light use efficiency in MODIS gross primary productivity for croplands in the Midwestern United States. Agric. For. Meteorol. 2015, 201, 111–119. [Google Scholar] [CrossRef] [Green Version]
- Yuan, W.; Cai, W.; Nguy-Robertson, A.L.; Fang, H.; Suyker, A.E.; Chen, Y.; Dong, W.; Liu, S.; Zhang, H. Uncertainty in simulating gross primary production of cropland ecosystem from satellite-based models. Agric. For. Meteorol. 2015, 207, 48–57. [Google Scholar] [CrossRef] [Green Version]
- Campoy, J.; Campos, I.; Plaza, C.; Calera, M.; Jiménez, N.; Bodas, V.; Calera, A. Water use efficiency and light use efficiency in garlic using a remote sensing-based approach. Agric. Water Manag. 2019, 219, 40–48. [Google Scholar] [CrossRef]
- Wang, S.; Zhang, L.; Huang, C.; Qiao, N. An NDVI-based vegetation phenology is improved to be more consistent with photosynthesis dynamics through applying a light use efficiency model over boreal high-latitude forests. Remote Sens. 2017, 9. [Google Scholar] [CrossRef] [Green Version]
- Wu, C.; Niu, Z.; Tang, Q.; Huang, W.; Rivard, B.; Feng, J. Remote estimation of gross primary production in wheat using chlorophyll-related vegetation indices. Agric. For. Meteorol. 2009, 149, 1015–1021. [Google Scholar] [CrossRef]
- Baležentiene, L.; Mikša, O.; Baležentis, T.; Streimikiene, D. Seasonal net carbon exchange in rotation crops in the temperate climate of central Lithuania. Sustainability 2019, 11, 1966. [Google Scholar] [CrossRef] [Green Version]
- Schubert, P.; Lund, M.; Ström, L.; Eklundh, L. Impact of nutrients on peatland GPP estimations using MODIS time series data. Remote Sens. Environ. 2010, 114, 2137–2145. [Google Scholar] [CrossRef]
- Fensholt, R.; Sandholt, I.; Rasmussen, M.S. Evaluation of MODIS LAI, fAPAR and the relation between fAPAR and NDVI in a semi-arid environment using in situ measurements. Remote Sens. Environ. 2004, 91, 490–507. [Google Scholar] [CrossRef]
- Yebra, M.; Van Dijk, A.I.J.M.; Leuning, R.; Guerschman, J.P. Global vegetation gross primary production estimation using satellite-derived light-use efficiency and canopy conductance. Remote Sens. Environ. 2015, 163, 206–216. [Google Scholar] [CrossRef] [Green Version]
- Bai, Y.; Li, X.; Zhou, S.; Yang, X.; Yu, K.; Wang, M.; Liu, S.; Wang, P.; Wu, X.; Wang, X.; et al. Quantifying plant transpiration and canopy conductance using eddy flux data: An underlying water use efficiency method. Agric. For. Meteorol. 2019, 271, 375–384. [Google Scholar] [CrossRef]
- Whitley, R.; Medlyn, B.; Zeppel, M.; Macinnis-Ng, C.; Eamus, D. Comparing the Penman-Monteith equation and a modified Jarvis-Stewart model with an artificial neural network to estimate stand-scale transpiration and canopy conductance. J. Hydrol. 2009, 373, 256–266. [Google Scholar] [CrossRef] [Green Version]
- Wei, Z.; Lee, X.; Wen, X.; Xiao, W. Evapotranspiration partitioning for three agro-ecosystems with contrasting moisture conditions: A comparison of an isotope method and a two-source model calculation. Agric. For. Meteorol. 2018, 252, 296–310. [Google Scholar] [CrossRef]
- Shuttleworth, W.J.; Wallace, J.S. Evaporation from sparse crops-an energy combination theory. Q. J. Roy. Meteor. Soc. 1985, 111, 839–855. [Google Scholar] [CrossRef]
- Wu, C.; Niu, Z. Modelling light use efficiency using vegetation index and land surface temperature from MODIS in Harvard Forest. Int. J. Remote Sens. 2012, 33, 2261–2276. [Google Scholar] [CrossRef]
- Chen, F.; Lin, A.; Zhu, H.; Niu, J. Quantifying climate change and ecological responses within the Yangtze River Basin, China. Sustainability 2018, 10, 3026. [Google Scholar] [CrossRef]
- Yamori, W.; Hikosaka, K.; Way, D.A. Temperature response of photosynthesis in C3, C4, and CAM plants: Temperature acclimation and temperature adaptation. Photosynth. Res. 2014, 119, 101–117. [Google Scholar] [CrossRef] [PubMed]
- Li, Y.; Fan, J.; Hu, Z. Comparison of carbon-use efficiency among different land-use patterns of the temperate steppe in the northern China pastoral farming ecotone. Sustainability 2018, 10. [Google Scholar] [CrossRef] [Green Version]
- Yamori, W.; Noguchi, K.; Hikosaka, K.; Terashima, I. Phenotypic plasticity in photosynthetic temperature acclimation among crop species with different cold tolerances. Plant Physiol. 2010, 152, 388–399. [Google Scholar] [CrossRef] [PubMed] [Green Version]
- Yuan, W.; Zheng, Y.; Piao, S.; Ciais, P.; Lombardozzi, D.; Wang, Y.; Ryu, Y.; Chen, G.; Dong, W.; Hu, Z.; et al. Increased atmospheric vapor pressure deficit reduces global vegetation growth. Sci. Adv. 2019, 5. [Google Scholar] [CrossRef] [Green Version]
- Zhang, Y.; Song, C.; Sun, G.; Band, L.E.; Noormets, A.; Zhang, Q. Understanding moisture stress on light use efficiency across terrestrial ecosystems based on global flux and remote-sensing data. J. Geophys. Res.-Biogeosci. 2015, 120, 2053–2066. [Google Scholar] [CrossRef]
- Leuning, R.; Cleugh, H.A.; Zegelin, S.J.; Hughes, D. Carbon and water fluxes over a temperate Eucalyptus forest and a tropical wet/dry savanna in Australia: Measurements and comparison with MODIS remote sensing estimates. Agric. For. Meteorol. 2005, 129, 151–173. [Google Scholar] [CrossRef]
- Keenan, T.; García, R.; Friend, A.D.; Zaehle, S.; Gracia, C.; Sabate, S. Improved understanding of drought controls on seasonal variation in mediterranean forest canopy CO2 and water fluxes through combined in situ measurements and ecosystem modelling. Biogeosciences 2009, 6, 1423–1444. [Google Scholar] [CrossRef] [Green Version]
- Beer, C.; Ciais, P.; Reichstein, M.; Baldocchi, D.; Law, B.E.; Papale, D.; Soussana, J.F.; Ammann, C.; Buchmann, N.; Frank, D.; et al. Temporal and among-site variability of inherent water use efficiency at the ecosystem level. Glob. Biogeochem. Cycles 2009, 23, 1–13. [Google Scholar] [CrossRef]
- Kanniah, K.D.; Beringer, J.; Hutley, L.B. Response of savanna gross primary productivity to interannual variability in rainfall: Results of a remote sensing based light use efficiency model. Prog. Phys. Geog. 2013, 37, 642–663. [Google Scholar] [CrossRef]
- Campoe, O.C.; Stape, J.L.; Albaugh, T.J.; Lee Allen, H.; Fox, T.R.; Rubilar, R.; Binkley, D. Fertilization and irrigation effects on tree level aboveground net primary production, light interception and light use efficiency in a loblolly pine plantation. For. Ecol. Manag. 2013, 288, 43–48. [Google Scholar] [CrossRef]
- Mishra, A.K.; Tripathi, P.; Pal, R.K.; Mishra, S.R. Light interception and radiation use efficiency of wheat varieties as influenced by number of irrigations. J. Agrometeorol. 2009, 11, 140–143. [Google Scholar]
- Camargo, D.C.; Montoya, F.; Moreno, M.A.; Ortega, J.F.; Córcoles, J.I. Impact of water deficit on light interception, radiation use efficiency and leaf area index in a potato crop (Solanum tuberosum L.). J. Agric. Sci. 2016, 154, 662–673. [Google Scholar] [CrossRef]
- Konings, A.G.; Gentine, P. Global variations in ecosystem-scale isohydricity. Glob. Chang. Biol. 2017, 23, 891–905. [Google Scholar] [CrossRef] [PubMed]
- Hu, Z.; Yu, G.; Fu, Y.; Sun, X.; Li, Y.; Shi, P.; Wang, Y.; Zheng, Z. Effects of vegetation control on ecosystem water use efficiency within and among four grassland ecosystems in China. Glob. Chang. Biol. 2008, 14, 1609–1619. [Google Scholar] [CrossRef]
- Puma, M.J.; Koster, R.D.; Cook, B.I. Phenological versus meteorological controls on land-atmosphere water and carbon fluxes. J. Geophys. Res.-Biogeosci. 2013, 118, 14–29. [Google Scholar] [CrossRef]
- Zhang, Y.; Yu, Q.; Jiang, J.; Tang, Y. Calibration of Terra/MODIS gross primary production over an irrigated cropland on the North China Plain and an alpine meadow on the Tibetan Plateau. Glob. Chang. Biol. 2008, 14, 757–767. [Google Scholar] [CrossRef]
- Zhang, Q.; Chen, W. Ecosystem Water Use Efficiency in the Three-North Region of China Based on Long-Term Satellite Data. Sustainability 2021, 13, 7977. [Google Scholar] [CrossRef]
- McCallum, I.; Franklin, O.; Moltchanova, E.; Merbold, L.; Schmullius, C.; Shvidenko, A.; Schepaschenko, D.; Fritz, S. Improved light and temperature responses for light-use-efficiency-based GPP models. Biogeosciences 2013, 10, 6577–6590. [Google Scholar] [CrossRef] [Green Version]
- Moreno, A.; Maselli, F.; Gilabert, M.A.; Chiesi, M.; Martínez, B.; Seufert, G. Assessment of MODIS imagery to track light-use efficiency in a water-limited Mediterranean pine forest. Remote Sens. Environ. 2012, 123, 359–367. [Google Scholar] [CrossRef]
- Reddy, T.Y.; Reddy, V.R.; Anbumozhi, V. Physiological responses of groundnut (Arachis hypogaea L.) to drought stress and its amelioration: A review. Plant Growth Regul. 2003, 41, 75–88. [Google Scholar] [CrossRef]
- Schull, M.A.; Anderson, M.C.; Houborg, R.; Gitelson, A.; Kustas, W.P. Thermal-based modeling of coupled carbon, water, and energy fluxes using nominal light use efficiencies constrained by leaf chlorophyll observations. Biogeosciences 2015, 12, 1511–1523. [Google Scholar] [CrossRef] [Green Version]
- Liu, Q.; Fu, Y.H.; Zhu, Z.; Liu, Y.; Liu, Z.; Huang, M.; Janssens, I.A.; Piao, S. Delayed autumn phenology in the Northern Hemisphere is related to change in both climate and spring phenology. Glob. Chang. Biol. 2016, 22, 3702–3711. [Google Scholar] [CrossRef]


Publisher’s Note: MDPI stays neutral with regard to jurisdictional claims in published maps and institutional affiliations. |
© 2021 by the authors. Licensee MDPI, Basel, Switzerland. This article is an open access article distributed under the terms and conditions of the Creative Commons Attribution (CC BY) license (https://creativecommons.org/licenses/by/4.0/).